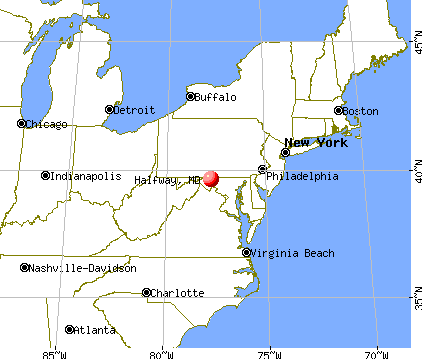
Halfway, Maryland Submit your own pictures of this place and show them to the world
OSM Map
General Map
Google Map
MSN Map
OSM Map
General Map
Google Map
MSN Map
OSM Map
General Map
Google Map
MSN Map
OSM Map
General Map
Google Map
MSN Map
Please wait while loading the map...
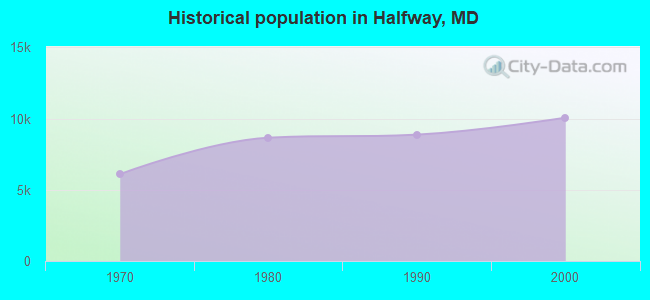
Population in 2010: 10,701. Population change since 2000: +6.3%Males: 5,074 Females: 5,627
March 2022 cost of living index in Halfway: 133.0 (high, U.S. average is 100) Percentage of residents living in poverty in 2022: 9.2%for White Non-Hispanic residents , 40.0% for Black residents , 38.4% for Hispanic or Latino residents , 79.6% for American Indian residents , 13.8% for two or more races residents )Business Search - 14 Million verified businesses
Data:
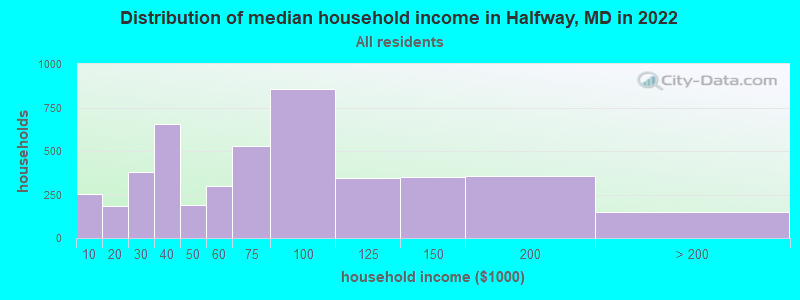
Median household income ($)
Median household income (% change since 2000)
Household income diversity
Ratio of average income to average house value (%)
Ratio of average income to average rent
Median household income ($) - White
Median household income ($) - Black or African American
Median household income ($) - Asian
Median household income ($) - Hispanic or Latino
Median household income ($) - American Indian and Alaska Native
Median household income ($) - Multirace
Median household income ($) - Other Race
Median household income for houses/condos with a mortgage ($)
Median household income for apartments without a mortgage ($)
Races - White alone (%)
Races - White alone (% change since 2000)
Races - Black alone (%)
Races - Black alone (% change since 2000)
Races - American Indian alone (%)
Races - American Indian alone (% change since 2000)
Races - Asian alone (%)
Races - Asian alone (% change since 2000)
Races - Hispanic (%)
Races - Hispanic (% change since 2000)
Races - Native Hawaiian and Other Pacific Islander alone (%)
Races - Native Hawaiian and Other Pacific Islander alone (% change since 2000)
Races - Two or more races (%)
Races - Two or more races (% change since 2000)
Races - Other race alone (%)
Races - Other race alone (% change since 2000)
Racial diversity
Unemployment (%)
Unemployment (% change since 2000)
Unemployment (%) - White
Unemployment (%) - Black or African American
Unemployment (%) - Asian
Unemployment (%) - Hispanic or Latino
Unemployment (%) - American Indian and Alaska Native
Unemployment (%) - Multirace
Unemployment (%) - Other Race
Population density (people per square mile)
Population - Males (%)
Population - Females (%)
Population - Males (%) - White
Population - Males (%) - Black or African American
Population - Males (%) - Asian
Population - Males (%) - Hispanic or Latino
Population - Males (%) - American Indian and Alaska Native
Population - Males (%) - Multirace
Population - Males (%) - Other Race
Population - Females (%) - White
Population - Females (%) - Black or African American
Population - Females (%) - Asian
Population - Females (%) - Hispanic or Latino
Population - Females (%) - American Indian and Alaska Native
Population - Females (%) - Multirace
Population - Females (%) - Other Race
Coronavirus confirmed cases (Jun 16, 2024)
Deaths caused by coronavirus (Jun 16, 2024)
Coronavirus confirmed cases (per 100k population) (Jun 16, 2024)
Deaths caused by coronavirus (per 100k population) (Jun 16, 2024)
Daily increase in number of cases (Jun 16, 2024)
Weekly increase in number of cases (Jun 16, 2024)
Cases doubled (in days) (Jun 16, 2024)
Hospitalized patients (Apr 18, 2022)
Negative test results (Apr 18, 2022)
Total test results (Apr 18, 2022)
COVID Vaccine doses distributed (per 100k population) (Sep 19, 2023)
COVID Vaccine doses administered (per 100k population) (Sep 19, 2023)
COVID Vaccine doses distributed (Sep 19, 2023)
COVID Vaccine doses administered (Sep 19, 2023)
Likely homosexual households (%)
Likely homosexual households (% change since 2000)
Likely homosexual households - Lesbian couples (%)
Likely homosexual households - Lesbian couples (% change since 2000)
Likely homosexual households - Gay men (%)
Likely homosexual households - Gay men (% change since 2000)
Cost of living index
Median gross rent ($)
Median contract rent ($)
Median monthly housing costs ($)
Median house or condo value ($)
Median house or condo value ($ change since 2000)
Mean house or condo value by units in structure - 1, detached ($)
Mean house or condo value by units in structure - 1, attached ($)
Mean house or condo value by units in structure - 2 ($)
Mean house or condo value by units in structure by units in structure - 3 or 4 ($)
Mean house or condo value by units in structure - 5 or more ($)
Mean house or condo value by units in structure - Boat, RV, van, etc. ($)
Mean house or condo value by units in structure - Mobile home ($)
Median house or condo value ($) - White
Median house or condo value ($) - Black or African American
Median house or condo value ($) - Asian
Median house or condo value ($) - Hispanic or Latino
Median house or condo value ($) - American Indian and Alaska Native
Median house or condo value ($) - Multirace
Median house or condo value ($) - Other Race
Median resident age
Resident age diversity
Median resident age - Males
Median resident age - Females
Median resident age - White
Median resident age - Black or African American
Median resident age - Asian
Median resident age - Hispanic or Latino
Median resident age - American Indian and Alaska Native
Median resident age - Multirace
Median resident age - Other Race
Median resident age - Males - White
Median resident age - Males - Black or African American
Median resident age - Males - Asian
Median resident age - Males - Hispanic or Latino
Median resident age - Males - American Indian and Alaska Native
Median resident age - Males - Multirace
Median resident age - Males - Other Race
Median resident age - Females - White
Median resident age - Females - Black or African American
Median resident age - Females - Asian
Median resident age - Females - Hispanic or Latino
Median resident age - Females - American Indian and Alaska Native
Median resident age - Females - Multirace
Median resident age - Females - Other Race
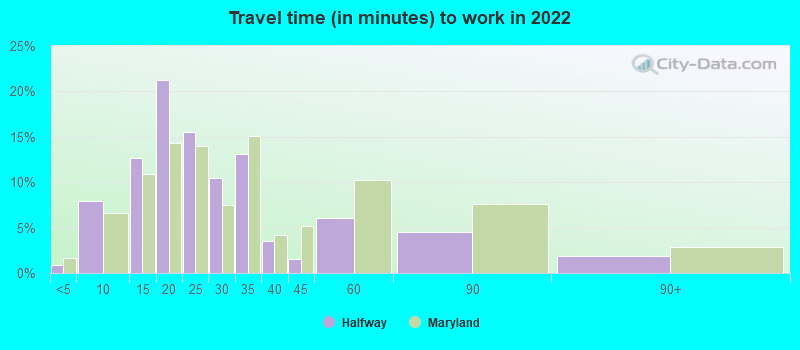
Commute - mean travel time to work (minutes)
Travel time to work - Less than 5 minutes (%)
Travel time to work - Less than 5 minutes (% change since 2000)
Travel time to work - 5 to 9 minutes (%)
Travel time to work - 5 to 9 minutes (% change since 2000)
Travel time to work - 10 to 19 minutes (%)
Travel time to work - 10 to 19 minutes (% change since 2000)
Travel time to work - 20 to 29 minutes (%)
Travel time to work - 20 to 29 minutes (% change since 2000)
Travel time to work - 30 to 39 minutes (%)
Travel time to work - 30 to 39 minutes (% change since 2000)
Travel time to work - 40 to 59 minutes (%)
Travel time to work - 40 to 59 minutes (% change since 2000)
Travel time to work - 60 to 89 minutes (%)
Travel time to work - 60 to 89 minutes (% change since 2000)
Travel time to work - 90 or more minutes (%)
Travel time to work - 90 or more minutes (% change since 2000)
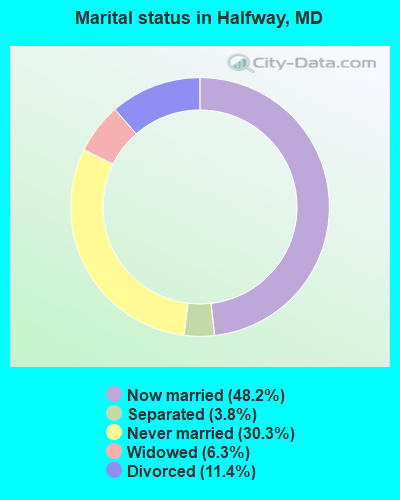
Marital status - Never married (%)
Marital status - Now married (%)
Marital status - Separated (%)
Marital status - Widowed (%)
Marital status - Divorced (%)
Median family income ($)
Median family income (% change since 2000)
Median non-family income ($)
Median non-family income (% change since 2000)
Median per capita income ($)
Median per capita income (% change since 2000)
Median family income ($) - White
Median family income ($) - Black or African American
Median family income ($) - Asian
Median family income ($) - Hispanic or Latino
Median family income ($) - American Indian and Alaska Native
Median family income ($) - Multirace
Median family income ($) - Other Race
Median year house/condo built
Median year apartment built
Year house built - Built 2005 or later (%)
Year house built - Built 2000 to 2004 (%)
Year house built - Built 1990 to 1999 (%)
Year house built - Built 1980 to 1989 (%)
Year house built - Built 1970 to 1979 (%)
Year house built - Built 1960 to 1969 (%)
Year house built - Built 1950 to 1959 (%)
Year house built - Built 1940 to 1949 (%)
Year house built - Built 1939 or earlier (%)
Average household size
Household density (households per square mile)
Average household size - White
Average household size - Black or African American
Average household size - Asian
Average household size - Hispanic or Latino
Average household size - American Indian and Alaska Native
Average household size - Multirace
Average household size - Other Race
Occupied housing units (%)
Vacant housing units (%)
Owner occupied housing units (%)
Renter occupied housing units (%)
Vacancy status - For rent (%)
Vacancy status - For sale only (%)
Vacancy status - Rented or sold, not occupied (%)
Vacancy status - For seasonal, recreational, or occasional use (%)
Vacancy status - For migrant workers (%)
Vacancy status - Other vacant (%)
Residents with income below the poverty level (%)
Residents with income below 50% of the poverty level (%)
Children below poverty level (%)
Poor families by family type - Married-couple family (%)
Poor families by family type - Male, no wife present (%)
Poor families by family type - Female, no husband present (%)
Poverty status for native-born residents (%)
Poverty status for foreign-born residents (%)
Poverty among high school graduates not in families (%)
Poverty among people who did not graduate high school not in families (%)
Residents with income below the poverty level (%) - White
Residents with income below the poverty level (%) - Black or African American
Residents with income below the poverty level (%) - Asian
Residents with income below the poverty level (%) - Hispanic or Latino
Residents with income below the poverty level (%) - American Indian and Alaska Native
Residents with income below the poverty level (%) - Multirace
Residents with income below the poverty level (%) - Other Race
Air pollution - Air Quality Index (AQI)
Air pollution - CO
Air pollution - NO2
Air pollution - SO2
Air pollution - Ozone
Air pollution - PM10
Air pollution - PM25
Air pollution - Pb
Crime - Murders per 100,000 population
Crime - Rapes per 100,000 population
Crime - Robberies per 100,000 population
Crime - Assaults per 100,000 population
Crime - Burglaries per 100,000 population
Crime - Thefts per 100,000 population
Crime - Auto thefts per 100,000 population
Crime - Arson per 100,000 population
Crime - City-data.com crime index
Crime - Violent crime index
Crime - Property crime index
Crime - Murders per 100,000 population (5 year average)
Crime - Rapes per 100,000 population (5 year average)
Crime - Robberies per 100,000 population (5 year average)
Crime - Assaults per 100,000 population (5 year average)
Crime - Burglaries per 100,000 population (5 year average)
Crime - Thefts per 100,000 population (5 year average)
Crime - Auto thefts per 100,000 population (5 year average)
Crime - Arson per 100,000 population (5 year average)
Crime - City-data.com crime index (5 year average)
Crime - Violent crime index (5 year average)
Crime - Property crime index (5 year average)
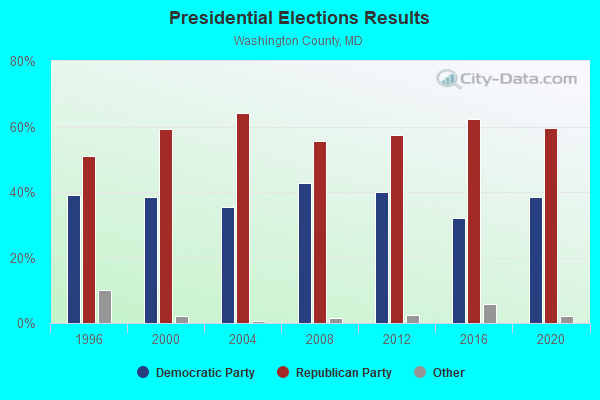
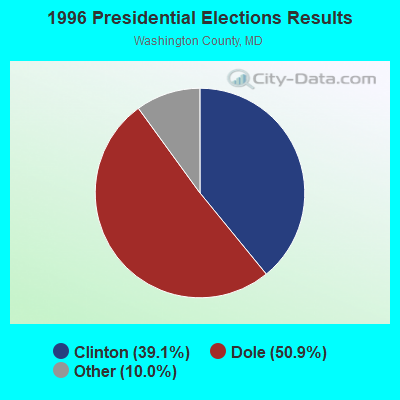
1996 Presidential Elections Results (%) - Democratic Party (Clinton)
1996 Presidential Elections Results (%) - Republican Party (Dole)
1996 Presidential Elections Results (%) - Other
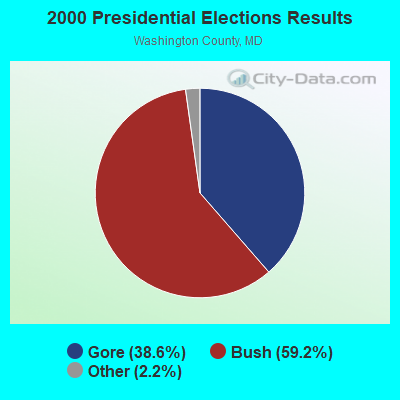
2000 Presidential Elections Results (%) - Democratic Party (Gore)
2000 Presidential Elections Results (%) - Republican Party (Bush)
2000 Presidential Elections Results (%) - Other
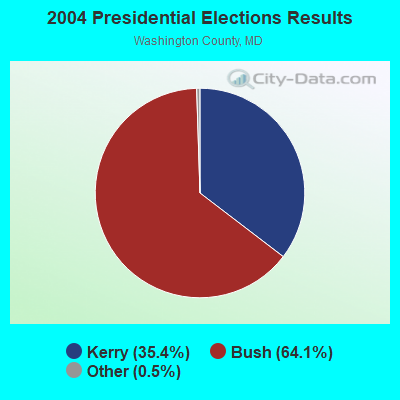
2004 Presidential Elections Results (%) - Democratic Party (Kerry)
2004 Presidential Elections Results (%) - Republican Party (Bush)
2004 Presidential Elections Results (%) - Other
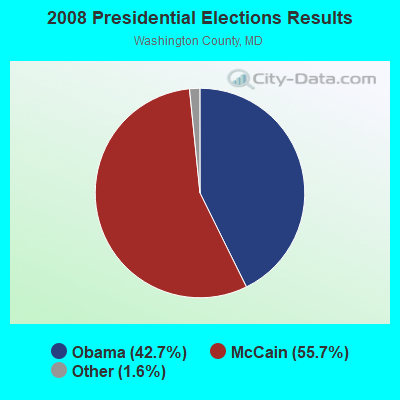
2008 Presidential Elections Results (%) - Democratic Party (Obama)
2008 Presidential Elections Results (%) - Republican Party (McCain)
2008 Presidential Elections Results (%) - Other
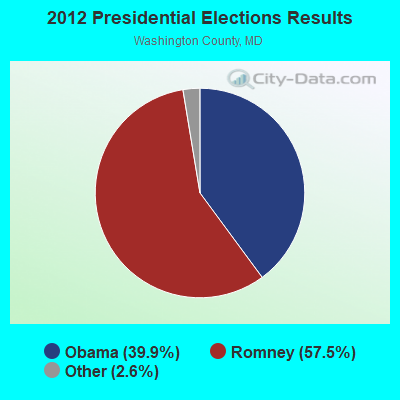
2012 Presidential Elections Results (%) - Democratic Party (Obama)
2012 Presidential Elections Results (%) - Republican Party (Romney)
2012 Presidential Elections Results (%) - Other
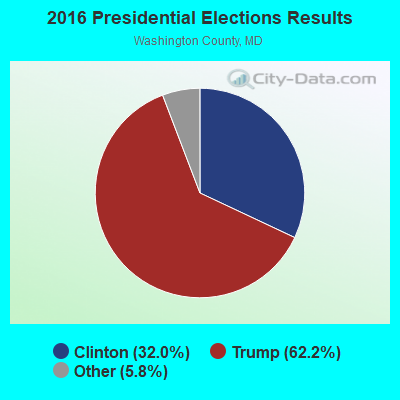
2016 Presidential Elections Results (%) - Democratic Party (Clinton)
2016 Presidential Elections Results (%) - Republican Party (Trump)
2016 Presidential Elections Results (%) - Other
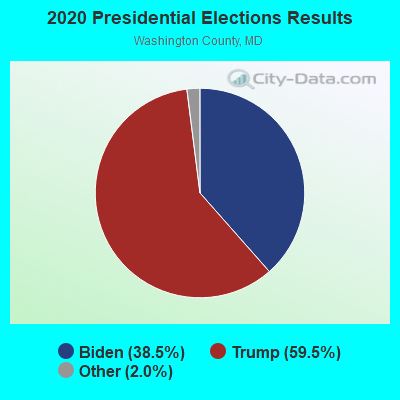
2020 Presidential Elections Results (%) - Democratic Party (Biden)
2020 Presidential Elections Results (%) - Republican Party (Trump)
2020 Presidential Elections Results (%) - Other
Ancestries Reported - Arab (%)
Ancestries Reported - Czech (%)
Ancestries Reported - Danish (%)
Ancestries Reported - Dutch (%)
Ancestries Reported - English (%)
Ancestries Reported - French (%)
Ancestries Reported - French Canadian (%)
Ancestries Reported - German (%)
Ancestries Reported - Greek (%)
Ancestries Reported - Hungarian (%)
Ancestries Reported - Irish (%)
Ancestries Reported - Italian (%)
Ancestries Reported - Lithuanian (%)
Ancestries Reported - Norwegian (%)
Ancestries Reported - Polish (%)
Ancestries Reported - Portuguese (%)
Ancestries Reported - Russian (%)
Ancestries Reported - Scotch-Irish (%)
Ancestries Reported - Scottish (%)
Ancestries Reported - Slovak (%)
Ancestries Reported - Subsaharan African (%)
Ancestries Reported - Swedish (%)
Ancestries Reported - Swiss (%)
Ancestries Reported - Ukrainian (%)
Ancestries Reported - United States (%)
Ancestries Reported - Welsh (%)
Ancestries Reported - West Indian (%)
Ancestries Reported - Other (%)
Educational Attainment - No schooling completed (%)
Educational Attainment - Less than high school (%)
Educational Attainment - High school or equivalent (%)
Educational Attainment - Less than 1 year of college (%)
Educational Attainment - 1 or more years of college (%)
Educational Attainment - Associate degree (%)
Educational Attainment - Bachelor's degree (%)
Educational Attainment - Master's degree (%)
Educational Attainment - Professional school degree (%)
Educational Attainment - Doctorate degree (%)
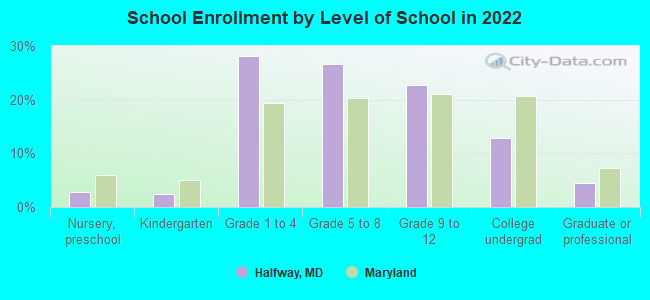
School Enrollment - Nursery, preschool (%)
School Enrollment - Kindergarten (%)
School Enrollment - Grade 1 to 4 (%)
School Enrollment - Grade 5 to 8 (%)
School Enrollment - Grade 9 to 12 (%)
School Enrollment - College undergrad (%)
School Enrollment - Graduate or professional (%)
School Enrollment - Not enrolled in school (%)
School enrollment - Public schools (%)
School enrollment - Private schools (%)
School enrollment - Not enrolled (%)
Median number of rooms in houses and condos
Median number of rooms in apartments
Housing units lacking complete plumbing facilities (%)
Housing units lacking complete kitchen facilities (%)
Density of houses
Urban houses (%)
Rural houses (%)
Households with people 60 years and over (%)
Households with people 65 years and over (%)
Households with people 75 years and over (%)
Households with one or more nonrelatives (%)
Households with no nonrelatives (%)
Population in households (%)
Family households (%)
Nonfamily households (%)
Population in families (%)
Family households with own children (%)
Median number of bedrooms in owner occupied houses
Mean number of bedrooms in owner occupied houses
Median number of bedrooms in renter occupied houses
Mean number of bedrooms in renter occupied houses
Median number of vehichles in owner occupied houses
Mean number of vehichles in owner occupied houses
Median number of vehichles in renter occupied houses
Mean number of vehichles in renter occupied houses
Mortgage status - with mortgage (%)
Mortgage status - with second mortgage (%)
Mortgage status - with home equity loan (%)
Mortgage status - with both second mortgage and home equity loan (%)
Mortgage status - without a mortgage (%)
Average family size
Average family size - White
Average family size - Black or African American
Average family size - Asian
Average family size - Hispanic or Latino
Average family size - American Indian and Alaska Native
Average family size - Multirace
Average family size - Other Race
Geographical mobility - Same house 1 year ago (%)
Geographical mobility - Moved within same county (%)
Geographical mobility - Moved from different county within same state (%)
Geographical mobility - Moved from different state (%)
Geographical mobility - Moved from abroad (%)
Place of birth - Born in state of residence (%)
Place of birth - Born in other state (%)
Place of birth - Native, outside of US (%)
Place of birth - Foreign born (%)
Housing units in structures - 1, detached (%)
Housing units in structures - 1, attached (%)
Housing units in structures - 2 (%)
Housing units in structures - 3 or 4 (%)
Housing units in structures - 5 to 9 (%)
Housing units in structures - 10 to 19 (%)
Housing units in structures - 20 to 49 (%)
Housing units in structures - 50 or more (%)
Housing units in structures - Mobile home (%)
Housing units in structures - Boat, RV, van, etc. (%)
House/condo owner moved in on average (years ago)
Renter moved in on average (years ago)
Year householder moved into unit - Moved in 1999 to March 2000 (%)
Year householder moved into unit - Moved in 1995 to 1998 (%)
Year householder moved into unit - Moved in 1990 to 1994 (%)
Year householder moved into unit - Moved in 1980 to 1989 (%)
Year householder moved into unit - Moved in 1970 to 1979 (%)
Year householder moved into unit - Moved in 1969 or earlier (%)
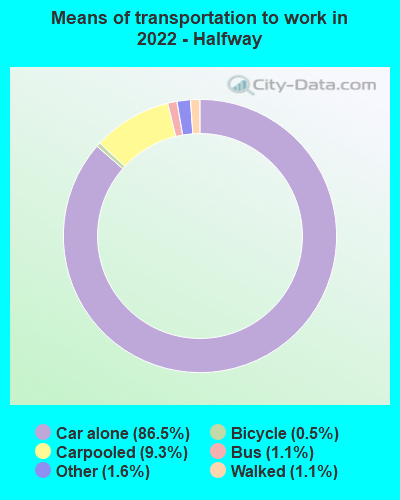
Means of transportation to work - Drove car alone (%)
Means of transportation to work - Carpooled (%)
Means of transportation to work - Public transportation (%)
Means of transportation to work - Bus or trolley bus (%)
Means of transportation to work - Streetcar or trolley car (%)
Means of transportation to work - Subway or elevated (%)
Means of transportation to work - Railroad (%)
Means of transportation to work - Ferryboat (%)
Means of transportation to work - Taxicab (%)
Means of transportation to work - Motorcycle (%)
Means of transportation to work - Bicycle (%)
Means of transportation to work - Walked (%)
Means of transportation to work - Other means (%)
Working at home (%)
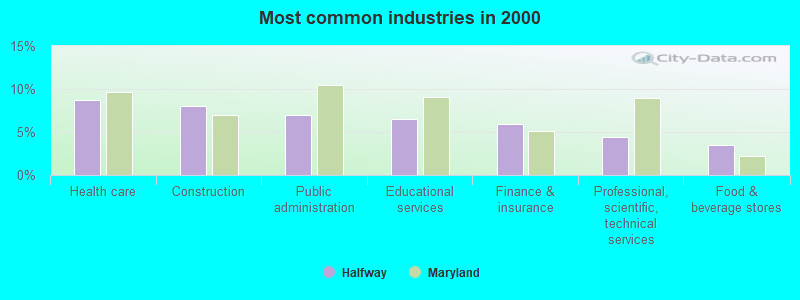
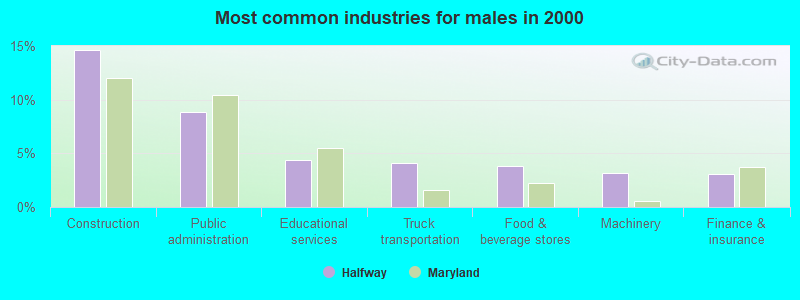
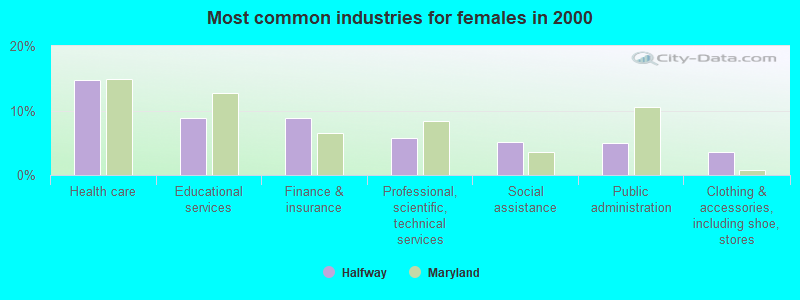
Industry diversity
Most Common Industries - Agriculture, forestry, fishing and hunting, and mining (%)
Most Common Industries - Agriculture, forestry, fishing and hunting (%)
Most Common Industries - Mining, quarrying, and oil and gas extraction (%)
Most Common Industries - Construction (%)
Most Common Industries - Manufacturing (%)
Most Common Industries - Wholesale trade (%)
Most Common Industries - Retail trade (%)
Most Common Industries - Transportation and warehousing, and utilities (%)
Most Common Industries - Transportation and warehousing (%)
Most Common Industries - Utilities (%)
Most Common Industries - Information (%)
Most Common Industries - Finance and insurance, and real estate and rental and leasing (%)
Most Common Industries - Finance and insurance (%)
Most Common Industries - Real estate and rental and leasing (%)
Most Common Industries - Professional, scientific, and management, and administrative and waste management services (%)
Most Common Industries - Professional, scientific, and technical services (%)
Most Common Industries - Management of companies and enterprises (%)
Most Common Industries - Administrative and support and waste management services (%)
Most Common Industries - Educational services, and health care and social assistance (%)
Most Common Industries - Educational services (%)
Most Common Industries - Health care and social assistance (%)
Most Common Industries - Arts, entertainment, and recreation, and accommodation and food services (%)
Most Common Industries - Arts, entertainment, and recreation (%)
Most Common Industries - Accommodation and food services (%)
Most Common Industries - Other services, except public administration (%)
Most Common Industries - Public administration (%)
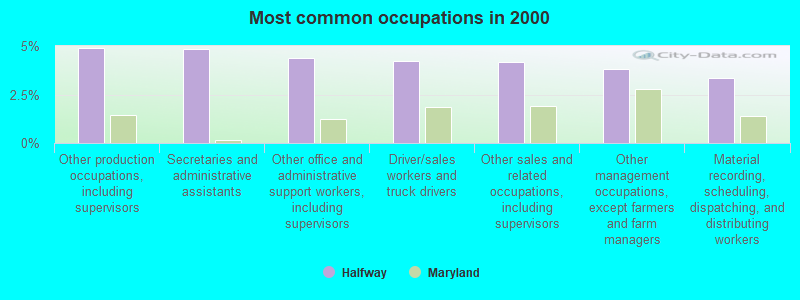
Occupation diversity
Most Common Occupations - Management, business, science, and arts occupations (%)
Most Common Occupations - Management, business, and financial occupations (%)
Most Common Occupations - Management occupations (%)
Most Common Occupations - Business and financial operations occupations (%)
Most Common Occupations - Computer, engineering, and science occupations (%)
Most Common Occupations - Computer and mathematical occupations (%)
Most Common Occupations - Architecture and engineering occupations (%)
Most Common Occupations - Life, physical, and social science occupations (%)
Most Common Occupations - Education, legal, community service, arts, and media occupations (%)
Most Common Occupations - Community and social service occupations (%)
Most Common Occupations - Legal occupations (%)
Most Common Occupations - Education, training, and library occupations (%)
Most Common Occupations - Arts, design, entertainment, sports, and media occupations (%)
Most Common Occupations - Healthcare practitioners and technical occupations (%)
Most Common Occupations - Health diagnosing and treating practitioners and other technical occupations (%)
Most Common Occupations - Health technologists and technicians (%)
Most Common Occupations - Service occupations (%)
Most Common Occupations - Healthcare support occupations (%)
Most Common Occupations - Protective service occupations (%)
Most Common Occupations - Fire fighting and prevention, and other protective service workers including supervisors (%)
Most Common Occupations - Law enforcement workers including supervisors (%)
Most Common Occupations - Food preparation and serving related occupations (%)
Most Common Occupations - Building and grounds cleaning and maintenance occupations (%)
Most Common Occupations - Personal care and service occupations (%)
Most Common Occupations - Sales and office occupations (%)
Most Common Occupations - Sales and related occupations (%)
Most Common Occupations - Office and administrative support occupations (%)
Most Common Occupations - Natural resources, construction, and maintenance occupations (%)
Most Common Occupations - Farming, fishing, and forestry occupations (%)
Most Common Occupations - Construction and extraction occupations (%)
Most Common Occupations - Installation, maintenance, and repair occupations (%)
Most Common Occupations - Production, transportation, and material moving occupations (%)
Most Common Occupations - Production occupations (%)
Most Common Occupations - Transportation occupations (%)
Most Common Occupations - Material moving occupations (%)
People in Group quarters - Institutionalized population (%)
People in Group quarters - Correctional institutions (%)
People in Group quarters - Federal prisons and detention centers (%)
People in Group quarters - Halfway houses (%)
People in Group quarters - Local jails and other confinement facilities (including police lockups) (%)
People in Group quarters - Military disciplinary barracks (%)
People in Group quarters - State prisons (%)
People in Group quarters - Other types of correctional institutions (%)
People in Group quarters - Nursing homes (%)
People in Group quarters - Hospitals/wards, hospices, and schools for the handicapped (%)
People in Group quarters - Hospitals/wards and hospices for chronically ill (%)
People in Group quarters - Hospices or homes for chronically ill (%)
People in Group quarters - Military hospitals or wards for chronically ill (%)
People in Group quarters - Other hospitals or wards for chronically ill (%)
People in Group quarters - Hospitals or wards for drug/alcohol abuse (%)
People in Group quarters - Mental (Psychiatric) hospitals or wards (%)
People in Group quarters - Schools, hospitals, or wards for the mentally retarded (%)
People in Group quarters - Schools, hospitals, or wards for the physically handicapped (%)
People in Group quarters - Institutions for the deaf (%)
People in Group quarters - Institutions for the blind (%)
People in Group quarters - Orthopedic wards and institutions for the physically handicapped (%)
People in Group quarters - Wards in general hospitals for patients who have no usual home elsewhere (%)
People in Group quarters - Wards in military hospitals for patients who have no usual home elsewhere (%)
People in Group quarters - Juvenile institutions (%)
People in Group quarters - Long-term care (%)
People in Group quarters - Homes for abused, dependent, and neglected children (%)
People in Group quarters - Residential treatment centers for emotionally disturbed children (%)
People in Group quarters - Training schools for juvenile delinquents (%)
People in Group quarters - Short-term care, detention or diagnostic centers for delinquent children (%)
People in Group quarters - Type of juvenile institution unknown (%)
People in Group quarters - Noninstitutionalized population (%)
People in Group quarters - College dormitories (includes college quarters off campus) (%)
People in Group quarters - Military quarters (%)
People in Group quarters - On base (%)
People in Group quarters - Barracks, unaccompanied personnel housing (UPH), (Enlisted/Officer), ;and similar group living quarters for military personnel (%)
People in Group quarters - Transient quarters for temporary residents (%)
People in Group quarters - Military ships (%)
People in Group quarters - Group homes (%)
People in Group quarters - Homes or halfway houses for drug/alcohol abuse (%)
People in Group quarters - Homes for the mentally ill (%)
People in Group quarters - Homes for the mentally retarded (%)
People in Group quarters - Homes for the physically handicapped (%)
People in Group quarters - Other group homes (%)
People in Group quarters - Religious group quarters (%)
People in Group quarters - Dormitories (%)
People in Group quarters - Agriculture workers' dormitories on farms (%)
People in Group quarters - Job Corps and vocational training facilities (%)
People in Group quarters - Other workers' dormitories (%)
People in Group quarters - Crews of maritime vessels (%)
People in Group quarters - Other nonhousehold living situations (%)
People in Group quarters - Other noninstitutional group quarters (%)
Residents speaking English at home (%)
Residents speaking English at home - Born in the United States (%)
Residents speaking English at home - Native, born elsewhere (%)
Residents speaking English at home - Foreign born (%)
Residents speaking Spanish at home (%)
Residents speaking Spanish at home - Born in the United States (%)
Residents speaking Spanish at home - Native, born elsewhere (%)
Residents speaking Spanish at home - Foreign born (%)
Residents speaking other language at home (%)
Residents speaking other language at home - Born in the United States (%)
Residents speaking other language at home - Native, born elsewhere (%)
Residents speaking other language at home - Foreign born (%)
Class of Workers - Employee of private company (%)
Class of Workers - Self-employed in own incorporated business (%)
Class of Workers - Private not-for-profit wage and salary workers (%)
Class of Workers - Local government workers (%)
Class of Workers - State government workers (%)
Class of Workers - Federal government workers (%)
Class of Workers - Self-employed workers in own not incorporated business and Unpaid family workers (%)
House heating fuel used in houses and condos - Utility gas (%)
House heating fuel used in houses and condos - Bottled, tank, or LP gas (%)
House heating fuel used in houses and condos - Electricity (%)
House heating fuel used in houses and condos - Fuel oil, kerosene, etc. (%)
House heating fuel used in houses and condos - Coal or coke (%)
House heating fuel used in houses and condos - Wood (%)
House heating fuel used in houses and condos - Solar energy (%)
House heating fuel used in houses and condos - Other fuel (%)
House heating fuel used in houses and condos - No fuel used (%)
House heating fuel used in apartments - Utility gas (%)
House heating fuel used in apartments - Bottled, tank, or LP gas (%)
House heating fuel used in apartments - Electricity (%)
House heating fuel used in apartments - Fuel oil, kerosene, etc. (%)
House heating fuel used in apartments - Coal or coke (%)
House heating fuel used in apartments - Wood (%)
House heating fuel used in apartments - Solar energy (%)
House heating fuel used in apartments - Other fuel (%)
House heating fuel used in apartments - No fuel used (%)
Armed forces status - In Armed Forces (%)
Armed forces status - Civilian (%)
Armed forces status - Civilian - Veteran (%)
Armed forces status - Civilian - Nonveteran (%)
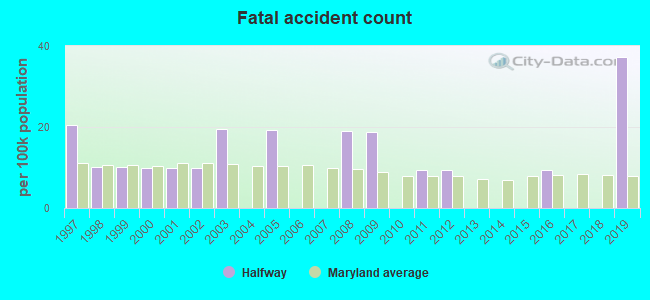
Fatal accidents locations in years 2005-2021
Fatal accidents locations in 2005
Fatal accidents locations in 2006
Fatal accidents locations in 2007
Fatal accidents locations in 2008
Fatal accidents locations in 2009
Fatal accidents locations in 2010
Fatal accidents locations in 2011
Fatal accidents locations in 2012
Fatal accidents locations in 2013
Fatal accidents locations in 2014
Fatal accidents locations in 2015
Fatal accidents locations in 2016
Fatal accidents locations in 2017
Fatal accidents locations in 2018
Fatal accidents locations in 2019
Fatal accidents locations in 2020
Fatal accidents locations in 2021
Alcohol use - People drinking some alcohol every month (%)
Alcohol use - People not drinking at all (%)
Alcohol use - Average days/month drinking alcohol
Alcohol use - Average drinks/week
Alcohol use - Average days/year people drink much
Audiometry - Average condition of hearing (%)
Audiometry - People that can hear a whisper from across a quiet room (%)
Audiometry - People that can hear normal voice from across a quiet room (%)
Audiometry - Ears ringing, roaring, buzzing (%)
Audiometry - Had a job exposure to loud noise (%)
Audiometry - Had off-work exposure to loud noise (%)
Blood Pressure & Cholesterol - Has high blood pressure (%)
Blood Pressure & Cholesterol - Checking blood pressure at home (%)
Blood Pressure & Cholesterol - Frequently checking blood cholesterol (%)
Blood Pressure & Cholesterol - Has high cholesterol level (%)
Consumer Behavior - Money monthly spent on food at supermarket/grocery store
Consumer Behavior - Money monthly spent on food at other stores
Consumer Behavior - Money monthly spent on eating out
Consumer Behavior - Money monthly spent on carryout/delivered foods
Consumer Behavior - Income spent on food at supermarket/grocery store (%)
Consumer Behavior - Income spent on food at other stores (%)
Consumer Behavior - Income spent on eating out (%)
Consumer Behavior - Income spent on carryout/delivered foods (%)
Current Health Status - General health condition (%)
Current Health Status - Blood donors (%)
Current Health Status - Has blood ever tested for HIV virus (%)
Current Health Status - Left-handed people (%)
Dermatology - People using sunscreen (%)
Diabetes - Diabetics (%)
Diabetes - Had a blood test for high blood sugar (%)
Diabetes - People taking insulin (%)
Diet Behavior & Nutrition - Diet health (%)
Diet Behavior & Nutrition - Milk product consumption (# of products/month)
Diet Behavior & Nutrition - Meals not home prepared (#/week)
Diet Behavior & Nutrition - Meals from fast food or pizza place (#/week)
Diet Behavior & Nutrition - Ready-to-eat foods (#/month)
Diet Behavior & Nutrition - Frozen meals/pizza (#/month)
Drug Use - People that ever used marijuana or hashish (%)
Drug Use - Ever used hard drugs (%)
Drug Use - Ever used any form of cocaine (%)
Drug Use - Ever used heroin (%)
Drug Use - Ever used methamphetamine (%)
Health Insurance - People covered by health insurance (%)
Kidney Conditions-Urology - Avg. # of times urinating at night
Medical Conditions - People with asthma (%)
Medical Conditions - People with anemia (%)
Medical Conditions - People with psoriasis (%)
Medical Conditions - People with overweight (%)
Medical Conditions - Elderly people having difficulties in thinking or remembering (%)
Medical Conditions - People who ever received blood transfusion (%)
Medical Conditions - People having trouble seeing even with glass/contacts (%)
Medical Conditions - People with arthritis (%)
Medical Conditions - People with gout (%)
Medical Conditions - People with congestive heart failure (%)
Medical Conditions - People with coronary heart disease (%)
Medical Conditions - People with angina pectoris (%)
Medical Conditions - People who ever had heart attack (%)
Medical Conditions - People who ever had stroke (%)
Medical Conditions - People with emphysema (%)
Medical Conditions - People with thyroid problem (%)
Medical Conditions - People with chronic bronchitis (%)
Medical Conditions - People with any liver condition (%)
Medical Conditions - People who ever had cancer or malignancy (%)
Mental Health - People who have little interest in doing things (%)
Mental Health - People feeling down, depressed, or hopeless (%)
Mental Health - People who have trouble sleeping or sleeping too much (%)
Mental Health - People feeling tired or having little energy (%)
Mental Health - People with poor appetite or overeating (%)
Mental Health - People feeling bad about themself (%)
Mental Health - People who have trouble concentrating on things (%)
Mental Health - People moving or speaking slowly or too fast (%)
Mental Health - People having thoughts they would be better off dead (%)
Oral Health - Average years since last visit a dentist
Oral Health - People embarrassed because of mouth (%)
Oral Health - People with gum disease (%)
Oral Health - General health of teeth and gums (%)
Oral Health - Average days a week using dental floss/device
Oral Health - Average days a week using mouthwash for dental problem
Oral Health - Average number of teeth
Pesticide Use - Households using pesticides to control insects (%)
Pesticide Use - Households using pesticides to kill weeds (%)
Physical Activity - People doing vigorous-intensity work activities (%)
Physical Activity - People doing moderate-intensity work activities (%)
Physical Activity - People walking or bicycling (%)
Physical Activity - People doing vigorous-intensity recreational activities (%)
Physical Activity - People doing moderate-intensity recreational activities (%)
Physical Activity - Average hours a day doing sedentary activities
Physical Activity - Average hours a day watching TV or videos
Physical Activity - Average hours a day using computer
Physical Functioning - People having limitations keeping them from working (%)
Physical Functioning - People limited in amount of work they can do (%)
Physical Functioning - People that need special equipment to walk (%)
Physical Functioning - People experiencing confusion/memory problems (%)
Physical Functioning - People requiring special healthcare equipment (%)
Prescription Medications - Average number of prescription medicines taking
Preventive Aspirin Use - Adults 40+ taking low-dose aspirin (%)
Reproductive Health - Vaginal deliveries (%)
Reproductive Health - Cesarean deliveries (%)
Reproductive Health - Deliveries resulted in a live birth (%)
Reproductive Health - Pregnancies resulted in a delivery (%)
Reproductive Health - Women breastfeeding newborns (%)
Reproductive Health - Women that had a hysterectomy (%)
Reproductive Health - Women that had both ovaries removed (%)
Reproductive Health - Women that have ever taken birth control pills (%)
Reproductive Health - Women taking birth control pills (%)
Reproductive Health - Women that have ever used Depo-Provera or injectables (%)
Reproductive Health - Women that have ever used female hormones (%)
Sexual Behavior - People 18+ that ever had sex (vaginal, anal, or oral) (%)
Sexual Behavior - Males 18+ that ever had vaginal sex with a woman (%)
Sexual Behavior - Males 18+ that ever performed oral sex on a woman (%)
Sexual Behavior - Males 18+ that ever had anal sex with a woman (%)
Sexual Behavior - Males 18+ that ever had any sex with a man (%)
Sexual Behavior - Females 18+ that ever had vaginal sex with a man (%)
Sexual Behavior - Females 18+ that ever performed oral sex on a man (%)
Sexual Behavior - Females 18+ that ever had anal sex with a man (%)
Sexual Behavior - Females 18+ that ever had any kind of sex with a woman (%)
Sexual Behavior - Average age people first had sex
Sexual Behavior - Average number of female sex partners in lifetime (males 18+)
Sexual Behavior - Average number of female vaginal sex partners in lifetime (males 18+)
Sexual Behavior - Average age people first performed oral sex on a woman (18+)
Sexual Behavior - Average number of woman performed oral sex on in lifetime (18+)
Sexual Behavior - Average number of male sex partners in lifetime (males 18+)
Sexual Behavior - Average number of male anal sex partners in lifetime (males 18+)
Sexual Behavior - Average age people first performed oral sex on a man (18+)
Sexual Behavior - Average number of male oral sex partners in lifetime (18+)
Sexual Behavior - People using protection when performing oral sex (%)
Sexual Behavior - Average number of times people have vaginal or anal sex a year
Sexual Behavior - People having sex without condom (%)
Sexual Behavior - Average number of male sex partners in lifetime (females 18+)
Sexual Behavior - Average number of male vaginal sex partners in lifetime (females 18+)
Sexual Behavior - Average number of female sex partners in lifetime (females 18+)
Sexual Behavior - Circumcised males 18+ (%)
Sleep Disorders - Average hours sleeping at night
Sleep Disorders - People that has trouble sleeping (%)
Smoking-Cigarette Use - People smoking cigarettes (%)
Taste & Smell - People 40+ having problems with smell (%)
Taste & Smell - People 40+ having problems with taste (%)
Taste & Smell - People 40+ that ever had wisdom teeth removed (%)
Taste & Smell - People 40+ that ever had tonsils teeth removed (%)
Taste & Smell - People 40+ that ever had a loss of consciousness because of a head injury (%)
Taste & Smell - People 40+ that ever had a broken nose or other serious injury to face or skull (%)
Taste & Smell - People 40+ that ever had two or more sinus infections (%)
Weight - Average height (inches)
Weight - Average weight (pounds)
Weight - Average BMI
Weight - People that are obese (%)
Weight - People that ever were obese (%)
Weight - People trying to lose weight (%)
Latest news from Halfway, MD collected exclusively by city-data.com from local newspapers, TV, and radio stations
Ancestries: German (37.3%), American (12.0%), English (6.1%), Irish (4.3%), Italian (3.8%), Polish (1.2%).
Current Local Time:
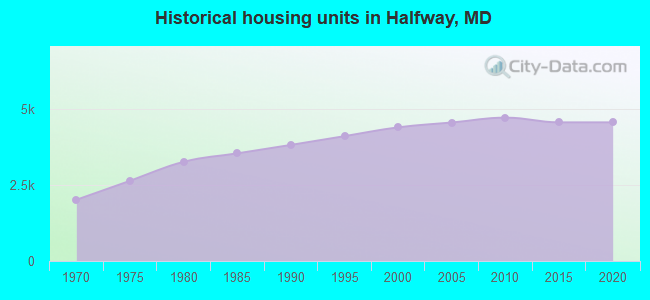
Land area: 4.69 square miles.
Population density: 2,283 people per square mile (low).
425 residents are foreign born (2.9% Latin America , 0.7% Asia ).
This place:
4.1%Maryland:
15.7%
Median real estate property taxes paid for housing units with mortgages in 2022: $1,691 (0.6%)Median real estate property taxes paid for housing units with no mortgage in 2022: $1,789 (0.8%)
Nearest city with pop. 50,000+: Frederick, MD
Nearest city with pop. 200,000+: Washington, DC
Nearest city with pop. 1,000,000+: Philadelphia, PA
Nearest cities:
Kemps Mill, MD (1.6 miles),
Latitude: 39.62 N, Longitude: 77.77 W
Daytime population change due to commuting: -486 (-4.7%)Workers who live and work in this place: 784 (15.9%)
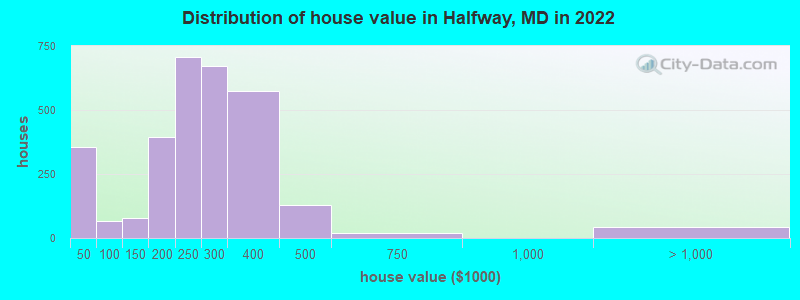
Property values in Halfway, MD
Unemployment in December 2023:
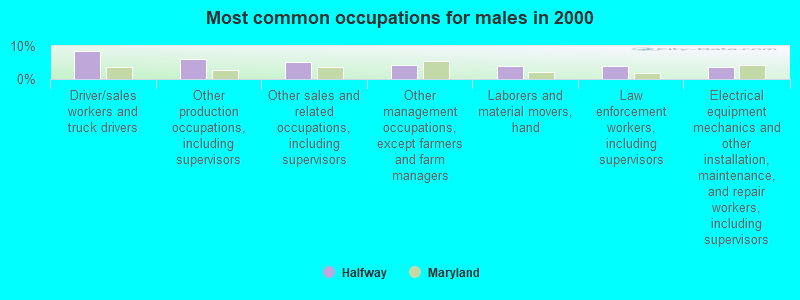
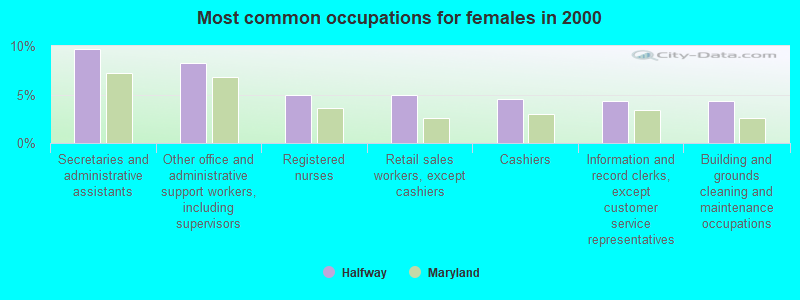
Most common occupations in Halfway, MD (%)
Both Males Females
Other production occupations, including supervisors (4.9%)
Secretaries and administrative assistants (4.8%)
Other office and administrative support workers, including supervisors (4.4%)
Driver/sales workers and truck drivers (4.2%)
Other sales and related occupations, including supervisors (4.2%)
Other management occupations, except farmers and farm managers (3.8%)
Material recording, scheduling, dispatching, and distributing workers (3.3%)
Driver/sales workers and truck drivers (8.4%)
Other production occupations, including supervisors (6.1%)
Other sales and related occupations, including supervisors (5.1%)
Other management occupations, except farmers and farm managers (4.1%)
Laborers and material movers, hand (4.0%)
Law enforcement workers, including supervisors (3.9%)
Electrical equipment mechanics and other installation, maintenance, and repair workers, including supervisors (3.5%)
Secretaries and administrative assistants (9.7%)
Other office and administrative support workers, including supervisors (8.2%)
Registered nurses (5.0%)
Retail sales workers, except cashiers (5.0%)
Cashiers (4.5%)
Information and record clerks, except customer service representatives (4.3%)
Building and grounds cleaning and maintenance occupations (4.3%)
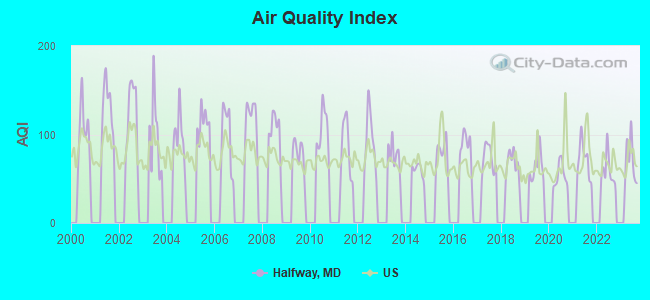
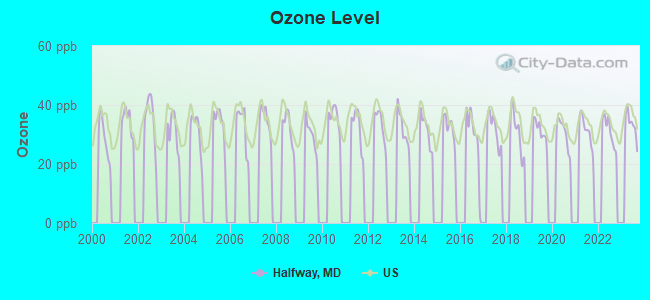
Air pollution and air quality trends(lower is better)
AQI Ozone
Tornado activity:
Halfway-area historical tornado activity is near Maryland state average. It is 9% smaller than the overall U.S. average.
On 5/22/1983, a category F3 (max. wind speeds 158-206 mph) tornado 28.1 miles away from the Halfway place center caused between $5000 and $50,000 in damages.
On 4/16/1961, a category F3 tornado 32.7 miles away from the place center caused between $50,000 and $500,000 in damages.
Earthquake activity:
Halfway-area historical earthquake activity is significantly above Maryland state average. It is 55% smaller than the overall U.S. average. On 8/23/2011 at 17:51:04, a magnitude 5.8 (5.8 MW, Depth: 3.7 mi, Class: Moderate, Intensity: VI - VII) earthquake occurred 118.4 miles away from the city center On 9/25/1998 at 19:52:52, a magnitude 5.2 (4.8 MB, 4.3 MS, 5.2 LG, 4.5 MW, Depth: 3.1 mi) earthquake occurred 189.5 miles away from the city center On 1/16/1994 at 01:49:16, a magnitude 4.6 (4.6 MB, 4.6 LG, Depth: 3.1 mi, Class: Light, Intensity: IV - V) earthquake occurred 104.1 miles away from Halfway center On 8/25/2011 at 05:07:52, a magnitude 4.5 (4.5 ML, Depth: 4.2 mi) earthquake occurred 116.0 miles away from Halfway center On 1/31/1986 at 16:46:43, a magnitude 5.0 (5.0 MB) earthquake occurred 225.0 miles away from the city center On 12/9/2003 at 20:59:18, a magnitude 4.5 (4.5 ML, Depth: 6.2 mi) earthquake occurred 128.7 miles away from Halfway center Magnitude types: regional Lg-wave magnitude (LG), body-wave magnitude (MB), local magnitude (ML), surface-wave magnitude (MS), moment magnitude (MW) Natural disasters: The number of natural disasters in Washington County (15) is near the US average (15).Major Disasters (Presidential) Declared: 9Emergencies Declared: 5Hurricanes: 5, Floods: 3, Snowstorms: 3, Winter Storms: 3, Blizzard: 1, Heavy Rain: 1, Snowfall: 1, Storm: 1, Tropical Storm: 1, Other: 1 (Note: some incidents may be assigned to more than one category). Hospitals and medical centers near Halfway: HOMEWOOD AT WILLIAMSPORT MD (Nursing Home, about 2 miles away; WILLIAMSPORT, MD)
CLEARVIEW NURSING HOME (Nursing Home, about 2 miles away; HAGERSTOWN, MD)
GARLOCK MANOR NURSING HOME (Nursing Home, about 3 miles away; HAGERSTOWN, MD)
RAVENWOOD NURSING CARE CENTER (Nursing Home, about 3 miles away; HAGERSTOWN, MD)
JULIA MANOR HEALTH CARE CENTER (Nursing Home, about 3 miles away; HAGERSTOWN, MD)
WILLIAMSPORT NURSING HOME (Nursing Home, about 3 miles away; WILLIAMSPORT, MD)
WASHINGTON COUNTY HOSP. ECF (Nursing Home, about 4 miles away; HAGERSTOWN, MD)
Amtrak stations near Halfway: 4 miles: HAGERSTOWN (GREYHOUND STA., 10527 SHARPSTOWN PK.) - Bus Station Services: enclosed waiting area, public restrooms, public payphones, snack bar.
16 miles: MARTINSBURG (229 E. MARTIN ST.) Services: fully wheelchair accessible, enclosed waiting area, public restrooms, public payphones, paid short-term parking, taxi stand, public transit connection.
Colleges/universities with over 2000 students nearest to Halfway:
Hagerstown Community College (about 6 miles; Hagerstown, MD ; Full-time enrollment: 3,220)
Shepherd University (about 13 miles; Shepherdstown, WV ; FT enrollment: 3,745)
Frederick Community College (about 22 miles; Frederick, MD ; FT enrollment: 3,798)
Mount St Mary's University (about 23 miles; Emmitsburg, MD ; FT enrollment: 2,313)
American Public University System (about 24 miles; Charles Town, WV ; FT enrollment: 43,829)
Gettysburg College (about 33 miles; Gettysburg, PA ; FT enrollment: 2,772)
Shippensburg University of Pennsylvania (about 34 miles; Shippensburg, PA ; FT enrollment: 7,051)
Notable locations in Halfway: (A) , Washington County Emergency Air Unit Company 25 (B) , Danner's Greenhouse (C) . Display/hide their locations on the map
Shopping Centers: (1) , Valley Plaza Shopping Center (2) , Valley Mall Shopping Center (3) . Display/hide their locations on the map
Churches in Halfway include: (A) , Gay Street Brethren Church (B) , Saint Andrew Church (C) , Saint Joseph Catholic Church (D) , Valley Grace Brethren Church (E) , Van Lear Brethren Church (F) , Virginia Avenue Baptist Church (G) . Display/hide their locations on the map
Cemetery: (1) . Display/hide its location on the map
Parks in Halfway include: (1) , Piper Lane Neighborhood Park (2) , Marty Snook County Park (3) . Display/hide their locations on the map
Washington County has a predicted average indoor radon screening level greater than 4 pCi/L (pico curies per liter) - Highest Potential Average household size: This place:
2.4 peopleMaryland:
2.6 people
Percentage of family households: This place:
67.5%Whole state:
67.1%
Percentage of households with unmarried partners: This place:
7.6%Whole state:
6.4%
Likely homosexual households (counted as self-reported same-sex unmarried-partner households)
Lesbian couples: 0.4% of all households Gay men: 0.5% of all households
5 people in group homes intended for adults in 2010People in group quarters in Halfway in 2000:
134 people in nursing homes
9 people in homes for the mentally retarded
9 people in other nonhousehold living situations
For population 15 years and over in Halfway:
Never married: 30.3%Now married: 48.2%Separated: 3.8%Widowed: 6.3%Divorced: 11.4% For population 25 years and over in Halfway:
High school or higher: 87.5%Bachelor's degree or higher: 21.4%Graduate or professional degree: 9.0%Unemployed: 1.7%Mean travel time to work (commute): 21.1 minutes
Education Gini index (Inequality in education) Here:
11.0Maryland average:
12.7
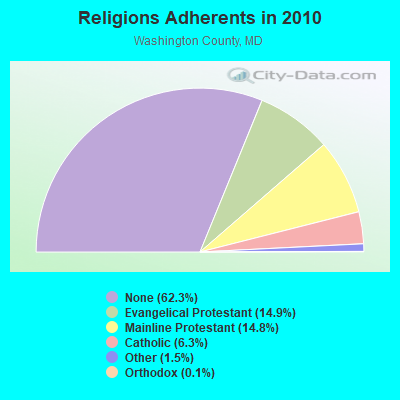
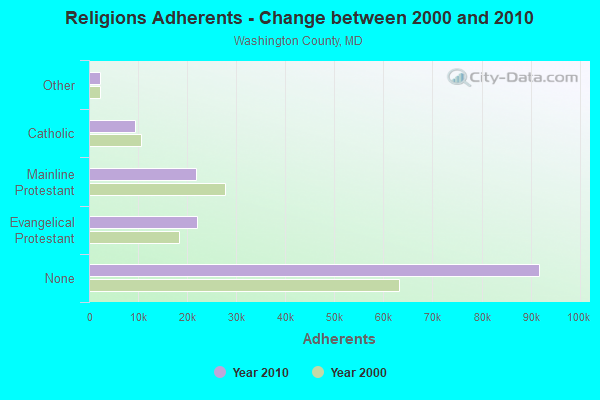
Religion statistics for Halfway, MD (based on Washington County data)
Religion Adherents Congregations Evangelical Protestant 21,941 117 Mainline Protestant 21,837 79 Catholic 9,350 8 Other 2,244 11 Orthodox 163 2 Black Protestant 97 2 None 91,798 -
Source: Clifford Grammich, Kirk Hadaway, Richard Houseal, Dale E.Jones, Alexei Krindatch, Richie Stanley and Richard H.Taylor. 2012. 2010 U.S.Religion Census: Religious Congregations & Membership Study. Association of Statisticians of American Religious Bodies. Jones, Dale E., et al. 2002. Congregations and Membership in the United States 2000. Nashville, TN: Glenmary Research Center. Graphs represent county-level data
Food Environment Statistics: Number of grocery stores : 25Washington County :
1.73 / 10,000 pop.Maryland :
1.96 / 10,000 pop.
Number of supercenters and club stores : 2Washington County :
0.14 / 10,000 pop.Maryland :
0.07 / 10,000 pop.
Number of convenience stores (no gas) : 15This county :
1.04 / 10,000 pop.Maryland :
1.22 / 10,000 pop.
Number of convenience stores (with gas) : 41Washington County :
2.83 / 10,000 pop.Maryland :
2.05 / 10,000 pop.
Number of full-service restaurants : 93Washington County :
6.43 / 10,000 pop.Maryland :
5.40 / 10,000 pop.
Adult diabetes rate : This county :
10.2%Maryland :
9.1%
Adult obesity rate : Washington County :
28.8%Maryland :
26.7%
Low-income preschool obesity rate : Washington County :
12.9%State :
15.5%
Health and Nutrition:
Average overall health of teeth and gums : People feeling badly about themselves : Halfway:
20.5%Maryland:
20.0%
People not drinking alcohol at all : This city:
9.8%State:
11.3%
Average hours sleeping at night : Overweight people : Halfway:
34.3%Maryland:
34.1%
General health condition : Average condition of hearing : Halfway:
77.3%Maryland:
80.5%
More about Health and Nutrition of Halfway, MD Residents Businesses in Halfway, MD
Strongest AM radio stations in Halfway:
WHAG (1410 AM; 1 kW; HALFWAY, MD; Owner: DAME BROADCASTING, LLC)
WARK (1490 AM; 1 kW; HAGERSTOWN, MD; Owner: MANNING BROADCASTING, INC.)
WJEJ (1240 AM; 1 kW; HAGERSTOWN, MD; Owner: HAGERSTOWN BROADCASTING COMPANY)
WCBM (680 AM; 50 kW; BALTIMORE, MD; Owner: WCBM MARYLAND, INC.)
WMET (1150 AM; 50 kW; GAITHERSBURG, MD; Owner: BELTWAY ACQUISITION CORPORATION)
WTRI (1520 AM; daytime; 17 kW; BRUNSWICK, MD; Owner: JMK COMMUNICATIONS, INC.)
WBAL (1090 AM; 50 kW; BALTIMORE, MD; Owner: HEARST RADIO, INC.)
WTEM (980 AM; 50 kW; WASHINGTON, DC; Owner: AMFM RADIO LICENSES, L.L.C.)
WGOP (700 AM; daytime; 25 kW; WALKERSVILLE, MD; Owner: BIRACH BROADCASTING CORPORATION)
WFMD (930 AM; 5 kW; FREDERICK, MD; Owner: CAPSTAR TX LIMITED PARTNERSHIP)
WXTR (820 AM; 4 kW; FREDERICK, MD; Owner: BONNEVILLE HOLDING COMPANY)
WTOP (1500 AM; 50 kW; WASHINGTON, DC; Owner: BONNEVILLE HOLDING COMPANY)
WKCW (1420 AM; 50 kW; WARRENTON, VA; Owner: WAY BROADCASTING, INC.)
Strongest FM radio stations in Halfway:
WKMZ (95.9 FM; WILLIAMSPORT, MD; Owner: PRETTYMAN BROADCASTING COMPANY)
WDLD (96.7 FM; HALFWAY, MD; Owner: DAME BROADCASTING, LLC)
WAYZ-FM (104.7 FM; HAGERSTOWN, MD; Owner: HJV LIMITED PARTNERSHIP)
WETH (89.1 FM; HAGERSTOWN, MD; Owner: GREATER WASHINGTON EDUCATIONAL TELECOMMUNICATIONS ASSN.)
WCRH (90.5 FM; WILLIAMSPORT, MD; Owner: CEDAR RIDGE CHILDREN'S HOME & SCHOOL, INC)
WARX (106.9 FM; HAGERSTOWN, MD; Owner: MANNING BROADCASTING INC.)
WFRE (99.9 FM; FREDERICK, MD; Owner: CAPSTAR TX LIMITED PARTNERSHIP)
W219BX (91.7 FM; FREDERICK, MD; Owner: CEDAR RIDGE CHILDREN'S HOME & SCHOOL, INC)
WEEO-FM (103.7 FM; MCCONNELLSBURG, PA; Owner: ALLEGHENY MOUNTAIN NETWORK)
WWVZ (103.9 FM; BRADDOCK HEIGHTS, MD; Owner: BONNEVILLE HOLDING COMPANY)
WLTF (97.5 FM; MARTINSBURG, WV; Owner: PRETTYMAN BROADCASTING COMPANY)
W219BE (91.7 FM; WAYNESBORO, PA; Owner: MARANATHA BIBLE INSTITUTE, NDBA)
WSRT (92.1 FM; MERCERSBURG, PA; Owner: M. BELMONT VERSTANDIG, INC.)
WQCM (94.3 FM; GREENCASTLE, PA; Owner: DAME BROADCASTING, LLC)
WAFY (103.1 FM; MIDDLETOWN, MD; Owner: FREDERICK BROADCASTING LLC)
W228BA (93.5 FM; LEESBURG, VA; Owner: CSN INTERNATIONAL)
WTRM (91.3 FM; WINCHESTER, VA; Owner: TIMBER RIDGE MINISTRIES, INC.)
WINC-FM (92.5 FM; WINCHESTER, VA; Owner: MID ATLANTIC NETWORK, INC.)
WBVE (107.5 FM; BEDFORD, PA; Owner: CESSNA COMMUNICATIONS, INC.)
W228AB (93.5 FM; PARAMOUNT, ETC., MD; Owner: FAMILY STATIONS, INC.)
TV broadcast stations around Halfway:
W42CK (Channel 42; HAGERSTOWN, MD; Owner: THREE ANGELS BROADCASTING)
WHAG-TV (Channel 25; HAGERSTOWN, MD; Owner: QUORUM OF MARYLAND LICENSE, LLC)
WWPB (Channel 31; HAGERSTOWN, MD; Owner: MARYLAND PUBLIC BROADCASTING COMMISSION)
WWPX (Channel 60; MARTINSBURG, WV; Owner: PAXSON WASHINGTON-60 LICENSE, INC.)
WJAL (Channel 68; HAGERSTOWN, MD; Owner: ENTRAVISION HOLDINGS, LLC)
W51CY (Channel 51; CHAMBERSBURG, PA; Owner: WBDC BROADCASTING, INC.)
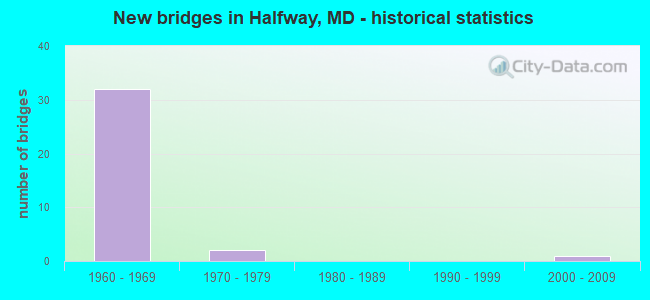
National Bridge Inventory (NBI) Statistics 35 Number of bridges427ft / 130m Total length $14,004,000 Total costs1,319,688 Total average daily traffic128,331 Total average daily truck traffic
New bridges - historical statistics
32 1960-1969 2 1970-1979 1 2000-2009
See full National Bridge Inventory statistics for Halfway, MD
FCC Registered Antenna Towers: 5
Paul McGinn, 18120c West Oak Ridge Drive Hagerstown , Md 21741 (Lat: 39.611639 Lon: -77.742611), Type: 59.4, Overall height: 59.4 m, Registrant: Global Tower, LLC, Fcc-Contact@global-Towers.Com, , Boca -Raton, Phone: (561) 995-0320 Kristin J Landon, 18120c West Oak Ridge Drive Hagerstown , Md 21741 (Lat: 39.611639 Lon: -77.742611), Type: 59.4, Overall height: 59.4 m, Registrant: Strategic Communications Services, Inc., Kristin.Landon@strat-Comm.Com, , Enola, Phone: (570) 996-0142 Kristin J Landon, 18120c West Oak Ridge Drive Hagerstown , Md 21741 (Lat: 39.611639 Lon: -77.742611), Type: 59.4, Overall height: 59.4 m, Registrant: Strategic Communications Services, Inc., Kristin.Landon@strat-Comm.Com, , Enola, Phone: (570) 996-0142 Sheila R Becker, 18120c West Oak Ridge Drive Hagerstown , Md 21741 (Lat: 39.611639 Lon: -77.742611), Type: 59.4, Overall height: 59.4 m, Registrant: Tcp Communications LLC, Sbecker@tcpcommunications.Com, , Bever-ly, Phone: (978) 921-4915 Leslie N Nixon, 18120c West Oak Ridge Drive Hagerstown , Md 21741 (Lat: 39.611639 Lon: -77.742611), Type: 59.4, Overall height: 59.4 m, Registrant: Global Tower, LLC, Fcc-Contact@gtpsites.Com, , Boca -Raton, Phone: (561) 995-0320 FCC Registered Commercial Land Mobile Towers: 1
Lat: 39.617583 Lon: -77.737778, Call Sign: KGI346, Assigned Frequencies: 153.290 MHz, Grant Date: 03/19/1964, Registrant: Regional Broadcasting CoFCC Registered Microwave Towers: 1
WA03SH014, 16907 Virginia Avenue (Lat: 39.610556 Lon: -77.781667), Type: Ltower, Structure height: 76.5 m, Overall height: 82 m, Call Sign: WQRE461, Assigned Frequencies: 10755.0 MHz, 10795.0 MHz, 10755.0 MHz, 10795.0 MHz, 10755.0 MHz, 10795.0 MHz, 10755.0 MHz, 10795.0 MHz, 10755.0 MHz, 10795.0 MHz, 10755.0 MHz, 10795.0 MHz, Grant Date: 04/25/2013, Expiration Date: 04/25/2023, Cancellation Date: 03/19/2021, Certifier: Greg Todd, Registrant: Shentel, 500 Shentel Way, Edinburg, VA 22824, Phone: (540) 984-5286, Fax: (540) 984-8192, Email:
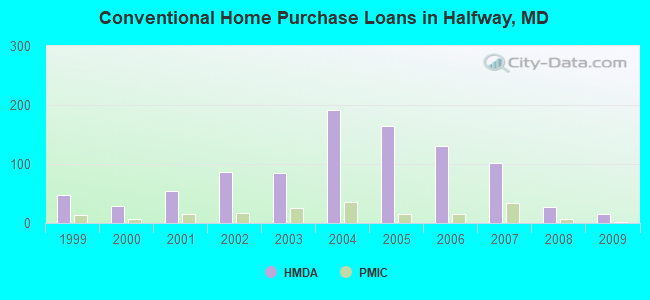
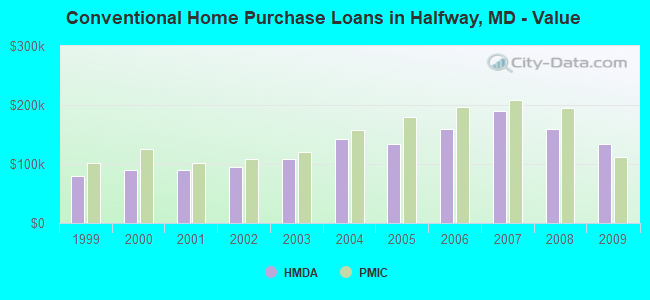
Home Mortgage Disclosure Act Aggregated Statistics For Year 2009(Based on 1 full and 3 partial tracts) A) FHA, FSA/RHS & VA B) Conventional C) Refinancings D) Home Improvement Loans F) Non-occupant Loans on Number Average Value Number Average Value Number Average Value Number Average Value Number Average Value
LOANS ORIGINATED 45 $163,494 16 $133,561 122 $162,314 11 $60,485 11 $119,439 APPLICATIONS APPROVED, NOT ACCEPTED 2 $220,680 1 $80,170 12 $133,957 2 $29,430 0 $0 APPLICATIONS DENIED 4 $199,890 1 $60,000 64 $203,636 10 $66,590 2 $100,590 APPLICATIONS WITHDRAWN 5 $129,146 3 $95,383 40 $190,928 1 $157,190 2 $136,705 FILES CLOSED FOR INCOMPLETENESS 0 $0 1 $55,080 3 $232,203 0 $0 0 $0
Aggregated Statistics For Year 2008(Based on 1 full and 3 partial tracts) A) FHA, FSA/RHS & VA B) Conventional C) Refinancings D) Home Improvement Loans E) Loans on Dwellings For 5+ Families F) Non-occupant Loans on G) Loans On Manufactured Number Average Value Number Average Value Number Average Value Number Average Value Number Average Value Number Average Value Number Average Value
LOANS ORIGINATED 39 $187,434 27 $159,130 106 $168,952 24 $52,797 0 $0 13 $150,634 0 $0 APPLICATIONS APPROVED, NOT ACCEPTED 0 $0 2 $50,275 16 $200,971 3 $15,433 0 $0 1 $126,860 1 $23,550 APPLICATIONS DENIED 3 $197,913 7 $155,936 70 $184,516 13 $87,428 1 $10,000 4 $87,342 1 $32,470 APPLICATIONS WITHDRAWN 4 $188,662 4 $225,655 30 $205,906 4 $86,048 0 $0 0 $0 0 $0 FILES CLOSED FOR INCOMPLETENESS 0 $0 2 $344,315 4 $194,682 3 $102,700 0 $0 0 $0 0 $0
Aggregated Statistics For Year 2007(Based on 1 full and 3 partial tracts) A) FHA, FSA/RHS & VA B) Conventional C) Refinancings D) Home Improvement Loans E) Loans on Dwellings For 5+ Families F) Non-occupant Loans on G) Loans On Manufactured Number Average Value Number Average Value Number Average Value Number Average Value Number Average Value Number Average Value Number Average Value
LOANS ORIGINATED 10 $200,184 101 $190,524 189 $167,327 43 $57,999 1 $393,460 21 $201,909 3 $17,280 APPLICATIONS APPROVED, NOT ACCEPTED 0 $0 13 $154,092 33 $194,762 7 $97,369 0 $0 6 $222,558 1 $75,330 APPLICATIONS DENIED 3 $164,030 18 $176,222 157 $195,084 16 $73,482 0 $0 16 $242,406 3 $35,343 APPLICATIONS WITHDRAWN 0 $0 8 $254,888 83 $210,151 6 $109,497 0 $0 4 $201,278 2 $116,000 FILES CLOSED FOR INCOMPLETENESS 0 $0 1 $269,620 19 $175,251 3 $92,400 0 $0 0 $0 0 $0
Aggregated Statistics For Year 2006(Based on 1 full and 3 partial tracts) A) FHA, FSA/RHS & VA B) Conventional C) Refinancings D) Home Improvement Loans E) Loans on Dwellings For 5+ Families F) Non-occupant Loans on G) Loans On Manufactured Number Average Value Number Average Value Number Average Value Number Average Value Number Average Value Number Average Value Number Average Value
LOANS ORIGINATED 15 $177,965 130 $159,220 251 $157,510 45 $62,480 1 $920,630 37 $148,352 0 $0 APPLICATIONS APPROVED, NOT ACCEPTED 0 $0 18 $159,044 39 $160,251 5 $27,636 0 $0 5 $151,378 2 $47,685 APPLICATIONS DENIED 1 $189,900 18 $146,546 129 $176,215 30 $64,390 1 $255,750 9 $180,604 1 $42,340 APPLICATIONS WITHDRAWN 4 $207,215 16 $157,380 132 $158,891 4 $177,838 0 $0 8 $158,959 0 $0 FILES CLOSED FOR INCOMPLETENESS 0 $0 3 $235,990 39 $176,058 2 $55,365 0 $0 0 $0 0 $0
Aggregated Statistics For Year 2005(Based on 1 full and 3 partial tracts) A) FHA, FSA/RHS & VA B) Conventional C) Refinancings D) Home Improvement Loans F) Non-occupant Loans on G) Loans On Manufactured Number Average Value Number Average Value Number Average Value Number Average Value Number Average Value Number Average Value
LOANS ORIGINATED 12 $201,522 165 $133,779 295 $140,020 46 $82,425 37 $129,012 1 $65,750 APPLICATIONS APPROVED, NOT ACCEPTED 0 $0 13 $131,859 33 $138,012 4 $75,350 2 $168,205 1 $25,620 APPLICATIONS DENIED 1 $222,000 29 $134,909 130 $141,000 28 $42,702 4 $166,315 3 $53,633 APPLICATIONS WITHDRAWN 1 $315,720 20 $147,218 133 $147,520 8 $65,981 11 $150,755 0 $0 FILES CLOSED FOR INCOMPLETENESS 0 $0 5 $136,866 17 $168,678 0 $0 2 $111,000 0 $0
Aggregated Statistics For Year 2004(Based on 1 full and 3 partial tracts) A) FHA, FSA/RHS & VA B) Conventional C) Refinancings D) Home Improvement Loans F) Non-occupant Loans on G) Loans On Manufactured Number Average Value Number Average Value Number Average Value Number Average Value Number Average Value Number Average Value
LOANS ORIGINATED 43 $165,955 191 $141,566 224 $125,067 42 $53,062 38 $119,547 0 $0 APPLICATIONS APPROVED, NOT ACCEPTED 0 $0 15 $117,603 35 $129,049 6 $15,370 3 $144,557 0 $0 APPLICATIONS DENIED 0 $0 25 $138,933 127 $118,264 25 $39,416 8 $104,508 3 $68,717 APPLICATIONS WITHDRAWN 3 $179,820 22 $158,404 146 $124,215 5 $54,006 7 $110,647 0 $0 FILES CLOSED FOR INCOMPLETENESS 0 $0 3 $113,913 18 $159,452 1 $20,000 2 $163,340 0 $0
Aggregated Statistics For Year 2003(Based on 1 full and 3 partial tracts) A) FHA, FSA/RHS & VA B) Conventional C) Refinancings D) Home Improvement Loans E) Loans on Dwellings For 5+ Families F) Non-occupant Loans on Number Average Value Number Average Value Number Average Value Number Average Value Number Average Value Number Average Value
LOANS ORIGINATED 44 $129,245 85 $108,703 417 $102,101 21 $25,512 1 $164,900 28 $100,871 APPLICATIONS APPROVED, NOT ACCEPTED 3 $133,363 7 $139,946 62 $106,123 4 $31,732 0 $0 1 $96,210 APPLICATIONS DENIED 1 $92,690 7 $105,547 118 $105,903 19 $12,978 0 $0 7 $55,547 APPLICATIONS WITHDRAWN 4 $119,765 11 $105,685 118 $118,723 2 $43,780 0 $0 1 $45,900 FILES CLOSED FOR INCOMPLETENESS 0 $0 1 $170,270 7 $116,109 1 $37,360 0 $0 0 $0
Aggregated Statistics For Year 2002(Based on 1 full and 2 partial tracts) A) FHA, FSA/RHS & VA B) Conventional C) Refinancings D) Home Improvement Loans E) Loans on Dwellings For 5+ Families F) Non-occupant Loans on Number Average Value Number Average Value Number Average Value Number Average Value Number Average Value Number Average Value
LOANS ORIGINATED 51 $117,356 86 $94,699 187 $92,584 22 $15,973 3 $121,923 24 $96,187 APPLICATIONS APPROVED, NOT ACCEPTED 2 $85,335 5 $76,860 23 $88,986 2 $15,140 0 $0 2 $92,430 APPLICATIONS DENIED 1 $96,480 12 $84,896 86 $97,650 13 $14,633 0 $0 5 $78,070 APPLICATIONS WITHDRAWN 6 $124,757 3 $84,997 56 $97,519 4 $17,822 0 $0 2 $60,510 FILES CLOSED FOR INCOMPLETENESS 0 $0 1 $149,150 7 $83,073 0 $0 0 $0 0 $0
Aggregated Statistics For Year 2001(Based on 1 full and 2 partial tracts) A) FHA, FSA/RHS & VA B) Conventional C) Refinancings D) Home Improvement Loans E) Loans on Dwellings For 5+ Families F) Non-occupant Loans on Number Average Value Number Average Value Number Average Value Number Average Value Number Average Value Number Average Value
LOANS ORIGINATED 55 $111,959 54 $89,721 149 $90,147 21 $20,828 1 $218,500 11 $87,376 APPLICATIONS APPROVED, NOT ACCEPTED 2 $118,660 4 $83,620 15 $83,137 1 $30,270 0 $0 2 $101,075 APPLICATIONS DENIED 1 $105,000 7 $70,996 70 $82,125 15 $18,286 0 $0 5 $83,894 APPLICATIONS WITHDRAWN 2 $100,455 1 $66,970 45 $95,158 5 $20,364 0 $0 0 $0 FILES CLOSED FOR INCOMPLETENESS 0 $0 0 $0 4 $113,675 0 $0 0 $0 0 $0
Aggregated Statistics For Year 2000(Based on 1 full and 2 partial tracts) A) FHA, FSA/RHS & VA B) Conventional C) Refinancings D) Home Improvement Loans F) Non-occupant Loans on Number Average Value Number Average Value Number Average Value Number Average Value Number Average Value
LOANS ORIGINATED 51 $103,743 28 $89,394 57 $70,179 20 $11,974 2 $47,825 APPLICATIONS APPROVED, NOT ACCEPTED 2 $75,715 3 $60,983 11 $55,915 4 $48,532 0 $0 APPLICATIONS DENIED 3 $96,000 8 $73,806 61 $64,950 23 $11,929 2 $87,690 APPLICATIONS WITHDRAWN 4 $109,200 1 $77,450 23 $72,945 7 $56,567 2 $109,185 FILES CLOSED FOR INCOMPLETENESS 0 $0 0 $0 2 $85,760 0 $0 0 $0
Aggregated Statistics For Year 1999(Based on 1 full and 2 partial tracts) A) FHA, FSA/RHS & VA B) Conventional C) Refinancings D) Home Improvement Loans F) Non-occupant Loans on Number Average Value Number Average Value Number Average Value Number Average Value Number Average Value
LOANS ORIGINATED 44 $92,828 47 $79,664 110 $75,126 32 $16,452 8 $61,684 APPLICATIONS APPROVED, NOT ACCEPTED 0 $0 5 $64,140 20 $78,748 4 $15,612 1 $56,860 APPLICATIONS DENIED 3 $85,453 13 $56,009 52 $72,843 12 $18,379 2 $57,015 APPLICATIONS WITHDRAWN 1 $48,790 2 $80,790 37 $70,297 4 $58,678 0 $0 FILES CLOSED FOR INCOMPLETENESS 0 $0 2 $94,335 5 $69,296 0 $0 0 $0
Detailed HMDA statistics for the following Tracts:
0009.00
, 0010.01 , 0010.02 , 0108.01
Private Mortgage Insurance Companies Aggregated Statistics For Year 2009(Based on 2 partial tracts) A) Conventional B) Refinancings Number Average Value Number Average Value
LOANS ORIGINATED 2 $111,590 1 $124,210 APPLICATIONS APPROVED, NOT ACCEPTED 0 $0 0 $0 APPLICATIONS DENIED 0 $0 1 $182,650 APPLICATIONS WITHDRAWN 0 $0 0 $0 FILES CLOSED FOR INCOMPLETENESS 0 $0 0 $0
Aggregated Statistics For Year 2008(Based on 1 full and 3 partial tracts) A) Conventional B) Refinancings C) Non-occupant Loans on Number Average Value Number Average Value Number Average Value
LOANS ORIGINATED 7 $195,371 6 $186,062 0 $0 APPLICATIONS APPROVED, NOT ACCEPTED 2 $123,495 5 $217,240 1 $149,000 APPLICATIONS DENIED 1 $120,800 0 $0 0 $0 APPLICATIONS WITHDRAWN 0 $0 0 $0 0 $0 FILES CLOSED FOR INCOMPLETENESS 0 $0 0 $0 0 $0
Aggregated Statistics For Year 2007(Based on 1 full and 3 partial tracts) A) Conventional B) Refinancings C) Non-occupant Loans on Number Average Value Number Average Value Number Average Value
LOANS ORIGINATED 34 $208,863 17 $232,842 2 $135,995 APPLICATIONS APPROVED, NOT ACCEPTED 3 $132,007 5 $226,928 0 $0 APPLICATIONS DENIED 0 $0 1 $183,160 0 $0 APPLICATIONS WITHDRAWN 1 $186,580 1 $225,030 0 $0 FILES CLOSED FOR INCOMPLETENESS 0 $0 0 $0 0 $0
Aggregated Statistics For Year 2006(Based on 1 full and 3 partial tracts) A) Conventional B) Refinancings C) Non-occupant Loans on Number Average Value Number Average Value Number Average Value
LOANS ORIGINATED 15 $196,191 13 $208,607 3 $151,927 APPLICATIONS APPROVED, NOT ACCEPTED 1 $118,190 2 $207,105 0 $0 APPLICATIONS DENIED 0 $0 0 $0 0 $0 APPLICATIONS WITHDRAWN 0 $0 0 $0 0 $0 FILES CLOSED FOR INCOMPLETENESS 0 $0 0 $0 0 $0
Aggregated Statistics For Year 2005(Based on 1 full and 3 partial tracts) A) Conventional B) Refinancings C) Non-occupant Loans on Number Average Value Number Average Value Number Average Value
LOANS ORIGINATED 15 $178,929 13 $179,975 3 $132,210 APPLICATIONS APPROVED, NOT ACCEPTED 1 $208,320 2 $160,445 1 $170,570 APPLICATIONS DENIED 0 $0 0 $0 0 $0 APPLICATIONS WITHDRAWN 1 $80,000 0 $0 0 $0 FILES CLOSED FOR INCOMPLETENESS 0 $0 1 $140,000 0 $0
Aggregated Statistics For Year 2004(Based on 1 full and 3 partial tracts) A) Conventional B) Refinancings C) Non-occupant Loans on Number Average Value Number Average Value Number Average Value
LOANS ORIGINATED 36 $158,468 12 $148,949 4 $123,102 APPLICATIONS APPROVED, NOT ACCEPTED 2 $104,815 5 $141,578 0 $0 APPLICATIONS DENIED 0 $0 0 $0 0 $0 APPLICATIONS WITHDRAWN 1 $226,720 0 $0 0 $0 FILES CLOSED FOR INCOMPLETENESS 0 $0 0 $0 0 $0
Aggregated Statistics For Year 2003(Based on 1 full and 3 partial tracts) A) Conventional B) Refinancings C) Non-occupant Loans on Number Average Value Number Average Value Number Average Value
LOANS ORIGINATED 26 $120,997 35 $124,931 4 $101,515 APPLICATIONS APPROVED, NOT ACCEPTED 1 $182,790 5 $124,186 0 $0 APPLICATIONS DENIED 0 $0 0 $0 0 $0 APPLICATIONS WITHDRAWN 1 $126,140 1 $76,910 0 $0 FILES CLOSED FOR INCOMPLETENESS 0 $0 0 $0 0 $0
Aggregated Statistics For Year 2002(Based on 1 full and 2 partial tracts) A) Conventional B) Refinancings C) Non-occupant Loans on Number Average Value Number Average Value Number Average Value
LOANS ORIGINATED 17 $109,217 25 $125,794 3 $92,400 APPLICATIONS APPROVED, NOT ACCEPTED 1 $115,000 4 $100,258 0 $0 APPLICATIONS DENIED 0 $0 1 $90,000 1 $90,000 APPLICATIONS WITHDRAWN 1 $123,320 3 $116,767 1 $123,320 FILES CLOSED FOR INCOMPLETENESS 0 $0 0 $0 0 $0
Aggregated Statistics For Year 2001(Based on 1 full and 2 partial tracts) A) Conventional B) Refinancings C) Non-occupant Loans on Number Average Value Number Average Value Number Average Value
LOANS ORIGINATED 16 $101,964 14 $109,330 3 $79,333 APPLICATIONS APPROVED, NOT ACCEPTED 3 $103,327 1 $153,190 0 $0 APPLICATIONS DENIED 2 $100,855 2 $151,295 0 $0 APPLICATIONS WITHDRAWN 0 $0 0 $0 0 $0 FILES CLOSED FOR INCOMPLETENESS 0 $0 0 $0 0 $0
Aggregated Statistics For Year 2000(Based on 1 full and 2 partial tracts) A) Conventional B) Refinancings Number Average Value Number Average Value
LOANS ORIGINATED 7 $124,861 5 $98,810 APPLICATIONS APPROVED, NOT ACCEPTED 0 $0 1 $81,870 APPLICATIONS DENIED 0 $0 1 $136,000 APPLICATIONS WITHDRAWN 0 $0 0 $0 FILES CLOSED FOR INCOMPLETENESS 0 $0 0 $0
Aggregated Statistics For Year 1999(Based on 1 full and 2 partial tracts) A) Conventional B) Refinancings Number Average Value Number Average Value
LOANS ORIGINATED 13 $101,022 15 $106,436 APPLICATIONS APPROVED, NOT ACCEPTED 0 $0 4 $81,095 APPLICATIONS DENIED 1 $83,240 1 $57,890 APPLICATIONS WITHDRAWN 0 $0 0 $0 FILES CLOSED FOR INCOMPLETENESS 1 $137,000 0 $0
Detailed PMIC statistics for the following Tracts:
0009.00
, 0010.01 , 0010.02 , 0108.01 Halfway compared to Maryland state average:
Median house value below state average. Unemployed percentage significantly below state average. Black race population percentage significantly below state average. Hispanic race population percentage significantly below state average. Median age above state average. Foreign-born population percentage significantly below state average. Length of stay since moving in significantly above state average.
#63 on the list of "Top 101 cities with the most residents born in Costa Rica (population 500+)"
#31 (21740) on the list of "Top 101 zip codes with the most beauty salons in 2005"
#67 on the list of "Top 101 counties with the lowest percentage of residents relocating to foreign countries in 2011"
#77 on the list of "Top 101 counties with the lowest percentage of residents that exercised in the past month"


 Recent articles from our blog. Our writers, many of them Ph.D. graduates or candidates, create easy-to-read articles on a wide variety of topics.

 (22.6 miles