Hastings, Minnesota Submit your own pictures of this city and show them to the world
OSM Map
General Map
Google Map
MSN Map
OSM Map
General Map
Google Map
MSN Map
OSM Map
General Map
Google Map
MSN Map
OSM Map
General Map
Google Map
MSN Map
Please wait while loading the map...
Population in 2022: 21,712 (99% urban, 1% rural). Population change since 2000: +19.3%Males: 11,408 Females: 10,304
March 2022 cost of living index in Hastings: 112.7 (more than average, U.S. average is 100) Percentage of residents living in poverty in 2022: 6.1%for White Non-Hispanic residents , 15.8% for Black residents , 0.5% for Hispanic or Latino residents , 30.2% for other race residents , 23.7% for two or more races residents )
Profiles of local businesses
Business Search - 14 Million verified businesses
Data:
Median household income ($)
Median household income (% change since 2000)
Household income diversity
Ratio of average income to average house value (%)
Ratio of average income to average rent
Median household income ($) - White
Median household income ($) - Black or African American
Median household income ($) - Asian
Median household income ($) - Hispanic or Latino
Median household income ($) - American Indian and Alaska Native
Median household income ($) - Multirace
Median household income ($) - Other Race
Median household income for houses/condos with a mortgage ($)
Median household income for apartments without a mortgage ($)
Races - White alone (%)
Races - White alone (% change since 2000)
Races - Black alone (%)
Races - Black alone (% change since 2000)
Races - American Indian alone (%)
Races - American Indian alone (% change since 2000)
Races - Asian alone (%)
Races - Asian alone (% change since 2000)
Races - Hispanic (%)
Races - Hispanic (% change since 2000)
Races - Native Hawaiian and Other Pacific Islander alone (%)
Races - Native Hawaiian and Other Pacific Islander alone (% change since 2000)
Races - Two or more races (%)
Races - Two or more races (% change since 2000)
Races - Other race alone (%)
Races - Other race alone (% change since 2000)
Racial diversity
Unemployment (%)
Unemployment (% change since 2000)
Unemployment (%) - White
Unemployment (%) - Black or African American
Unemployment (%) - Asian
Unemployment (%) - Hispanic or Latino
Unemployment (%) - American Indian and Alaska Native
Unemployment (%) - Multirace
Unemployment (%) - Other Race
Population density (people per square mile)
Population - Males (%)
Population - Females (%)
Population - Males (%) - White
Population - Males (%) - Black or African American
Population - Males (%) - Asian
Population - Males (%) - Hispanic or Latino
Population - Males (%) - American Indian and Alaska Native
Population - Males (%) - Multirace
Population - Males (%) - Other Race
Population - Females (%) - White
Population - Females (%) - Black or African American
Population - Females (%) - Asian
Population - Females (%) - Hispanic or Latino
Population - Females (%) - American Indian and Alaska Native
Population - Females (%) - Multirace
Population - Females (%) - Other Race
Coronavirus confirmed cases (Jun 16, 2024)
Deaths caused by coronavirus (Jun 16, 2024)
Coronavirus confirmed cases (per 100k population) (Jun 16, 2024)
Deaths caused by coronavirus (per 100k population) (Jun 16, 2024)
Daily increase in number of cases (Jun 16, 2024)
Weekly increase in number of cases (Jun 16, 2024)
Cases doubled (in days) (Jun 16, 2024)
Hospitalized patients (Apr 18, 2022)
Negative test results (Apr 18, 2022)
Total test results (Apr 18, 2022)
COVID Vaccine doses distributed (per 100k population) (Sep 19, 2023)
COVID Vaccine doses administered (per 100k population) (Sep 19, 2023)
COVID Vaccine doses distributed (Sep 19, 2023)
COVID Vaccine doses administered (Sep 19, 2023)
Likely homosexual households (%)
Likely homosexual households (% change since 2000)
Likely homosexual households - Lesbian couples (%)
Likely homosexual households - Lesbian couples (% change since 2000)
Likely homosexual households - Gay men (%)
Likely homosexual households - Gay men (% change since 2000)
Cost of living index
Median gross rent ($)
Median contract rent ($)
Median monthly housing costs ($)
Median house or condo value ($)
Median house or condo value ($ change since 2000)
Mean house or condo value by units in structure - 1, detached ($)
Mean house or condo value by units in structure - 1, attached ($)
Mean house or condo value by units in structure - 2 ($)
Mean house or condo value by units in structure by units in structure - 3 or 4 ($)
Mean house or condo value by units in structure - 5 or more ($)
Mean house or condo value by units in structure - Boat, RV, van, etc. ($)
Mean house or condo value by units in structure - Mobile home ($)
Median house or condo value ($) - White
Median house or condo value ($) - Black or African American
Median house or condo value ($) - Asian
Median house or condo value ($) - Hispanic or Latino
Median house or condo value ($) - American Indian and Alaska Native
Median house or condo value ($) - Multirace
Median house or condo value ($) - Other Race
Median resident age
Resident age diversity
Median resident age - Males
Median resident age - Females
Median resident age - White
Median resident age - Black or African American
Median resident age - Asian
Median resident age - Hispanic or Latino
Median resident age - American Indian and Alaska Native
Median resident age - Multirace
Median resident age - Other Race
Median resident age - Males - White
Median resident age - Males - Black or African American
Median resident age - Males - Asian
Median resident age - Males - Hispanic or Latino
Median resident age - Males - American Indian and Alaska Native
Median resident age - Males - Multirace
Median resident age - Males - Other Race
Median resident age - Females - White
Median resident age - Females - Black or African American
Median resident age - Females - Asian
Median resident age - Females - Hispanic or Latino
Median resident age - Females - American Indian and Alaska Native
Median resident age - Females - Multirace
Median resident age - Females - Other Race
Commute - mean travel time to work (minutes)
Travel time to work - Less than 5 minutes (%)
Travel time to work - Less than 5 minutes (% change since 2000)
Travel time to work - 5 to 9 minutes (%)
Travel time to work - 5 to 9 minutes (% change since 2000)
Travel time to work - 10 to 19 minutes (%)
Travel time to work - 10 to 19 minutes (% change since 2000)
Travel time to work - 20 to 29 minutes (%)
Travel time to work - 20 to 29 minutes (% change since 2000)
Travel time to work - 30 to 39 minutes (%)
Travel time to work - 30 to 39 minutes (% change since 2000)
Travel time to work - 40 to 59 minutes (%)
Travel time to work - 40 to 59 minutes (% change since 2000)
Travel time to work - 60 to 89 minutes (%)
Travel time to work - 60 to 89 minutes (% change since 2000)
Travel time to work - 90 or more minutes (%)
Travel time to work - 90 or more minutes (% change since 2000)
Marital status - Never married (%)
Marital status - Now married (%)
Marital status - Separated (%)
Marital status - Widowed (%)
Marital status - Divorced (%)
Median family income ($)
Median family income (% change since 2000)
Median non-family income ($)
Median non-family income (% change since 2000)
Median per capita income ($)
Median per capita income (% change since 2000)
Median family income ($) - White
Median family income ($) - Black or African American
Median family income ($) - Asian
Median family income ($) - Hispanic or Latino
Median family income ($) - American Indian and Alaska Native
Median family income ($) - Multirace
Median family income ($) - Other Race
Median year house/condo built
Median year apartment built
Year house built - Built 2005 or later (%)
Year house built - Built 2000 to 2004 (%)
Year house built - Built 1990 to 1999 (%)
Year house built - Built 1980 to 1989 (%)
Year house built - Built 1970 to 1979 (%)
Year house built - Built 1960 to 1969 (%)
Year house built - Built 1950 to 1959 (%)
Year house built - Built 1940 to 1949 (%)
Year house built - Built 1939 or earlier (%)
Average household size
Household density (households per square mile)
Average household size - White
Average household size - Black or African American
Average household size - Asian
Average household size - Hispanic or Latino
Average household size - American Indian and Alaska Native
Average household size - Multirace
Average household size - Other Race
Occupied housing units (%)
Vacant housing units (%)
Owner occupied housing units (%)
Renter occupied housing units (%)
Vacancy status - For rent (%)
Vacancy status - For sale only (%)
Vacancy status - Rented or sold, not occupied (%)
Vacancy status - For seasonal, recreational, or occasional use (%)
Vacancy status - For migrant workers (%)
Vacancy status - Other vacant (%)
Residents with income below the poverty level (%)
Residents with income below 50% of the poverty level (%)
Children below poverty level (%)
Poor families by family type - Married-couple family (%)
Poor families by family type - Male, no wife present (%)
Poor families by family type - Female, no husband present (%)
Poverty status for native-born residents (%)
Poverty status for foreign-born residents (%)
Poverty among high school graduates not in families (%)
Poverty among people who did not graduate high school not in families (%)
Residents with income below the poverty level (%) - White
Residents with income below the poverty level (%) - Black or African American
Residents with income below the poverty level (%) - Asian
Residents with income below the poverty level (%) - Hispanic or Latino
Residents with income below the poverty level (%) - American Indian and Alaska Native
Residents with income below the poverty level (%) - Multirace
Residents with income below the poverty level (%) - Other Race
Air pollution - Air Quality Index (AQI)
Air pollution - CO
Air pollution - NO2
Air pollution - SO2
Air pollution - Ozone
Air pollution - PM10
Air pollution - PM25
Air pollution - Pb
Crime - Murders per 100,000 population
Crime - Rapes per 100,000 population
Crime - Robberies per 100,000 population
Crime - Assaults per 100,000 population
Crime - Burglaries per 100,000 population
Crime - Thefts per 100,000 population
Crime - Auto thefts per 100,000 population
Crime - Arson per 100,000 population
Crime - City-data.com crime index
Crime - Violent crime index
Crime - Property crime index
Crime - Murders per 100,000 population (5 year average)
Crime - Rapes per 100,000 population (5 year average)
Crime - Robberies per 100,000 population (5 year average)
Crime - Assaults per 100,000 population (5 year average)
Crime - Burglaries per 100,000 population (5 year average)
Crime - Thefts per 100,000 population (5 year average)
Crime - Auto thefts per 100,000 population (5 year average)
Crime - Arson per 100,000 population (5 year average)
Crime - City-data.com crime index (5 year average)
Crime - Violent crime index (5 year average)
Crime - Property crime index (5 year average)
1996 Presidential Elections Results (%) - Democratic Party (Clinton)
1996 Presidential Elections Results (%) - Republican Party (Dole)
1996 Presidential Elections Results (%) - Other
2000 Presidential Elections Results (%) - Democratic Party (Gore)
2000 Presidential Elections Results (%) - Republican Party (Bush)
2000 Presidential Elections Results (%) - Other
2004 Presidential Elections Results (%) - Democratic Party (Kerry)
2004 Presidential Elections Results (%) - Republican Party (Bush)
2004 Presidential Elections Results (%) - Other
2008 Presidential Elections Results (%) - Democratic Party (Obama)
2008 Presidential Elections Results (%) - Republican Party (McCain)
2008 Presidential Elections Results (%) - Other
2012 Presidential Elections Results (%) - Democratic Party (Obama)
2012 Presidential Elections Results (%) - Republican Party (Romney)
2012 Presidential Elections Results (%) - Other
2016 Presidential Elections Results (%) - Democratic Party (Clinton)
2016 Presidential Elections Results (%) - Republican Party (Trump)
2016 Presidential Elections Results (%) - Other
2020 Presidential Elections Results (%) - Democratic Party (Biden)
2020 Presidential Elections Results (%) - Republican Party (Trump)
2020 Presidential Elections Results (%) - Other
Ancestries Reported - Arab (%)
Ancestries Reported - Czech (%)
Ancestries Reported - Danish (%)
Ancestries Reported - Dutch (%)
Ancestries Reported - English (%)
Ancestries Reported - French (%)
Ancestries Reported - French Canadian (%)
Ancestries Reported - German (%)
Ancestries Reported - Greek (%)
Ancestries Reported - Hungarian (%)
Ancestries Reported - Irish (%)
Ancestries Reported - Italian (%)
Ancestries Reported - Lithuanian (%)
Ancestries Reported - Norwegian (%)
Ancestries Reported - Polish (%)
Ancestries Reported - Portuguese (%)
Ancestries Reported - Russian (%)
Ancestries Reported - Scotch-Irish (%)
Ancestries Reported - Scottish (%)
Ancestries Reported - Slovak (%)
Ancestries Reported - Subsaharan African (%)
Ancestries Reported - Swedish (%)
Ancestries Reported - Swiss (%)
Ancestries Reported - Ukrainian (%)
Ancestries Reported - United States (%)
Ancestries Reported - Welsh (%)
Ancestries Reported - West Indian (%)
Ancestries Reported - Other (%)
Educational Attainment - No schooling completed (%)
Educational Attainment - Less than high school (%)
Educational Attainment - High school or equivalent (%)
Educational Attainment - Less than 1 year of college (%)
Educational Attainment - 1 or more years of college (%)
Educational Attainment - Associate degree (%)
Educational Attainment - Bachelor's degree (%)
Educational Attainment - Master's degree (%)
Educational Attainment - Professional school degree (%)
Educational Attainment - Doctorate degree (%)
School Enrollment - Nursery, preschool (%)
School Enrollment - Kindergarten (%)
School Enrollment - Grade 1 to 4 (%)
School Enrollment - Grade 5 to 8 (%)
School Enrollment - Grade 9 to 12 (%)
School Enrollment - College undergrad (%)
School Enrollment - Graduate or professional (%)
School Enrollment - Not enrolled in school (%)
School enrollment - Public schools (%)
School enrollment - Private schools (%)
School enrollment - Not enrolled (%)
Median number of rooms in houses and condos
Median number of rooms in apartments
Housing units lacking complete plumbing facilities (%)
Housing units lacking complete kitchen facilities (%)
Density of houses
Urban houses (%)
Rural houses (%)
Households with people 60 years and over (%)
Households with people 65 years and over (%)
Households with people 75 years and over (%)
Households with one or more nonrelatives (%)
Households with no nonrelatives (%)
Population in households (%)
Family households (%)
Nonfamily households (%)
Population in families (%)
Family households with own children (%)
Median number of bedrooms in owner occupied houses
Mean number of bedrooms in owner occupied houses
Median number of bedrooms in renter occupied houses
Mean number of bedrooms in renter occupied houses
Median number of vehichles in owner occupied houses
Mean number of vehichles in owner occupied houses
Median number of vehichles in renter occupied houses
Mean number of vehichles in renter occupied houses
Mortgage status - with mortgage (%)
Mortgage status - with second mortgage (%)
Mortgage status - with home equity loan (%)
Mortgage status - with both second mortgage and home equity loan (%)
Mortgage status - without a mortgage (%)
Average family size
Average family size - White
Average family size - Black or African American
Average family size - Asian
Average family size - Hispanic or Latino
Average family size - American Indian and Alaska Native
Average family size - Multirace
Average family size - Other Race
Geographical mobility - Same house 1 year ago (%)
Geographical mobility - Moved within same county (%)
Geographical mobility - Moved from different county within same state (%)
Geographical mobility - Moved from different state (%)
Geographical mobility - Moved from abroad (%)
Place of birth - Born in state of residence (%)
Place of birth - Born in other state (%)
Place of birth - Native, outside of US (%)
Place of birth - Foreign born (%)
Housing units in structures - 1, detached (%)
Housing units in structures - 1, attached (%)
Housing units in structures - 2 (%)
Housing units in structures - 3 or 4 (%)
Housing units in structures - 5 to 9 (%)
Housing units in structures - 10 to 19 (%)
Housing units in structures - 20 to 49 (%)
Housing units in structures - 50 or more (%)
Housing units in structures - Mobile home (%)
Housing units in structures - Boat, RV, van, etc. (%)
House/condo owner moved in on average (years ago)
Renter moved in on average (years ago)
Year householder moved into unit - Moved in 1999 to March 2000 (%)
Year householder moved into unit - Moved in 1995 to 1998 (%)
Year householder moved into unit - Moved in 1990 to 1994 (%)
Year householder moved into unit - Moved in 1980 to 1989 (%)
Year householder moved into unit - Moved in 1970 to 1979 (%)
Year householder moved into unit - Moved in 1969 or earlier (%)
Means of transportation to work - Drove car alone (%)
Means of transportation to work - Carpooled (%)
Means of transportation to work - Public transportation (%)
Means of transportation to work - Bus or trolley bus (%)
Means of transportation to work - Streetcar or trolley car (%)
Means of transportation to work - Subway or elevated (%)
Means of transportation to work - Railroad (%)
Means of transportation to work - Ferryboat (%)
Means of transportation to work - Taxicab (%)
Means of transportation to work - Motorcycle (%)
Means of transportation to work - Bicycle (%)
Means of transportation to work - Walked (%)
Means of transportation to work - Other means (%)
Working at home (%)
Industry diversity
Most Common Industries - Agriculture, forestry, fishing and hunting, and mining (%)
Most Common Industries - Agriculture, forestry, fishing and hunting (%)
Most Common Industries - Mining, quarrying, and oil and gas extraction (%)
Most Common Industries - Construction (%)
Most Common Industries - Manufacturing (%)
Most Common Industries - Wholesale trade (%)
Most Common Industries - Retail trade (%)
Most Common Industries - Transportation and warehousing, and utilities (%)
Most Common Industries - Transportation and warehousing (%)
Most Common Industries - Utilities (%)
Most Common Industries - Information (%)
Most Common Industries - Finance and insurance, and real estate and rental and leasing (%)
Most Common Industries - Finance and insurance (%)
Most Common Industries - Real estate and rental and leasing (%)
Most Common Industries - Professional, scientific, and management, and administrative and waste management services (%)
Most Common Industries - Professional, scientific, and technical services (%)
Most Common Industries - Management of companies and enterprises (%)
Most Common Industries - Administrative and support and waste management services (%)
Most Common Industries - Educational services, and health care and social assistance (%)
Most Common Industries - Educational services (%)
Most Common Industries - Health care and social assistance (%)
Most Common Industries - Arts, entertainment, and recreation, and accommodation and food services (%)
Most Common Industries - Arts, entertainment, and recreation (%)
Most Common Industries - Accommodation and food services (%)
Most Common Industries - Other services, except public administration (%)
Most Common Industries - Public administration (%)
Occupation diversity
Most Common Occupations - Management, business, science, and arts occupations (%)
Most Common Occupations - Management, business, and financial occupations (%)
Most Common Occupations - Management occupations (%)
Most Common Occupations - Business and financial operations occupations (%)
Most Common Occupations - Computer, engineering, and science occupations (%)
Most Common Occupations - Computer and mathematical occupations (%)
Most Common Occupations - Architecture and engineering occupations (%)
Most Common Occupations - Life, physical, and social science occupations (%)
Most Common Occupations - Education, legal, community service, arts, and media occupations (%)
Most Common Occupations - Community and social service occupations (%)
Most Common Occupations - Legal occupations (%)
Most Common Occupations - Education, training, and library occupations (%)
Most Common Occupations - Arts, design, entertainment, sports, and media occupations (%)
Most Common Occupations - Healthcare practitioners and technical occupations (%)
Most Common Occupations - Health diagnosing and treating practitioners and other technical occupations (%)
Most Common Occupations - Health technologists and technicians (%)
Most Common Occupations - Service occupations (%)
Most Common Occupations - Healthcare support occupations (%)
Most Common Occupations - Protective service occupations (%)
Most Common Occupations - Fire fighting and prevention, and other protective service workers including supervisors (%)
Most Common Occupations - Law enforcement workers including supervisors (%)
Most Common Occupations - Food preparation and serving related occupations (%)
Most Common Occupations - Building and grounds cleaning and maintenance occupations (%)
Most Common Occupations - Personal care and service occupations (%)
Most Common Occupations - Sales and office occupations (%)
Most Common Occupations - Sales and related occupations (%)
Most Common Occupations - Office and administrative support occupations (%)
Most Common Occupations - Natural resources, construction, and maintenance occupations (%)
Most Common Occupations - Farming, fishing, and forestry occupations (%)
Most Common Occupations - Construction and extraction occupations (%)
Most Common Occupations - Installation, maintenance, and repair occupations (%)
Most Common Occupations - Production, transportation, and material moving occupations (%)
Most Common Occupations - Production occupations (%)
Most Common Occupations - Transportation occupations (%)
Most Common Occupations - Material moving occupations (%)
People in Group quarters - Institutionalized population (%)
People in Group quarters - Correctional institutions (%)
People in Group quarters - Federal prisons and detention centers (%)
People in Group quarters - Halfway houses (%)
People in Group quarters - Local jails and other confinement facilities (including police lockups) (%)
People in Group quarters - Military disciplinary barracks (%)
People in Group quarters - State prisons (%)
People in Group quarters - Other types of correctional institutions (%)
People in Group quarters - Nursing homes (%)
People in Group quarters - Hospitals/wards, hospices, and schools for the handicapped (%)
People in Group quarters - Hospitals/wards and hospices for chronically ill (%)
People in Group quarters - Hospices or homes for chronically ill (%)
People in Group quarters - Military hospitals or wards for chronically ill (%)
People in Group quarters - Other hospitals or wards for chronically ill (%)
People in Group quarters - Hospitals or wards for drug/alcohol abuse (%)
People in Group quarters - Mental (Psychiatric) hospitals or wards (%)
People in Group quarters - Schools, hospitals, or wards for the mentally retarded (%)
People in Group quarters - Schools, hospitals, or wards for the physically handicapped (%)
People in Group quarters - Institutions for the deaf (%)
People in Group quarters - Institutions for the blind (%)
People in Group quarters - Orthopedic wards and institutions for the physically handicapped (%)
People in Group quarters - Wards in general hospitals for patients who have no usual home elsewhere (%)
People in Group quarters - Wards in military hospitals for patients who have no usual home elsewhere (%)
People in Group quarters - Juvenile institutions (%)
People in Group quarters - Long-term care (%)
People in Group quarters - Homes for abused, dependent, and neglected children (%)
People in Group quarters - Residential treatment centers for emotionally disturbed children (%)
People in Group quarters - Training schools for juvenile delinquents (%)
People in Group quarters - Short-term care, detention or diagnostic centers for delinquent children (%)
People in Group quarters - Type of juvenile institution unknown (%)
People in Group quarters - Noninstitutionalized population (%)
People in Group quarters - College dormitories (includes college quarters off campus) (%)
People in Group quarters - Military quarters (%)
People in Group quarters - On base (%)
People in Group quarters - Barracks, unaccompanied personnel housing (UPH), (Enlisted/Officer), ;and similar group living quarters for military personnel (%)
People in Group quarters - Transient quarters for temporary residents (%)
People in Group quarters - Military ships (%)
People in Group quarters - Group homes (%)
People in Group quarters - Homes or halfway houses for drug/alcohol abuse (%)
People in Group quarters - Homes for the mentally ill (%)
People in Group quarters - Homes for the mentally retarded (%)
People in Group quarters - Homes for the physically handicapped (%)
People in Group quarters - Other group homes (%)
People in Group quarters - Religious group quarters (%)
People in Group quarters - Dormitories (%)
People in Group quarters - Agriculture workers' dormitories on farms (%)
People in Group quarters - Job Corps and vocational training facilities (%)
People in Group quarters - Other workers' dormitories (%)
People in Group quarters - Crews of maritime vessels (%)
People in Group quarters - Other nonhousehold living situations (%)
People in Group quarters - Other noninstitutional group quarters (%)
Residents speaking English at home (%)
Residents speaking English at home - Born in the United States (%)
Residents speaking English at home - Native, born elsewhere (%)
Residents speaking English at home - Foreign born (%)
Residents speaking Spanish at home (%)
Residents speaking Spanish at home - Born in the United States (%)
Residents speaking Spanish at home - Native, born elsewhere (%)
Residents speaking Spanish at home - Foreign born (%)
Residents speaking other language at home (%)
Residents speaking other language at home - Born in the United States (%)
Residents speaking other language at home - Native, born elsewhere (%)
Residents speaking other language at home - Foreign born (%)
Class of Workers - Employee of private company (%)
Class of Workers - Self-employed in own incorporated business (%)
Class of Workers - Private not-for-profit wage and salary workers (%)
Class of Workers - Local government workers (%)
Class of Workers - State government workers (%)
Class of Workers - Federal government workers (%)
Class of Workers - Self-employed workers in own not incorporated business and Unpaid family workers (%)
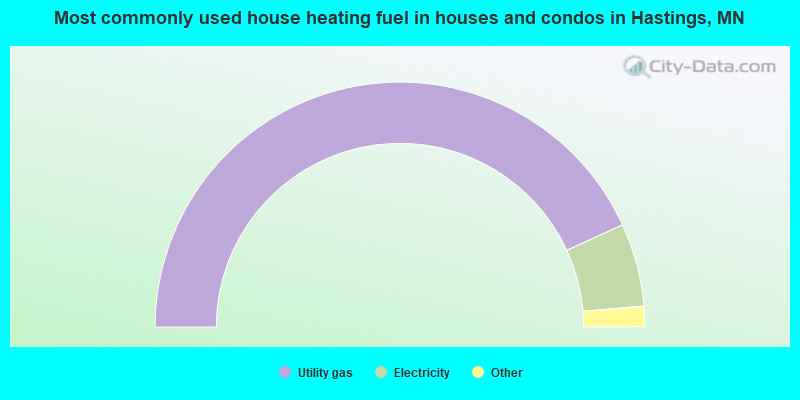
House heating fuel used in houses and condos - Utility gas (%)
House heating fuel used in houses and condos - Bottled, tank, or LP gas (%)
House heating fuel used in houses and condos - Electricity (%)
House heating fuel used in houses and condos - Fuel oil, kerosene, etc. (%)
House heating fuel used in houses and condos - Coal or coke (%)
House heating fuel used in houses and condos - Wood (%)
House heating fuel used in houses and condos - Solar energy (%)
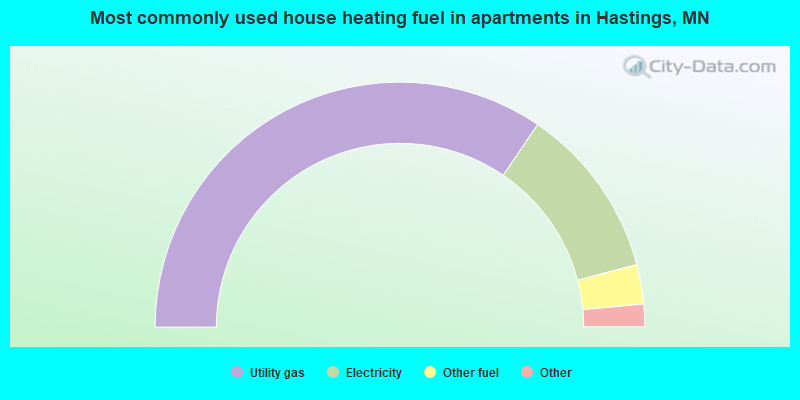
House heating fuel used in houses and condos - Other fuel (%)
House heating fuel used in houses and condos - No fuel used (%)
House heating fuel used in apartments - Utility gas (%)
House heating fuel used in apartments - Bottled, tank, or LP gas (%)
House heating fuel used in apartments - Electricity (%)
House heating fuel used in apartments - Fuel oil, kerosene, etc. (%)
House heating fuel used in apartments - Coal or coke (%)
House heating fuel used in apartments - Wood (%)
House heating fuel used in apartments - Solar energy (%)
House heating fuel used in apartments - Other fuel (%)
House heating fuel used in apartments - No fuel used (%)
Armed forces status - In Armed Forces (%)
Armed forces status - Civilian (%)
Armed forces status - Civilian - Veteran (%)
Armed forces status - Civilian - Nonveteran (%)
Fatal accidents locations in years 2005-2021
Fatal accidents locations in 2005
Fatal accidents locations in 2006
Fatal accidents locations in 2007
Fatal accidents locations in 2008
Fatal accidents locations in 2009
Fatal accidents locations in 2010
Fatal accidents locations in 2011
Fatal accidents locations in 2012
Fatal accidents locations in 2013
Fatal accidents locations in 2014
Fatal accidents locations in 2015
Fatal accidents locations in 2016
Fatal accidents locations in 2017
Fatal accidents locations in 2018
Fatal accidents locations in 2019
Fatal accidents locations in 2020
Fatal accidents locations in 2021
Alcohol use - People drinking some alcohol every month (%)
Alcohol use - People not drinking at all (%)
Alcohol use - Average days/month drinking alcohol
Alcohol use - Average drinks/week
Alcohol use - Average days/year people drink much
Audiometry - Average condition of hearing (%)
Audiometry - People that can hear a whisper from across a quiet room (%)
Audiometry - People that can hear normal voice from across a quiet room (%)
Audiometry - Ears ringing, roaring, buzzing (%)
Audiometry - Had a job exposure to loud noise (%)
Audiometry - Had off-work exposure to loud noise (%)
Blood Pressure & Cholesterol - Has high blood pressure (%)
Blood Pressure & Cholesterol - Checking blood pressure at home (%)
Blood Pressure & Cholesterol - Frequently checking blood cholesterol (%)
Blood Pressure & Cholesterol - Has high cholesterol level (%)
Consumer Behavior - Money monthly spent on food at supermarket/grocery store
Consumer Behavior - Money monthly spent on food at other stores
Consumer Behavior - Money monthly spent on eating out
Consumer Behavior - Money monthly spent on carryout/delivered foods
Consumer Behavior - Income spent on food at supermarket/grocery store (%)
Consumer Behavior - Income spent on food at other stores (%)
Consumer Behavior - Income spent on eating out (%)
Consumer Behavior - Income spent on carryout/delivered foods (%)
Current Health Status - General health condition (%)
Current Health Status - Blood donors (%)
Current Health Status - Has blood ever tested for HIV virus (%)
Current Health Status - Left-handed people (%)
Dermatology - People using sunscreen (%)
Diabetes - Diabetics (%)
Diabetes - Had a blood test for high blood sugar (%)
Diabetes - People taking insulin (%)
Diet Behavior & Nutrition - Diet health (%)
Diet Behavior & Nutrition - Milk product consumption (# of products/month)
Diet Behavior & Nutrition - Meals not home prepared (#/week)
Diet Behavior & Nutrition - Meals from fast food or pizza place (#/week)
Diet Behavior & Nutrition - Ready-to-eat foods (#/month)
Diet Behavior & Nutrition - Frozen meals/pizza (#/month)
Drug Use - People that ever used marijuana or hashish (%)
Drug Use - Ever used hard drugs (%)
Drug Use - Ever used any form of cocaine (%)
Drug Use - Ever used heroin (%)
Drug Use - Ever used methamphetamine (%)
Health Insurance - People covered by health insurance (%)
Kidney Conditions-Urology - Avg. # of times urinating at night
Medical Conditions - People with asthma (%)
Medical Conditions - People with anemia (%)
Medical Conditions - People with psoriasis (%)
Medical Conditions - People with overweight (%)
Medical Conditions - Elderly people having difficulties in thinking or remembering (%)
Medical Conditions - People who ever received blood transfusion (%)
Medical Conditions - People having trouble seeing even with glass/contacts (%)
Medical Conditions - People with arthritis (%)
Medical Conditions - People with gout (%)
Medical Conditions - People with congestive heart failure (%)
Medical Conditions - People with coronary heart disease (%)
Medical Conditions - People with angina pectoris (%)
Medical Conditions - People who ever had heart attack (%)
Medical Conditions - People who ever had stroke (%)
Medical Conditions - People with emphysema (%)
Medical Conditions - People with thyroid problem (%)
Medical Conditions - People with chronic bronchitis (%)
Medical Conditions - People with any liver condition (%)
Medical Conditions - People who ever had cancer or malignancy (%)
Mental Health - People who have little interest in doing things (%)
Mental Health - People feeling down, depressed, or hopeless (%)
Mental Health - People who have trouble sleeping or sleeping too much (%)
Mental Health - People feeling tired or having little energy (%)
Mental Health - People with poor appetite or overeating (%)
Mental Health - People feeling bad about themself (%)
Mental Health - People who have trouble concentrating on things (%)
Mental Health - People moving or speaking slowly or too fast (%)
Mental Health - People having thoughts they would be better off dead (%)
Oral Health - Average years since last visit a dentist
Oral Health - People embarrassed because of mouth (%)
Oral Health - People with gum disease (%)
Oral Health - General health of teeth and gums (%)
Oral Health - Average days a week using dental floss/device
Oral Health - Average days a week using mouthwash for dental problem
Oral Health - Average number of teeth
Pesticide Use - Households using pesticides to control insects (%)
Pesticide Use - Households using pesticides to kill weeds (%)
Physical Activity - People doing vigorous-intensity work activities (%)
Physical Activity - People doing moderate-intensity work activities (%)
Physical Activity - People walking or bicycling (%)
Physical Activity - People doing vigorous-intensity recreational activities (%)
Physical Activity - People doing moderate-intensity recreational activities (%)
Physical Activity - Average hours a day doing sedentary activities
Physical Activity - Average hours a day watching TV or videos
Physical Activity - Average hours a day using computer
Physical Functioning - People having limitations keeping them from working (%)
Physical Functioning - People limited in amount of work they can do (%)
Physical Functioning - People that need special equipment to walk (%)
Physical Functioning - People experiencing confusion/memory problems (%)
Physical Functioning - People requiring special healthcare equipment (%)
Prescription Medications - Average number of prescription medicines taking
Preventive Aspirin Use - Adults 40+ taking low-dose aspirin (%)
Reproductive Health - Vaginal deliveries (%)
Reproductive Health - Cesarean deliveries (%)
Reproductive Health - Deliveries resulted in a live birth (%)
Reproductive Health - Pregnancies resulted in a delivery (%)
Reproductive Health - Women breastfeeding newborns (%)
Reproductive Health - Women that had a hysterectomy (%)
Reproductive Health - Women that had both ovaries removed (%)
Reproductive Health - Women that have ever taken birth control pills (%)
Reproductive Health - Women taking birth control pills (%)
Reproductive Health - Women that have ever used Depo-Provera or injectables (%)
Reproductive Health - Women that have ever used female hormones (%)
Sexual Behavior - People 18+ that ever had sex (vaginal, anal, or oral) (%)
Sexual Behavior - Males 18+ that ever had vaginal sex with a woman (%)
Sexual Behavior - Males 18+ that ever performed oral sex on a woman (%)
Sexual Behavior - Males 18+ that ever had anal sex with a woman (%)
Sexual Behavior - Males 18+ that ever had any sex with a man (%)
Sexual Behavior - Females 18+ that ever had vaginal sex with a man (%)
Sexual Behavior - Females 18+ that ever performed oral sex on a man (%)
Sexual Behavior - Females 18+ that ever had anal sex with a man (%)
Sexual Behavior - Females 18+ that ever had any kind of sex with a woman (%)
Sexual Behavior - Average age people first had sex
Sexual Behavior - Average number of female sex partners in lifetime (males 18+)
Sexual Behavior - Average number of female vaginal sex partners in lifetime (males 18+)
Sexual Behavior - Average age people first performed oral sex on a woman (18+)
Sexual Behavior - Average number of woman performed oral sex on in lifetime (18+)
Sexual Behavior - Average number of male sex partners in lifetime (males 18+)
Sexual Behavior - Average number of male anal sex partners in lifetime (males 18+)
Sexual Behavior - Average age people first performed oral sex on a man (18+)
Sexual Behavior - Average number of male oral sex partners in lifetime (18+)
Sexual Behavior - People using protection when performing oral sex (%)
Sexual Behavior - Average number of times people have vaginal or anal sex a year
Sexual Behavior - People having sex without condom (%)
Sexual Behavior - Average number of male sex partners in lifetime (females 18+)
Sexual Behavior - Average number of male vaginal sex partners in lifetime (females 18+)
Sexual Behavior - Average number of female sex partners in lifetime (females 18+)
Sexual Behavior - Circumcised males 18+ (%)
Sleep Disorders - Average hours sleeping at night
Sleep Disorders - People that has trouble sleeping (%)
Smoking-Cigarette Use - People smoking cigarettes (%)
Taste & Smell - People 40+ having problems with smell (%)
Taste & Smell - People 40+ having problems with taste (%)
Taste & Smell - People 40+ that ever had wisdom teeth removed (%)
Taste & Smell - People 40+ that ever had tonsils teeth removed (%)
Taste & Smell - People 40+ that ever had a loss of consciousness because of a head injury (%)
Taste & Smell - People 40+ that ever had a broken nose or other serious injury to face or skull (%)
Taste & Smell - People 40+ that ever had two or more sinus infections (%)
Weight - Average height (inches)
Weight - Average weight (pounds)
Weight - Average BMI
Weight - People that are obese (%)
Weight - People that ever were obese (%)
Weight - People trying to lose weight (%)
According to our research of Minnesota and other state lists, there was 1 registered sex offender living in Hastings, Minnesota as of June 16, 2024 . The ratio of all residents to sex offenders in Hastings is 22,833 to 1.The ratio of registered sex offenders to all residents in this city is much lower than the state average.
Officers per 1,000 residents here:
1.31Minnesota average:
1.76
Latest news from Hastings, MN collected exclusively by city-data.com from local newspapers, TV, and radio stations
Hastings, MN City Guides: Ancestries: German (35.5%), Norwegian (10.6%), American (7.5%), European (6.8%), English (6.6%), Irish (5.4%).
Current Local Time:
Land area: 10.1 square miles.
Population density: 2,145 people per square mile (low).
458 residents are foreign born (1.0% Latin America , 0.4% Asia , 0.4% Europe ).
This city:
2.1%Minnesota:
8.5%
Median real estate property taxes paid for housing units with mortgages in 2022: $2,857 (1.0%)Median real estate property taxes paid for housing units with no mortgage in 2022: $3,069 (1.1%)
Nearest city with pop. 50,000+: Eagan, MN
Nearest city with pop. 200,000+: St. Paul, MN
Nearest city with pop. 1,000,000+: Chicago, IL
Nearest cities:
Coates, MN (3.0 miles),
Pine Bend, MN (3.0 miles),
Miesville, MN (3.1 miles)
Latitude: 44.73 N, Longitude: 92.86 W
Daytime population change due to commuting: -1,859 (-8.3%)Workers who live and work in this city: 5,123 (44.3%)
Single-family new house construction building permits:
2022: 32 buildings , average cost: $248,0002021: 34 buildings , average cost: $264,1002020: 21 buildings , average cost: $223,5002019: 14 buildings , average cost: $263,4002018: 15 buildings , average cost: $251,3002017: 30 buildings , average cost: $231,0002016: 22 buildings , average cost: $226,4002015: 20 buildings , average cost: $203,1002014: 42 buildings , average cost: $261,3002013: 37 buildings , average cost: $236,8002012: 39 buildings , average cost: $201,1002011: 20 buildings , average cost: $174,0002010: 4 buildings , average cost: $160,7002009: 12 buildings , average cost: $178,4002008: 8 buildings , average cost: $173,3002007: 59 buildings , average cost: $118,5002006: 161 buildings , average cost: $130,3002005: 109 buildings , average cost: $147,6002004: 213 buildings , average cost: $146,7002003: 257 buildings , average cost: $145,2002002: 151 buildings , average cost: $135,2002001: 111 buildings , average cost: $124,8002000: 115 buildings , average cost: $144,4001999: 124 buildings , average cost: $139,3001998: 112 buildings , average cost: $135,9001997: 74 buildings , average cost: $135,200Unemployment in December 2023:
Population change in the 1990s: +2,583 (+16.5%).
Most common occupations in Hastings, MN (%)
Both Males Females
Other production occupations, including supervisors (4.7%)
Other office and administrative support workers, including supervisors (4.4%)
Other management occupations, except farmers and farm managers (3.9%)
Other sales and related occupations, including supervisors (3.5%)
Building and grounds cleaning and maintenance occupations (3.4%)
Preschool, kindergarten, elementary, and middle school teachers (3.1%)
Secretaries and administrative assistants (2.8%)
Other production occupations, including supervisors (6.1%)
Carpenters (5.2%)
Other management occupations, except farmers and farm managers (4.7%)
Electrical equipment mechanics and other installation, maintenance, and repair workers, including supervisors (4.6%)
Driver/sales workers and truck drivers (4.5%)
Building and grounds cleaning and maintenance occupations (3.8%)
Construction traders workers except carpenters, electricians, painters, plumbers, and construction laborers (3.7%)
Other office and administrative support workers, including supervisors (7.2%)
Secretaries and administrative assistants (5.7%)
Preschool, kindergarten, elementary, and middle school teachers (5.1%)
Registered nurses (4.0%)
Child care workers (3.5%)
Other sales and related occupations, including supervisors (3.5%)
Health technologists and technicians (3.5%)
Tornado activity:
Hastings-area historical tornado activity is slightly above Minnesota state average. It is 32% greater than the overall U.S. average.
On 6/4/1958, a category F5 (max. wind speeds 261-318 mph) tornado 28.3 miles away from the Hastings city center killed 21 people and injured 74 people and caused between $5,000,000 and $50,000,000 in damages.
On 5/6/1965, a category F4 (max. wind speeds 207-260 mph) tornado 29.1 miles away from the city center killed 3 people and injured 175 people and caused between $5,000,000 and $50,000,000 in damages.
Earthquake activity:
Hastings-area historical earthquake activity is significantly above Minnesota state average. It is 59% smaller than the overall U.S. average. On 7/9/1975 at 14:54:15, a magnitude 4.6 (4.6 MB, Class: Light, Intensity: IV - V) earthquake occurred 168.1 miles away from the city center On 6/5/1993 at 01:24:53, a magnitude 4.1 (4.1 LG, Depth: 6.2 mi) earthquake occurred 179.6 miles away from the city center On 3/4/1983 at 06:32:18, a magnitude 4.6 (4.4 MB, 4.6 LG, 4.4 ML) earthquake occurred 325.2 miles away from Hastings center On 10/20/1995 at 15:57:18, a magnitude 3.7 (3.7 LG, Depth: 3.1 mi, Class: Light, Intensity: II - III) earthquake occurred 208.2 miles away from Hastings center On 6/28/2004 at 06:10:52, a magnitude 4.2 (4.2 MW, Depth: 6.2 mi) earthquake occurred 301.9 miles away from Hastings center On 2/9/1994 at 08:45:35, a magnitude 3.1 (3.1 LG, Depth: 3.1 mi) earthquake occurred 106.6 miles away from the city center Magnitude types: regional Lg-wave magnitude (LG), body-wave magnitude (MB), local magnitude (ML), moment magnitude (MW) Natural disasters: The number of natural disasters in Dakota County (15) is near the US average (15).Major Disasters (Presidential) Declared: 11Emergencies Declared: 3Floods: 11, Storms: 7, Tornadoes: 5, Drought: 1, Hurricane: 1, Wind: 1, Other: 1 (Note: some incidents may be assigned to more than one category). Hospitals and medical centers in Hastings: HENRY HAGEN RESIDENCE (19845 LILLEHEI AVE) REGINA MEDICAL CENTER (Voluntary non-profit - Church, 1175 NININGER ROAD) AUGUSTANA HEALTH CARE CENTER OF HASTINGS (930 WEST 16TH STREET)
HAVEN HOMES HEALTH CTR (930 W 16TH ST)
Amtrak station near Hastings: 20 miles: RED WING (LEVEE RD.) Services: partially wheelchair accessible, enclosed waiting area, public restrooms, public payphones, free short-term parking, free long-term parking, call for taxi service, intercity bus service.
Operable nuclear power plants near Hastings:
19 miles: Prairie Island 1 and 2 in Red Wing, MN.
College/University in Hastings: Hastings Beauty School Full-time enrollment: 54; Location: 221 Second Street East; Private, for-profit; Website: hastingsbeautyschool.com)
Colleges/universities with over 2000 students nearest to Hastings:
Dakota County Technical College (about 11 miles; Rosemount, MN ; Full-time enrollment: 2,478)
Inver Hills Community College (about 12 miles; Inver Grove Heights, MN ; FT enrollment: 4,049)
University of Wisconsin-River Falls (about 15 miles; River Falls, WI ; FT enrollment: 5,868)
Metropolitan State University (about 19 miles; Saint Paul, MN ; FT enrollment: 6,159)
Saint Paul College (about 20 miles; Saint Paul, MN ; FT enrollment: 4,778)
St Catherine University (about 21 miles; Saint Paul, MN ; FT enrollment: 3,771)
Macalester College (about 21 miles; Saint Paul, MN ; FT enrollment: 2,174)
Public high schools in Hastings:
Public elementary/middle schools in Hastings:
Private elementary/middle schools in Hastings:
See full list of schools located in Hastings User-submitted facts and corrections:
private school: ST John the Baptist Catholic School (Students:100; Location: 111 W. Main St; Phone: 651-437-2644; Grades: Pre-5)
Notable locations in Hastings: (A) , Hastings Country Club (B) , Dakota County Government Center (C) , Dakota County Sheriff Office (D) , Dakota County Courthouse (E) , Hastings Police Department (F) , Hastings City Hall (G) , Hastings Fire Department and Emergency Medical Services (H) , Pleasant Hill Library (I) . Display/hide their locations on the map
Shopping Centers: (1) , Westview Shopping Center (2) . Display/hide their locations on the map
Churches in Hastings include: (A) , Cornerstone Bible Church (B) , Our Saviour's Lutheran Church (C) , Saint John Evangelical Lutheran Church (D) , Saint Philips Lutheran Church (E) , Christ's Family Church (F) , United Methodist Church (G) , Saint Luke's Episcopal Parish (H) , Discovery Church (I) . Display/hide their locations on the map
Cemeteries: (1) , Guardian Angels Catholic Cemetery (2) , Veterans Cemetery (3) , Saint Boniface Cemetery (4) . Display/hide their locations on the map
Lakes: (A) , Bull Frog Lake (B) , Lake Isabelle (C) . Display/hide their locations on the map
Parks in Hastings include: (1) , Imperial Estates Park (2) , Lake Rebecca Park (3) , Pioneer Park (4) , Spiral Park (5) , Westwood Park (6) , Wilson Park (7) , Veteran's Park (8) , Vermillion Falls Park (9) . Display/hide their locations on the map
Tourist attractions:
Hotels:
Court:
Birthplace of: Harry Oliver - Art director, George Ashley Campbell - Inventor, Gil Dobie - Football player and coach, Ben Utecht - 2005 NFL player (Indianapolis Colts, born : Jun 30, 1981), Craig Kilborn - (born 1962), comedian and talk show host, Derek Stepan - Ice hockey player, Gratia Countryman - Librarian, Jeff Taffe - NHL player (Phoenix Coyotes, born : Feb 19, 1981), W. D. Twichell - Surveyor of portions of Ohio, Harry A. Sieben - Politician.
Dakota County has a predicted average indoor radon screening level greater than 4 pCi/L (pico curies per liter) - Highest Potential Drinking water stations with addresses in Hastings and their reported violations in the past:
EMPIRE RENTALS, LLC (Population served: 53, Groundwater):
Past monitoring violations:
2 routine major monitoring violations
Drinking water stations with addresses in Hastings that have no violations reported:
HASTINGS (Address: 101 East Fourth Street Population served: 22,652, Primary Water Source Type: Groundwater)
Average household size: This city:
2.5 peopleMinnesota:
2.5 people
Percentage of family households: This city:
66.4%Whole state:
64.6%
Percentage of households with unmarried partners: This city:
7.6%Whole state:
6.9%
Likely homosexual households (counted as self-reported same-sex unmarried-partner households)
Lesbian couples: 0.4% of all households Gay men: 0.1% of all households
People in group quarters in Hastings in 2010:
339 people in nursing facilities/skilled-nursing facilities
292 people in local jails and other municipal confinement facilities
37 people in group homes intended for adults
23 people in residential treatment centers for adults
22 people in correctional facilities intended for juveniles
17 people in other noninstitutional facilities
11 people in group homes for juveniles (non-correctional)
8 people in workers' group living quarters and job corps centers
People in group quarters in Hastings in 2000:
183 people in other noninstitutional group quarters
174 people in other group homes
147 people in local jails and other confinement facilities (including police lockups)
100 people in nursing homes
39 people in homes or halfway houses for drug/alcohol abuse
15 people in homes for the mentally retarded
3 people in religious group quarters
Banks with most branches in Hastings (2011 data):
First National Bank: West Branch at 1440 North Frontage Road, branch established on 1979/02/05; Hastings Branch at 119 West Second Street, branch established on 1856/11/07. Info updated 2011/08/30: Bank assets: $193.5 mil, Deposits: $173.7 mil, headquarters in Slayton, MN, positive income , Agricultural Specialization, 11 total offices , Holding Company: Fulda Bancorporation Inc.
Vermillion State Bank: Hastings Branch at 975 Lyn Way, branch established on 1981/11/24; Hastings Branch at 255 West 33rd Street, branch established on 1991/09/03. Info updated 2011/04/20: Bank assets: $489.0 mil, Deposits: $421.7 mil, headquarters in Vermillion, MN, positive income , Commercial Lending Specialization, 5 total offices , Holding Company: Vermillion Bancshares, Inc.
Wells Fargo Bank, National Association: Hastings Branch at 1360 Frontage Road South, branch established on 1978/07/26; Hastings Downtown Branch at 401 Vermillion Street, branch established on 1977/05/26. Info updated 2011/04/05: Bank assets: $1,161,490.0 mil, Deposits: $905,653.0 mil, headquarters in Sioux Falls, SD, positive income , 6395 total offices , Holding Company: Wells Fargo & Company
North American Banking Company: at 1620 Frontage Road, branch established on 2005/11/14. Info updated 2012/02/29: Bank assets: $253.1 mil, Deposits: $217.6 mil, headquarters in Roseville, MN, positive income , Commercial Lending Specialization, 4 total offices , Holding Company: N.A. Corporation
Premier Bank Minnesota: Hastings Branch at 101 East 10th Street, branch established on 2006/12/18. Info updated 2012/03/28: Bank assets: $176.6 mil, Deposits: $162.7 mil, headquarters in Farmington, MN, negative income in the last year , Commercial Lending Specialization, 8 total offices
Merchants Bank, National Association: Hastings Branch at 1525 Vermillion Street, branch established on 1991/05/09. Info updated 2012/01/06: Bank assets: $1,241.1 mil, Deposits: $1,007.4 mil, headquarters in Winona, MN, positive income , Commercial Lending Specialization, 19 total offices , Holding Company: Merchants Financial Group, Inc.
TCF National Bank: Mn Cub Foods - Hastings at 1729 Market Boulevard, branch established on 2002/02/21. Info updated 2009/11/23: Bank assets: $19,007.0 mil, Deposits: $12,377.0 mil, headquarters in Sioux Falls, SD, positive income , Commercial Lending Specialization, 441 total offices , Holding Company: Tcf Financial Corporation
MidCountry Bank: Hastings Branch at 1320 South Frontage Road, branch established on 1881/01/01. Info updated 2011/07/21: Bank assets: $674.7 mil, Deposits: $534.7 mil, headquarters in Marion, IL, positive income , Commercial Lending Specialization, 23 total offices
Provincial Bank: Hastings Branch at 1309 Vermillion Street, branch established on 2005/11/28. Info updated 2006/11/03: Bank assets: $75.2 mil, Deposits: $65.1 mil, headquarters in Lakeville, MN, positive income , Commercial Lending Specialization, 3 total offices , Holding Company: Provincial Corp.
For population 15 years and over in Hastings:
Never married: 29.9%Now married: 54.5%Separated: 0.6%Widowed: 5.2%Divorced: 9.8% For population 25 years and over in Hastings:
High school or higher: 95.5%Bachelor's degree or higher: 27.2%Graduate or professional degree: 7.6%Unemployed: 4.5%Mean travel time to work (commute): 19.4 minutes
Education Gini index (Inequality in education) Here:
8.7Minnesota average:
10.9
Religion statistics for Hastings, MN (based on Dakota County data)
Religion Adherents Congregations Catholic 112,264 18 Evangelical Protestant 57,007 111 Mainline Protestant 55,850 56 Other 6,321 27 Orthodox 1,173 5 Black Protestant 313 2 None 165,624 -
Source: Clifford Grammich, Kirk Hadaway, Richard Houseal, Dale E.Jones, Alexei Krindatch, Richie Stanley and Richard H.Taylor. 2012. 2010 U.S.Religion Census: Religious Congregations & Membership Study. Association of Statisticians of American Religious Bodies. Jones, Dale E., et al. 2002. Congregations and Membership in the United States 2000. Nashville, TN: Glenmary Research Center. Graphs represent county-level data
Food Environment Statistics: Number of grocery stores : 35Dakota County :
0.90 / 10,000 pop.Minnesota :
1.83 / 10,000 pop.
Number of supercenters and club stores : 5This county :
0.13 / 10,000 pop.Minnesota :
0.13 / 10,000 pop.
Number of convenience stores (no gas) : 6Here :
0.15 / 10,000 pop.Minnesota :
0.49 / 10,000 pop.
Number of convenience stores (with gas) : 118This county :
3.03 / 10,000 pop.Minnesota :
3.90 / 10,000 pop.
Number of full-service restaurants : 196This county :
5.03 / 10,000 pop.State :
6.98 / 10,000 pop.
Adult obesity rate : Here :
25.6%Minnesota :
25.9%
Low-income preschool obesity rate : Here :
12.6%Minnesota :
13.0%
Health and Nutrition: Healthy diet rate : Hastings:
49.3%Minnesota:
50.6%
Average overall health of teeth and gums : Hastings:
46.4%Minnesota:
48.4%
People feeling badly about themselves : This city:
20.7%Minnesota:
21.0%
People not drinking alcohol at all : Average hours sleeping at night : Overweight people : Hastings:
34.0%Minnesota:
33.5%
General health condition : Here:
57.0%Minnesota:
57.7%
Average condition of hearing : Hastings:
78.8%Minnesota:
79.3%
More about Health and Nutrition of Hastings, MN Residents
Local government employment and payroll (March 2022)
Function
Full-time employees
Monthly full-time payroll
Average yearly full-time wage
Part-time employees
Monthly part-time payroll
Police Protection - Officers
30 $271,843 $108,737 0 $0 Firefighters
18 $175,163 $116,775 28 $28,472 Parks and Recreation
13 $88,516 $81,707 13 $6,621 Streets and Highways
11 $78,120 $85,222 1 $5,390 Other and Unallocable
10 $69,298 $83,158 3 $10,496 Financial Administration
6 $50,430 $100,860 3 $11,262 Police - Other
6 $35,542 $71,084 4 $6,654 Other Government Administration
5 $45,468 $109,123 7 $4,400 Water Supply
3 $10,426 $41,704 0 $0 Housing and Community Development (Local)
3 $28,347 $113,388 0 $0 Fire - Other
0 $0 1 $5,361
Totals for Government
105 $853,154 $97,503 60 $78,655
Hastings government finances - Expenditure in 2021 (per resident):
Current Operations - Police Protection: $5,166,000 ($237.93)
General - Other: $4,229,000 ($194.78)Local Fire Protection: $3,973,000 ($182.99)Sewerage: $2,815,000 ($129.65)Parks and Recreation: $2,376,000 ($109.43)Water Utilities: $2,045,000 ($94.19)Regular Highways: $2,029,000 ($93.45)Housing and Community Development: $1,285,000 ($59.18)Central Staff Services: $995,000 ($45.83)Electric Utilities: $863,000 ($39.75)Protective Inspection and Regulation - Other: $597,000 ($27.50)Financial Administration: $590,000 ($27.17)Miscellaneous Commercial Activities - Other: $509,000 ($23.44)General Public Buildings: $425,000 ($19.57)Judicial and Legal Services: $206,000 ($9.49)General - Interest on Debt: $508,000 ($23.40)
Other Capital Outlay - General - Other: $539,000 ($24.82)
Parks and Recreation: $447,000 ($20.59)Police Protection: $74,000 ($3.41)Total Salaries and Wages: $9,798,000 ($451.27)
Water Utilities - Interest on Debt: $116,000 ($5.34)
Hastings government finances - Revenue in 2021 (per resident):
Charges - Sewerage: $3,341,000 ($153.88)
Other: $3,065,000 ($141.17)Regular Highways: $566,000 ($26.07)Parks and Recreation: $421,000 ($19.39)Federal Intergovernmental - Health and Hospitals: $1,771,000 ($81.57)
Local Intergovernmental - Other: $406,000 ($18.70)
Housing and Community Development: $340,000 ($15.66)Health and Hospitals: $1,000 ($0.05)Miscellaneous - Rents: $623,000 ($28.69)
Special Assessments: $468,000 ($21.55)Interest Earnings: $391,000 ($18.01)General Revenue - Other: $185,000 ($8.52)Sale of Property: $73,000 ($3.36)Fines and Forfeits: $72,000 ($3.32)Donations From Private Sources: $18,000 ($0.83)Revenue - Water Utilities: $2,407,000 ($110.86)
Electric Utilities: $578,000 ($26.62)State Intergovernmental - General Local Government Support: $1,355,000 ($62.41)
Highways: $419,000 ($19.30)Health and Hospitals: $40,000 ($1.84)Other: $37,000 ($1.70)Tax - Property: $14,947,000 ($688.42)
Other License: $436,000 ($20.08)Occupation and Business License - Other: $33,000 ($1.52)Other Selective Sales: $2,000 ($0.09)
Hastings government finances - Debt in 2021 (per resident):
Long Term Debt - Outstanding Unspecified Public Purpose: $24,307,000 ($1119.52)
Beginning Outstanding - Unspecified Public Purpose: $24,266,000 ($1117.63)Issue, Unspecified Public Purpose: $3,649,000 ($168.06)Retired Unspecified Public Purpose: $3,608,000 ($166.18)
Hastings government finances - Cash and Securities in 2021 (per resident):
Other Funds - Cash and Securities: $20,752,000 ($955.78)
Sinking Funds - Cash and Securities: $7,182,000 ($330.78)
8.01% of this county's 2020 resident taxpayers moved to other counties in 2021 ($77,850 average adjusted gross income )
Here:
8.01%Minnesota average:
7.79%
0.01% of residents moved to foreign countries ($89 average AGI )Dakota County:
0.01%Minnesota average:
0.00%
Top counties to which taxpayers relocated from this county between 2020 and 2021:
Businesses in Hastings, MN
Name Count Name Count
AT&T 1 Little Caesars Pizza 1 Ace Hardware 1 MasterBrand Cabinets 6 AmericInn 1 Maurices 1 Applebee's 1 McDonald's 1 Arby's 1 Panera Bread 1 Burger King 1 Pizza Hut 1 Caribou Coffee 1 Sears 1 Chevrolet 1 Subway 3 Chipotle 1 T-Mobile 1 Curves 1 Taco Bell 1 Dairy Queen 1 Target 1 Domino's Pizza 1 U-Haul 2 FedEx 2 UPS 2 Ford 1 Walgreens 1 H&R Block 1 Walmart 1 La-Z-Boy 1 YMCA 1
Strongest AM radio stations in Hastings:
WCTS (1030 AM; 50 kW; MAPLEWOOD, MN; Owner: CNTL. BAPT. THEO/AL SEMI MINNEAPOLIS)
KDWA (1460 AM; 1 kW; HASTINGS, MN; Owner: K & M BROADCASTING, INC.)
KTIS (900 AM; 25 kW; MINNEAPOLIS, MN; Owner: NORTHWESTERN COLLEGE)
KSTP (1500 AM; 50 kW; ST. PAUL, MN; Owner: KSTP-AM, LLC (DELAWARE))
KFAN (1130 AM; 50 kW; MINNEAPOLIS, MN; Owner: AMFM RADIO LICENSES, L.L.C.)
WCCO (830 AM; 50 kW; MINNEAPOLIS, MN; Owner: INFINITY MEDIA CORPORATION)
WDGY (630 AM; 8 kW; HUDSON, WI; Owner: 630 RADIO, INCORPORATED)
KKMS (980 AM; 5 kW; RICHFIELD, MN)
WMNN (1330 AM; 10 kW; MINNEAPOLIS, MN; Owner: MINNESOTA PUBLIC RADIO.)
KUOM (770 AM; daytime; 5 kW; MINNEAPOLIS, MN)
WMGT (1220 AM; 5 kW; STILLWATER, MN; Owner: ENDURANCE BROADCASTING, LLC)
KSMM (1530 AM; 9 kW; SHAKOPEE, MN; Owner: STARBOARD BROADCASTING, INC.)
WWTC (1280 AM; 5 kW; MINNEAPOLIS, MN; Owner: SCA LICENSE CORPORATION)
Strongest FM radio stations in Hastings:
WCAL (89.3 FM; NORTHFIELD, MN; Owner: ST. OLAF COLLEGE)
KNOW-FM (91.1 FM; MINNEAPOLIS-ST. PAUL, MN; Owner: MINNESOTA PUBLIC RADIO)
WLTE (102.9 FM; MINNEAPOLIS, MN; Owner: INFINITY MEDIA CORPORATION)
KSTP-FM (94.5 FM; ST. PAUL, MN; Owner: KSTP-FM, LLC, A DELAWARE LLC)
WGVX (105.1 FM; LAKEVILLE, MN; Owner: KQRS, INC.)
KEEY-FM (102.1 FM; ST. PAUL, MN; Owner: AMFM RADIO LICENSES, L.L.C.)
KTIS-FM (98.5 FM; MINNEAPOLIS, MN; Owner: NORTHWESTERN COLLEGE)
KDWB-FM (101.3 FM; RICHFIELD, MN; Owner: AMFM RADIO LICENSES, L.L.C.)
KQRS-FM (92.5 FM; GOLDEN VALLEY, MN; Owner: KQRS, Inc.)
KSJN (99.5 FM; MINNEAPOLIS, MN; Owner: MINNESOTA PUBLIC RADIO)
KXXR (93.7 FM; MINNEAPOLIS, MN; Owner: KQRS, INC.)
WXPT (104.1 FM; ST. LOUIS PARK, MN; Owner: THE AUDIO HOUSE, INC.)
KTCZ-FM (97.1 FM; MINNEAPOLIS, MN; Owner: AMFM RADIO LICENSES, L.L.C.)
WEVR-FM (106.3 FM; RIVER FALLS, WI; Owner: HANTEN BROADCASTING COMPANY, INC.)
K294AM (106.7 FM; WEST ST. PAUL, MN; Owner: FRESH AIR, INCORPORATED)
K214DF (90.7 FM; GOLDEN VALLEY, MN; Owner: EDUCATIONAL MEDIA FOUNDATION)
KQQL (107.9 FM; ANOKA, MN; Owner: AMFM RADIO LICENSES, L.L.C.)
KBEM-FM (88.5 FM; MINNEAPOLIS, MN; Owner: BD. OF EDUCATION, S.S.D. NO. 1)
KQCL (95.9 FM; FARIBAULT, MN; Owner: CUMULUS LICENSING CORP.)
KFAI (90.3 FM; MINNEAPOLIS, MN; Owner: FRESH AIR, INC.)
TV broadcast stations around Hastings:
KMSP-TV (Channel 9; MINNEAPOLIS, MN; Owner: FOX TELEVISION STATIONS, INC.)
KTCA-TV (Channel 2; ST. PAUL, MN; Owner: TWIN CITIES PUBLIC TELEVISION, INC.)
KARE (Channel 11; MINNEAPOLIS, MN; Owner: MULTIMEDIA HOLDINGS CORPORATION)
KSTP-TV (Channel 5; ST. PAUL, MN; Owner: HUBBARD BROADCASTING, INC.)
WCCO-TV (Channel 4; MINNEAPOLIS, MN; Owner: CBS BROADCASTING INC.)
KTCI-TV (Channel 17; ST. PAUL, MN; Owner: TWIN CITIES PUBLIC TELEVISION, INC.)
KSTC-TV (Channel 45; MINNEAPOLIS, MN; Owner: HUBBARD BROADCASTING, INC.)
KMWB (Channel 23; MINNEAPOLIS, MN; Owner: KLGT LICENSEE, LLC)
WFTC (Channel 29; MINNEAPOLIS, MN; Owner: FOX TELEVISION STATIONS, INC.)
K07UI (Channel 7; MINNEAPOLIS, ETC., MN; Owner: WORD OF GOD FELLOWSHIP, INC.)
K58BS (Channel 58; MINNEAPOLIS, MN; Owner: TRINITY BROADCASTING NETWORK)
K67HG (Channel 67; MINNEAPOLIS, MN; Owner: VENTANA TELEVISION, INC.)
K14KH (Channel 14; MINNEAPOLIS, MN; Owner: THREE ANGELS BROADCASTING NETWORK)
K19ER (Channel 19; ST. PAUL, MN; Owner: CATHOLIC VIEWS BROADCASTS, INC.)
W62BD (Channel 62; MINNEAPOLIS, MN; Owner: WORD OF GOD FELLOWSHIP, INC.)
W55AP (Channel 55; RIVER FALLS, WI; Owner: STATE OF WISCONSIN - EDUCATIONAL COMMUNICATIONS BOARD)
WBWX-CA (Channel 13; MINNEAPOLIS, MN; Owner: THE BOX WORLDWIDE LLC)
National Bridge Inventory (NBI) Statistics 24 Number of bridges394ft / 120m Total length $742,004,000 Total costs178,989 Total average daily traffic8,978 Total average daily truck traffic
New bridges - historical statistics
2 1920-1929 1 1960-1969 3 1970-1979 3 1980-1989 4 1990-1999 6 2000-2009 5 2010-2019
See full National Bridge Inventory statistics for Hastings, MN
Home Mortgage Disclosure Act Aggregated Statistics For Year 2009(Based on 1 full and 4 partial tracts) A) FHA, FSA/RHS & VA B) Conventional C) Refinancings D) Home Improvement Loans E) Loans on Dwellings For 5+ Families F) Non-occupant Loans on G) Loans On Manufactured Number Average Value Number Average Value Number Average Value Number Average Value Number Average Value Number Average Value Number Average Value
LOANS ORIGINATED 91 $151,613 60 $125,688 329 $169,109 14 $91,758 2 $2,996,710 21 $119,300 2 $57,880 APPLICATIONS APPROVED, NOT ACCEPTED 2 $136,400 2 $92,460 27 $184,887 3 $49,800 0 $0 2 $123,000 1 $72,230 APPLICATIONS DENIED 9 $156,052 7 $119,691 85 $182,623 11 $56,524 0 $0 8 $162,516 2 $29,930 APPLICATIONS WITHDRAWN 7 $163,726 7 $121,983 89 $178,185 6 $58,135 0 $0 4 $95,318 0 $0 FILES CLOSED FOR INCOMPLETENESS 2 $120,815 0 $0 23 $188,269 1 $26,630 0 $0 0 $0 0 $0
Aggregated Statistics For Year 2008(Based on 1 full and 4 partial tracts) A) FHA, FSA/RHS & VA B) Conventional C) Refinancings D) Home Improvement Loans E) Loans on Dwellings For 5+ Families F) Non-occupant Loans on G) Loans On Manufactured Number Average Value Number Average Value Number Average Value Number Average Value Number Average Value Number Average Value Number Average Value
LOANS ORIGINATED 64 $161,920 79 $150,905 134 $173,564 30 $57,532 2 $175,275 12 $194,260 6 $44,853 APPLICATIONS APPROVED, NOT ACCEPTED 1 $219,140 12 $126,855 29 $148,416 5 $49,346 0 $0 1 $170,230 5 $38,104 APPLICATIONS DENIED 6 $150,282 15 $101,658 98 $175,524 15 $54,925 0 $0 8 $155,389 14 $39,761 APPLICATIONS WITHDRAWN 6 $145,872 14 $135,326 47 $183,697 6 $90,155 0 $0 2 $136,000 1 $36,610 FILES CLOSED FOR INCOMPLETENESS 2 $161,740 3 $291,793 17 $189,309 1 $46,850 0 $0 0 $0 0 $0
Aggregated Statistics For Year 2007(Based on 1 full and 4 partial tracts) A) FHA, FSA/RHS & VA B) Conventional C) Refinancings D) Home Improvement Loans E) Loans on Dwellings For 5+ Families F) Non-occupant Loans on G) Loans On Manufactured Number Average Value Number Average Value Number Average Value Number Average Value Number Average Value Number Average Value Number Average Value
LOANS ORIGINATED 30 $171,774 204 $154,188 191 $155,977 50 $42,817 1 $147,040 41 $157,093 4 $49,592 APPLICATIONS APPROVED, NOT ACCEPTED 1 $212,900 24 $164,805 51 $146,392 9 $60,597 0 $0 7 $178,710 5 $52,282 APPLICATIONS DENIED 0 $0 43 $140,729 144 $177,516 17 $63,217 0 $0 11 $176,148 10 $41,324 APPLICATIONS WITHDRAWN 2 $211,510 17 $183,488 62 $179,242 6 $134,750 0 $0 7 $221,279 0 $0 FILES CLOSED FOR INCOMPLETENESS 0 $0 8 $153,659 17 $179,985 1 $46,650 0 $0 1 $24,000 0 $0
Aggregated Statistics For Year 2006(Based on 1 full and 4 partial tracts) A) FHA, FSA/RHS & VA B) Conventional C) Refinancings D) Home Improvement Loans E) Loans on Dwellings For 5+ Families F) Non-occupant Loans on G) Loans On Manufactured Number Average Value Number Average Value Number Average Value Number Average Value Number Average Value Number Average Value Number Average Value
LOANS ORIGINATED 43 $173,905 317 $142,251 286 $140,584 51 $54,358 2 $394,030 57 $139,716 5 $32,650 APPLICATIONS APPROVED, NOT ACCEPTED 2 $169,115 29 $138,526 69 $163,514 6 $82,015 0 $0 6 $168,902 3 $52,950 APPLICATIONS DENIED 3 $132,570 40 $138,347 178 $178,870 17 $91,398 0 $0 10 $149,358 10 $43,126 APPLICATIONS WITHDRAWN 2 $190,055 33 $143,257 110 $178,741 9 $50,114 0 $0 11 $126,306 1 $30,780 FILES CLOSED FOR INCOMPLETENESS 0 $0 4 $121,988 20 $206,426 1 $361,890 0 $0 0 $0 0 $0
Aggregated Statistics For Year 2005(Based on 1 full and 4 partial tracts) A) FHA, FSA/RHS & VA B) Conventional C) Refinancings D) Home Improvement Loans E) Loans on Dwellings For 5+ Families F) Non-occupant Loans on G) Loans On Manufactured Number Average Value Number Average Value Number Average Value Number Average Value Number Average Value Number Average Value Number Average Value
LOANS ORIGINATED 55 $175,417 406 $144,977 344 $152,645 52 $48,172 2 $4,885,610 63 $141,737 7 $44,311 APPLICATIONS APPROVED, NOT ACCEPTED 2 $159,335 29 $135,116 51 $151,773 10 $58,592 1 $99,850 2 $134,670 5 $25,602 APPLICATIONS DENIED 1 $230,830 52 $101,642 206 $160,365 27 $63,786 0 $0 21 $131,027 21 $49,659 APPLICATIONS WITHDRAWN 1 $110,790 37 $163,423 165 $178,306 17 $104,511 0 $0 11 $129,784 2 $42,930 FILES CLOSED FOR INCOMPLETENESS 0 $0 9 $148,401 46 $186,749 0 $0 0 $0 2 $179,405 0 $0
Aggregated Statistics For Year 2004(Based on 1 full and 4 partial tracts) A) FHA, FSA/RHS & VA B) Conventional C) Refinancings D) Home Improvement Loans E) Loans on Dwellings For 5+ Families F) Non-occupant Loans on G) Loans On Manufactured Number Average Value Number Average Value Number Average Value Number Average Value Number Average Value Number Average Value Number Average Value
LOANS ORIGINATED 53 $170,915 374 $159,740 413 $148,868 72 $44,942 2 $3,567,765 47 $141,173 4 $38,835 APPLICATIONS APPROVED, NOT ACCEPTED 1 $281,700 34 $160,934 64 $158,139 9 $59,358 0 $0 10 $166,588 3 $84,923 APPLICATIONS DENIED 4 $163,918 39 $155,822 169 $157,239 26 $71,547 0 $0 8 $134,682 15 $68,137 APPLICATIONS WITHDRAWN 4 $168,072 37 $165,575 112 $160,582 12 $131,500 0 $0 3 $171,367 0 $0 FILES CLOSED FOR INCOMPLETENESS 0 $0 6 $141,812 42 $183,013 2 $101,995 0 $0 1 $333,740 0 $0
Aggregated Statistics For Year 2003(Based on 1 full and 4 partial tracts) A) FHA, FSA/RHS & VA B) Conventional C) Refinancings D) Home Improvement Loans E) Loans on Dwellings For 5+ Families F) Non-occupant Loans on Number Average Value Number Average Value Number Average Value Number Average Value Number Average Value Number Average Value
LOANS ORIGINATED 86 $163,144 376 $163,247 896 $140,170 80 $28,104 4 $390,222 60 $132,371 APPLICATIONS APPROVED, NOT ACCEPTED 8 $146,928 30 $136,958 75 $142,199 4 $48,302 0 $0 5 $166,804 APPLICATIONS DENIED 2 $224,690 34 $126,550 192 $136,666 21 $36,811 0 $0 12 $153,604 APPLICATIONS WITHDRAWN 4 $147,788 39 $146,324 170 $148,539 1 $102,400 0 $0 6 $123,223 FILES CLOSED FOR INCOMPLETENESS 2 $108,170 4 $151,025 26 $134,881 2 $46,225 0 $0 1 $149,770
Aggregated Statistics For Year 2002(Based on 1 full and 1 partial tracts) A) FHA, FSA/RHS & VA B) Conventional C) Refinancings D) Home Improvement Loans E) Loans on Dwellings For 5+ Families F) Non-occupant Loans on Number Average Value Number Average Value Number Average Value Number Average Value Number Average Value Number Average Value
LOANS ORIGINATED 55 $142,575 138 $153,260 273 $125,564 24 $26,139 0 $0 18 $112,961 APPLICATIONS APPROVED, NOT ACCEPTED 7 $135,286 17 $99,687 32 $117,183 10 $34,007 0 $0 2 $166,560 APPLICATIONS DENIED 5 $119,000 17 $61,509 57 $97,143 17 $24,908 2 $434,500 0 $0 APPLICATIONS WITHDRAWN 8 $144,194 8 $161,044 64 $134,716 1 $2,740 0 $0 0 $0 FILES CLOSED FOR INCOMPLETENESS 0 $0 2 $111,480 20 $139,854 1 $17,100 0 $0 0 $0
Aggregated Statistics For Year 2001(Based on 1 full and 1 partial tracts) A) FHA, FSA/RHS & VA B) Conventional C) Refinancings D) Home Improvement Loans F) Non-occupant Loans on Number Average Value Number Average Value Number Average Value Number Average Value Number Average Value
LOANS ORIGINATED 24 $138,707 73 $127,579 245 $104,152 39 $22,124 13 $101,565 APPLICATIONS APPROVED, NOT ACCEPTED 1 $122,000 6 $125,952 21 $87,778 6 $16,523 0 $0 APPLICATIONS DENIED 2 $154,560 20 $48,696 54 $91,384 16 $15,280 1 $124,470 APPLICATIONS WITHDRAWN 0 $0 8 $157,819 52 $108,645 2 $14,020 1 $80,020 FILES CLOSED FOR INCOMPLETENESS 0 $0 4 $109,138 10 $116,255 0 $0 2 $148,860
Aggregated Statistics For Year 2000(Based on 1 full and 1 partial tracts) A) FHA, FSA/RHS & VA B) Conventional C) Refinancings D) Home Improvement Loans E) Loans on Dwellings For 5+ Families F) Non-occupant Loans on Number Average Value Number Average Value Number Average Value Number Average Value Number Average Value Number Average Value
LOANS ORIGINATED 19 $123,264 80 $111,532 77 $71,031 39 $16,220 1 $149,000 8 $82,041 APPLICATIONS APPROVED, NOT ACCEPTED 0 $0 10 $89,269 18 $73,584 3 $14,333 0 $0 0 $0 APPLICATIONS DENIED 1 $119,000 37 $69,595 39 $92,149 16 $30,222 0 $0 1 $116,000 APPLICATIONS WITHDRAWN 1 $76,600 4 $130,318 33 $88,102 6 $17,015 0 $0 0 $0 FILES CLOSED FOR INCOMPLETENESS 0 $0 2 $84,670 10 $118,771 0 $0 0 $0 0 $0
Aggregated Statistics For Year 1999(Based on 1 full and 3 partial tracts) A) FHA, FSA/RHS & VA B) Conventional C) Refinancings D) Home Improvement Loans E) Loans on Dwellings For 5+ Families F) Non-occupant Loans on Number Average Value Number Average Value Number Average Value Number Average Value Number Average Value Number Average Value
LOANS ORIGINATED 65 $113,975 158 $97,904 212 $79,703 52 $19,858 1 $442,430 10 $92,381 APPLICATIONS APPROVED, NOT ACCEPTED 2 $85,150 15 $82,469 34 $73,154 10 $16,898 0 $0 2 $20,780 APPLICATIONS DENIED 4 $137,120 55 $55,874 71 $62,936 19 $17,085 0 $0 2 $57,680 APPLICATIONS WITHDRAWN 1 $85,310 10 $102,289 52 $90,923 6 $46,998 0 $0 1 $72,000 FILES CLOSED FOR INCOMPLETENESS 0 $0 5 $57,294 8 $106,314 0 $0 0 $0 0 $0
Detailed HMDA statistics for the following Tracts:
0611.02
, 0611.05 , 0611.06 , 0611.07 , 0611.08
Private Mortgage Insurance Companies Aggregated Statistics For Year 2009(Based on 1 full and 4 partial tracts) A) Conventional B) Refinancings Number Average Value Number Average Value
LOANS ORIGINATED 10 $120,179 3 $205,023 APPLICATIONS APPROVED, NOT ACCEPTED 1 $64,290 2 $205,000 APPLICATIONS DENIED 0 $0 1 $310,390 APPLICATIONS WITHDRAWN 0 $0 1 $118,410 FILES CLOSED FOR INCOMPLETENESS 0 $0 1 $218,000
Aggregated Statistics For Year 2008(Based on 1 full and 4 partial tracts) A) Conventional B) Refinancings C) Non-occupant Loans on Number Average Value Number Average Value Number Average Value
LOANS ORIGINATED 27 $166,459 19 $204,152 2 $203,610 APPLICATIONS APPROVED, NOT ACCEPTED 10 $189,359 10 $214,435 3 $224,333 APPLICATIONS DENIED 0 $0 1 $270,290 0 $0 APPLICATIONS WITHDRAWN 1 $220,870 1 $227,790 0 $0 FILES CLOSED FOR INCOMPLETENESS 0 $0 1 $250,710 0 $0
Aggregated Statistics For Year 2007(Based on 1 full and 4 partial tracts) A) Conventional B) Refinancings C) Non-occupant Loans on Number Average Value Number Average Value Number Average Value
LOANS ORIGINATED 87 $189,800 25 $211,556 3 $198,830 APPLICATIONS APPROVED, NOT ACCEPTED 7 $193,041 3 $195,777 1 $183,000 APPLICATIONS DENIED 0 $0 1 $196,640 0 $0 APPLICATIONS WITHDRAWN 4 $202,290 2 $215,910 0 $0 FILES CLOSED FOR INCOMPLETENESS 0 $0 0 $0 0 $0
Aggregated Statistics For Year 2006(Based on 1 full and 4 partial tracts) A) Conventional B) Refinancings C) Non-occupant Loans on Number Average Value Number Average Value Number Average Value
LOANS ORIGINATED 57 $185,170 21 $201,069 0 $0 APPLICATIONS APPROVED, NOT ACCEPTED 5 $175,064 2 $209,275 1 $189,000 APPLICATIONS DENIED 0 $0 0 $0 0 $0 APPLICATIONS WITHDRAWN 3 $164,597 3 $293,873 0 $0 FILES CLOSED FOR INCOMPLETENESS 0 $0 0 $0 0 $0
Aggregated Statistics For Year 2005(Based on 1 full and 4 partial tracts) A) Conventional B) Refinancings C) Non-occupant Loans on Number Average Value Number Average Value Number Average Value
LOANS ORIGINATED 50 $191,897 21 $196,007 2 $129,710 APPLICATIONS APPROVED, NOT ACCEPTED 2 $247,115 4 $206,275 0 $0 APPLICATIONS DENIED 0 $0 0 $0 0 $0 APPLICATIONS WITHDRAWN 3 $206,683 3 $220,803 0 $0 FILES CLOSED FOR INCOMPLETENESS 1 $105,320 1 $180,000 0 $0
Aggregated Statistics For Year 2004(Based on 1 full and 4 partial tracts) A) Conventional B) Refinancings C) Non-occupant Loans on Number Average Value Number Average Value Number Average Value
LOANS ORIGINATED 69 $182,093 25 $189,256 4 $160,512 APPLICATIONS APPROVED, NOT ACCEPTED 9 $180,021 12 $176,990 2 $195,250 APPLICATIONS DENIED 1 $278,180 0 $0 0 $0 APPLICATIONS WITHDRAWN 2 $199,210 1 $225,000 0 $0 FILES CLOSED FOR INCOMPLETENESS 1 $242,320 1 $249,920 0 $0
Aggregated Statistics For Year 2003(Based on 1 full and 4 partial tracts) A) Conventional B) Refinancings C) Non-occupant Loans on Number Average Value Number Average Value Number Average Value
LOANS ORIGINATED 106 $171,157 82 $166,650 8 $140,884 APPLICATIONS APPROVED, NOT ACCEPTED 12 $175,296 22 $153,802 0 $0 APPLICATIONS DENIED 2 $155,255 1 $178,500 0 $0 APPLICATIONS WITHDRAWN 2 $122,245 3 $207,703 1 $77,280 FILES CLOSED FOR INCOMPLETENESS 1 $151,000 0 $0 0 $0
Aggregated Statistics For Year 2002(Based on 1 full and 1 partial tracts) A) Conventional B) Refinancings C) Non-occupant Loans on Number Average Value Number Average Value Number Average Value
LOANS ORIGINATED 43 $155,140 18 $151,860 1 $45,140 APPLICATIONS APPROVED, NOT ACCEPTED 2 $162,500 4 $151,492 0 $0 APPLICATIONS DENIED 0 $0 1 $123,100 0 $0 APPLICATIONS WITHDRAWN 2 $152,000 0 $0 0 $0 FILES CLOSED FOR INCOMPLETENESS 0 $0 0 $0 0 $0
Aggregated Statistics For Year 2001(Based on 1 full and 1 partial tracts) A) Conventional B) Refinancings C) Non-occupant Loans on Number Average Value Number Average Value Number Average Value
LOANS ORIGINATED 27 $150,701 19 $137,141 2 $99,200 APPLICATIONS APPROVED, NOT ACCEPTED 3 $140,747 4 $159,962 1 $73,860 APPLICATIONS DENIED 0 $0 0 $0 0 $0 APPLICATIONS WITHDRAWN 0 $0 2 $182,260 0 $0 FILES CLOSED FOR INCOMPLETENESS 0 $0 0 $0 0 $0
Aggregated Statistics For Year 2000(Based on 1 full and 1 partial tracts) A) Conventional B) Refinancings Number Average Value Number Average Value
LOANS ORIGINATED 25 $130,184 6 $116,340 APPLICATIONS APPROVED, NOT ACCEPTED 2 $124,895 1 $73,860 APPLICATIONS DENIED 1 $49,240 0 $0 APPLICATIONS WITHDRAWN 0 $0 0 $0 FILES CLOSED FOR INCOMPLETENESS 0 $0 1 $76,600
Aggregated Statistics For Year 1999(Based on 1 full and 3 partial tracts) A) Conventional B) Refinancings C) Non-occupant Loans on Number Average Value Number Average Value Number Average Value
LOANS ORIGINATED 42 $108,613 17 $118,982 1 $133,540 APPLICATIONS APPROVED, NOT ACCEPTED 4 $100,090 4 $123,258 0 $0 APPLICATIONS DENIED 0 $0 1 $114,080 0 $0 APPLICATIONS WITHDRAWN 1 $135,130 0 $0 0 $0 FILES CLOSED FOR INCOMPLETENESS 0 $0 0 $0 0 $0
Detailed PMIC statistics for the following Tracts:
0611.02
, 0611.05 , 0611.06 , 0611.07 , 0611.08
Most common first names in Hastings, MN among deceased individuals Name Count Lived (average)
John 127 75.7 years Mary 105 80.7 years William 71 77.2 years Margaret 71 82.0 years Robert 66 72.1 years Joseph 63 74.4 years James 61 68.3 years George 59 76.9 years Helen 59 81.6 years Frank 57 79.6 years
Most common last names in Hastings, MN among deceased individuals Last name Count Lived (average)
Johnson 66 75.2 years Bauer 36 81.9 years Anderson 34 75.9 years Olson 31 76.5 years Swanson 31 75.8 years Fox 23 80.6 years Reinardy 22 79.6 years Peterson 21 77.6 years Nelson 20 78.1 years Rother 19 80.5 years
Hastings compared to Minnesota state average:
Unemployed percentage significantly below state average. Black race population percentage significantly below state average. Median age below state average. Foreign-born population percentage significantly below state average. Length of stay since moving in significantly above state average. Institutionalized population percentage above state average.
Top Patent Applicants
Joseph E. Tix (30)
Karl J. Fritze (17)
Michael A. Yandrasits (15)
Hassan Sahouani (14)
Brandon L. Herdt (13)
Susannah C. Clear (11)
Joseph J. Stoffel (11)
Donald L. Pochardt (11)
Catherine Hanson (10)
Thomas A. Kirk (10)
Total of 350 patent applications in 2008-2024.
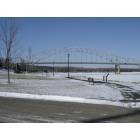
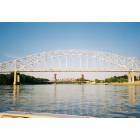
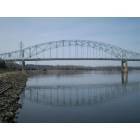
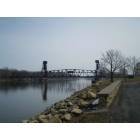
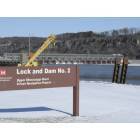

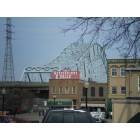
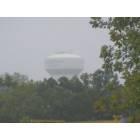
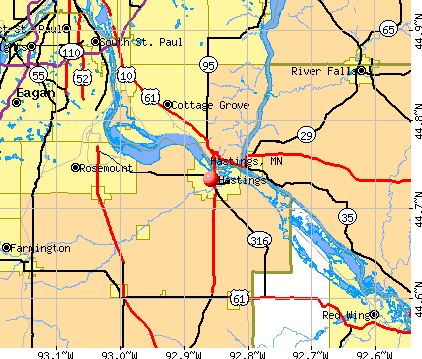


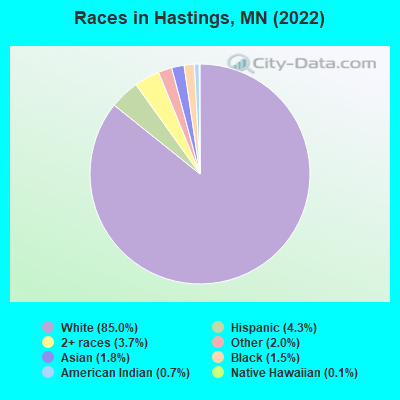
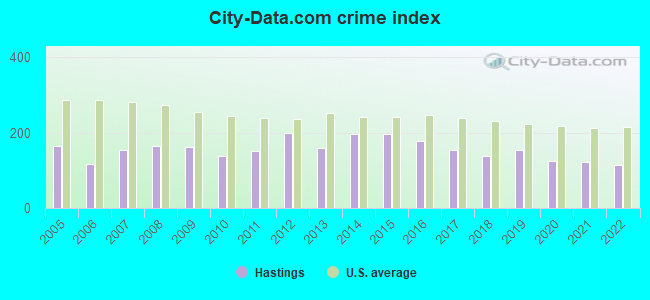
 Recent articles from our blog. Our writers, many of them Ph.D. graduates or candidates, create easy-to-read articles on a wide variety of topics.

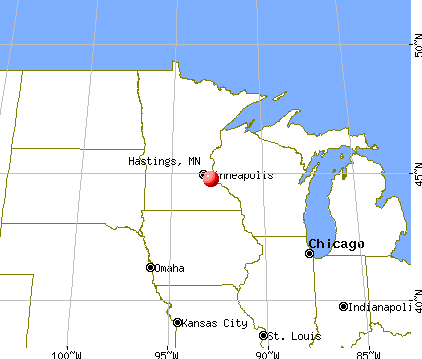
 (16.3 miles
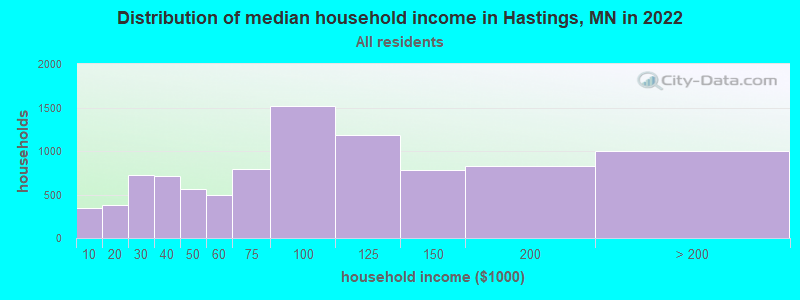
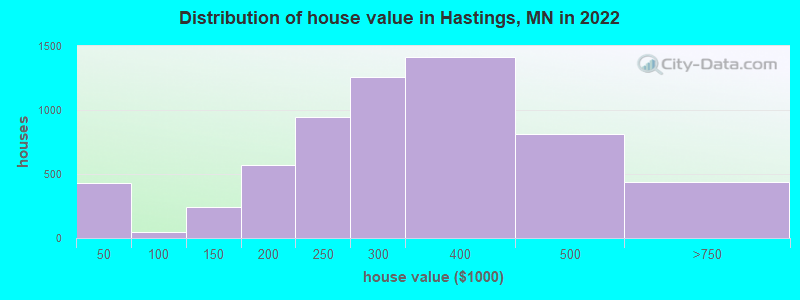
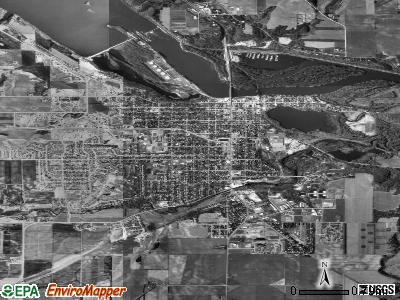
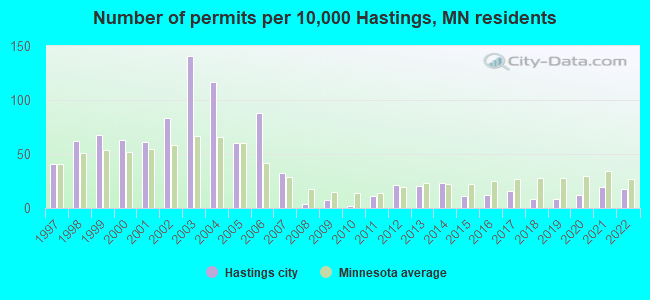
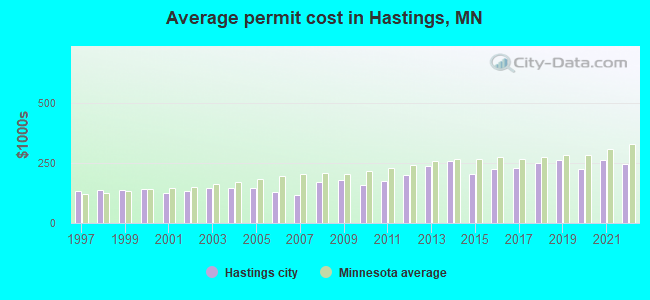
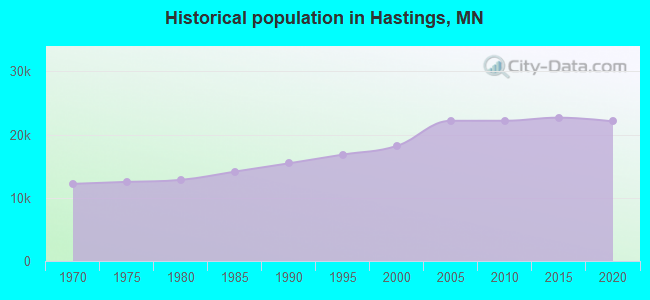
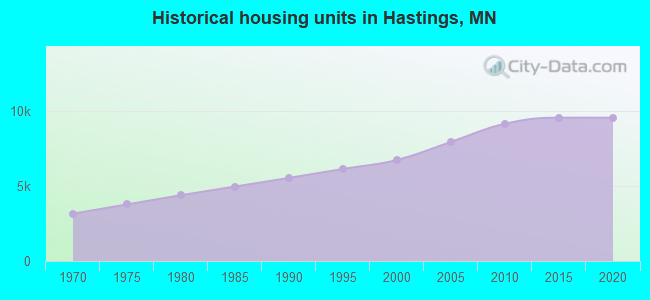
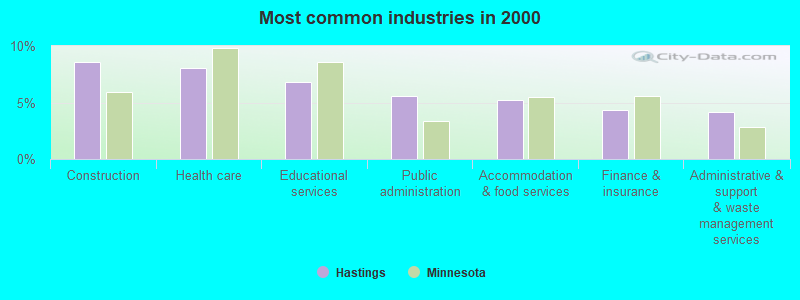
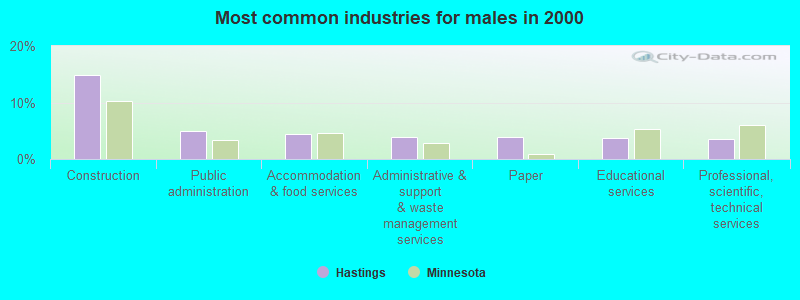
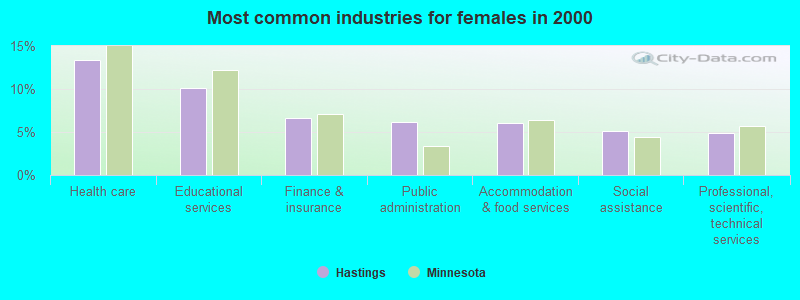
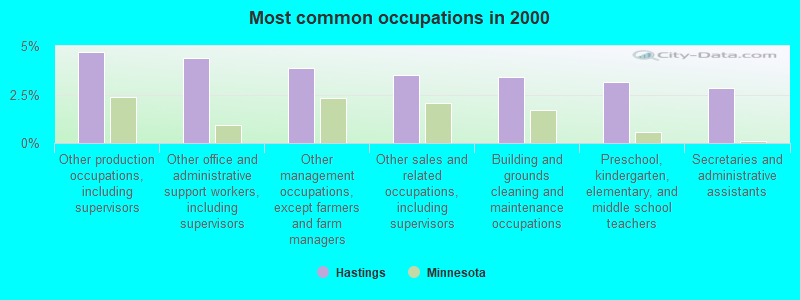
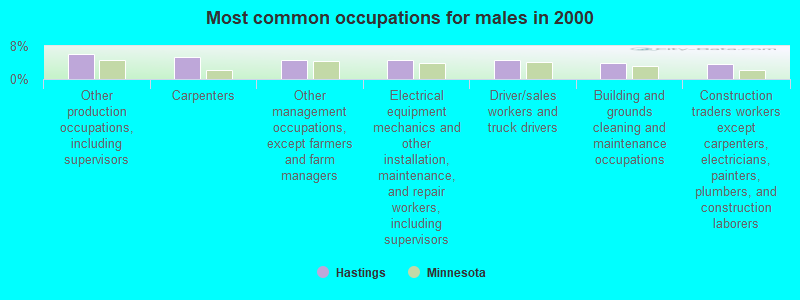
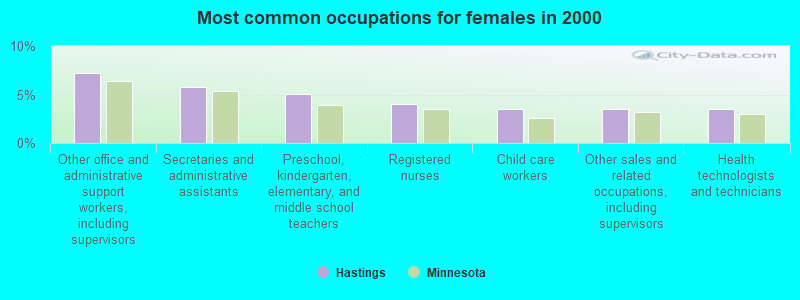
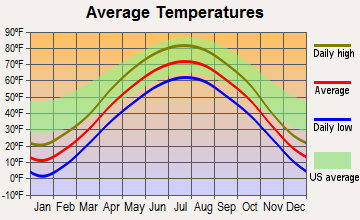
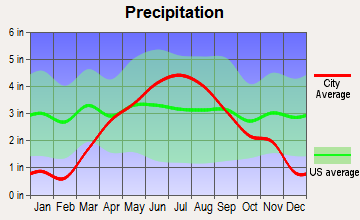
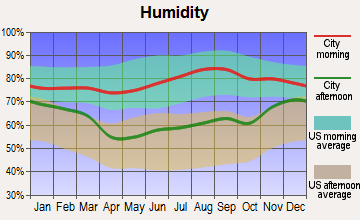
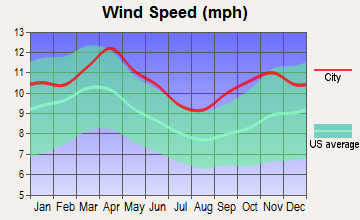
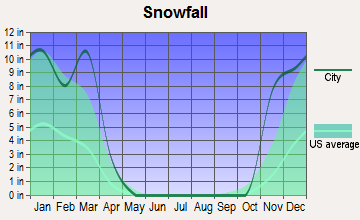
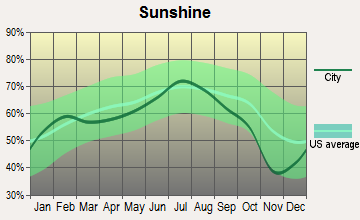
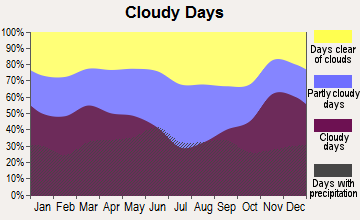
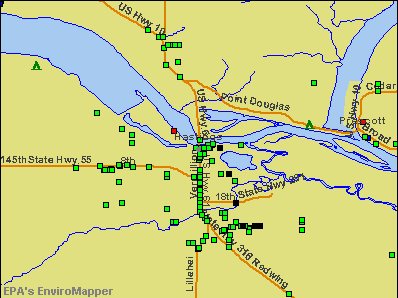

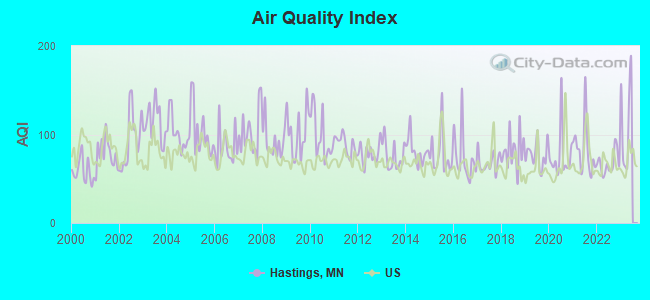
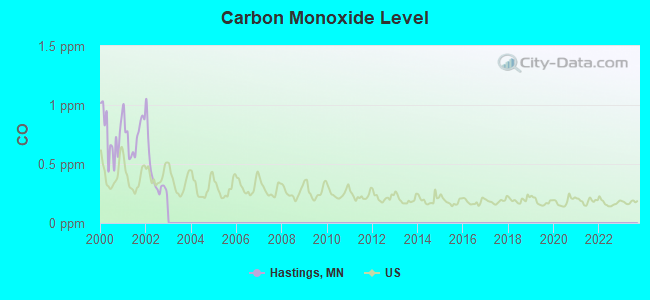
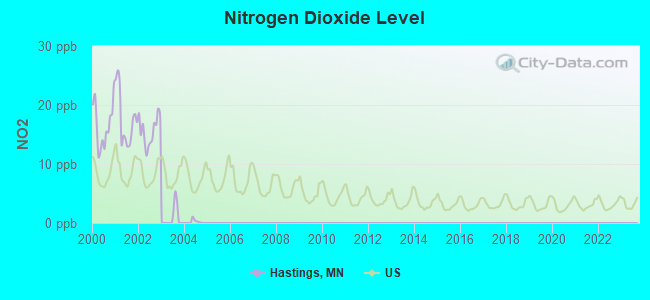
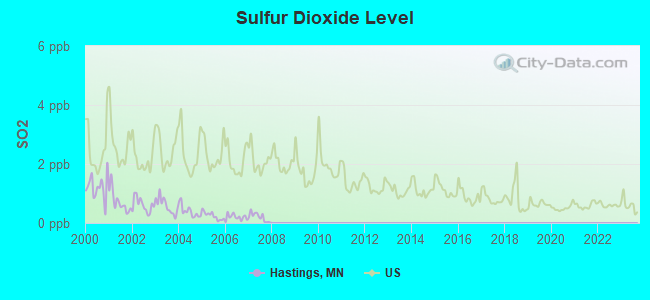
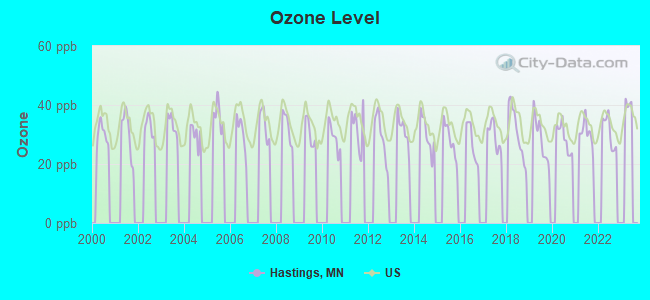
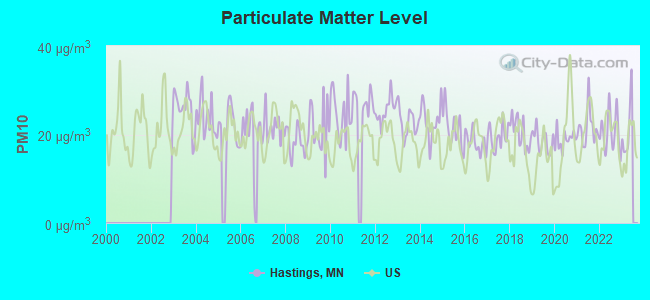
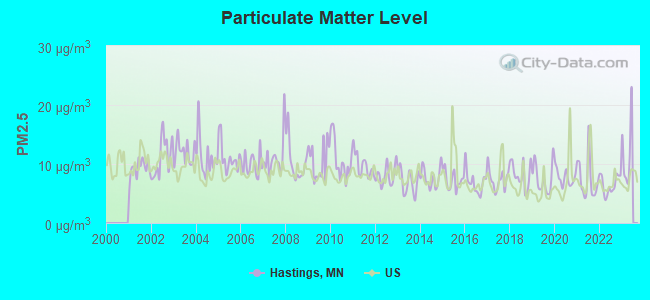
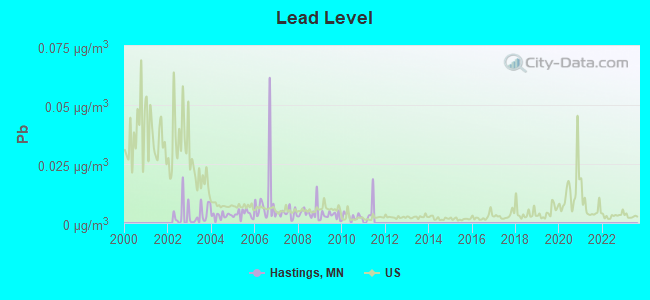
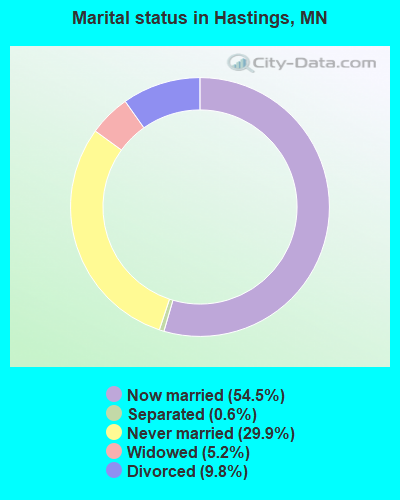
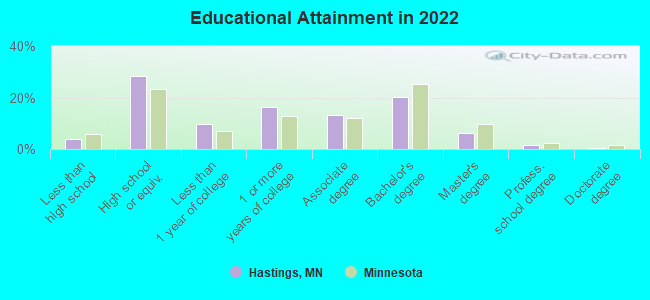
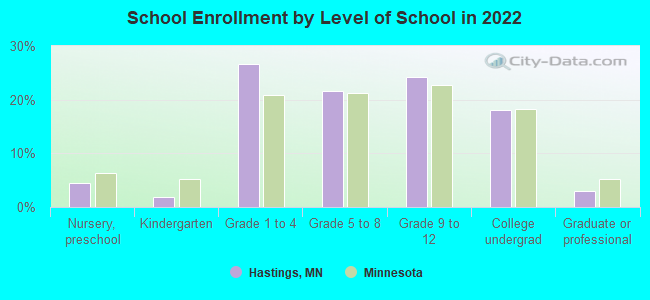
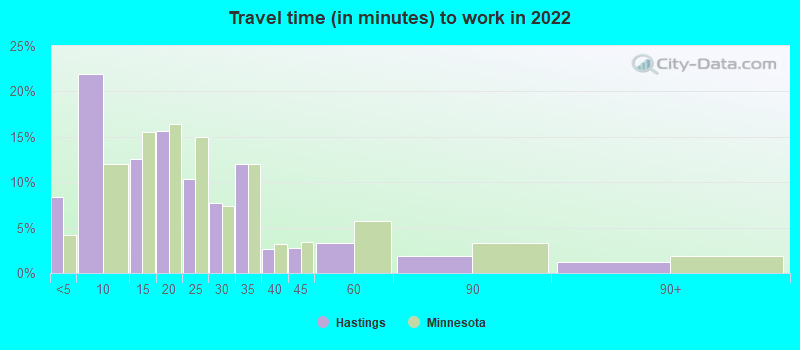
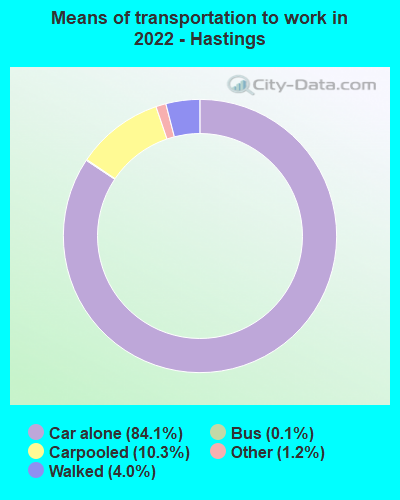
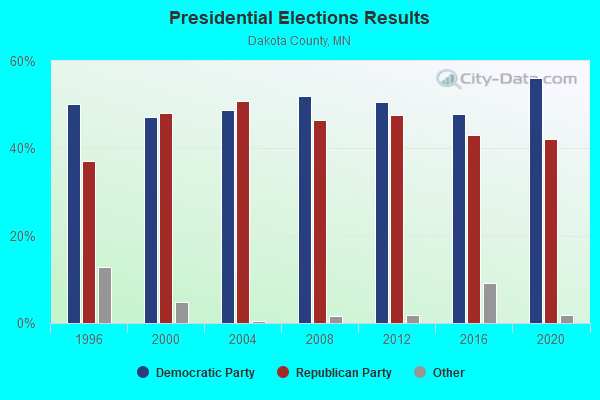
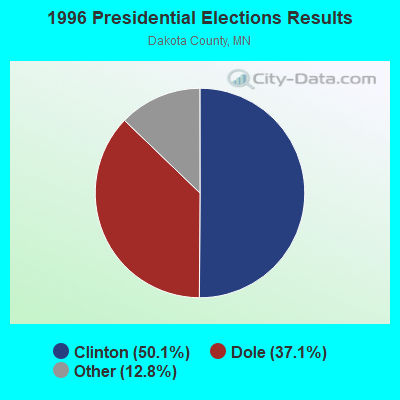
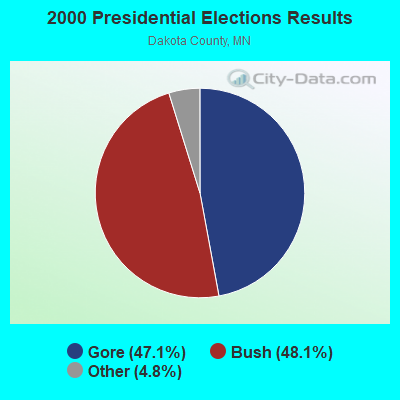
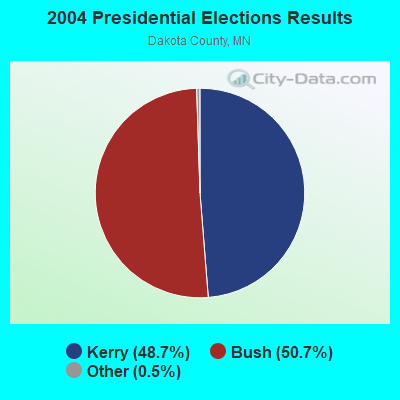
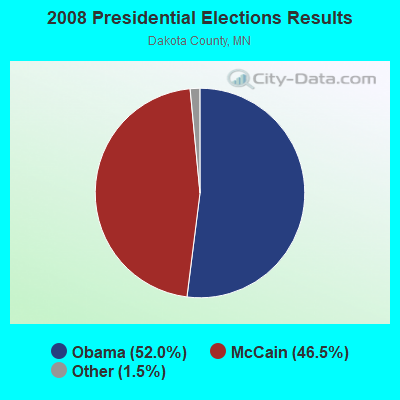
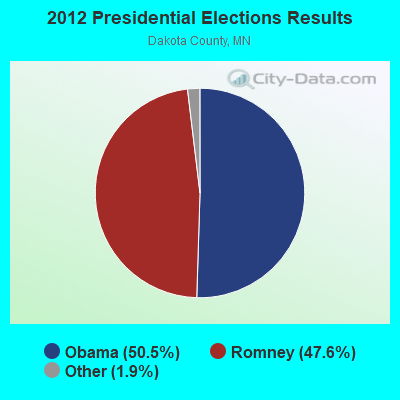
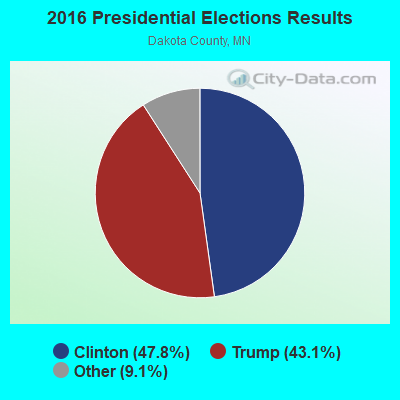
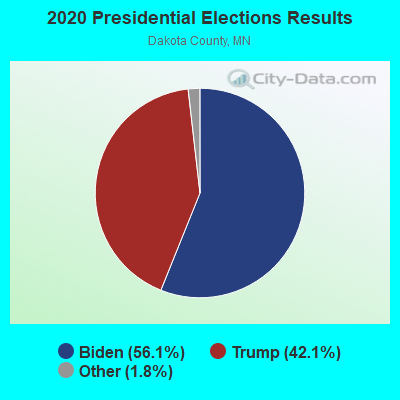
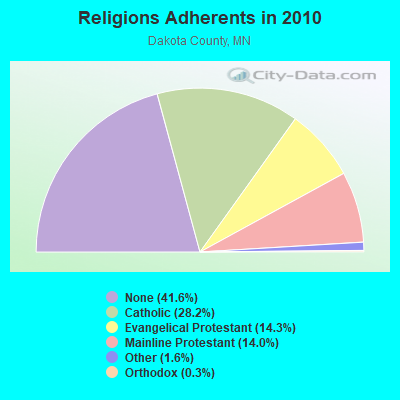
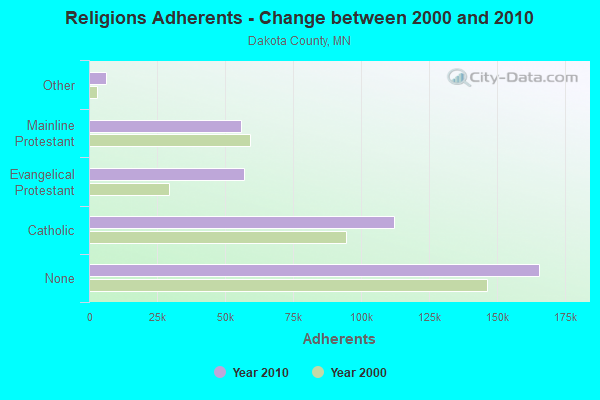
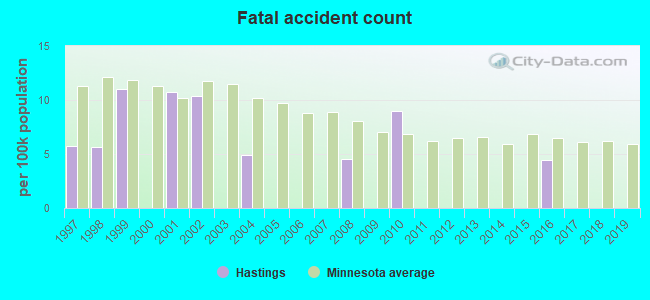
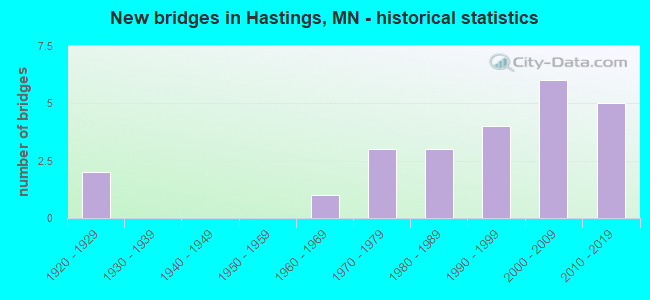
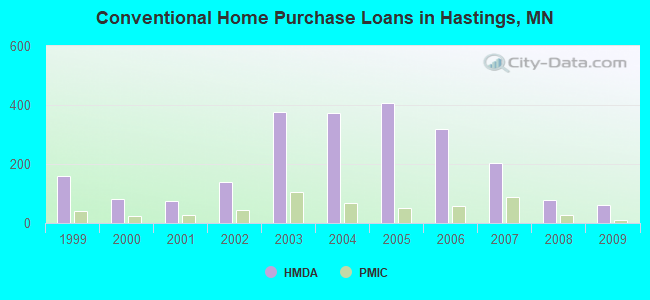
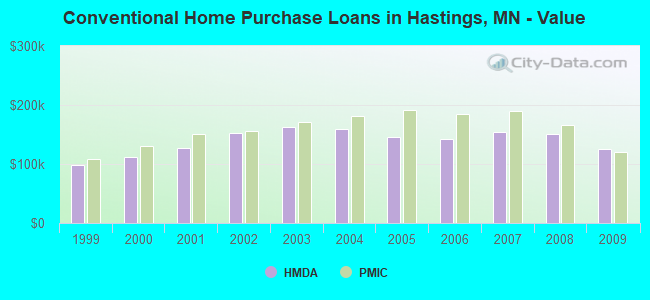
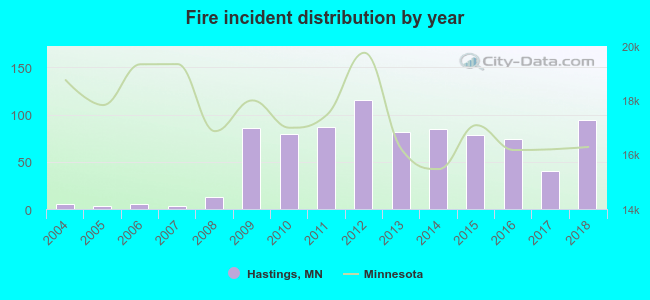 Based on the data from the years 2004 - 2018 the average number of fire incidents per year is 57. The highest number of fire incidents - 115 took place in 2012, and the least - 3 in 2005. The data has an increasing trend.
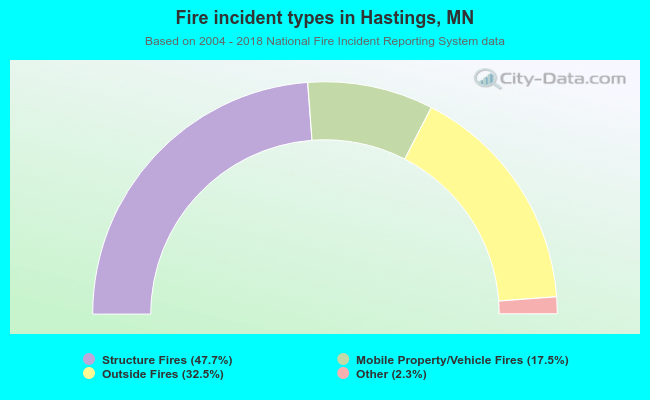 When looking into fire subcategories, the most incidents belonged to: Structure Fires (47.7%), and Outside Fires (32.5%).