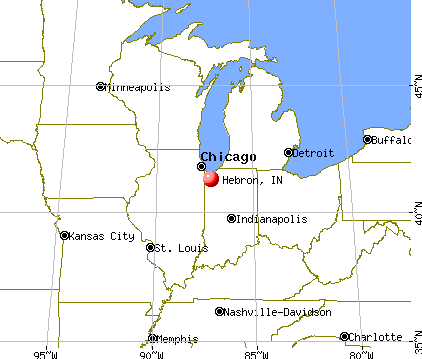
Hebron, Indiana
Submit your own pictures of this town and show them to the world
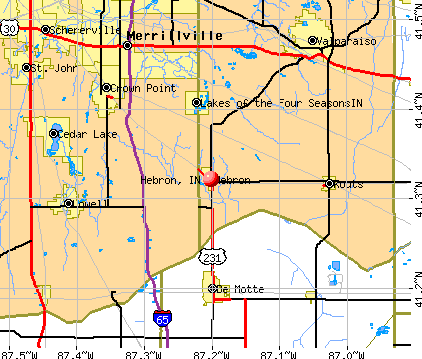
- OSM Map
- General Map
- Google Map
- MSN Map
Population change since 2000: +4.0%
 |
| Males: 1,982 | |
| Females: 1,758 |
| Median resident age: | 38.3 years |
| Indiana median age: | 38.2 years |
Zip codes: 46341.
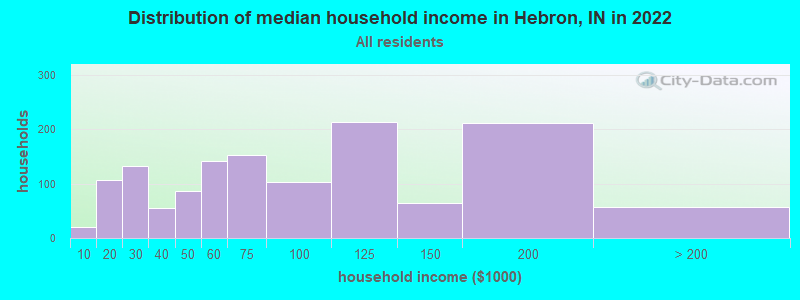
| Hebron: | $70,908 |
| IN: | $66,785 |
Estimated per capita income in 2022: $33,877 (it was $18,119 in 2000)
Hebron town income, earnings, and wages data
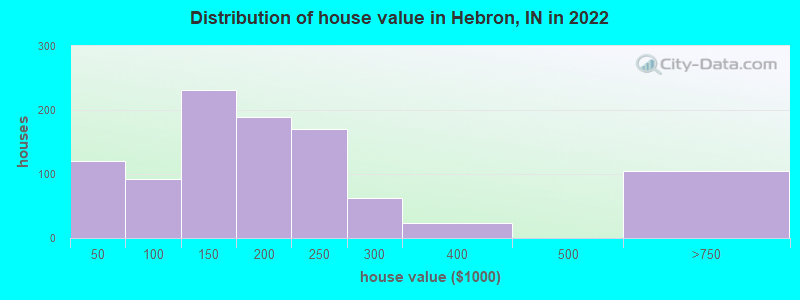
Estimated median house or condo value in 2022: $193,098 (it was $99,100 in 2000)
| Hebron: | $193,098 |
| IN: | $208,700 |
Mean prices in 2022: all housing units: $192,337; detached houses: $209,656; mobile homes: $8,215
Median gross rent in 2022: $907.
Detailed information about poverty and poor residents in Hebron, IN
Compare current foreclosures in Hebron, IN:
| Photo | Address | Area | Beds / Baths | Price | Details |
|---|---|---|---|---|---|

|
#1
Fairlane Ct
Hebron, IN 46341
|
1,260 sq. feet
|
2 baths 3 beds |
show details | |

|
#2
County Line Rd
Hebron, IN 46341
|
2,508 sq. feet
|
3 baths 3 beds |
show details | |

|
#3
S Main St
Hebron, IN 46341
|
2,157 sq. feet
|
3 baths 4 beds |
show details | |

|
#4
W Sigler St
Hebron, IN 46341
|
1,061 sq. feet
|
1 baths 3 beds |
show details | |

|
#5
Butternut Ct
Hebron, IN 46341
|
1,176 sq. feet
|
1 baths 3 beds |
show details | |

|
#6
Locust Ave
Hebron, IN 46341
|
1,912 sq. feet
|
2 baths 4 beds |
show details | |

|
#7
W 100 S
Hebron, IN 46341
|
3,124 sq. feet
|
3 baths 5 beds |
show details | |

|
#8
Walnut Ct
Hebron, IN 46341
|
1,120 sq. feet
|
2 baths 3 beds |
show details | |

|
#9
S 600 W
Hebron, IN 46341
|
1,508 sq. feet
|
2 baths 3 beds |
show details | |

|
#10
S 500 W
Hebron, IN 46341
|
1,248 sq. feet
|
2 baths 3 beds |
show details |
| Photo | Address | Area | Beds / Baths | Price | Details |
|---|---|---|---|---|---|

|
#11
Marvin Gdns
Hebron, IN 46341
|
2,240 sq. feet
|
2 baths 4 beds |
show details | |

|
#12
W Bates St
Hebron, IN 46341
|
1,884 sq. feet
|
1 baths 3 beds |
show details | |

|
#13
Sunset Rd
Hebron, IN 46341
|
1,984 sq. feet
|
1 baths 4 beds |
show details | |

|
#14
Hickory Ave
Hebron, IN 46341
|
2,162 sq. feet
|
2 baths 4 beds |
show details | |

|
#15
S California St
Hebron, IN 46341
|
2,001 sq. feet
|
2 baths - beds |
show details | |

|
#16
S State Road 2
Hebron, IN 46341
|
2,704 sq. feet
|
3 baths 4 beds |
show details | |

|
#17
Oak Brook Dr
Hebron, IN 46341
|
1,516 sq. feet
|
1 baths 3 beds |
show details | |

|
#18
W State Road 8
Hebron, IN 46341
|
1,539 sq. feet
|
2 baths - beds |
show details | |

|
#19
Clay St
Hebron, IN 46341
|
2,941 sq. feet
|
2 baths 3 beds |
show details | |

|
#20
S 600 W
Hebron, IN 46341
|
702 sq. feet
|
1 baths 3 beds |
show details |
| Photo | Address | Area | Beds / Baths | Price | Details |
|---|---|---|---|---|---|

|
#21
Springwood Dr
Hebron, IN 46341
|
2,586 sq. feet
|
2 baths 4 beds |
show details | |

|
#22
Ventnor
Hebron, IN 46341
|
2,352 sq. feet
|
2 baths 4 beds |
show details | |

|
#23
S 400 W
Hebron, IN 46341
|
4,134 sq. feet
|
3 baths 4 beds |
show details | |

|
#24
Walter Dr
Hebron, IN 46341
|
1,604 sq. feet
|
2 baths 3 beds |
show details | |

|
#25
Mcalpin St
Hebron, IN 46341
|
1,248 sq. feet
|
2 baths 3 beds |
show details | |

|
#26
Butternut Ct
Hebron, IN 46341
|
1,120 sq. feet
|
1 baths 3 beds |
show details | |

|
#27
S 600 W
Hebron, IN 46341
|
1,768 sq. feet
|
1 baths - beds |
show details | |

|
#28
W Jackson St
Hebron, IN 46341
|
1,704 sq. feet
|
1 baths - beds |
show details | |

|
#29
W 50 S
Hebron, IN 46341
|
2,184 sq. feet
|
3 baths - beds |
show details | |

|
#30
Clarendon Dr
Hebron, IN 46341
|
1,684 sq. feet
|
2 baths - beds |
show details |
| Photo | Address | Area | Beds / Baths | Price | Details |
|---|---|---|---|---|---|

|
#31
W State Road 8
Hebron, IN 46341
|
624 sq. feet
|
1 baths - beds |
show details | |

|
#32
S 300 W
Hebron, IN 46341
|
1,992 sq. feet
|
2 baths - beds |
show details | |

|
#33
W 250 S
Hebron, IN 46341
|
1,180 sq. feet
|
1 baths - beds |
show details | |

|
#34
E Bates St
Hebron, IN 46341
|
1,393 sq. feet
|
1 baths - beds |
show details | |

|
#35
Sycamore Ct
Hebron, IN 46341
|
- sq. feet
|
- baths - beds |
show details | |

|
#36
Aspen St
Hebron, IN 46341
|
- sq. feet
|
- baths - beds |
show details | |

|
#37
Misty Ln Apt 7
Hebron, IN 46341
|
- sq. feet
|
- baths - beds |
show details | |

|
#38
W Sigler St
Hebron, IN 46341
|
- sq. feet
|
- baths - beds |
show details | |

|
#39
Sycamore Ct
Hebron, IN 46341
|
- sq. feet
|
- baths - beds |
show details | |

|
#40
S Washington St
Hebron, IN 46341
|
- sq. feet
|
- baths - beds |
show details |
| Photo | Address | Area | Beds / Baths | Price | Details |
|---|---|---|---|---|---|

|
#41
S 500 W
Hebron, IN 46341
|
- sq. feet
|
- baths - beds |
show details | |

|
#42
E 181st Ave # 2
Hebron, IN 46341
|
- sq. feet
|
- baths - beds |
show details | |

|
#43
N Washington St
Hebron, IN 46341
|
- sq. feet
|
- baths - beds |
show details | |

|
#44
E 181st Ave
Hebron, IN 46341
|
- sq. feet
|
- baths - beds |
show details | |

|
#45
S California St
Hebron, IN 46341
|
- sq. feet
|
- baths - beds |
show details | |

|
#46
Locust Ave S
Hebron, IN 46341
|
- sq. feet
|
- baths - beds |
show details | |

|
#47
W State Road 8
Hebron, IN 46341
|
- sq. feet
|
- baths - beds |
show details | |

|
Check over 1 million property listings on Foreclosure.com!
|
browse all offers | |||


- 3,18288.3%White alone
- 3549.8%Hispanic
- 150.4%Two or more races
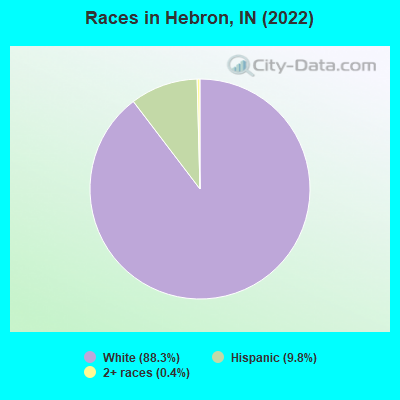
Races in Hebron detailed stats: ancestries, foreign born residents, place of birth
According to our research of Indiana and other state lists, there were 5 registered sex offenders living in Hebron, Indiana as of June 16, 2024.
The ratio of all residents to sex offenders in Hebron is 812 to 1.
The ratio of registered sex offenders to all residents in this city is lower than the state average.
Type |
2009 |
2010 |
2011 |
2012 |
|---|---|---|---|---|
| Murders (per 100,000) | 0 (0.0) | 0 (0.0) | 0 (0.0) | 0 (0.0) |
| Rapes (per 100,000) | 0 (0.0) | 0 (0.0) | 0 (0.0) | 0 (0.0) |
| Robberies (per 100,000) | 0 (0.0) | 1 (26.9) | 0 (0.0) | 0 (0.0) |
| Assaults (per 100,000) | 1 (27.0) | 7 (188.0) | 3 (80.1) | 0 (0.0) |
| Burglaries (per 100,000) | 3 (80.9) | 1 (26.9) | 1 (26.7) | 1 (26.6) |
| Thefts (per 100,000) | 3 (80.9) | 29 (778.7) | 12 (320.6) | 2 (53.1) |
| Auto thefts (per 100,000) | 3 (80.9) | 2 (53.7) | 1 (26.7) | 0 (0.0) |
| Arson (per 100,000) | 0 (0.0) | 0 (0.0) | 0 (0.0) | 0 (0.0) |
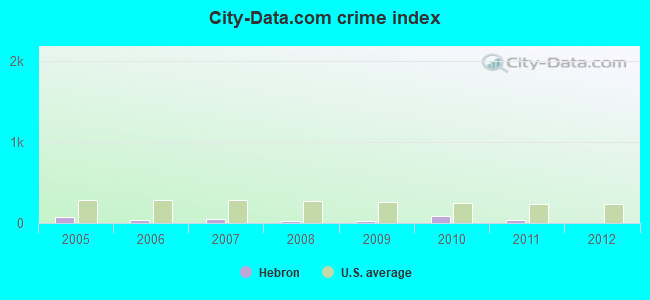
| City-Data.com crime index | 20.8 | 83.0 | 32.9 | 4.0 |
The City-Data.com crime index weighs serious crimes and violent crimes more heavily. Higher means more crime, U.S. average is 246.1. It adjusts for the number of visitors and daily workers commuting into cities.
Crime rate in Hebron detailed stats: murders, rapes, robberies, assaults, burglaries, thefts, arson
Full-time law enforcement employees in 2012, including police officers: 8 (7 officers - 7 male; 0 female).
| Officers per 1,000 residents here: | 1.86 |
| Indiana average: | 1.96 |
 Recent articles from our blog. Our writers, many of them Ph.D. graduates or candidates, create easy-to-read articles on a wide variety of topics.

 | Winfield, IN (21 replies) |
| Chicago family looking for some land, space, and chickens in NWI (6 replies) |
| Portage Homes for Sale? (9 replies) |
| Illinois To NWI Migration (361 replies) |
| small towns in the area (9 replies) |
| NWI Population Trends (26 replies) |
Latest news from Hebron, IN collected exclusively by city-data.com from local newspapers, TV, and radio stations
Ancestries: German (20.0%), Polish (17.9%), American (16.3%), Slovak (6.3%), Italian (3.6%), Irish (2.6%).
Current Local Time: CST time zone
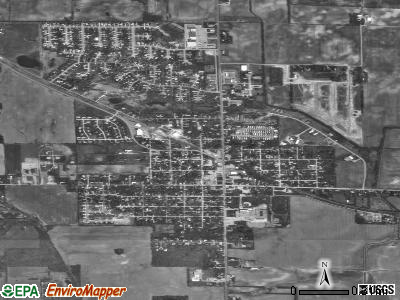
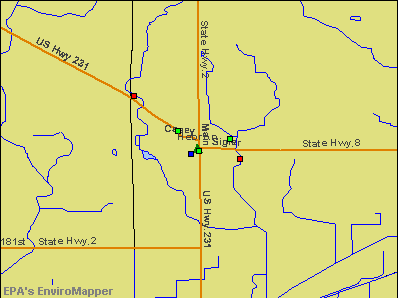
Elevation: 703 feet
Land area: 1.55 square miles.
Population density: 2,414 people per square mile (low).
78 residents are foreign born (2.0% Latin America).
| This town: | 2.2% |
| Indiana: | 5.6% |
Median real estate property taxes paid for housing units with mortgages in 2022: $1,302 (0.6%)
Median real estate property taxes paid for housing units with no mortgage in 2022: $1,392 (1.0%)
Nearest city with pop. 50,000+: Gary, IN  (19.4 miles , pop. 102,746).
Nearest city with pop. 200,000+: Chicago, IL (43.6 miles , pop. 2,896,016).
Nearest cities:
), ), ), ), Latitude: 41.32 N, Longitude: 87.20 W
Area code: 219
Hebron, Indiana accommodation & food services, waste management - Economy and Business Data
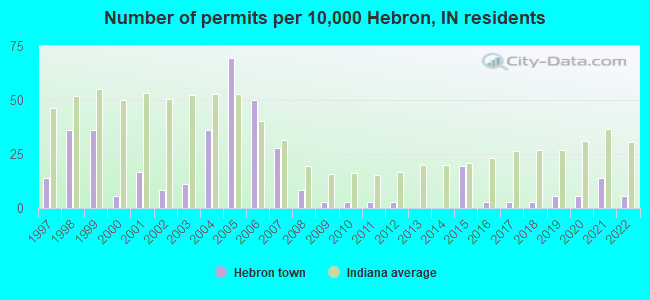
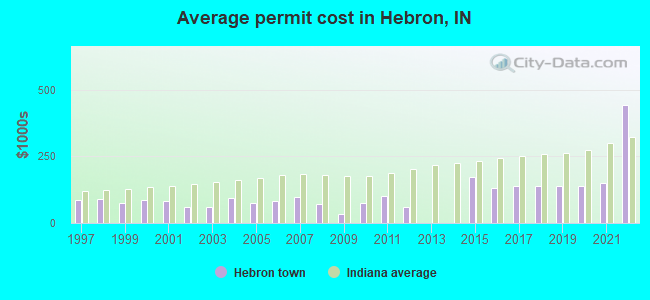
Single-family new house construction building permits:
- 2022: 2 buildings, average cost: $442,500
- 2021: 5 buildings, average cost: $148,000
- 2020: 2 buildings, average cost: $140,000
- 2019: 2 buildings, average cost: $140,000
- 2018: 1 building, cost: $140,000
- 2017: 1 building, cost: $140,000
- 2016: 1 building, cost: $130,000
- 2015: 7 buildings, average cost: $174,100
- 2012: 1 building, cost: $60,000
- 2011: 1 building, cost: $100,000
- 2010: 1 building, cost: $75,000
- 2009: 1 building, cost: $31,500
- 2008: 3 buildings, average cost: $73,300
- 2007: 10 buildings, average cost: $96,700
- 2006: 18 buildings, average cost: $81,700
- 2005: 25 buildings, average cost: $74,500
- 2004: 13 buildings, average cost: $91,600
- 2003: 4 buildings, average cost: $59,100
- 2002: 3 buildings, average cost: $60,000
- 2001: 6 buildings, average cost: $81,700
- 2000: 2 buildings, average cost: $85,000
- 1999: 13 buildings, average cost: $76,100
- 1998: 13 buildings, average cost: $89,800
- 1997: 5 buildings, average cost: $88,000
| Here: | 3.2% |
| Indiana: | 2.8% |
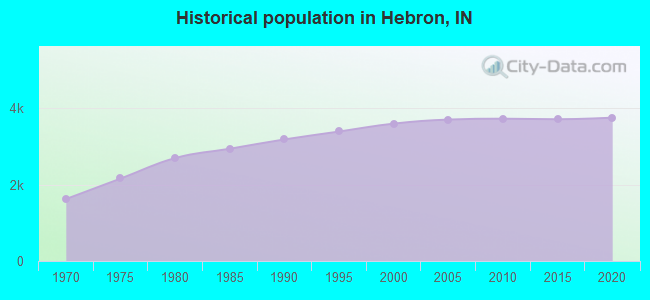
Population change in the 1990s: +355 (+11.0%).
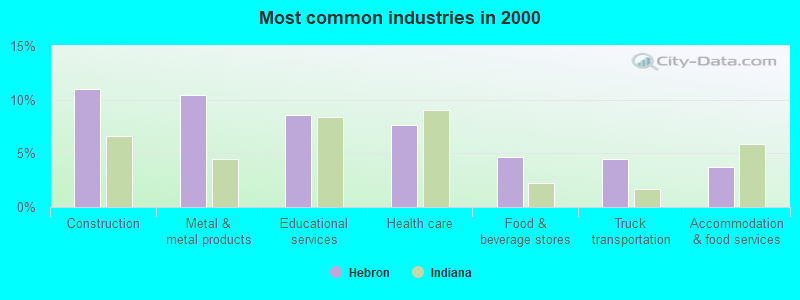
- Construction (11.0%)
- Metal & metal products (10.4%)
- Educational services (8.5%)
- Health care (7.6%)
- Food & beverage stores (4.6%)
- Truck transportation (4.4%)
- Accommodation & food services (3.7%)
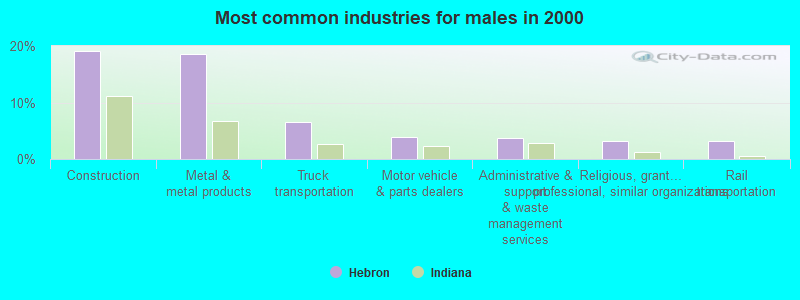
- Construction (19.2%)
- Metal & metal products (18.6%)
- Truck transportation (6.6%)
- Motor vehicle & parts dealers (3.9%)
- Administrative & support & waste management services (3.7%)
- Religious, grantmaking, civic, professional, similar organizations (3.2%)
- Rail transportation (3.1%)
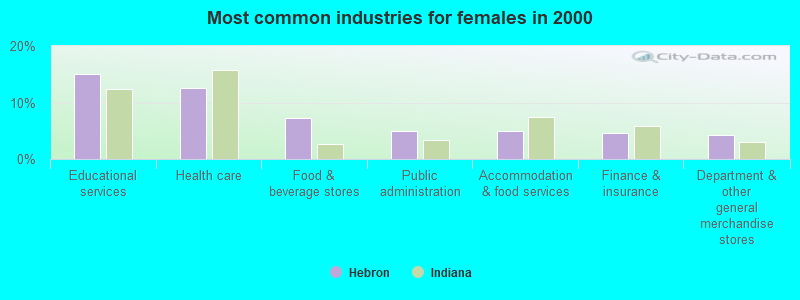
- Educational services (15.0%)
- Health care (12.5%)
- Food & beverage stores (7.3%)
- Public administration (4.9%)
- Accommodation & food services (4.9%)
- Finance & insurance (4.6%)
- Department & other general merchandise stores (4.3%)
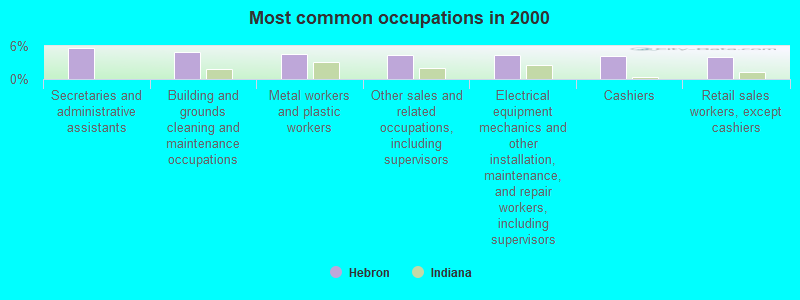
- Secretaries and administrative assistants (5.6%)
- Building and grounds cleaning and maintenance occupations (4.9%)
- Metal workers and plastic workers (4.5%)
- Other sales and related occupations, including supervisors (4.4%)
- Electrical equipment mechanics and other installation, maintenance, and repair workers, including supervisors (4.3%)
- Cashiers (4.2%)
- Retail sales workers, except cashiers (4.0%)
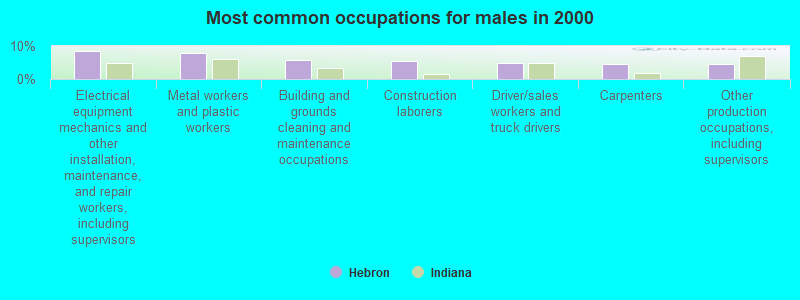
- Electrical equipment mechanics and other installation, maintenance, and repair workers, including supervisors (8.4%)
- Metal workers and plastic workers (7.9%)
- Building and grounds cleaning and maintenance occupations (5.9%)
- Construction laborers (5.5%)
- Driver/sales workers and truck drivers (4.7%)
- Carpenters (4.6%)
- Other production occupations, including supervisors (4.6%)
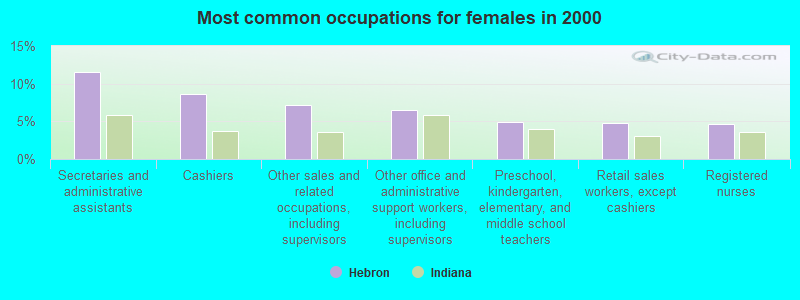
- Secretaries and administrative assistants (11.6%)
- Cashiers (8.6%)
- Other sales and related occupations, including supervisors (7.2%)
- Other office and administrative support workers, including supervisors (6.5%)
- Preschool, kindergarten, elementary, and middle school teachers (4.9%)
- Retail sales workers, except cashiers (4.8%)
- Registered nurses (4.6%)
Average climate in Hebron, Indiana
Based on data reported by over 4,000 weather stations


|
|

(lower is better)
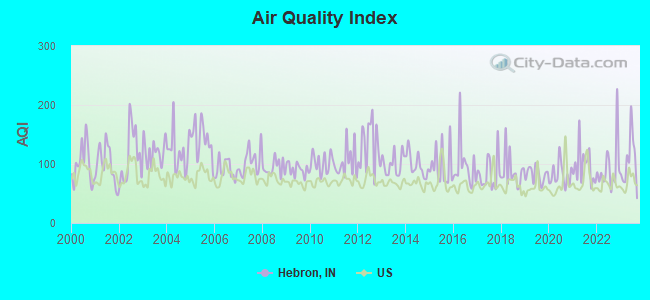
Air Quality Index (AQI) level in 2023 was 104. This is significantly worse than average.
| City: | 104 |
| U.S.: | 73 |
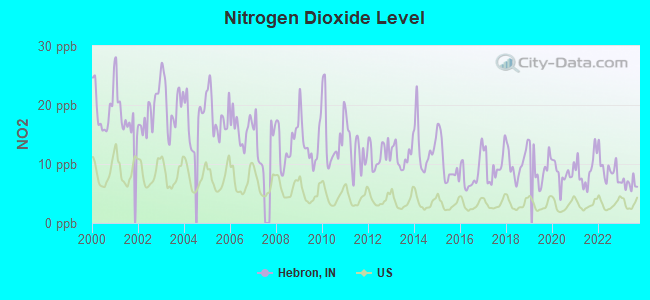
Nitrogen Dioxide (NO2) [ppb] level in 2023 was 6.64. This is worse than average. Closest monitor was 8.7 miles away from the city center.
| City: | 6.64 |
| U.S.: | 5.11 |
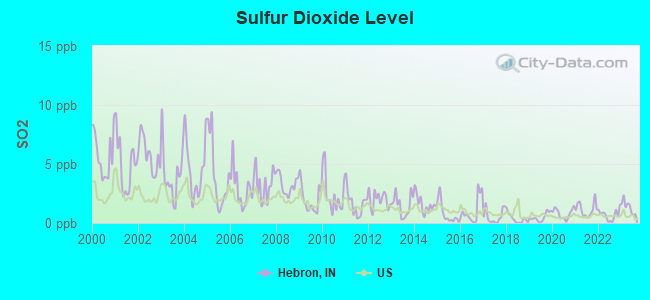
Sulfur Dioxide (SO2) [ppb] level in 2023 was 1.36. This is about average. Closest monitor was 9.2 miles away from the city center.
| City: | 1.36 |
| U.S.: | 1.51 |
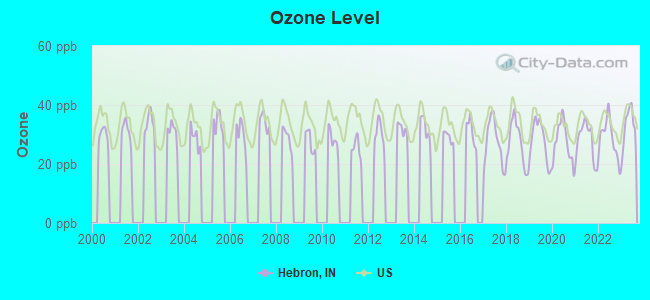
Ozone [ppb] level in 2023 was 32.9. This is about average. Closest monitor was 12.4 miles away from the city center.
| City: | 32.9 |
| U.S.: | 33.3 |
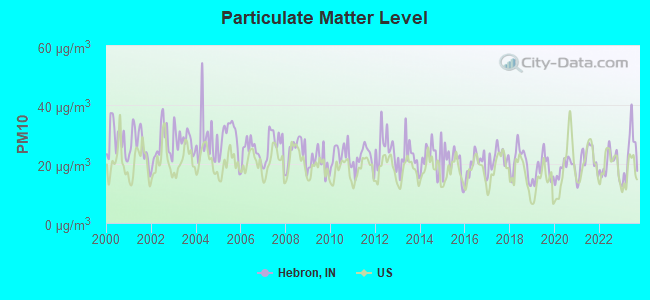
Particulate Matter (PM10) [µg/m3] level in 2023 was 23.2. This is worse than average. Closest monitor was 12.9 miles away from the city center.
| City: | 23.2 |
| U.S.: | 19.2 |
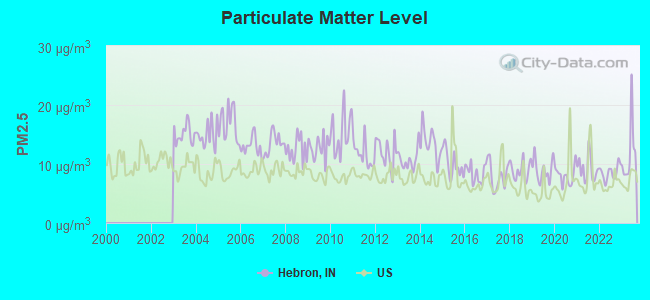
Particulate Matter (PM2.5) [µg/m3] level in 2023 was 11.8. This is significantly worse than average. Closest monitor was 19.4 miles away from the city center.
| City: | 11.8 |
| U.S.: | 8.1 |
Tornado activity:
Hebron-area historical tornado activity is near Indiana state average. It is 72% greater than the overall U.S. average.
On 4/17/1963, a category F4 (max. wind speeds 207-260 mph) tornado 24.0 miles away from the Hebron town center killed one person and injured 70 people and caused between $500,000 and $5,000,000 in damages.
On 4/11/1965, a category F3 (max. wind speeds 158-206 mph) tornado 2.0 miles away from the town center caused between $5,000,000 and $50,000,000 in damages.
Earthquake activity:
Hebron-area historical earthquake activity is significantly above Indiana state average. It is 40% greater than the overall U.S. average.On 4/18/2008 at 09:36:59, a magnitude 5.4 (5.1 MB, 4.8 MS, 5.4 MW, 5.2 MW, Class: Moderate, Intensity: VI - VII) earthquake occurred 201.8 miles away from the city center
On 6/10/1987 at 23:48:54, a magnitude 5.1 (4.9 MB, 4.4 MS, 4.6 MS, 5.1 LG) earthquake occurred 176.7 miles away from Hebron center
On 4/18/2008 at 09:36:59, a magnitude 5.2 (5.2 MW, Depth: 8.9 mi) earthquake occurred 201.8 miles away from the city center
On 6/18/2002 at 17:37:15, a magnitude 5.0 (4.3 MB, 4.6 MW, 5.0 LG) earthquake occurred 232.7 miles away from the city center
On 4/18/2008 at 15:14:16, a magnitude 4.8 (4.5 MB, 4.8 MW, 4.6 MW, Class: Light, Intensity: IV - V) earthquake occurred 199.8 miles away from Hebron center
On 7/27/1980 at 18:52:21, a magnitude 5.2 (5.1 MB, 4.7 MS, 5.0 UK, 5.2 UK) earthquake occurred 276.5 miles away from the city center
Magnitude types: regional Lg-wave magnitude (LG), body-wave magnitude (MB), surface-wave magnitude (MS), moment magnitude (MW)
Natural disasters:
The number of natural disasters in Porter County (12) is smaller than the US average (15).Major Disasters (Presidential) Declared: 6
Emergencies Declared: 4
Causes of natural disasters: Floods: 6, Storms: 5, Winter Storms: 4, Tornadoes: 2, Hurricane: 1, Snow: 1, Other: 1 (Note: some incidents may be assigned to more than one category).

Hospitals and medical centers in Hebron:
Other hospitals and medical centers near Hebron:
- CHICAGOLAND CHRISTIAN VILLAGE (Nursing Home, about 7 miles away; CROWN POINT, IN)
- CLINICAL MANAGEMENT SERVICES INC (Home Health Center, about 8 miles away; DEMOTTE, IN)
- OAK GROVE CHRISTIAN RETIREMENT VILLAGE (Nursing Home, about 9 miles away; DEMOTTE, IN)
- FMC - CROWN POINT (Dialysis Facility, about 10 miles away; CROWN POINT, IN)
- WITTENBERG LUTHERAN VILLAGE (Nursing Home, about 10 miles away; CROWN POINT, IN)
- IN-PACT INC (Hospital, about 10 miles away; CROWN POINT, IN)
- ARC BRIDGES, INC (Hospital, about 10 miles away; CROWN POINT, IN)
Heliports located in Hebron:
Colleges/universities with over 2000 students nearest to Hebron:
- Valparaiso University (about 13 miles; Valparaiso, IN; Full-time enrollment: 3,542)
- Indiana University-Northwest (about 18 miles; Gary, IN; FT enrollment: 4,390)
- Purdue University-Calumet Campus (about 24 miles; Hammond, IN; FT enrollment: 7,343)
- Purdue University-North Central Campus (about 25 miles; Westville, IN; FT enrollment: 3,682)
- Prairie State College (about 27 miles; Chicago Heights, IL; FT enrollment: 4,050)
- Governors State University (about 29 miles; University Park, IL; FT enrollment: 4,043)
- South Suburban College (about 30 miles; South Holland, IL; FT enrollment: 3,972)
Public high school in Hebron:
- HEBRON HIGH SCHOOL (Students: 352, Location: 509 S MAIN ST, Grades: 9-12)
Public elementary/middle schools in Hebron:
- HEBRON ELEMENTARY SCHOOL (Students: 504, Location: 307 S MAIN ST, Grades: KG-5)
- PORTER LAKES ELEMENTARY SCHOOL (Students: 432, Location: 208 S 725 W, Grades: KG-3)
- HEBRON MIDDLE SCHOOL (Students: 273, Location: 307 S MAIN ST, Grades: 6-8)
Points of interest:
Notable location: Hebron Fire Department (A). Display/hide its location on the map
Park in Hebron: Louis Alyea Memorial Park (1). Display/hide its location on the map
Hotels: Northwestern Indiana Telephone CO (205 North Washington), Super 8 Hebron Lowell Area (3423 East State Road 2).
Drinking water stations with addresses in Hebron and their reported violations in the past:
HEBRON WATER DEPARTMENT (Population served: 3,400, Groundwater):Past health violations:CEDAR CREEK MOBILE HOME PARK (Population served: 150, Groundwater):Past monitoring violations:
- MCL, Acute (TCR) - In SEP-2011, Contaminant: Coliform. Follow-up actions: St Public Notif requested (SEP-15-2011), St Violation/Reminder Notice (SEP-15-2011), St Boil Water Order (SEP-15-2011), St Compliance achieved (MAR-02-2012)
- MCL, Acute (TCR) - In JUL-2008, Contaminant: Coliform. Follow-up actions: St Violation/Reminder Notice (JUL-24-2008), St Public Notif requested (JUL-24-2008), St Boil Water Order (JUL-24-2008), St Compliance achieved (MAR-02-2012)
- Monitoring and Reporting (DBP) - Between JAN-2007 and DEC-2007, Contaminant: Total Haloacetic Acids (HAA5). Follow-up actions: St Violation/Reminder Notice (NOV-19-2007), St Public Notif requested (NOV-19-2007), St Public Notif received (DEC-04-2007), St Compliance achieved (DEC-04-2007), St Violation/Reminder Notice (DEC-07-2007)
- Monitoring and Reporting (DBP) - Between JAN-2007 and DEC-2007, Contaminant: TTHM. Follow-up actions: St Public Notif requested (NOV-19-2007), St Violation/Reminder Notice (NOV-19-2007), St Compliance achieved (DEC-04-2007), St Public Notif received (DEC-04-2007), St Violation/Reminder Notice (DEC-07-2007)
- 4 minor monitoring violations
Past monitoring violations:SALEM UNITED METHODIST FELLOWSHIP (Population served: 100, Groundwater):
- Lead Consumer Notice - In JAN-01-2013, Contaminant: Lead and Copper Rule. Follow-up actions: St Violation/Reminder Notice (APR-12-2013), St Intentional no-action (JAN-08-2014)
- Follow-up Or Routine LCR Tap M/R - In JAN-01-2004, Contaminant: Lead and Copper Rule. Follow-up actions: St Public Notif requested (NOV-07-2003), St Violation/Reminder Notice (2 times from NOV-07-2003 to FEB-04-2004), St Compliance achieved (NOV-21-2006)
- One routine major monitoring violation
Past monitoring violations:RANGE LINE PRESBYTERIAN CHURCH (Population served: 58, Groundwater):
- 3 routine major monitoring violations
- One regular monitoring violation
Past monitoring violations:PRIDE TRUCK WASH LLC (Population served: 25, Groundwater):
- 3 routine major monitoring violations
Past monitoring violations:
- 7 routine major monitoring violations
- One regular monitoring violation
Drinking water stations with addresses in Hebron that have no violations reported:
- R & P DEVELOPMT DBA COMFORT INN (Population served: 25, Primary Water Source Type: Groundwater)
| This town: | 2.6 people |
| Indiana: | 2.5 people |
| This town: | 68.3% |
| Whole state: | 66.9% |
| This town: | 6.4% |
| Whole state: | 6.9% |
Likely homosexual households (counted as self-reported same-sex unmarried-partner households)
- Lesbian couples: 0.1% of all households
- Gay men: 0.3% of all households
Banks with branches in Hebron (2011 data):
- 1st Source Bank: Hebron-Patz Branch at 800 Country Square Plaza, branch established on 1990/06/01; Hebron Branch at 111 West Sigler Street, branch established on 1889/01/01. Info updated 2008/06/16: Bank assets: $4,361.6 mil, Deposits: $3,520.6 mil, headquarters in South Bend, IN, positive income, Commercial Lending Specialization, 79 total offices, Holding Company: 1st Source Corporation
- DeMotte State Bank: Hebron Branch at 507 South Main Street, branch established on 1976/04/24. Info updated 2006/11/03: Bank assets: $359.4 mil, Deposits: $277.9 mil, headquarters in Demotte, IN, positive income, 11 total offices, Holding Company: Demotte Bancorp
For population 15 years and over in Hebron:
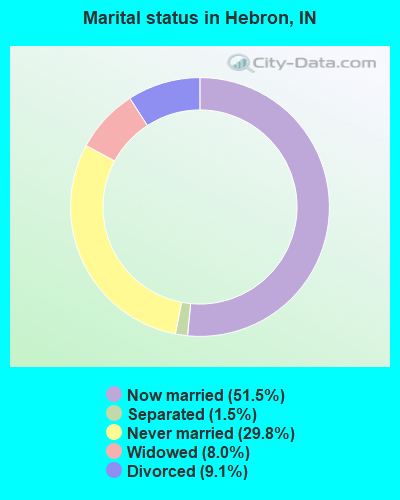
- Never married: 29.8%
- Now married: 51.5%
- Separated: 1.5%
- Widowed: 8.0%
- Divorced: 9.1%
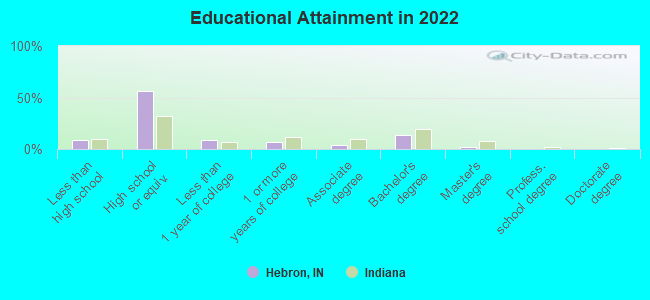
For population 25 years and over in Hebron:
- High school or higher: 91.0%
- Bachelor's degree or higher: 15.0%
- Graduate or professional degree: 1.5%
- Unemployed: 5.4%
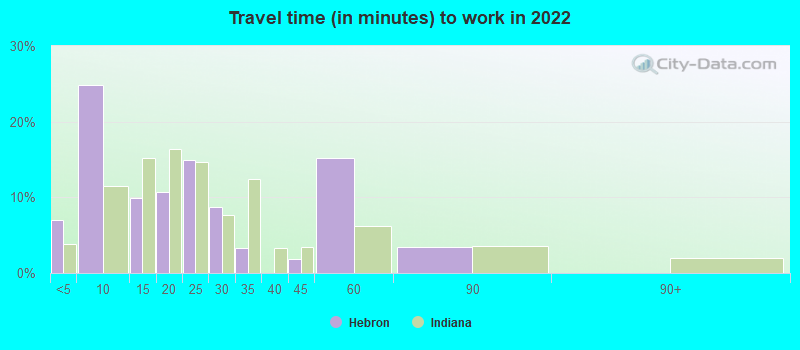
- Mean travel time to work (commute): 32.0 minutes
| Here: | 7.7 |
| Indiana average: | 11.3 |
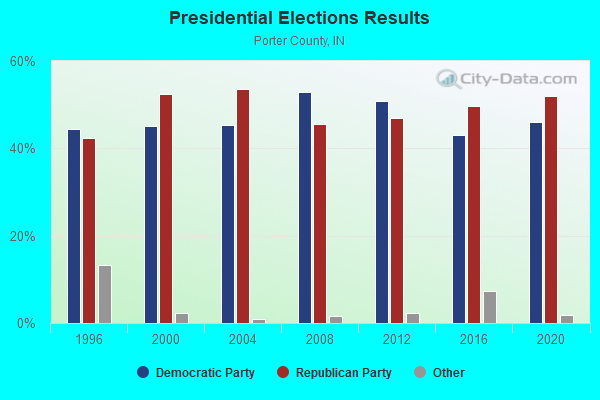
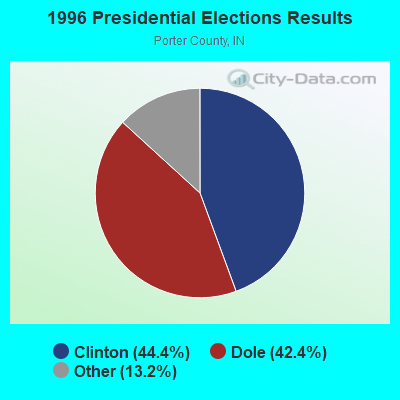
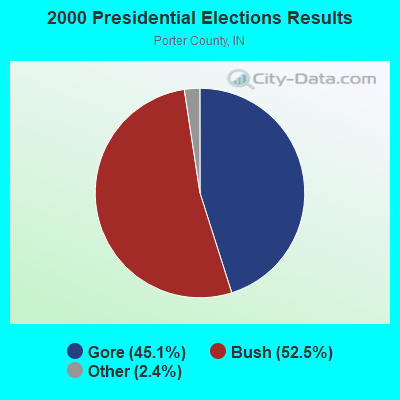
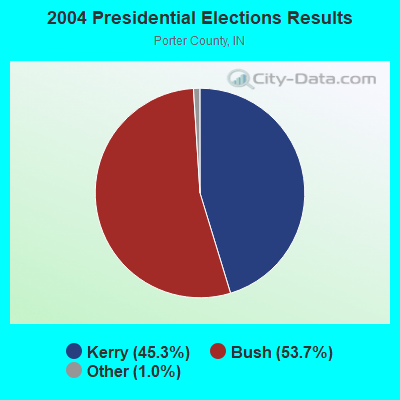
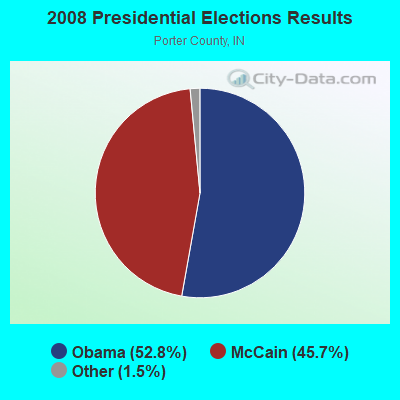
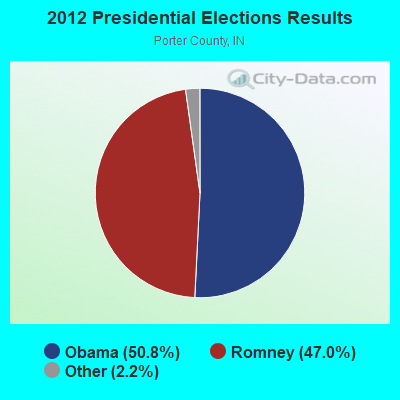
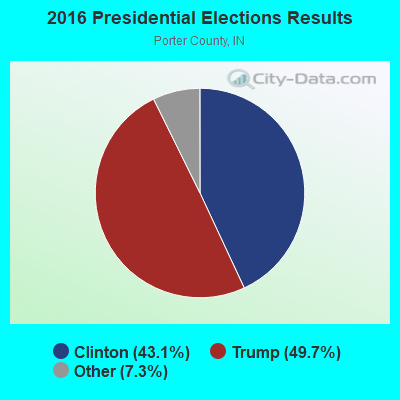
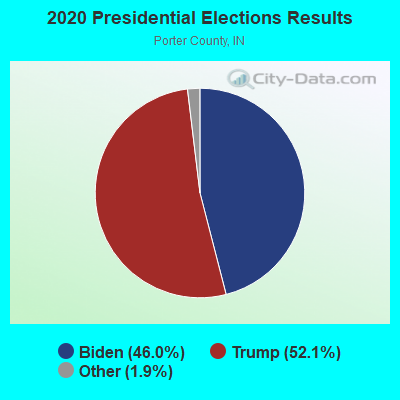
Graphs represent county-level data. Detailed 2008 Election Results
Religion statistics for Hebron, IN (based on Porter County data)
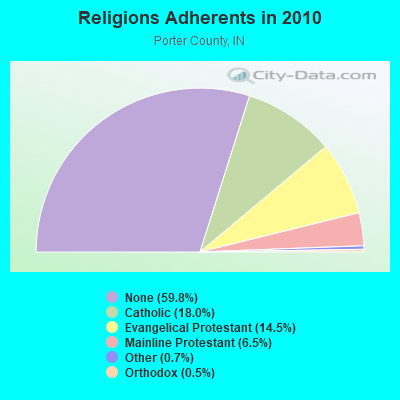
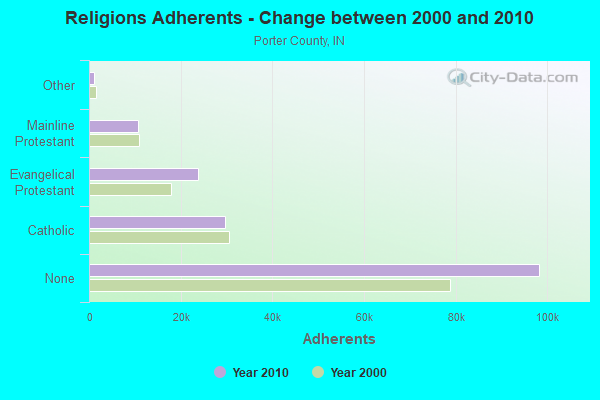
| Religion | Adherents | Congregations |
|---|---|---|
| Catholic | 29,583 | 8 |
| Evangelical Protestant | 23,857 | 91 |
| Mainline Protestant | 10,640 | 26 |
| Other | 1,136 | 7 |
| Orthodox | 860 | 2 |
| None | 98,267 | - |
Food Environment Statistics:
| This county: | 0.81 / 10,000 pop. |
| Indiana: | 1.73 / 10,000 pop. |
| This county: | 0.12 / 10,000 pop. |
| Indiana: | 0.21 / 10,000 pop. |
| Here: | 0.19 / 10,000 pop. |
| State: | 0.50 / 10,000 pop. |
| Porter County: | 3.62 / 10,000 pop. |
| Indiana: | 3.57 / 10,000 pop. |
| Porter County: | 6.55 / 10,000 pop. |
| Indiana: | 6.78 / 10,000 pop. |
| Here: | 9.0% |
| Indiana: | 9.2% |
| This county: | 28.6% |
| Indiana: | 29.0% |
| Here: | 12.6% |
| Indiana: | 14.3% |
Health and Nutrition:
| Here: | 47.3% |
| Indiana: | 49.3% |
| Hebron: | 42.4% |
| Indiana: | 46.2% |
| Hebron: | 28.9 |
| State: | 28.7 |
| Hebron: | 22.9% |
| Indiana: | 21.3% |
| This city: | 12.0% |
| Indiana: | 10.6% |
| This city: | 6.8 |
| Indiana: | 6.8 |
| This city: | 34.0% |
| Indiana: | 33.9% |
| Hebron: | 53.8% |
| State: | 56.1% |
| Hebron: | 77.2% |
| Indiana: | 78.7% |
More about Health and Nutrition of Hebron, IN Residents
| Local government employment and payroll (March 2022) | |||||
| Function | Full-time employees | Monthly full-time payroll | Average yearly full-time wage | Part-time employees | Monthly part-time payroll |
|---|---|---|---|---|---|
| Police Protection - Officers | 7 | $34,740 | $59,554 | 0 | $0 |
| Financial Administration | 3 | $9,763 | $39,052 | 2 | $2,959 |
| Streets and Highways | 2 | $7,507 | $45,042 | 0 | $0 |
| Police - Other | 1 | $4,905 | $58,860 | 3 | $3,035 |
| Sewerage | 1 | $4,324 | $51,888 | 1 | $1,080 |
| Water Supply | 1 | $7,121 | $85,452 | 0 | $0 |
| Other Government Administration | 0 | $0 | 6 | $1,022 | |
| Other and Unallocable | 0 | $0 | 2 | $810 | |
| Totals for Government | 15 | $68,360 | $54,688 | 14 | $8,906 |
Hebron government finances - Expenditure in 2017 (per resident):
- Construction - Water Utilities: $3,000 ($0.80)
- Current Operations - Central Staff Services: $755,000 ($201.87)
Sewerage: $575,000 ($153.74)
Water Utilities: $362,000 ($96.79)
Regular Highways: $21,000 ($5.61)
General - Other: $15,000 ($4.01)
Police Protection: $2,000 ($0.53)
- General - Interest on Debt: $80,000 ($21.39)
- Other Capital Outlay - Central Staff Services: $27,000 ($7.22)
Sewerage: $24,000 ($6.42)
General - Other: $22,000 ($5.88)
Water Utilities: $11,000 ($2.94)
Regular Highways: $5,000 ($1.34)
Police Protection: $3,000 ($0.80)
Hebron government finances - Revenue in 2017 (per resident):
- Charges - Sewerage: $1,210,000 ($323.53)
Solid Waste Management: $227,000 ($60.70)
Parks and Recreation: $8,000 ($2.14)
Other: $7,000 ($1.87)
- Federal Intergovernmental - Other: $8,000 ($2.14)
- Local Intergovernmental - Highways: $37,000 ($9.89)
- Miscellaneous - Sale of Property: $28,000 ($7.49)
General Revenue - Other: $26,000 ($6.95)
Donations From Private Sources: $15,000 ($4.01)
Fines and Forfeits: $13,000 ($3.48)
Rents: $2,000 ($0.53)
- Revenue - Water Utilities: $2,614,000 ($698.93)
- State Intergovernmental - Highways: $134,000 ($35.83)
General Local Government Support: $82,000 ($21.93)
Other: $46,000 ($12.30)
- Tax - Property: $722,000 ($193.05)
Public Utilities Sales: $29,000 ($7.75)
Other License: $15,000 ($4.01)
Occupation and Business License - Other: $9,000 ($2.41)
Hebron government finances - Debt in 2017 (per resident):
- Long Term Debt - Beginning Outstanding - Unspecified Public Purpose: $2,903,000 ($776.20)
Outstanding Unspecified Public Purpose: $2,903,000 ($776.20)
Hebron government finances - Cash and Securities in 2017 (per resident):
- Bond Funds - Cash and Securities: $8,000 ($2.14)
- Other Funds - Cash and Securities: $2,105,000 ($562.83)
- Sinking Funds - Cash and Securities: $320,000 ($85.56)
| Businesses in Hebron, IN | ||||
| Name | Count | Name | Count | |
|---|---|---|---|---|
| Arby's | 1 | McDonald's | 1 | |
| Burger King | 2 | Subway | 2 | |
| Comfort Inn | 1 | Super 8 | 1 | |
| Dairy Queen | 1 | U-Haul | 1 | |
| Dennys | 1 | UPS | 1 | |
| FedEx | 1 | Walgreens | 1 | |
| H&R Block | 1 | |||
Strongest AM radio stations in Hebron:
- WLS (890 AM; 50 kW; CHICAGO, IL; Owner: WLS, INC.)
- WNDZ (750 AM; daytime; 5 kW; PORTAGE, IN; Owner: ENTRAVISION HOLDINGS, LLC)
- WYLL (1160 AM; 50 kW; CHICAGO, IL; Owner: SCA LICENSE CORPORATION)
- WIND (560 AM; 5 kW; CHICAGO, IL; Owner: TICHENOR LICENSE CORPORATION ("TLC"))
- WSCR (670 AM; 50 kW; CHICAGO, IL; Owner: INFINITY BROADCASTING OPERATIONS, INC.)
- WMVP (1000 AM; 50 kW; CHICAGO, IL; Owner: ABC, INC.)
- WGN (720 AM; 50 kW; CHICAGO, IL; Owner: WGN CONTINENTAL BROADCASTING CO.)
- WVIV (1200 AM; 20 kW; CHICAGO, IL; Owner: WLXX-AM LICENSE CORP.)
- WBBM (780 AM; 50 kW; CHICAGO, IL; Owner: INFINITY BROADCASTING OPERATIONS, INC.)
- WTMJ (620 AM; 50 kW; MILWAUKEE, WI; Owner: JOURNAL BROADCAST CORPORATION)
- WNTD (950 AM; 5 kW; CHICAGO, IL; Owner: RADIO UNICA OF CHICAGO LICENSE CORP.)
- WAKE (1500 AM; daytime; 1 kW; VALPARAISO, IN)
- WIMS (1420 AM; 5 kW; MICHIGAN CITY, IN; Owner: ST. GEORGE BROADCASTING, LLC, ROBERT J. MACCINI, RECEIVER)
Strongest FM radio stations in Hebron:
- WZVN (107.1 FM; LOWELL, IN; Owner: M & M BROADCASTING, INC.)
- WXRD (103.9 FM; CROWN POINT, IN; Owner: M & M BROADCASTING, INC.)
- WLJE (105.5 FM; VALPARAISO, IN; Owner: PORTER COUNTY BROADCASTING CORP.)
- WCKG (105.9 FM; ELMWOOD PARK, IL; Owner: INFINITY HOLDINGS CORPORATION OF ORLANDO)
- WLIT-FM (93.9 FM; CHICAGO, IL; Owner: AMFM RADIO LICENSES, L.L.C.)
- WJMK (104.3 FM; CHICAGO, IL; Owner: INFINITY BROADCASTING CORP. OF ILLINOIS)
- WNUA (95.5 FM; CHICAGO, IL; Owner: AMFM RADIO LICENSES, L.L.C.)
- WTMX (101.9 FM; SKOKIE, IL; Owner: BONNEVILLE HOLDING COMPANY)
- WBBM-FM (96.3 FM; CHICAGO, IL; Owner: INFINITY BROADCASTING OPERATIONS, INC.)
- WKSC-FM (103.5 FM; CHICAGO, IL; Owner: AMFM RADIO LICENSES, L.L.C.)
- WFMT (98.7 FM; CHICAGO, IL; Owner: WINDOW TO THE WORLD COMMUNICATIONS)
- WGCI-FM (107.5 FM; CHICAGO, IL; Owner: AMFM RADIO LICENSES, L.L.C.)
- WZZN (94.7 FM; CHICAGO, IL; Owner: ABC CHICAGO FM RADIO,INC.)
- WHLP (89.9 FM; HANNA, IN; Owner: CSN INTERNATIONAL)
- WBEZ (91.5 FM; CHICAGO, IL; Owner: THE WBEZ ALLIANCE, INC.)
- WKQX (101.1 FM; CHICAGO, IL; Owner: EMMIS RADIO LICENSE CORPORATION)
- WLUP-FM (97.9 FM; CHICAGO, IL; Owner: BONNEVILLE HOLDING COMPANY)
- WNND (100.3 FM; CHICAGO, IL; Owner: BONNEVILLE HOLDING COMPANY)
- WOJO (105.1 FM; EVANSTON, IL; Owner: TICHENOR LICENSE CORPORATION ("TLC"))
- WUSN (99.5 FM; CHICAGO, IL; Owner: INFINITY BROADCASTING CORPORATION OF CHICAGO)
TV broadcast stations around Hebron:
- WYIN (Channel 56; GARY, IN; Owner: NORTHWEST INDIANA PUBLIC BROADCASTING, INC.)
- WLS-TV (Channel 7; CHICAGO, IL; Owner: WLS TELEVISION, INC.)
- WMAQ-TV (Channel 5; CHICAGO, IL; Owner: NBC SUBSIDIARY (WMAQ-TV), INC.)
- WTTW (Channel 11; CHICAGO, IL; Owner: WINDOW TO THE WORLD COMMUNICATIONS, INC.)
- WGN-TV (Channel 9; CHICAGO, IL; Owner: WGN CONTINENTAL BROADCASTING COMPANY)
- WGBO-TV (Channel 66; JOLIET, IL; Owner: WGBO LICENSE PARTNERSHIP, G.P.)
- WBBM-TV (Channel 2; CHICAGO, IL; Owner: CBS BROADCASTING INC.)
- WPWR-TV (Channel 50; GARY, IN; Owner: FOX TELEVISION STATIONS, INC.)
- WXFT (Channel 60; AURORA, IL; Owner: TELEFUTURA CHICAGO LLC)
- WCPX (Channel 38; CHICAGO, IL; Owner: PAXSON CHICAGO LICENSE, INC.)
- WCIU-TV (Channel 26; CHICAGO, IL; Owner: WCIU-TV LIMITED PARTNERSHIP)
- WFLD (Channel 32; CHICAGO, IL; Owner: FOX TELEVISION STATIONS, INC.)
- W68DO (Channel 68; PALATINE, IL; Owner: TRINITY BROADCASTING NETWORK)
- WFBT-CA (Channel 23; CHICAGO, IL; Owner: CHANNEL 23 LIMITED PARTNERSHIP)
- WSNS-TV (Channel 44; CHICAGO, IL; Owner: TELEMUNDO OF CHICAGO, INC.)
- WJYS (Channel 62; HAMMOND, IN; Owner: JOVON BROADCASTING CORPORATION)
- W24AW (Channel 24; VALPARAISO, IN; Owner: LESEA BROADCASTING CORPORATION)
- W54BK (Channel 54; CHESTERTON, IN; Owner: LESEA BROADCASTING CORPORATION)
- WOCH-LP (Channel 28; CHICAGO, IL; Owner: KM LPTV OF CHICAGO-28, L.L.C.)
- WYCC (Channel 20; CHICAGO, IL; Owner: COLLEGE DIST. #508, COUNTY OF COOK)
- WOCK-CA (Channel 13; CHICAGO, IL; Owner: KM LPTV OF CHICAGO-13, L.L.C.)
- National Bridge Inventory (NBI) Statistics
- 13Number of bridges
- 79ft / 23.7mTotal length
- $3,164,000Total costs
- 7,017Total average daily traffic
- 390Total average daily truck traffic
- 12,812Total future (year 2038) average daily traffic
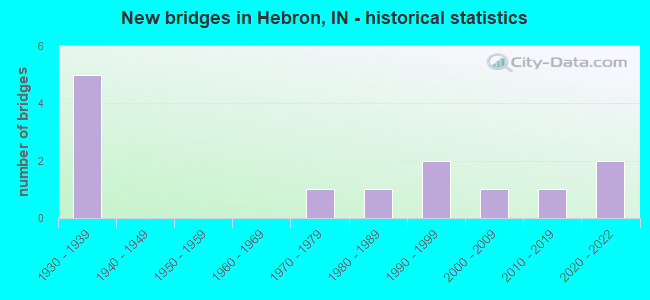
- New bridges - historical statistics
- 51930-1939
- 11970-1979
- 11980-1989
- 21990-1999
- 12000-2009
- 12010-2019
- 22020-2022
FCC Registered Cell Phone Towers:
2 (See the full list of FCC Registered Cell Phone Towers in Hebron)FCC Registered Antenna Towers:
51 (See the full list of FCC Registered Antenna Towers)FCC Registered Broadcast Land Mobile Towers:
12 (See the full list of FCC Registered Broadcast Land Mobile Towers in Hebron, IN)FCC Registered Microwave Towers:
18 (See the full list of FCC Registered Microwave Towers in this town)FCC Registered Paging Towers:
2 (See the full list of FCC Registered Paging Towers)FCC Registered Amateur Radio Licenses:
66 (See the full list of FCC Registered Amateur Radio Licenses in Hebron)FAA Registered Aircraft:
6- Aircraft: AEROCOMP INC MERLIN GT (Category: Amphibian, Seats: 2, Weight: Up to 12,499 Pounds), Engine: BOMBARDIER ROTAX (ALL) (Reciprocating)
N-Number: 107JR, N107JR, N-107JR, Serial Number: 95053, Year manufactured: 1996, Airworthiness Date: 03/20/1996, Certificate Issue Date: 01/28/2019
Registrant (Individual): Carl R Nethery, 17984 Warrick St, Hebron, IN 46341 - Aircraft: CESSNA T206H (Category: Land, Seats: 6, Weight: Up to 12,499 Pounds), Engine: LYCOMING TIO-540-AJ1A (310 HP) (Reciprocating)
N-Number: 204RS, N204RS, N-204RS, Serial Number: T20609029, Year manufactured: 2011, Airworthiness Date: 11/16/2011, Certificate Issue Date: 12/28/2011
Registrant (Individual): Rayson J Salt, 580 W 138 S, Hebron, IN 46341 - Aircraft: TUOHY JOHN CGS HAWK (Category: Land, Seats: 2, Weight: Up to 12,499 Pounds), Engine: HIRTH 3203 (65 HP) (2 Cycle)
N-Number: 6165Q, N6165Q, N-6165Q, Serial Number: HA2-294-3203-TD, Year manufactured: 2005, Airworthiness Date: 10/12/2007, Certificate Issue Date: 01/15/2020
Registrant (Individual): Carl R Nethery, 17984 Warrick St, Hebron, IN 46341 - Aircraft: AIRBORNE WEIGHT SHIFT (Category: Land, Seats: 2, Weight: Up to 12,499 Pounds), Engine: ROTAX 532 (65 HP) (2 Cycle)
N-Number: 70214, N70214, N-70214, Serial Number: 503-544, Year manufactured: 2000, Airworthiness Date: 01/16/2008, Certificate Issue Date: 10/27/2020
Registrant (Individual): Carl R Nethery, 17984 Warrick Rd, Hebron, IN 46341 - Aircraft: GRUMMAN AMERICAN AVN. CORP. AA-5A (Category: Land, Seats: 4, Weight: Up to 12,499 Pounds, Speed: 105 mph), Engine: LYCOMING 0-320 SERIES (180 HP) (Reciprocating)
N-Number: 9938U, N9938U, N-9938U, Serial Number: AA5A0338, Year manufactured: 1977, Airworthiness Date: 03/09/1977, Certificate Issue Date: 09/06/1988
Registrant (Individual): Kenneth G Burton, 660 W 250 S, Hebron, IN 46341 - Aircraft: ANNAS MICHAEL GENESIS (Category: Land, Seats: 2, Weight: Up to 12,499 Pounds), Engine: Reciprocating
N-Number: 728PM, N728PM, N-728PM, Serial Number: 072
Registrant (Individual): Reported Sale, 17984 Warrick St, Hebron, IN 46341
Deregistered: Cancel Date: 02/28/2020
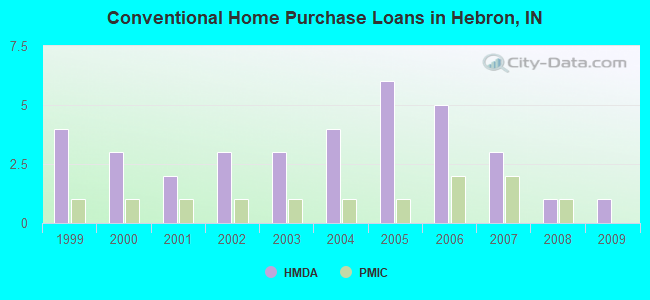
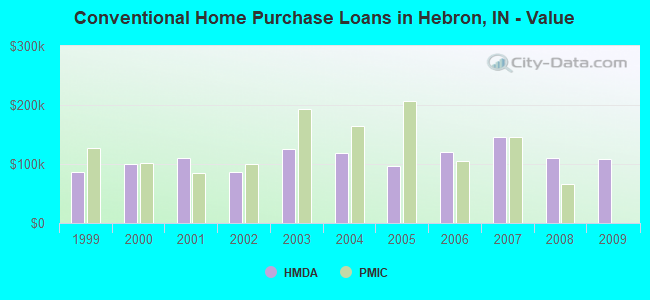
| Home Mortgage Disclosure Act Aggregated Statistics For Year 2009 (Based on 2 partial tracts) | ||||||||||
| A) FHA, FSA/RHS & VA Home Purchase Loans | B) Conventional Home Purchase Loans | C) Refinancings | D) Home Improvement Loans | G) Loans On Manufactured Home Dwelling (A B C & D) | ||||||
|---|---|---|---|---|---|---|---|---|---|---|
| Number | Average Value | Number | Average Value | Number | Average Value | Number | Average Value | Number | Average Value | |
| LOANS ORIGINATED | 2 | $116,660 | 1 | $107,690 | 8 | $135,820 | 1 | $29,390 | 1 | $60,070 |
| APPLICATIONS APPROVED, NOT ACCEPTED | 0 | $0 | 0 | $0 | 1 | $138,240 | 0 | $0 | 0 | $0 |
| APPLICATIONS DENIED | 0 | $0 | 0 | $0 | 3 | $110,463 | 0 | $0 | 0 | $0 |
| APPLICATIONS WITHDRAWN | 0 | $0 | 0 | $0 | 1 | $173,510 | 0 | $0 | 0 | $0 |
| FILES CLOSED FOR INCOMPLETENESS | 0 | $0 | 0 | $0 | 1 | $95,760 | 0 | $0 | 0 | $0 |
Detailed HMDA statistics for the following Tracts: 0511.01
| Private Mortgage Insurance Companies Aggregated Statistics For Year 2008 (Based on 2 partial tracts) | ||
| A) Conventional Home Purchase Loans | ||
|---|---|---|
| Number | Average Value | |
| LOANS ORIGINATED | 1 | $65,600 |
| APPLICATIONS APPROVED, NOT ACCEPTED | 0 | $0 |
| APPLICATIONS DENIED | 0 | $0 |
| APPLICATIONS WITHDRAWN | 0 | $0 |
| FILES CLOSED FOR INCOMPLETENESS | 0 | $0 |
Detailed PMIC statistics for the following Tracts: 0511.01
2002 - 2018 National Fire Incident Reporting System (NFIRS) incidents
- Fire incident types reported to NFIRS in Hebron, IN
- 28742.3%Structure Fires
- 27240.1%Outside Fires
- 7611.2%Mobile Property/Vehicle Fires
- 436.3%Other
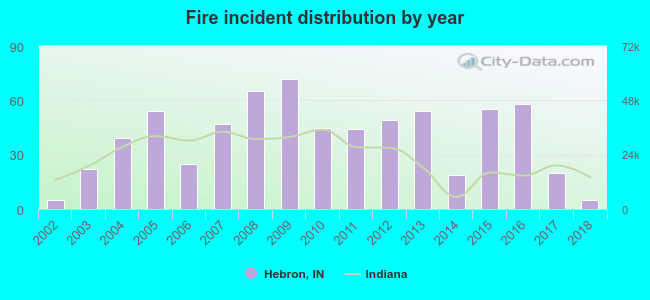 According to the data from the years 2002 - 2018 the average number of fires per year is 40. The highest number of fire incidents - 72 took place in 2009, and the least - 5 in 2002. The data has a constant trend.
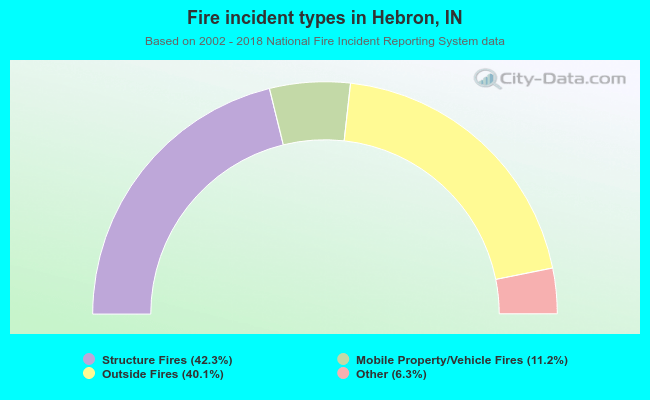 When looking into fire subcategories, the most reports belonged to: Structure Fires (42.3%), and Outside Fires (40.1%).
| Most common first names in Hebron, IN among deceased individuals | ||
| Name | Count | Lived (average) |
|---|---|---|
| John | 68 | 75.3 years |
| William | 47 | 71.3 years |
| Mary | 43 | 82.9 years |
| Charles | 38 | 76.5 years |
| Robert | 35 | 70.0 years |
| Helen | 30 | 82.5 years |
| Margaret | 26 | 77.3 years |
| George | 24 | 76.3 years |
| James | 23 | 70.3 years |
| Frank | 19 | 77.6 years |
| Most common last names in Hebron, IN among deceased individuals | ||
| Last name | Count | Lived (average) |
|---|---|---|
| Johnson | 20 | 78.1 years |
| Smith | 19 | 71.7 years |
| Williams | 16 | 79.4 years |
| Anderson | 12 | 73.4 years |
| Thompson | 10 | 78.5 years |
| Wilson | 10 | 80.5 years |
| Fry | 10 | 72.6 years |
| Brown | 9 | 69.7 years |
| Davis | 9 | 74.1 years |
| Morrow | 9 | 75.0 years |
Hebron compared to Indiana state average:
- Unemployed percentage below state average.
- Black race population percentage significantly below state average.
- Median age below state average.
- Foreign-born population percentage significantly below state average.
- Length of stay since moving in significantly above state average.
- Number of college students below state average.
Hebron on our top lists:
- #24 on the list of "Top 100 safest cities (lowest city-data.com crime index)"
- #21 on the list of "Top 101 counties with the highest Particulate Matter (PM2.5) Annual air pollution readings in 2012 (µg/m3)"
- #24 on the list of "Top 101 counties with the lowest percentage of residents relocating from foreign countries between 2010 and 2011"
- #33 on the list of "Top 101 counties with the lowest percentage of residents relocating to foreign countries in 2011"
- #80 on the list of "Top 101 counties with the highest Particulate Matter (PM10) Annual air pollution readings in 2012 (µg/m3)"

|
|
Total of 13 patent applications in 2008-2024.