Hermantown, Minnesota Submit your own pictures of this city and show them to the world
OSM Map
General Map
Google Map
MSN Map
OSM Map
General Map
Google Map
MSN Map
OSM Map
General Map
Google Map
MSN Map
OSM Map
General Map
Google Map
MSN Map
Please wait while loading the map...
Population in 2022: 10,126 (45% urban, 55% rural). Population change since 2000: +36.0%Males: 5,139 Females: 4,987
March 2022 cost of living index in Hermantown: 88.7 (less than average, U.S. average is 100) Percentage of residents living in poverty in 2022: 5.0%for White Non-Hispanic residents , 1.9% for Black residents , 92.3% for American Indian residents , 1.5% for two or more races residents )Business Search - 14 Million verified businesses
Data:
Median household income ($)
Median household income (% change since 2000)
Household income diversity
Ratio of average income to average house value (%)
Ratio of average income to average rent
Median household income ($) - White
Median household income ($) - Black or African American
Median household income ($) - Asian
Median household income ($) - Hispanic or Latino
Median household income ($) - American Indian and Alaska Native
Median household income ($) - Multirace
Median household income ($) - Other Race
Median household income for houses/condos with a mortgage ($)
Median household income for apartments without a mortgage ($)
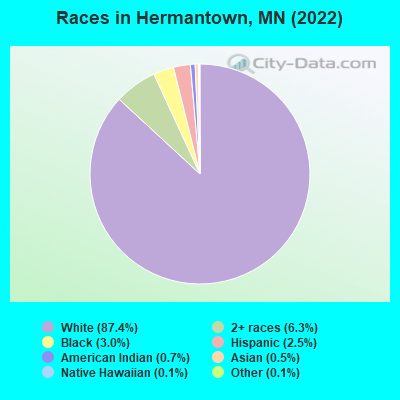
Races - White alone (%)
Races - White alone (% change since 2000)
Races - Black alone (%)
Races - Black alone (% change since 2000)
Races - American Indian alone (%)
Races - American Indian alone (% change since 2000)
Races - Asian alone (%)
Races - Asian alone (% change since 2000)
Races - Hispanic (%)
Races - Hispanic (% change since 2000)
Races - Native Hawaiian and Other Pacific Islander alone (%)
Races - Native Hawaiian and Other Pacific Islander alone (% change since 2000)
Races - Two or more races (%)
Races - Two or more races (% change since 2000)
Races - Other race alone (%)
Races - Other race alone (% change since 2000)
Racial diversity
Unemployment (%)
Unemployment (% change since 2000)
Unemployment (%) - White
Unemployment (%) - Black or African American
Unemployment (%) - Asian
Unemployment (%) - Hispanic or Latino
Unemployment (%) - American Indian and Alaska Native
Unemployment (%) - Multirace
Unemployment (%) - Other Race
Population density (people per square mile)
Population - Males (%)
Population - Females (%)
Population - Males (%) - White
Population - Males (%) - Black or African American
Population - Males (%) - Asian
Population - Males (%) - Hispanic or Latino
Population - Males (%) - American Indian and Alaska Native
Population - Males (%) - Multirace
Population - Males (%) - Other Race
Population - Females (%) - White
Population - Females (%) - Black or African American
Population - Females (%) - Asian
Population - Females (%) - Hispanic or Latino
Population - Females (%) - American Indian and Alaska Native
Population - Females (%) - Multirace
Population - Females (%) - Other Race
Coronavirus confirmed cases (Jun 16, 2024)
Deaths caused by coronavirus (Jun 16, 2024)
Coronavirus confirmed cases (per 100k population) (Jun 16, 2024)
Deaths caused by coronavirus (per 100k population) (Jun 16, 2024)
Daily increase in number of cases (Jun 16, 2024)
Weekly increase in number of cases (Jun 16, 2024)
Cases doubled (in days) (Jun 16, 2024)
Hospitalized patients (Apr 18, 2022)
Negative test results (Apr 18, 2022)
Total test results (Apr 18, 2022)
COVID Vaccine doses distributed (per 100k population) (Sep 19, 2023)
COVID Vaccine doses administered (per 100k population) (Sep 19, 2023)
COVID Vaccine doses distributed (Sep 19, 2023)
COVID Vaccine doses administered (Sep 19, 2023)
Likely homosexual households (%)
Likely homosexual households (% change since 2000)
Likely homosexual households - Lesbian couples (%)
Likely homosexual households - Lesbian couples (% change since 2000)
Likely homosexual households - Gay men (%)
Likely homosexual households - Gay men (% change since 2000)
Cost of living index
Median gross rent ($)
Median contract rent ($)
Median monthly housing costs ($)
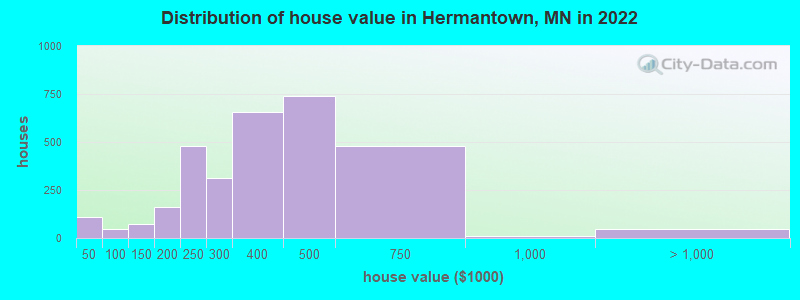
Median house or condo value ($)
Median house or condo value ($ change since 2000)
Mean house or condo value by units in structure - 1, detached ($)
Mean house or condo value by units in structure - 1, attached ($)
Mean house or condo value by units in structure - 2 ($)
Mean house or condo value by units in structure by units in structure - 3 or 4 ($)
Mean house or condo value by units in structure - 5 or more ($)
Mean house or condo value by units in structure - Boat, RV, van, etc. ($)
Mean house or condo value by units in structure - Mobile home ($)
Median house or condo value ($) - White
Median house or condo value ($) - Black or African American
Median house or condo value ($) - Asian
Median house or condo value ($) - Hispanic or Latino
Median house or condo value ($) - American Indian and Alaska Native
Median house or condo value ($) - Multirace
Median house or condo value ($) - Other Race
Median resident age
Resident age diversity
Median resident age - Males
Median resident age - Females
Median resident age - White
Median resident age - Black or African American
Median resident age - Asian
Median resident age - Hispanic or Latino
Median resident age - American Indian and Alaska Native
Median resident age - Multirace
Median resident age - Other Race
Median resident age - Males - White
Median resident age - Males - Black or African American
Median resident age - Males - Asian
Median resident age - Males - Hispanic or Latino
Median resident age - Males - American Indian and Alaska Native
Median resident age - Males - Multirace
Median resident age - Males - Other Race
Median resident age - Females - White
Median resident age - Females - Black or African American
Median resident age - Females - Asian
Median resident age - Females - Hispanic or Latino
Median resident age - Females - American Indian and Alaska Native
Median resident age - Females - Multirace
Median resident age - Females - Other Race
Commute - mean travel time to work (minutes)
Travel time to work - Less than 5 minutes (%)
Travel time to work - Less than 5 minutes (% change since 2000)
Travel time to work - 5 to 9 minutes (%)
Travel time to work - 5 to 9 minutes (% change since 2000)
Travel time to work - 10 to 19 minutes (%)
Travel time to work - 10 to 19 minutes (% change since 2000)
Travel time to work - 20 to 29 minutes (%)
Travel time to work - 20 to 29 minutes (% change since 2000)
Travel time to work - 30 to 39 minutes (%)
Travel time to work - 30 to 39 minutes (% change since 2000)
Travel time to work - 40 to 59 minutes (%)
Travel time to work - 40 to 59 minutes (% change since 2000)
Travel time to work - 60 to 89 minutes (%)
Travel time to work - 60 to 89 minutes (% change since 2000)
Travel time to work - 90 or more minutes (%)
Travel time to work - 90 or more minutes (% change since 2000)
Marital status - Never married (%)
Marital status - Now married (%)
Marital status - Separated (%)
Marital status - Widowed (%)
Marital status - Divorced (%)
Median family income ($)
Median family income (% change since 2000)
Median non-family income ($)
Median non-family income (% change since 2000)
Median per capita income ($)
Median per capita income (% change since 2000)
Median family income ($) - White
Median family income ($) - Black or African American
Median family income ($) - Asian
Median family income ($) - Hispanic or Latino
Median family income ($) - American Indian and Alaska Native
Median family income ($) - Multirace
Median family income ($) - Other Race
Median year house/condo built
Median year apartment built
Year house built - Built 2005 or later (%)
Year house built - Built 2000 to 2004 (%)
Year house built - Built 1990 to 1999 (%)
Year house built - Built 1980 to 1989 (%)
Year house built - Built 1970 to 1979 (%)
Year house built - Built 1960 to 1969 (%)
Year house built - Built 1950 to 1959 (%)
Year house built - Built 1940 to 1949 (%)
Year house built - Built 1939 or earlier (%)
Average household size
Household density (households per square mile)
Average household size - White
Average household size - Black or African American
Average household size - Asian
Average household size - Hispanic or Latino
Average household size - American Indian and Alaska Native
Average household size - Multirace
Average household size - Other Race
Occupied housing units (%)
Vacant housing units (%)
Owner occupied housing units (%)
Renter occupied housing units (%)
Vacancy status - For rent (%)
Vacancy status - For sale only (%)
Vacancy status - Rented or sold, not occupied (%)
Vacancy status - For seasonal, recreational, or occasional use (%)
Vacancy status - For migrant workers (%)
Vacancy status - Other vacant (%)
Residents with income below the poverty level (%)
Residents with income below 50% of the poverty level (%)
Children below poverty level (%)
Poor families by family type - Married-couple family (%)
Poor families by family type - Male, no wife present (%)
Poor families by family type - Female, no husband present (%)
Poverty status for native-born residents (%)
Poverty status for foreign-born residents (%)
Poverty among high school graduates not in families (%)
Poverty among people who did not graduate high school not in families (%)
Residents with income below the poverty level (%) - White
Residents with income below the poverty level (%) - Black or African American
Residents with income below the poverty level (%) - Asian
Residents with income below the poverty level (%) - Hispanic or Latino
Residents with income below the poverty level (%) - American Indian and Alaska Native
Residents with income below the poverty level (%) - Multirace
Residents with income below the poverty level (%) - Other Race
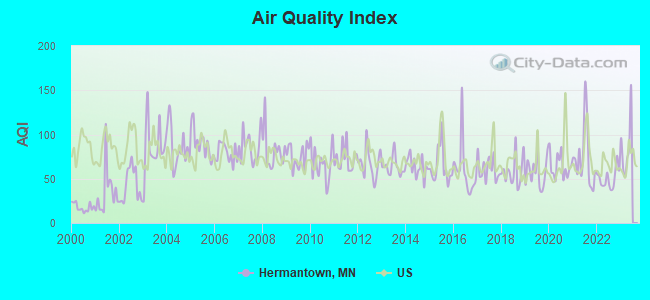
Air pollution - Air Quality Index (AQI)
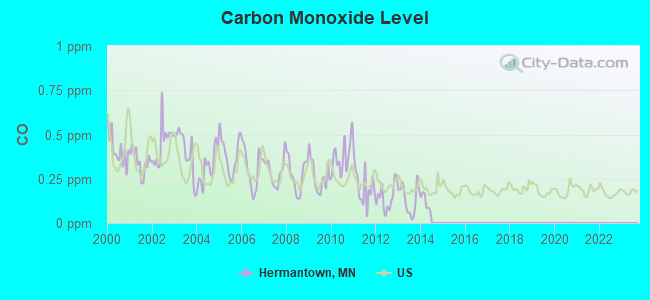
Air pollution - CO
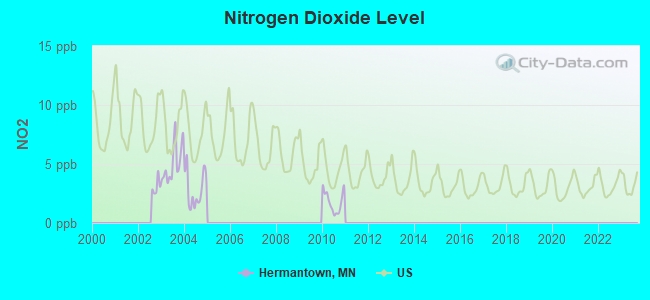
Air pollution - NO2
Air pollution - SO2
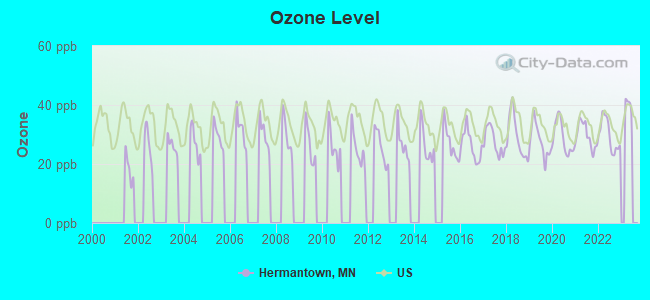
Air pollution - Ozone
Air pollution - PM10
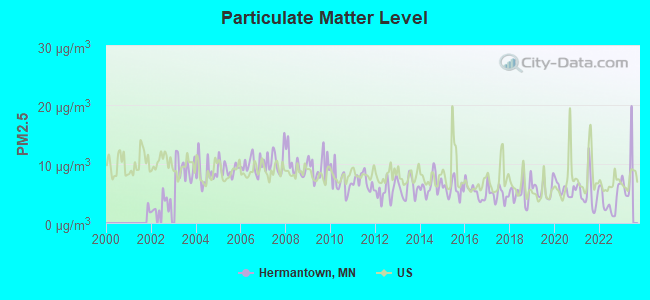
Air pollution - PM25
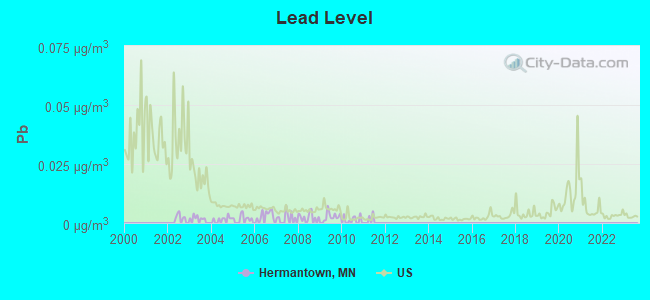
Air pollution - Pb
Crime - Murders per 100,000 population
Crime - Rapes per 100,000 population
Crime - Robberies per 100,000 population
Crime - Assaults per 100,000 population
Crime - Burglaries per 100,000 population
Crime - Thefts per 100,000 population
Crime - Auto thefts per 100,000 population
Crime - Arson per 100,000 population
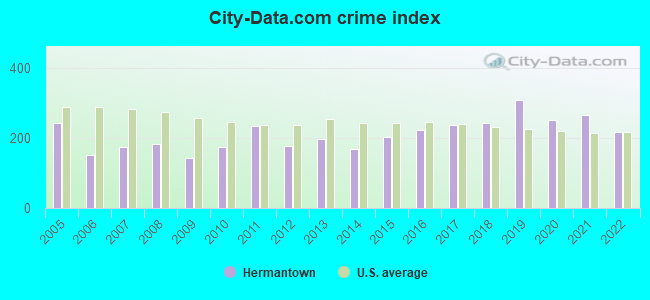
Crime - City-data.com crime index
Crime - Violent crime index
Crime - Property crime index
Crime - Murders per 100,000 population (5 year average)
Crime - Rapes per 100,000 population (5 year average)
Crime - Robberies per 100,000 population (5 year average)
Crime - Assaults per 100,000 population (5 year average)
Crime - Burglaries per 100,000 population (5 year average)
Crime - Thefts per 100,000 population (5 year average)
Crime - Auto thefts per 100,000 population (5 year average)
Crime - Arson per 100,000 population (5 year average)
Crime - City-data.com crime index (5 year average)
Crime - Violent crime index (5 year average)
Crime - Property crime index (5 year average)
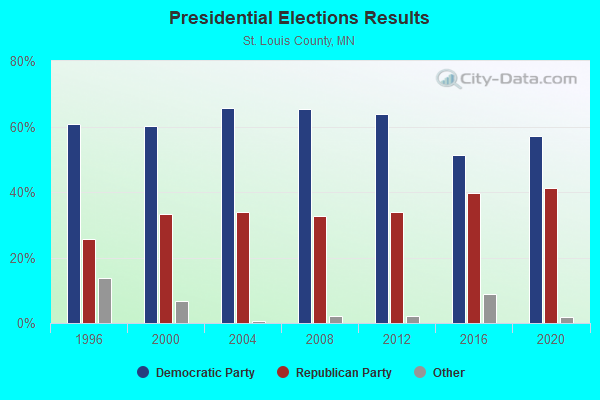
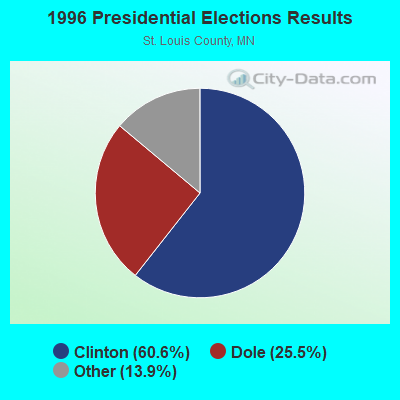
1996 Presidential Elections Results (%) - Democratic Party (Clinton)
1996 Presidential Elections Results (%) - Republican Party (Dole)
1996 Presidential Elections Results (%) - Other
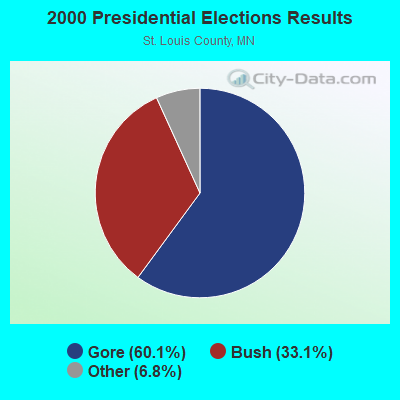
2000 Presidential Elections Results (%) - Democratic Party (Gore)
2000 Presidential Elections Results (%) - Republican Party (Bush)
2000 Presidential Elections Results (%) - Other
2004 Presidential Elections Results (%) - Democratic Party (Kerry)
2004 Presidential Elections Results (%) - Republican Party (Bush)
2004 Presidential Elections Results (%) - Other
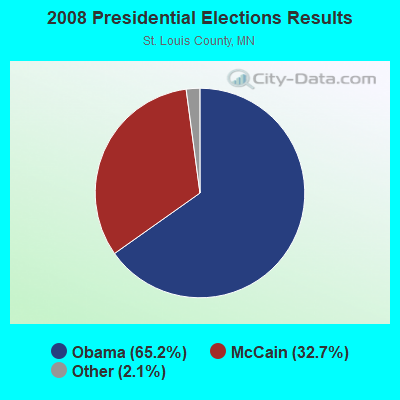
2008 Presidential Elections Results (%) - Democratic Party (Obama)
2008 Presidential Elections Results (%) - Republican Party (McCain)
2008 Presidential Elections Results (%) - Other
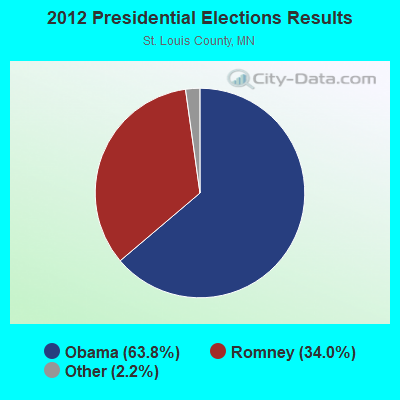
2012 Presidential Elections Results (%) - Democratic Party (Obama)
2012 Presidential Elections Results (%) - Republican Party (Romney)
2012 Presidential Elections Results (%) - Other
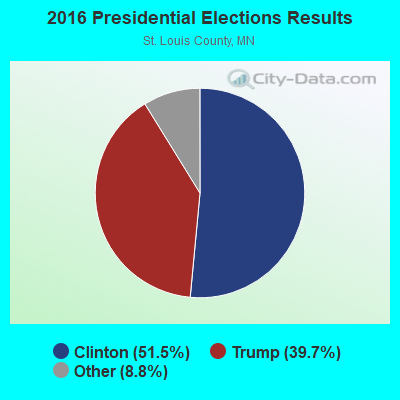
2016 Presidential Elections Results (%) - Democratic Party (Clinton)
2016 Presidential Elections Results (%) - Republican Party (Trump)
2016 Presidential Elections Results (%) - Other
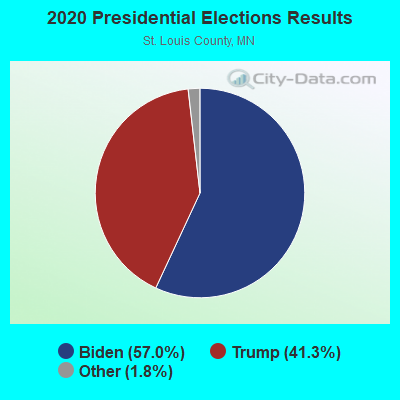
2020 Presidential Elections Results (%) - Democratic Party (Biden)
2020 Presidential Elections Results (%) - Republican Party (Trump)
2020 Presidential Elections Results (%) - Other
Ancestries Reported - Arab (%)
Ancestries Reported - Czech (%)
Ancestries Reported - Danish (%)
Ancestries Reported - Dutch (%)
Ancestries Reported - English (%)
Ancestries Reported - French (%)
Ancestries Reported - French Canadian (%)
Ancestries Reported - German (%)
Ancestries Reported - Greek (%)
Ancestries Reported - Hungarian (%)
Ancestries Reported - Irish (%)
Ancestries Reported - Italian (%)
Ancestries Reported - Lithuanian (%)
Ancestries Reported - Norwegian (%)
Ancestries Reported - Polish (%)
Ancestries Reported - Portuguese (%)
Ancestries Reported - Russian (%)
Ancestries Reported - Scotch-Irish (%)
Ancestries Reported - Scottish (%)
Ancestries Reported - Slovak (%)
Ancestries Reported - Subsaharan African (%)
Ancestries Reported - Swedish (%)
Ancestries Reported - Swiss (%)
Ancestries Reported - Ukrainian (%)
Ancestries Reported - United States (%)
Ancestries Reported - Welsh (%)
Ancestries Reported - West Indian (%)
Ancestries Reported - Other (%)
Educational Attainment - No schooling completed (%)
Educational Attainment - Less than high school (%)
Educational Attainment - High school or equivalent (%)
Educational Attainment - Less than 1 year of college (%)
Educational Attainment - 1 or more years of college (%)
Educational Attainment - Associate degree (%)
Educational Attainment - Bachelor's degree (%)
Educational Attainment - Master's degree (%)
Educational Attainment - Professional school degree (%)
Educational Attainment - Doctorate degree (%)
School Enrollment - Nursery, preschool (%)
School Enrollment - Kindergarten (%)
School Enrollment - Grade 1 to 4 (%)
School Enrollment - Grade 5 to 8 (%)
School Enrollment - Grade 9 to 12 (%)
School Enrollment - College undergrad (%)
School Enrollment - Graduate or professional (%)
School Enrollment - Not enrolled in school (%)
School enrollment - Public schools (%)
School enrollment - Private schools (%)
School enrollment - Not enrolled (%)
Median number of rooms in houses and condos
Median number of rooms in apartments
Housing units lacking complete plumbing facilities (%)
Housing units lacking complete kitchen facilities (%)
Density of houses
Urban houses (%)
Rural houses (%)
Households with people 60 years and over (%)
Households with people 65 years and over (%)
Households with people 75 years and over (%)
Households with one or more nonrelatives (%)
Households with no nonrelatives (%)
Population in households (%)
Family households (%)
Nonfamily households (%)
Population in families (%)
Family households with own children (%)
Median number of bedrooms in owner occupied houses
Mean number of bedrooms in owner occupied houses
Median number of bedrooms in renter occupied houses
Mean number of bedrooms in renter occupied houses
Median number of vehichles in owner occupied houses
Mean number of vehichles in owner occupied houses
Median number of vehichles in renter occupied houses
Mean number of vehichles in renter occupied houses
Mortgage status - with mortgage (%)
Mortgage status - with second mortgage (%)
Mortgage status - with home equity loan (%)
Mortgage status - with both second mortgage and home equity loan (%)
Mortgage status - without a mortgage (%)
Average family size
Average family size - White
Average family size - Black or African American
Average family size - Asian
Average family size - Hispanic or Latino
Average family size - American Indian and Alaska Native
Average family size - Multirace
Average family size - Other Race
Geographical mobility - Same house 1 year ago (%)
Geographical mobility - Moved within same county (%)
Geographical mobility - Moved from different county within same state (%)
Geographical mobility - Moved from different state (%)
Geographical mobility - Moved from abroad (%)
Place of birth - Born in state of residence (%)
Place of birth - Born in other state (%)
Place of birth - Native, outside of US (%)
Place of birth - Foreign born (%)
Housing units in structures - 1, detached (%)
Housing units in structures - 1, attached (%)
Housing units in structures - 2 (%)
Housing units in structures - 3 or 4 (%)
Housing units in structures - 5 to 9 (%)
Housing units in structures - 10 to 19 (%)
Housing units in structures - 20 to 49 (%)
Housing units in structures - 50 or more (%)
Housing units in structures - Mobile home (%)
Housing units in structures - Boat, RV, van, etc. (%)
House/condo owner moved in on average (years ago)
Renter moved in on average (years ago)
Year householder moved into unit - Moved in 1999 to March 2000 (%)
Year householder moved into unit - Moved in 1995 to 1998 (%)
Year householder moved into unit - Moved in 1990 to 1994 (%)
Year householder moved into unit - Moved in 1980 to 1989 (%)
Year householder moved into unit - Moved in 1970 to 1979 (%)
Year householder moved into unit - Moved in 1969 or earlier (%)
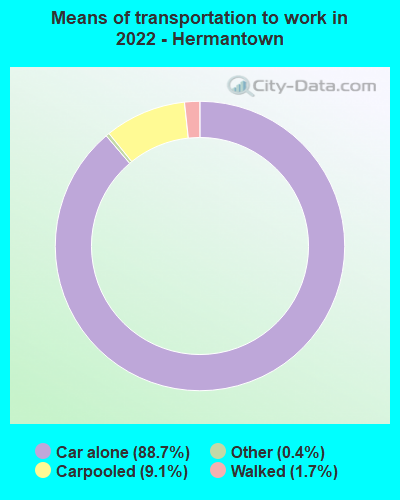
Means of transportation to work - Drove car alone (%)
Means of transportation to work - Carpooled (%)
Means of transportation to work - Public transportation (%)
Means of transportation to work - Bus or trolley bus (%)
Means of transportation to work - Streetcar or trolley car (%)
Means of transportation to work - Subway or elevated (%)
Means of transportation to work - Railroad (%)
Means of transportation to work - Ferryboat (%)
Means of transportation to work - Taxicab (%)
Means of transportation to work - Motorcycle (%)
Means of transportation to work - Bicycle (%)
Means of transportation to work - Walked (%)
Means of transportation to work - Other means (%)
Working at home (%)
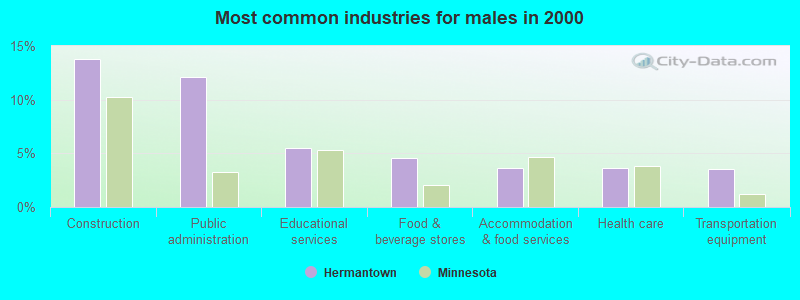
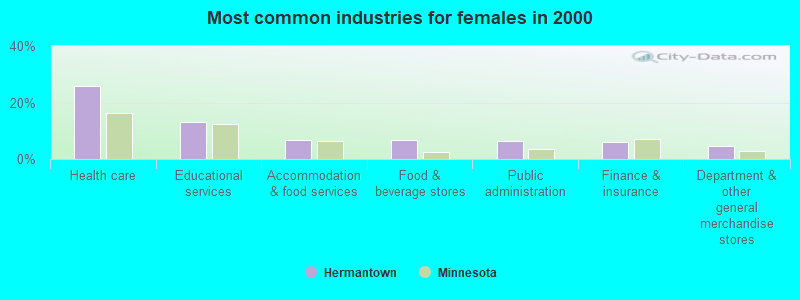
Industry diversity
Most Common Industries - Agriculture, forestry, fishing and hunting, and mining (%)
Most Common Industries - Agriculture, forestry, fishing and hunting (%)
Most Common Industries - Mining, quarrying, and oil and gas extraction (%)
Most Common Industries - Construction (%)
Most Common Industries - Manufacturing (%)
Most Common Industries - Wholesale trade (%)
Most Common Industries - Retail trade (%)
Most Common Industries - Transportation and warehousing, and utilities (%)
Most Common Industries - Transportation and warehousing (%)
Most Common Industries - Utilities (%)
Most Common Industries - Information (%)
Most Common Industries - Finance and insurance, and real estate and rental and leasing (%)
Most Common Industries - Finance and insurance (%)
Most Common Industries - Real estate and rental and leasing (%)
Most Common Industries - Professional, scientific, and management, and administrative and waste management services (%)
Most Common Industries - Professional, scientific, and technical services (%)
Most Common Industries - Management of companies and enterprises (%)
Most Common Industries - Administrative and support and waste management services (%)
Most Common Industries - Educational services, and health care and social assistance (%)
Most Common Industries - Educational services (%)
Most Common Industries - Health care and social assistance (%)
Most Common Industries - Arts, entertainment, and recreation, and accommodation and food services (%)
Most Common Industries - Arts, entertainment, and recreation (%)
Most Common Industries - Accommodation and food services (%)
Most Common Industries - Other services, except public administration (%)
Most Common Industries - Public administration (%)
Occupation diversity
Most Common Occupations - Management, business, science, and arts occupations (%)
Most Common Occupations - Management, business, and financial occupations (%)
Most Common Occupations - Management occupations (%)
Most Common Occupations - Business and financial operations occupations (%)
Most Common Occupations - Computer, engineering, and science occupations (%)
Most Common Occupations - Computer and mathematical occupations (%)
Most Common Occupations - Architecture and engineering occupations (%)
Most Common Occupations - Life, physical, and social science occupations (%)
Most Common Occupations - Education, legal, community service, arts, and media occupations (%)
Most Common Occupations - Community and social service occupations (%)
Most Common Occupations - Legal occupations (%)
Most Common Occupations - Education, training, and library occupations (%)
Most Common Occupations - Arts, design, entertainment, sports, and media occupations (%)
Most Common Occupations - Healthcare practitioners and technical occupations (%)
Most Common Occupations - Health diagnosing and treating practitioners and other technical occupations (%)
Most Common Occupations - Health technologists and technicians (%)
Most Common Occupations - Service occupations (%)
Most Common Occupations - Healthcare support occupations (%)
Most Common Occupations - Protective service occupations (%)
Most Common Occupations - Fire fighting and prevention, and other protective service workers including supervisors (%)
Most Common Occupations - Law enforcement workers including supervisors (%)
Most Common Occupations - Food preparation and serving related occupations (%)
Most Common Occupations - Building and grounds cleaning and maintenance occupations (%)
Most Common Occupations - Personal care and service occupations (%)
Most Common Occupations - Sales and office occupations (%)
Most Common Occupations - Sales and related occupations (%)
Most Common Occupations - Office and administrative support occupations (%)
Most Common Occupations - Natural resources, construction, and maintenance occupations (%)
Most Common Occupations - Farming, fishing, and forestry occupations (%)
Most Common Occupations - Construction and extraction occupations (%)
Most Common Occupations - Installation, maintenance, and repair occupations (%)
Most Common Occupations - Production, transportation, and material moving occupations (%)
Most Common Occupations - Production occupations (%)
Most Common Occupations - Transportation occupations (%)
Most Common Occupations - Material moving occupations (%)
People in Group quarters - Institutionalized population (%)
People in Group quarters - Correctional institutions (%)
People in Group quarters - Federal prisons and detention centers (%)
People in Group quarters - Halfway houses (%)
People in Group quarters - Local jails and other confinement facilities (including police lockups) (%)
People in Group quarters - Military disciplinary barracks (%)
People in Group quarters - State prisons (%)
People in Group quarters - Other types of correctional institutions (%)
People in Group quarters - Nursing homes (%)
People in Group quarters - Hospitals/wards, hospices, and schools for the handicapped (%)
People in Group quarters - Hospitals/wards and hospices for chronically ill (%)
People in Group quarters - Hospices or homes for chronically ill (%)
People in Group quarters - Military hospitals or wards for chronically ill (%)
People in Group quarters - Other hospitals or wards for chronically ill (%)
People in Group quarters - Hospitals or wards for drug/alcohol abuse (%)
People in Group quarters - Mental (Psychiatric) hospitals or wards (%)
People in Group quarters - Schools, hospitals, or wards for the mentally retarded (%)
People in Group quarters - Schools, hospitals, or wards for the physically handicapped (%)
People in Group quarters - Institutions for the deaf (%)
People in Group quarters - Institutions for the blind (%)
People in Group quarters - Orthopedic wards and institutions for the physically handicapped (%)
People in Group quarters - Wards in general hospitals for patients who have no usual home elsewhere (%)
People in Group quarters - Wards in military hospitals for patients who have no usual home elsewhere (%)
People in Group quarters - Juvenile institutions (%)
People in Group quarters - Long-term care (%)
People in Group quarters - Homes for abused, dependent, and neglected children (%)
People in Group quarters - Residential treatment centers for emotionally disturbed children (%)
People in Group quarters - Training schools for juvenile delinquents (%)
People in Group quarters - Short-term care, detention or diagnostic centers for delinquent children (%)
People in Group quarters - Type of juvenile institution unknown (%)
People in Group quarters - Noninstitutionalized population (%)
People in Group quarters - College dormitories (includes college quarters off campus) (%)
People in Group quarters - Military quarters (%)
People in Group quarters - On base (%)
People in Group quarters - Barracks, unaccompanied personnel housing (UPH), (Enlisted/Officer), ;and similar group living quarters for military personnel (%)
People in Group quarters - Transient quarters for temporary residents (%)
People in Group quarters - Military ships (%)
People in Group quarters - Group homes (%)
People in Group quarters - Homes or halfway houses for drug/alcohol abuse (%)
People in Group quarters - Homes for the mentally ill (%)
People in Group quarters - Homes for the mentally retarded (%)
People in Group quarters - Homes for the physically handicapped (%)
People in Group quarters - Other group homes (%)
People in Group quarters - Religious group quarters (%)
People in Group quarters - Dormitories (%)
People in Group quarters - Agriculture workers' dormitories on farms (%)
People in Group quarters - Job Corps and vocational training facilities (%)
People in Group quarters - Other workers' dormitories (%)
People in Group quarters - Crews of maritime vessels (%)
People in Group quarters - Other nonhousehold living situations (%)
People in Group quarters - Other noninstitutional group quarters (%)
Residents speaking English at home (%)
Residents speaking English at home - Born in the United States (%)
Residents speaking English at home - Native, born elsewhere (%)
Residents speaking English at home - Foreign born (%)
Residents speaking Spanish at home (%)
Residents speaking Spanish at home - Born in the United States (%)
Residents speaking Spanish at home - Native, born elsewhere (%)
Residents speaking Spanish at home - Foreign born (%)
Residents speaking other language at home (%)
Residents speaking other language at home - Born in the United States (%)
Residents speaking other language at home - Native, born elsewhere (%)
Residents speaking other language at home - Foreign born (%)
Class of Workers - Employee of private company (%)
Class of Workers - Self-employed in own incorporated business (%)
Class of Workers - Private not-for-profit wage and salary workers (%)
Class of Workers - Local government workers (%)
Class of Workers - State government workers (%)
Class of Workers - Federal government workers (%)
Class of Workers - Self-employed workers in own not incorporated business and Unpaid family workers (%)
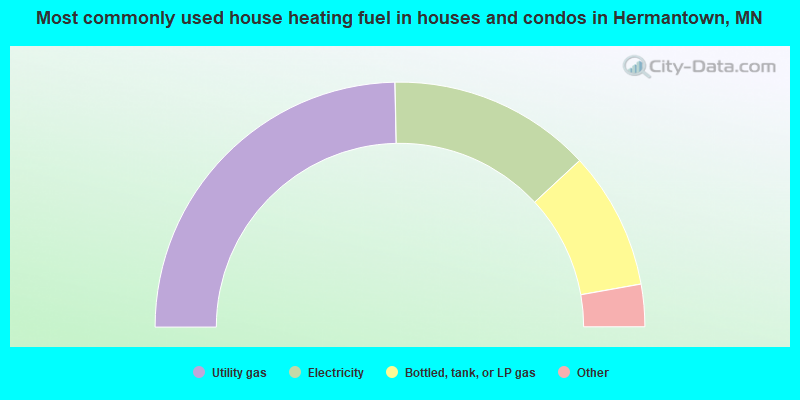
House heating fuel used in houses and condos - Utility gas (%)
House heating fuel used in houses and condos - Bottled, tank, or LP gas (%)
House heating fuel used in houses and condos - Electricity (%)
House heating fuel used in houses and condos - Fuel oil, kerosene, etc. (%)
House heating fuel used in houses and condos - Coal or coke (%)
House heating fuel used in houses and condos - Wood (%)
House heating fuel used in houses and condos - Solar energy (%)
House heating fuel used in houses and condos - Other fuel (%)
House heating fuel used in houses and condos - No fuel used (%)
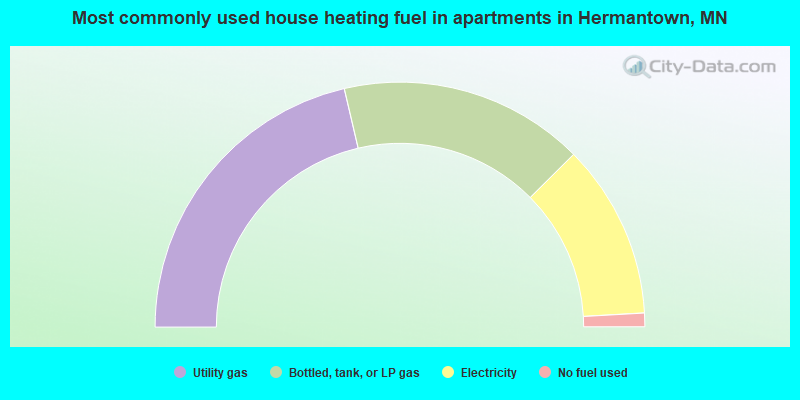
House heating fuel used in apartments - Utility gas (%)
House heating fuel used in apartments - Bottled, tank, or LP gas (%)
House heating fuel used in apartments - Electricity (%)
House heating fuel used in apartments - Fuel oil, kerosene, etc. (%)
House heating fuel used in apartments - Coal or coke (%)
House heating fuel used in apartments - Wood (%)
House heating fuel used in apartments - Solar energy (%)
House heating fuel used in apartments - Other fuel (%)
House heating fuel used in apartments - No fuel used (%)
Armed forces status - In Armed Forces (%)
Armed forces status - Civilian (%)
Armed forces status - Civilian - Veteran (%)
Armed forces status - Civilian - Nonveteran (%)
Fatal accidents locations in years 2005-2021
Fatal accidents locations in 2005
Fatal accidents locations in 2006
Fatal accidents locations in 2007
Fatal accidents locations in 2008
Fatal accidents locations in 2009
Fatal accidents locations in 2010
Fatal accidents locations in 2011
Fatal accidents locations in 2012
Fatal accidents locations in 2013
Fatal accidents locations in 2014
Fatal accidents locations in 2015
Fatal accidents locations in 2016
Fatal accidents locations in 2017
Fatal accidents locations in 2018
Fatal accidents locations in 2019
Fatal accidents locations in 2020
Fatal accidents locations in 2021
Alcohol use - People drinking some alcohol every month (%)
Alcohol use - People not drinking at all (%)
Alcohol use - Average days/month drinking alcohol
Alcohol use - Average drinks/week
Alcohol use - Average days/year people drink much
Audiometry - Average condition of hearing (%)
Audiometry - People that can hear a whisper from across a quiet room (%)
Audiometry - People that can hear normal voice from across a quiet room (%)
Audiometry - Ears ringing, roaring, buzzing (%)
Audiometry - Had a job exposure to loud noise (%)
Audiometry - Had off-work exposure to loud noise (%)
Blood Pressure & Cholesterol - Has high blood pressure (%)
Blood Pressure & Cholesterol - Checking blood pressure at home (%)
Blood Pressure & Cholesterol - Frequently checking blood cholesterol (%)
Blood Pressure & Cholesterol - Has high cholesterol level (%)
Consumer Behavior - Money monthly spent on food at supermarket/grocery store
Consumer Behavior - Money monthly spent on food at other stores
Consumer Behavior - Money monthly spent on eating out
Consumer Behavior - Money monthly spent on carryout/delivered foods
Consumer Behavior - Income spent on food at supermarket/grocery store (%)
Consumer Behavior - Income spent on food at other stores (%)
Consumer Behavior - Income spent on eating out (%)
Consumer Behavior - Income spent on carryout/delivered foods (%)
Current Health Status - General health condition (%)
Current Health Status - Blood donors (%)
Current Health Status - Has blood ever tested for HIV virus (%)
Current Health Status - Left-handed people (%)
Dermatology - People using sunscreen (%)
Diabetes - Diabetics (%)
Diabetes - Had a blood test for high blood sugar (%)
Diabetes - People taking insulin (%)
Diet Behavior & Nutrition - Diet health (%)
Diet Behavior & Nutrition - Milk product consumption (# of products/month)
Diet Behavior & Nutrition - Meals not home prepared (#/week)
Diet Behavior & Nutrition - Meals from fast food or pizza place (#/week)
Diet Behavior & Nutrition - Ready-to-eat foods (#/month)
Diet Behavior & Nutrition - Frozen meals/pizza (#/month)
Drug Use - People that ever used marijuana or hashish (%)
Drug Use - Ever used hard drugs (%)
Drug Use - Ever used any form of cocaine (%)
Drug Use - Ever used heroin (%)
Drug Use - Ever used methamphetamine (%)
Health Insurance - People covered by health insurance (%)
Kidney Conditions-Urology - Avg. # of times urinating at night
Medical Conditions - People with asthma (%)
Medical Conditions - People with anemia (%)
Medical Conditions - People with psoriasis (%)
Medical Conditions - People with overweight (%)
Medical Conditions - Elderly people having difficulties in thinking or remembering (%)
Medical Conditions - People who ever received blood transfusion (%)
Medical Conditions - People having trouble seeing even with glass/contacts (%)
Medical Conditions - People with arthritis (%)
Medical Conditions - People with gout (%)
Medical Conditions - People with congestive heart failure (%)
Medical Conditions - People with coronary heart disease (%)
Medical Conditions - People with angina pectoris (%)
Medical Conditions - People who ever had heart attack (%)
Medical Conditions - People who ever had stroke (%)
Medical Conditions - People with emphysema (%)
Medical Conditions - People with thyroid problem (%)
Medical Conditions - People with chronic bronchitis (%)
Medical Conditions - People with any liver condition (%)
Medical Conditions - People who ever had cancer or malignancy (%)
Mental Health - People who have little interest in doing things (%)
Mental Health - People feeling down, depressed, or hopeless (%)
Mental Health - People who have trouble sleeping or sleeping too much (%)
Mental Health - People feeling tired or having little energy (%)
Mental Health - People with poor appetite or overeating (%)
Mental Health - People feeling bad about themself (%)
Mental Health - People who have trouble concentrating on things (%)
Mental Health - People moving or speaking slowly or too fast (%)
Mental Health - People having thoughts they would be better off dead (%)
Oral Health - Average years since last visit a dentist
Oral Health - People embarrassed because of mouth (%)
Oral Health - People with gum disease (%)
Oral Health - General health of teeth and gums (%)
Oral Health - Average days a week using dental floss/device
Oral Health - Average days a week using mouthwash for dental problem
Oral Health - Average number of teeth
Pesticide Use - Households using pesticides to control insects (%)
Pesticide Use - Households using pesticides to kill weeds (%)
Physical Activity - People doing vigorous-intensity work activities (%)
Physical Activity - People doing moderate-intensity work activities (%)
Physical Activity - People walking or bicycling (%)
Physical Activity - People doing vigorous-intensity recreational activities (%)
Physical Activity - People doing moderate-intensity recreational activities (%)
Physical Activity - Average hours a day doing sedentary activities
Physical Activity - Average hours a day watching TV or videos
Physical Activity - Average hours a day using computer
Physical Functioning - People having limitations keeping them from working (%)
Physical Functioning - People limited in amount of work they can do (%)
Physical Functioning - People that need special equipment to walk (%)
Physical Functioning - People experiencing confusion/memory problems (%)
Physical Functioning - People requiring special healthcare equipment (%)
Prescription Medications - Average number of prescription medicines taking
Preventive Aspirin Use - Adults 40+ taking low-dose aspirin (%)
Reproductive Health - Vaginal deliveries (%)
Reproductive Health - Cesarean deliveries (%)
Reproductive Health - Deliveries resulted in a live birth (%)
Reproductive Health - Pregnancies resulted in a delivery (%)
Reproductive Health - Women breastfeeding newborns (%)
Reproductive Health - Women that had a hysterectomy (%)
Reproductive Health - Women that had both ovaries removed (%)
Reproductive Health - Women that have ever taken birth control pills (%)
Reproductive Health - Women taking birth control pills (%)
Reproductive Health - Women that have ever used Depo-Provera or injectables (%)
Reproductive Health - Women that have ever used female hormones (%)
Sexual Behavior - People 18+ that ever had sex (vaginal, anal, or oral) (%)
Sexual Behavior - Males 18+ that ever had vaginal sex with a woman (%)
Sexual Behavior - Males 18+ that ever performed oral sex on a woman (%)
Sexual Behavior - Males 18+ that ever had anal sex with a woman (%)
Sexual Behavior - Males 18+ that ever had any sex with a man (%)
Sexual Behavior - Females 18+ that ever had vaginal sex with a man (%)
Sexual Behavior - Females 18+ that ever performed oral sex on a man (%)
Sexual Behavior - Females 18+ that ever had anal sex with a man (%)
Sexual Behavior - Females 18+ that ever had any kind of sex with a woman (%)
Sexual Behavior - Average age people first had sex
Sexual Behavior - Average number of female sex partners in lifetime (males 18+)
Sexual Behavior - Average number of female vaginal sex partners in lifetime (males 18+)
Sexual Behavior - Average age people first performed oral sex on a woman (18+)
Sexual Behavior - Average number of woman performed oral sex on in lifetime (18+)
Sexual Behavior - Average number of male sex partners in lifetime (males 18+)
Sexual Behavior - Average number of male anal sex partners in lifetime (males 18+)
Sexual Behavior - Average age people first performed oral sex on a man (18+)
Sexual Behavior - Average number of male oral sex partners in lifetime (18+)
Sexual Behavior - People using protection when performing oral sex (%)
Sexual Behavior - Average number of times people have vaginal or anal sex a year
Sexual Behavior - People having sex without condom (%)
Sexual Behavior - Average number of male sex partners in lifetime (females 18+)
Sexual Behavior - Average number of male vaginal sex partners in lifetime (females 18+)
Sexual Behavior - Average number of female sex partners in lifetime (females 18+)
Sexual Behavior - Circumcised males 18+ (%)
Sleep Disorders - Average hours sleeping at night
Sleep Disorders - People that has trouble sleeping (%)
Smoking-Cigarette Use - People smoking cigarettes (%)
Taste & Smell - People 40+ having problems with smell (%)
Taste & Smell - People 40+ having problems with taste (%)
Taste & Smell - People 40+ that ever had wisdom teeth removed (%)
Taste & Smell - People 40+ that ever had tonsils teeth removed (%)
Taste & Smell - People 40+ that ever had a loss of consciousness because of a head injury (%)
Taste & Smell - People 40+ that ever had a broken nose or other serious injury to face or skull (%)
Taste & Smell - People 40+ that ever had two or more sinus infections (%)
Weight - Average height (inches)
Weight - Average weight (pounds)
Weight - Average BMI
Weight - People that are obese (%)
Weight - People that ever were obese (%)
Weight - People trying to lose weight (%)
According to our research of Minnesota and other state lists, there was 1 registered sex offender living in Hermantown, Minnesota as of June 16, 2024 . The ratio of all residents to sex offenders in Hermantown is 9,581 to 1.The ratio of registered sex offenders to all residents in this city is lower than the state average.
Officers per 1,000 residents here:
1.68Minnesota average:
1.76
Latest news from Hermantown, MN collected exclusively by city-data.com from local newspapers, TV, and radio stations
Ancestries: German (22.9%), European (10.8%), Norwegian (9.9%), American (6.6%), Swedish (6.5%), Italian (5.6%).
Current Local Time:
Land area: 34.3 square miles.
Population density: 295 people per square mile (very low).
183 residents are foreign born
This city:
1.8%Minnesota:
8.5%
Median real estate property taxes paid for housing units with mortgages in 2022: $5,003 (1.2%)Median real estate property taxes paid for housing units with no mortgage in 2022: $2,853 (1.1%)
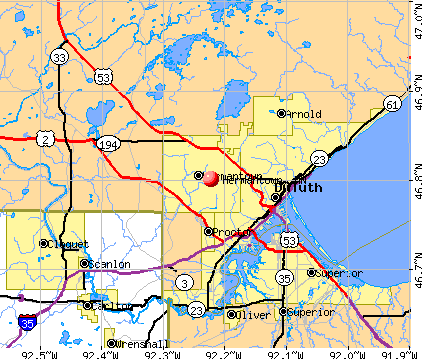
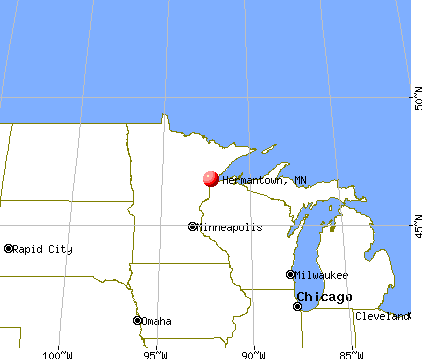
Nearest city with pop. 50,000+: Duluth, MN
Nearest city with pop. 200,000+: St. Paul, MN
Nearest city with pop. 1,000,000+: Chicago, IL
Nearest cities:
Thomson, MN (3.5 miles)
Latitude: 46.80 N, Longitude: 92.22 W
Daytime population change due to commuting: +1,251 (+12.4%)Workers who live and work in this city: 1,123 (22.9%)
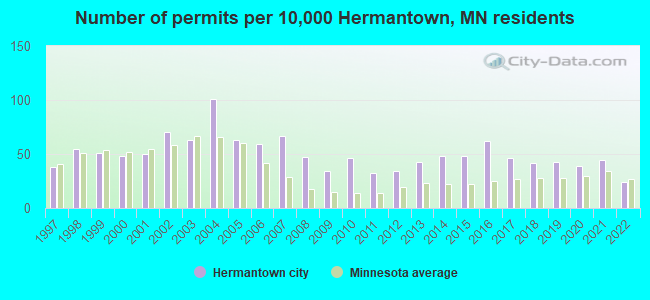
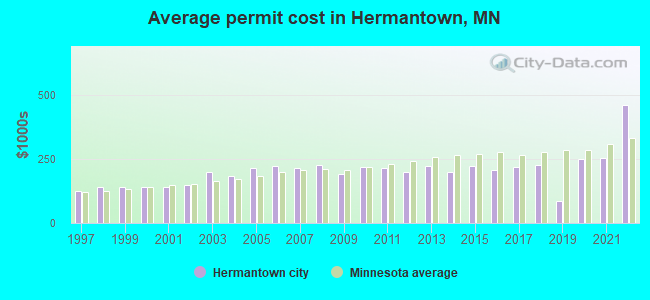
Single-family new house construction building permits:
2022: 18 buildings , average cost: $460,4002021: 33 buildings , average cost: $253,3002020: 29 buildings , average cost: $248,6002019: 32 buildings , average cost: $86,8002018: 31 buildings , average cost: $227,2002017: 34 buildings , average cost: $219,9002016: 46 buildings , average cost: $205,5002015: 36 buildings , average cost: $222,3002014: 36 buildings , average cost: $198,4002013: 32 buildings , average cost: $221,4002012: 25 buildings , average cost: $199,8002011: 24 buildings , average cost: $214,5002010: 34 buildings , average cost: $219,7002009: 25 buildings , average cost: $192,1002008: 35 buildings , average cost: $227,9002007: 50 buildings , average cost: $213,5002006: 44 buildings , average cost: $223,6002005: 47 buildings , average cost: $216,0002004: 75 buildings , average cost: $185,3002003: 47 buildings , average cost: $200,4002002: 52 buildings , average cost: $146,7002001: 37 buildings , average cost: $140,2002000: 36 buildings , average cost: $140,3001999: 38 buildings , average cost: $139,9001998: 41 buildings , average cost: $141,2001997: 28 buildings , average cost: $125,800Unemployment in December 2023: Population change in the 1990s: +658 (+9.7%).
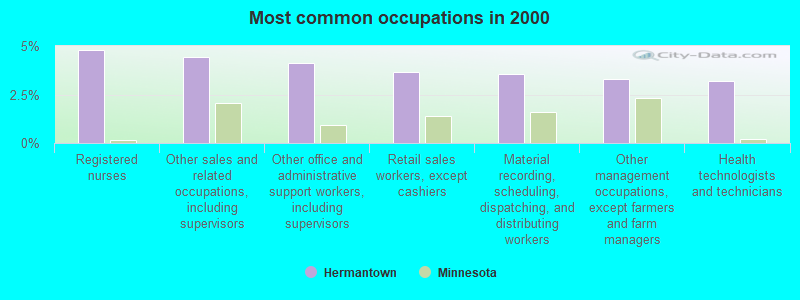
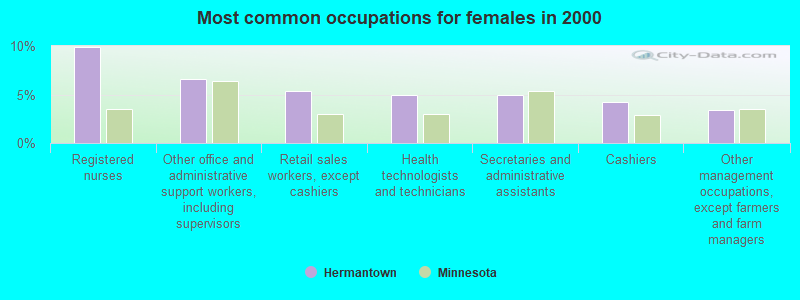
Most common occupations in Hermantown, MN (%)
Both Males Females
Registered nurses (4.8%)
Other sales and related occupations, including supervisors (4.4%)
Other office and administrative support workers, including supervisors (4.1%)
Retail sales workers, except cashiers (3.7%)
Material recording, scheduling, dispatching, and distributing workers (3.6%)
Other management occupations, except farmers and farm managers (3.3%)
Health technologists and technicians (3.2%)
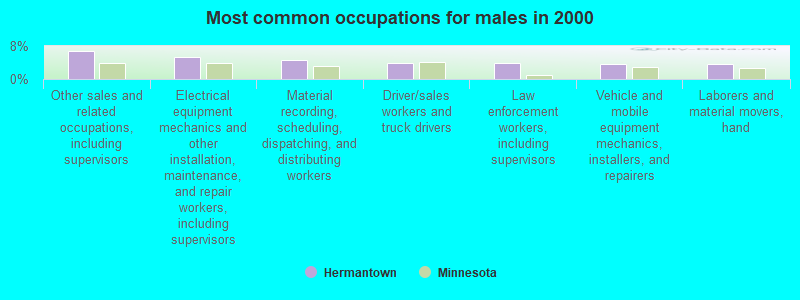
Other sales and related occupations, including supervisors (6.7%)
Electrical equipment mechanics and other installation, maintenance, and repair workers, including supervisors (5.3%)
Material recording, scheduling, dispatching, and distributing workers (4.6%)
Driver/sales workers and truck drivers (4.0%)
Law enforcement workers, including supervisors (3.8%)
Vehicle and mobile equipment mechanics, installers, and repairers (3.6%)
Laborers and material movers, hand (3.6%)
Registered nurses (9.9%)
Other office and administrative support workers, including supervisors (6.6%)
Retail sales workers, except cashiers (5.3%)
Health technologists and technicians (5.0%)
Secretaries and administrative assistants (4.9%)
Cashiers (4.3%)
Other management occupations, except farmers and farm managers (3.4%)
Tornado activity:
Hermantown-area historical tornado activity is significantly below Minnesota state average. It is 73% smaller than the overall U.S. average.
On 6/11/1966, a category F4 (max. wind speeds 207-260 mph) tornado 28.8 miles away from the Hermantown city center caused between $50,000 and $500,000 in damages.
On 8/6/1969, a category F3 (max. wind speeds 158-206 mph) tornado 17.5 miles away from the city center killed 2 people and injured 3 people and caused between $50,000 and $500,000 in damages.
Earthquake activity:
Hermantown-area historical earthquake activity is significantly above Minnesota state average. It is 64% smaller than the overall U.S. average. On 7/9/1975 at 14:54:15, a magnitude 4.6 (4.6 MB, Class: Light, Intensity: IV - V) earthquake occurred 198.7 miles away from the city center On 2/7/2020 at 18:30:28, a magnitude 3.3 (3.3 ML, Class: Light, Intensity: II - III) earthquake occurred 52.5 miles away from Hermantown center On 1/9/2020 at 18:16:48, a magnitude 3.3 (3.3 MB) earthquake occurred 55.9 miles away from the city center On 6/5/1993 at 01:24:53, a magnitude 4.1 (4.1 LG, Depth: 6.2 mi) earthquake occurred 209.7 miles away from the city center On 4/8/2020 at 17:14:33, a magnitude 3.3 (3.3 ML) earthquake occurred 56.6 miles away from Hermantown center On 4/24/2020 at 17:23:43, a magnitude 3.2 (3.2 ML) earthquake occurred 53.4 miles away from the city center Magnitude types: regional Lg-wave magnitude (LG), body-wave magnitude (MB), local magnitude (ML) Natural disasters: The number of natural disasters in St. Louis County (3) is a lot smaller than the US average (15).Floods: 2, Storms: 2, Tornado: 1, Wind: 1, Other: 1 (Note: some incidents may be assigned to more than one category). Hospitals and medical centers near Hermantown: VIEWCREST HEALTH CENTER (Nursing Home, about 4 miles away; DULUTH, MN)
MSOCS DULUTH ICFMR GROUP HOME (Hospital, about 4 miles away; DULUTH, MN)
HEARTHSTONE HOME CARE LLC (Home Health Center, about 5 miles away; DULUTH, MN)
CHRIS JENSEN HEALTH AND REHABILITATION CENTER (Nursing Home, about 5 miles away; DULUTH, MN)
ST LOUIS CTY MEDICAL CTR (Nursing Home, about 5 miles away; DULUTH, MN)
NURSES THAT CARE INC (Home Health Center, about 5 miles away; DULUTH, MN)
FRESENIUS MEDICAL CARE - SPIRIT VALLEY (Dialysis Facility, about 6 miles away; DULUTH, MN)
Amtrak station near Hermantown: 6 miles: DULUTH (2122 W. SUPERIOR ST.) - Bus Station Services: enclosed waiting area, public restrooms, public payphones, call for taxi service.
Colleges/universities with over 2000 students nearest to Hermantown:
Lake Superior College (about 4 miles; Duluth, MN ; Full-time enrollment: 3,768)
The College of Saint Scholastica (about 6 miles; Duluth, MN ; FT enrollment: 3,762)
University of Minnesota-Duluth (about 7 miles; Duluth, MN ; FT enrollment: 10,612)
University of Wisconsin-Superior (about 9 miles; Superior, WI ; FT enrollment: 2,302)
Wisconsin Indianhead Technical College (about 75 miles; Shell Lake, WI ; FT enrollment: 2,414)
Central Lakes College-Brainerd (about 100 miles; Brainerd, MN ; FT enrollment: 3,371)
Anoka-Ramsey Community College (about 126 miles; Coon Rapids, MN ; FT enrollment: 5,918)
Public high schools in Hermantown: HERMANTOWN SENIOR HIGH Location: 4335 HAWK CIRCLE DR, Grades: 9-12)HERMANTOWN ALTERNATIVE LEARNING PRG Location: 4335 HAWK CIRCLE DR, Grades: 9-12)
Public elementary/middle schools in Hermantown:
See full list of schools located in Hermantown
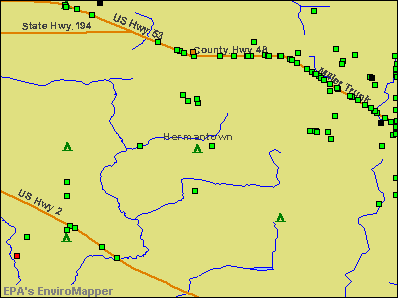
Notable locations in Hermantown: (A) , Hermantown Police Department (B) , Hermantown Volunteer Fire Department Station 2 (C) , Hermantown Volunteer Fire Department Station 3 (D) . Display/hide their locations on the map
Churches in Hermantown include: (A) , Peace in Christ Lutheran Church (B) , Trinity Episcopal Church (C) , Faith Baptist Church (D) , Grace Lutheran Church (E) , Salem Church (F) , Gethsemane Church (G) . Display/hide their locations on the map
Cemeteries: (1) , Sunrise Memorial Cemetery (2) , Jewish Cemetery (3) , Hermantown Cemetery (4) , Bethany Cemetery (5) . Display/hide their locations on the map
Lake: (A) . Display/hide its location on the map
Streams, rivers, and creeks: (A) . Display/hide its location on the map
Tourist attraction: (1) . Display/hide its approximate location on the map
Hotels: (1) , Airliner Motel (5002 Miller Trunk Highway) (2) , Skyline Court Motel (4880 Miller Trunk Highway) (3) . Display/hide their approximate locations on the map
St. Louis County has a predicted average indoor radon screening level between 2 and 4 pCi/L (pico curies per liter) - Moderate Potential Drinking water stations with addresses in Hermantown that have no violations reported:
HERMANTOWN (Address: 5105 Maple Grove Road Population served: 2,550, Primary Water Source Type: Purch surface water)
Average household size: This city:
2.5 peopleMinnesota:
2.5 people
Percentage of family households: This city:
70.1%Whole state:
64.6%
Percentage of households with unmarried partners: This city:
5.8%Whole state:
6.9%
Likely homosexual households (counted as self-reported same-sex unmarried-partner households)
Lesbian couples: 0.2% of all households Gay men: 0.2% of all households
People in group quarters in Hermantown in 2010:
772 people in federal prisons
61 people in group homes intended for adults
25 people in nursing facilities/skilled-nursing facilities
8 people in group homes for juveniles (non-correctional)
3 people in emergency and transitional shelters (with sleeping facilities) for people experiencing homelessness
People in group quarters in Hermantown in 2000:
128 people in other noninstitutional group quarters
30 people in nursing homes
5 people in other group homes
Banks with branches in Hermantown (2011 data):
North Shore Bank of Commerce: Hermantown Branch at 4810 Miller Trunk Highway, branch established on 1963/06/17. Info updated 2006/11/03: Bank assets: $226.4 mil, Deposits: $210.3 mil, headquarters in Duluth, MN, positive income , Commercial Lending Specialization, 8 total offices , Holding Company: North Shore Financial Corporation
Republic Bank, Inc.: Hermantown Branch at 5094 Miller Trunk Highway, branch established on 2008/01/15. Info updated 2006/11/03: Bank assets: $314.8 mil, Deposits: $266.4 mil, headquarters in Duluth, MN, positive income , Commercial Lending Specialization, 7 total offices , Holding Company: Republic Bancshares, Inc.
National Bank of Commerce: Hermantown Branch at 4105 Richard Avenue, branch established on 2004/12/01. Info updated 2008/12/02: Bank assets: $539.6 mil, Deposits: $449.5 mil, headquarters in Superior, WI, positive income , Commercial Lending Specialization, 7 total offices , Holding Company: Natcom Bancshares,inc.
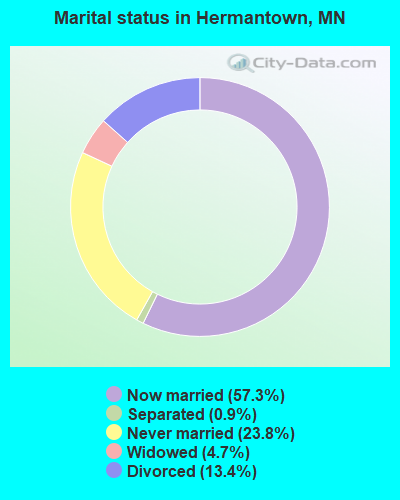
For population 15 years and over in Hermantown:
Never married: 23.8%Now married: 57.3%Separated: 0.9%Widowed: 4.7%Divorced: 13.4% For population 25 years and over in Hermantown:
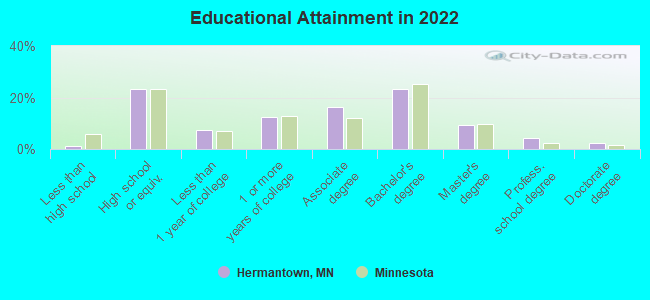
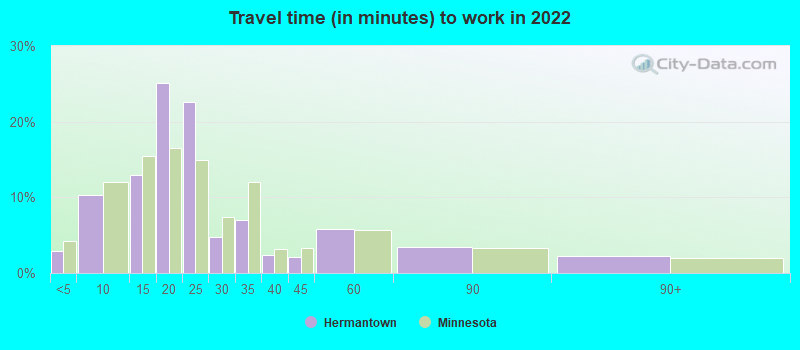
High school or higher: 98.8%Bachelor's degree or higher: 38.9%Graduate or professional degree: 15.3%Unemployed: 5.2%Mean travel time to work (commute): 16.4 minutes
Education Gini index (Inequality in education) Here:
9.4Minnesota average:
10.9
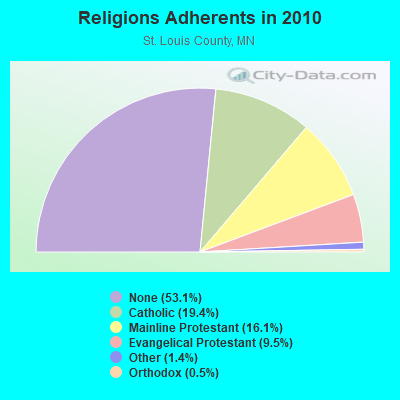
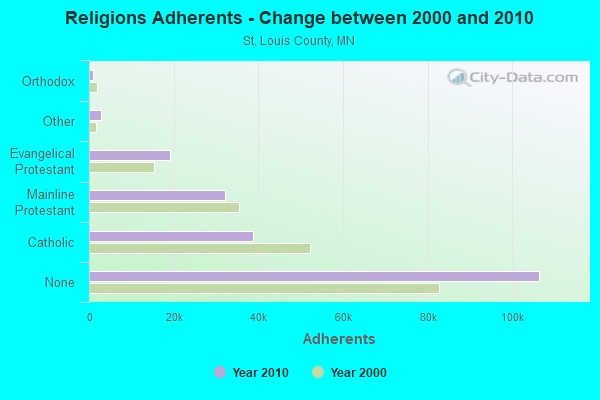
Religion statistics for Hermantown, MN (based on St. Louis County data)
Religion Adherents Congregations Catholic 38,757 36 Mainline Protestant 32,143 91 Evangelical Protestant 19,017 118 Other 2,760 20 Orthodox 976 6 Black Protestant 177 1 None 106,396 -
Source: Clifford Grammich, Kirk Hadaway, Richard Houseal, Dale E.Jones, Alexei Krindatch, Richie Stanley and Richard H.Taylor. 2012. 2010 U.S.Religion Census: Religious Congregations & Membership Study. Association of Statisticians of American Religious Bodies. Jones, Dale E., et al. 2002. Congregations and Membership in the United States 2000. Nashville, TN: Glenmary Research Center. Graphs represent county-level data
Food Environment Statistics: Number of grocery stores : 39St. Louis County :
1.99 / 10,000 pop.Minnesota :
1.83 / 10,000 pop.
Number of supercenters and club stores : 2Here :
0.10 / 10,000 pop.State :
0.13 / 10,000 pop.
Number of convenience stores (no gas) : 2St. Louis County :
0.10 / 10,000 pop.Minnesota :
0.49 / 10,000 pop.
Number of convenience stores (with gas) : 106St. Louis County :
5.40 / 10,000 pop.State :
3.90 / 10,000 pop.
Number of full-service restaurants : 176St. Louis County :
8.96 / 10,000 pop.State :
6.98 / 10,000 pop.
Adult obesity rate : St. Louis County :
25.3%State :
25.9%
Low-income preschool obesity rate : St. Louis County :
11.3%State :
13.0%
Health and Nutrition: Healthy diet rate : Hermantown:
56.1%Minnesota:
50.6%
Average overall health of teeth and gums : This city:
55.7%State:
48.4%
Average BMI : This city:
27.7Minnesota:
28.5
People feeling badly about themselves : Hermantown:
20.1%Minnesota:
21.0%
People not drinking alcohol at all : Average hours sleeping at night : Hermantown:
7.0Minnesota:
6.8
Overweight people : Hermantown:
32.5%Minnesota:
33.5%
General health condition : Here:
63.0%Minnesota:
57.7%
Average condition of hearing : This city:
80.6%Minnesota:
79.3%
More about Health and Nutrition of Hermantown, MN Residents
Local government employment and payroll (March 2022)
Function
Full-time employees
Monthly full-time payroll
Average yearly full-time wage
Part-time employees
Monthly part-time payroll
Police Protection - Officers
16 $113,473 $85,105 0 $0 Financial Administration
4 $24,768 $74,304 0 $0 Other Government Administration
4 $28,680 $86,040 6 $3,925 Police - Other
3 $14,164 $56,656 0 $0 Streets and Highways
3 $19,686 $78,744 0 $0 Other and Unallocable
2 $12,848 $77,088 1 $811 Sewerage
2 $10,823 $64,938 0 $0 Water Supply
2 $12,541 $75,246 0 $0 Parks and Recreation
1 $5,141 $61,692 0 $0 Housing and Community Development (Local)
1 $9,172 $110,064 0 $0
Totals for Government
38 $251,298 $79,357 7 $4,736
Hermantown government finances - Expenditure in 2017 (per resident):
Construction - Regular Highways: $2,185,000 ($215.78)
Current Operations - Police Protection: $2,122,000 ($209.56)
Sewerage: $1,348,000 ($133.12)Water Utilities: $1,320,000 ($130.36)Regular Highways: $798,000 ($78.81)General - Other: $607,000 ($59.94)Local Fire Protection: $554,000 ($54.71)Financial Administration: $482,000 ($47.60)Protective Inspection and Regulation - Other: $135,000 ($13.33)Parks and Recreation: $113,000 ($11.16)Central Staff Services: $54,000 ($5.33)Miscellaneous Commercial Activities - Other: $2,000 ($0.20)General - Interest on Debt: $840,000 ($82.95)
Other Capital Outlay - Regular Highways: $636,000 ($62.81)
General - Other: $279,000 ($27.55)Solid Waste Management: $75,000 ($7.41)Police Protection: $63,000 ($6.22)Sewerage: $55,000 ($5.43)Parks and Recreation: $45,000 ($4.44)Water Utilities: $25,000 ($2.47)
Hermantown government finances - Revenue in 2017 (per resident):
Charges - Sewerage: $1,483,000 ($146.45)
Other: $148,000 ($14.62)Regular Highways: $136,000 ($13.43)Parks and Recreation: $10,000 ($0.99)Federal Intergovernmental - Other: $2,000 ($0.20)
Miscellaneous - Special Assessments: $727,000 ($71.80)
Interest Earnings: $94,000 ($9.28)Fines and Forfeits: $64,000 ($6.32)General Revenue - Other: $25,000 ($2.47)Revenue - Water Utilities: $1,479,000 ($146.06)
State Intergovernmental - Other: $2,469,000 ($243.83)
General Local Government Support: $164,000 ($16.20)Tax - Property: $4,177,000 ($412.50)
General Sales and Gross Receipts: $2,984,000 ($294.69)Other License: $315,000 ($31.11)Public Utilities Sales: $38,000 ($3.75)
Hermantown government finances - Debt in 2017 (per resident):
Long Term Debt - Outstanding Unspecified Public Purpose: $27,965,000 ($2761.70)
Beginning Outstanding - Unspecified Public Purpose: $22,911,000 ($2262.59)Issue, Unspecified Public Purpose: $8,340,000 ($823.62)Retired Unspecified Public Purpose: $3,286,000 ($324.51)
Hermantown government finances - Cash and Securities in 2017 (per resident):
Bond Funds - Cash and Securities: $1,691,000 ($167.00)
Other Funds - Cash and Securities: $5,587,000 ($551.75)
Sinking Funds - Cash and Securities: $1,934,000 ($190.99)
Businesses in Hermantown, MN
Name Count Name Count
Chevrolet 1 Outback Steakhouse 1 Dairy Queen 1 Sam's Club 1 Decora Cabinetry 2 Slumberland 1 Hyundai 1 Subaru 1 Lane Furniture 1 Subway 1 MasterBrand Cabinets 3 U-Haul 2 McDonald's 1 Volkswagen 1 Menards 1 Walmart 1 Outback 1
Strongest AM radio stations in Hermantown:
WEBC (560 AM; 50 kW; DULUTH, MN)
KDAL (610 AM; 5 kW; DULUTH, MN; Owner: MIDWEST COMMUNICATIONS, INC.)
WDSM (710 AM; 10 kW; SUPERIOR, WI; Owner: MIDWEST COMMUNICATIONS, INC.)
WWJC (850 AM; daytime; 10 kW; DULUTH, MN; Owner: WWJC, INC.)
KQDS (1490 AM; 1 kW; DULUTH, MN; Owner: RED ROCK RADIO CORP.)
WGEE (970 AM; 1 kW; SUPERIOR, WI; Owner: MIDWEST COMMUNICATIONS, INC.)
WKLK (1230 AM; 1 kW; CLOQUET, MN; Owner: QB BROADCASTING, LTD.)
WNMT (650 AM; 10 kW; NASHWAUK, MN; Owner: MIDWEST RADIO NETWORK, L.L.C.)
WCCO (830 AM; 50 kW; MINNEAPOLIS, MN; Owner: INFINITY MEDIA CORPORATION)
WCTS (1030 AM; 50 kW; MAPLEWOOD, MN; Owner: CNTL. BAPT. THEO/AL SEMI MINNEAPOLIS)
KSTP (1500 AM; 50 kW; ST. PAUL, MN; Owner: KSTP-AM, LLC (DELAWARE))
KFAN (1130 AM; 50 kW; MINNEAPOLIS, MN; Owner: AMFM RADIO LICENSES, L.L.C.)
KPRM (870 AM; 25 kW; PARK RAPIDS, MN; Owner: DE LA HUNT BROADCASTING CORP.)
Strongest FM radio stations in Hermantown:
KBMX (107.7 FM; PROCTOR, MN; Owner: REGENT BROADCASTING OF DULUTH, INC.)
WWAX (92.1 FM; HERMANTOWN, MN; Owner: RED ROCK RADIO CORP.)
KUMD-FM (103.3 FM; DULUTH, MN; Owner: REGENTS OF UNIVERSITY OF MINNESOTA)
KQDS-FM (94.9 FM; DULUTH, MN; Owner: RED ROCK RADIO CORP.)
KLDJ (101.7 FM; DULUTH, MN; Owner: REGENT BROADCASTING OF DULUTH, INC.)
WSCN (100.5 FM; CLOQUET, MN; Owner: MINNESOTA PUBLIC RADIO)
KDAL-FM (95.7 FM; DULUTH, MN; Owner: MIDWEST COMMUNICATIONS, INC.)
KDNI (90.5 FM; DULUTH, MN; Owner: NORTHWESTERN COLLEGE)
KKCB (105.1 FM; DULUTH, MN; Owner: REGENT BROADCASTING OF DULUTH, INC.)
KUWS (91.3 FM; SUPERIOR, WI; Owner: BD. OF REGENTS, UNIV. OF WISC. SYS.)
KRBR-FM (102.5 FM; SUPERIOR, WI; Owner: MIDWEST COMMUNICATIONS, INC.)
WSCD-FM (92.9 FM; DULUTH, MN; Owner: MINNESOTA PUBLIC RADIO)
KTCO (98.9 FM; DULUTH, MN; Owner: MIDWEST COMMUNICATIONS, INC.)
WNCB (89.5 FM; DULUTH, MN; Owner: REFUGE MEDIA GROUP)
KDNW (97.3 FM; DULUTH, MN; Owner: NORTHWESTERN COLLEGE)
W203AL (88.5 FM; DULUTH, MN; Owner: FAMILY STATIONS, INC.)
WKLK-FM (96.5 FM; CLOQUET, MN; Owner: QB BROADCASTING, LTD.)
KZIO (104.3 FM; TWO HARBORS, MN; Owner: RED ROCK RADIO CORP.)
K292EZ (106.3 FM; DULUTH, MN; Owner: RED ROCK RADIO CORP.)
TV broadcast stations around Hermantown:
WDIO-TV (Channel 10; DULUTH, MN; Owner: WDIO-TV, LLC)
KDLH (Channel 3; DULUTH, MN; Owner: CHELSEY BROADCASTING COMPANY OF DULUTH, LLC)
WDSE-TV (Channel 8; DULUTH, MN; Owner: DULUTH-SUPERIOR AREA EDUCATIONAL TV CORPORATION)
KQDS-TV (Channel 21; DULUTH, MN; Owner: KQDS ACQUISITION CORP.)
KBJR-TV (Channel 6; SUPERIOR, WI; Owner: KBJR LICENSE, INC.)
K58CM (Channel 58; DULUTH, MN; Owner: TRINITY BROADCASTING NETWORK)
KDUL-LP (Channel 60; DULUTH, MN; Owner: DULUTH TV PARTNERS, GP)
K38DS (Channel 38; DULUTH, MN; Owner: STEVEN R. ZUKERBERG)
K62EP (Channel 62; DULUTH, MN; Owner: DAN BLECHMAN)
K64EF (Channel 64; DULUTH, MN; Owner: STEVEN R. ZUKERBERG)
K68EA (Channel 68; DULUTH, MN; Owner: MS COMMUNICATIONS, LLC)
KWMN-LP (Channel 56; DULUTH, MN; Owner: DULUTH DATACASTING PARTNERS, G.P.)
K15DU (Channel 15; DULUTH, MN; Owner: DAN BLECHMAN)
K66EO (Channel 66; DULUTH, MN; Owner: HAROLD AND/ OR SUE KROGMAN)
National Bridge Inventory (NBI) Statistics 18 Number of bridges164ft / 49.9m Total length $1,162,000,000 Total costs64,173 Total average daily traffic3,091 Total average daily truck traffic
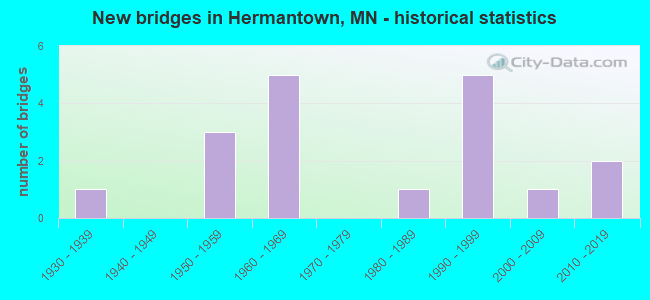
New bridges - historical statistics
1 1930-1939 3 1950-1959 5 1960-1969 1 1980-1989 5 1990-1999 1 2000-2009 2 2010-2019
See full National Bridge Inventory statistics for Hermantown, MN
FCC Registered Antenna Towers: 42 (
See the full list of FCC Registered Antenna Towers in Hermantown )
FCC Registered Broadcast Land Mobile Towers: 6
4301 Menard Drive (Lat: 46.822500 Lon: -92.182778), Call Sign: WQBL741, Assigned Frequencies: 30.8400 MHz, 154.540 MHz, 33.4000 MHz, 33.1600 MHz, 31.2400 MHz, 468.487 MHz, 468.762 MHz, 468.837 MHz, 469.462 MHz, 469.637 MHz... (+22 more), Grant Date: 11/02/2004, Expiration Date: 11/02/2014, Cancellation Date: 01/03/2015, Certifier: Beth Cotner, Registrant: Dolfen Consulting Group, 95 Willow Lane, Bristol, IL 60512-9711, Phone: (630) 553-5886, Fax: (630) 566-1755, Email:
4275 Haines Road (Lat: 46.815833 Lon: -92.174722), Call Sign: WQCM369, Assigned Frequencies: 467.762 MHz, 457.512 MHz, 467.487 MHz, 462.187 MHz, 462.462 MHz, Grant Date: 04/06/2005, Expiration Date: 04/06/2015, Cancellation Date: 06/06/2015, Certifier: Brian Sword, Registrant: Advanced Wireless Communications, 20809 Kensington Blvd., Lakeville, MN 55044, Phone: (952) 469-5400, Email:
Lat: 46.812278 Lon: -92.199917, Call Sign: WQJZ501, Assigned Frequencies: 467.287 MHz, Grant Date: 02/05/2019, Expiration Date: 02/24/2029, Certifier: Glen Leibel, Registrant: Cara Enterprises Inc, Las Vegas, NV 89140-0124, Phone: (702) 838-9728, Fax: (702) 363-4607, Email:
Lat: 46.812278 Lon: -92.199917, Call Sign: WQLU822, Assigned Frequencies: 461.912 MHz, Grant Date: 02/21/2020, Expiration Date: 04/29/2030, Certifier: John Buesgens, Registrant: Business Radio Licensing, 30251 Golden Lantern, Suite E # 501, Laguna Niguel, CA 92677, Phone: (949) 348-8510, Fax: (949) 348-8514, Email:
End Of Oak Ridge Dr, East Of Stebner Rd (Lat: 46.796250 Lon: -92.186750), Type: Bant, Structure height: 5 m, Overall height: 6.1 m, Call Sign: WQND595, Assigned Frequencies: 461.912 MHz, Grant Date: 12/09/2020, Expiration Date: 12/30/2030, Certifier: John Steltr, Registrant: Business Radio Licensing, 30251 Golden Lantern, Suite E # 501, Laguna Niguel, CA 92677, Phone: (949) 348-8510, Fax: (949) 348-8514, Email:
Thompson& Lavaque Rd (Lat: 46.771444 Lon: -92.211194), Type: Bant, Structure height: 14 m, Overall height: 15.2 m, Call Sign: WQOU681, Assigned Frequencies: 461.912 MHz, Grant Date: 11/16/2021, Expiration Date: 02/03/2032, Certifier: Glen Leibel, Registrant: Duluth Superior Communications, 711 Hammond Ave., Superior, WI 54880, Phone: (715) 392-2911, Fax: (715) 392-2995, Email:
FCC Registered Microwave Towers: 8 (
See the full list of FCC Registered Microwave Towers in this town )
FCC Registered Paging Towers: 3 (
See the full list of FCC Registered Paging Towers )
FCC Registered Amateur Radio Licenses: 34 (
See the full list of FCC Registered Amateur Radio Licenses in Hermantown )
FAA Registered Aircraft: 20 (
See the full list of FAA Registered Aircraft in Hermantown )
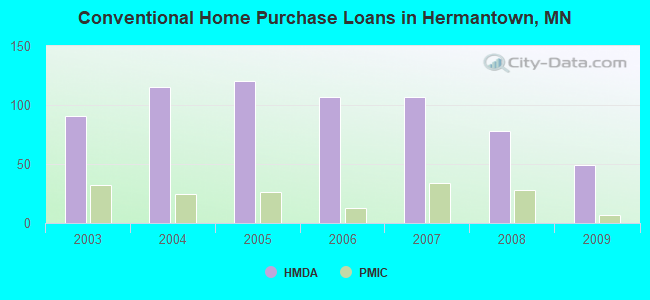
Home Mortgage Disclosure Act Aggregated Statistics For Year 2009(Based on 2 partial tracts) A) FHA, FSA/RHS & VA B) Conventional C) Refinancings D) Home Improvement Loans E) Loans on Dwellings For 5+ Families F) Non-occupant Loans on G) Loans On Manufactured Number Average Value Number Average Value Number Average Value Number Average Value Number Average Value Number Average Value Number Average Value
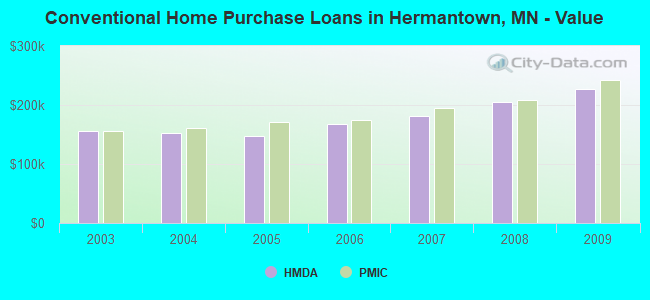
LOANS ORIGINATED 16 $173,842 49 $226,550 269 $181,501 24 $51,737 3 $895,487 8 $181,180 8 $115,922 APPLICATIONS APPROVED, NOT ACCEPTED 1 $115,220 6 $307,090 24 $167,882 1 $126,520 0 $0 1 $93,100 0 $0 APPLICATIONS DENIED 1 $203,000 2 $262,865 53 $180,941 2 $33,185 0 $0 3 $146,703 4 $131,332 APPLICATIONS WITHDRAWN 1 $251,530 6 $174,205 31 $203,518 1 $148,660 0 $0 1 $152,200 2 $184,500 FILES CLOSED FOR INCOMPLETENESS 0 $0 2 $314,140 11 $164,486 2 $81,220 0 $0 0 $0 1 $82,300
Aggregated Statistics For Year 2008(Based on 2 partial tracts) A) FHA, FSA/RHS & VA B) Conventional C) Refinancings D) Home Improvement Loans E) Loans on Dwellings For 5+ Families F) Non-occupant Loans on G) Loans On Manufactured Number Average Value Number Average Value Number Average Value Number Average Value Number Average Value Number Average Value Number Average Value
LOANS ORIGINATED 18 $182,785 78 $205,740 107 $178,917 26 $45,420 2 $188,205 11 $221,317 4 $47,870 APPLICATIONS APPROVED, NOT ACCEPTED 0 $0 4 $269,338 17 $141,010 3 $58,370 0 $0 1 $235,380 1 $28,320 APPLICATIONS DENIED 1 $196,930 10 $197,134 46 $197,170 8 $74,345 0 $0 4 $157,070 5 $72,508 APPLICATIONS WITHDRAWN 0 $0 5 $216,446 28 $175,913 1 $41,000 0 $0 3 $159,323 1 $159,280 FILES CLOSED FOR INCOMPLETENESS 0 $0 4 $243,348 10 $143,148 2 $47,610 0 $0 1 $27,430 0 $0
Aggregated Statistics For Year 2007(Based on 2 partial tracts) A) FHA, FSA/RHS & VA B) Conventional C) Refinancings D) Home Improvement Loans E) Loans on Dwellings For 5+ Families F) Non-occupant Loans on G) Loans On Manufactured Number Average Value Number Average Value Number Average Value Number Average Value Number Average Value Number Average Value Number Average Value
LOANS ORIGINATED 5 $188,194 107 $181,075 116 $165,492 27 $56,247 2 $9,003,855 15 $177,912 6 $121,975 APPLICATIONS APPROVED, NOT ACCEPTED 0 $0 5 $114,780 21 $150,722 2 $78,565 0 $0 1 $72,710 0 $0 APPLICATIONS DENIED 0 $0 7 $89,647 49 $146,031 9 $49,434 0 $0 2 $134,550 3 $44,587 APPLICATIONS WITHDRAWN 0 $0 5 $158,358 29 $164,811 1 $34,360 0 $0 3 $128,467 0 $0 FILES CLOSED FOR INCOMPLETENESS 0 $0 3 $197,673 11 $198,308 1 $58,360 0 $0 1 $287,560 0 $0
Aggregated Statistics For Year 2006(Based on 2 partial tracts) A) FHA, FSA/RHS & VA B) Conventional C) Refinancings D) Home Improvement Loans E) Loans on Dwellings For 5+ Families F) Non-occupant Loans on G) Loans On Manufactured Number Average Value Number Average Value Number Average Value Number Average Value Number Average Value Number Average Value Number Average Value
LOANS ORIGINATED 5 $168,932 107 $167,616 157 $144,969 42 $44,157 3 $904,663 13 $200,355 8 $76,538 APPLICATIONS APPROVED, NOT ACCEPTED 0 $0 7 $192,101 22 $141,627 5 $38,602 0 $0 1 $191,140 1 $47,780 APPLICATIONS DENIED 0 $0 9 $126,812 63 $139,141 9 $63,959 0 $0 3 $117,560 1 $118,580 APPLICATIONS WITHDRAWN 2 $96,895 13 $170,060 41 $139,543 4 $122,445 0 $0 6 $102,017 0 $0 FILES CLOSED FOR INCOMPLETENESS 0 $0 2 $103,155 11 $206,783 0 $0 0 $0 0 $0 0 $0
Aggregated Statistics For Year 2005(Based on 2 partial tracts) A) FHA, FSA/RHS & VA B) Conventional C) Refinancings D) Home Improvement Loans E) Loans on Dwellings For 5+ Families F) Non-occupant Loans on G) Loans On Manufactured Number Average Value Number Average Value Number Average Value Number Average Value Number Average Value Number Average Value Number Average Value
LOANS ORIGINATED 4 $162,965 120 $147,167 195 $145,317 44 $71,688 1 $2,268,400 21 $163,402 16 $59,868 APPLICATIONS APPROVED, NOT ACCEPTED 1 $149,550 7 $186,041 25 $126,317 7 $56,803 0 $0 0 $0 3 $125,143 APPLICATIONS DENIED 0 $0 19 $102,903 78 $131,537 10 $94,219 0 $0 1 $98,850 6 $64,085 APPLICATIONS WITHDRAWN 1 $152,200 9 $135,876 58 $156,134 5 $286,130 0 $0 2 $182,210 1 $124,650 FILES CLOSED FOR INCOMPLETENESS 0 $0 1 $81,990 17 $152,761 1 $72,600 0 $0 0 $0 0 $0
Aggregated Statistics For Year 2004(Based on 2 partial tracts) A) FHA, FSA/RHS & VA B) Conventional C) Refinancings D) Home Improvement Loans E) Loans on Dwellings For 5+ Families F) Non-occupant Loans on G) Loans On Manufactured Number Average Value Number Average Value Number Average Value Number Average Value Number Average Value Number Average Value Number Average Value
LOANS ORIGINATED 4 $138,615 115 $153,033 199 $140,816 54 $56,317 4 $5,927,640 14 $184,082 10 $62,024 APPLICATIONS APPROVED, NOT ACCEPTED 0 $0 14 $115,684 34 $134,144 6 $48,720 1 $323,870 1 $112,380 5 $41,200 APPLICATIONS DENIED 1 $144,240 16 $152,506 54 $131,356 14 $65,169 0 $0 3 $169,370 9 $39,141 APPLICATIONS WITHDRAWN 0 $0 13 $165,888 38 $162,168 4 $86,980 0 $0 0 $0 0 $0 FILES CLOSED FOR INCOMPLETENESS 0 $0 1 $165,780 12 $196,812 1 $30,200 0 $0 0 $0 0 $0
Aggregated Statistics For Year 2003(Based on 2 partial tracts) A) FHA, FSA/RHS & VA B) Conventional C) Refinancings D) Home Improvement Loans E) Loans on Dwellings For 5+ Families F) Non-occupant Loans on Number Average Value Number Average Value Number Average Value Number Average Value Number Average Value Number Average Value
LOANS ORIGINATED 8 $140,506 91 $156,734 473 $121,081 42 $31,123 1 $564,250 14 $90,106 APPLICATIONS APPROVED, NOT ACCEPTED 0 $0 10 $116,528 46 $114,779 5 $27,088 0 $0 1 $134,190 APPLICATIONS DENIED 1 $158,260 14 $75,882 73 $102,055 17 $20,385 0 $0 3 $108,557 APPLICATIONS WITHDRAWN 1 $113,270 5 $123,754 99 $129,351 3 $12,390 0 $0 2 $53,655 FILES CLOSED FOR INCOMPLETENESS 0 $0 4 $129,800 17 $121,815 4 $38,935 0 $0 0 $0
Detailed HMDA statistics for the following Tracts:
0003.00
, 0103.00
Private Mortgage Insurance Companies Aggregated Statistics For Year 2009(Based on 2 partial tracts) A) Conventional B) Refinancings Number Average Value Number Average Value
LOANS ORIGINATED 7 $241,634 12 $238,756 APPLICATIONS APPROVED, NOT ACCEPTED 1 $219,460 3 $283,040 APPLICATIONS DENIED 0 $0 4 $219,012 APPLICATIONS WITHDRAWN 0 $0 0 $0 FILES CLOSED FOR INCOMPLETENESS 0 $0 0 $0
Aggregated Statistics For Year 2008(Based on 2 partial tracts) A) Conventional B) Refinancings C) Non-occupant Loans on Number Average Value Number Average Value Number Average Value
LOANS ORIGINATED 28 $208,471 11 $236,825 2 $101,765 APPLICATIONS APPROVED, NOT ACCEPTED 3 $209,937 4 $244,762 0 $0 APPLICATIONS DENIED 0 $0 0 $0 0 $0 APPLICATIONS WITHDRAWN 1 $230,070 0 $0 0 $0 FILES CLOSED FOR INCOMPLETENESS 0 $0 0 $0 0 $0
Aggregated Statistics For Year 2007(Based on 2 partial tracts) A) Conventional B) Refinancings C) Non-occupant Loans on D) Loans On Manufactured Number Average Value Number Average Value Number Average Value Number Average Value
LOANS ORIGINATED 34 $195,614 16 $235,481 1 $116,620 1 $110,610 APPLICATIONS APPROVED, NOT ACCEPTED 4 $234,725 5 $309,600 0 $0 0 $0 APPLICATIONS DENIED 0 $0 0 $0 0 $0 0 $0 APPLICATIONS WITHDRAWN 1 $272,550 1 $66,370 0 $0 0 $0 FILES CLOSED FOR INCOMPLETENESS 0 $0 0 $0 0 $0 0 $0
Aggregated Statistics For Year 2006(Based on 2 partial tracts) A) Conventional B) Refinancings C) Non-occupant Loans on D) Loans On Manufactured Number Average Value Number Average Value Number Average Value Number Average Value
LOANS ORIGINATED 13 $174,015 15 $209,353 0 $0 1 $119,460 APPLICATIONS APPROVED, NOT ACCEPTED 4 $273,388 8 $266,542 2 $226,535 1 $135,390 APPLICATIONS DENIED 0 $0 0 $0 0 $0 0 $0 APPLICATIONS WITHDRAWN 0 $0 2 $182,225 0 $0 1 $117,690 FILES CLOSED FOR INCOMPLETENESS 0 $0 0 $0 0 $0 0 $0
Aggregated Statistics For Year 2005(Based on 2 partial tracts) A) Conventional B) Refinancings C) Non-occupant Loans on D) Loans On Manufactured Number Average Value Number Average Value Number Average Value Number Average Value
LOANS ORIGINATED 26 $171,111 10 $205,169 7 $157,594 2 $136,715 APPLICATIONS APPROVED, NOT ACCEPTED 7 $184,276 3 $205,233 3 $159,877 1 $128,310 APPLICATIONS DENIED 2 $166,360 0 $0 2 $166,360 0 $0 APPLICATIONS WITHDRAWN 1 $284,620 0 $0 1 $243,350 0 $0 FILES CLOSED FOR INCOMPLETENESS 1 $155,740 0 $0 1 $155,740 0 $0
Aggregated Statistics For Year 2004(Based on 2 partial tracts) A) Conventional B) Refinancings C) Non-occupant Loans on D) Loans On Manufactured Number Average Value Number Average Value Number Average Value Number Average Value
LOANS ORIGINATED 25 $160,601 16 $216,068 2 $274,415 1 $107,070 APPLICATIONS APPROVED, NOT ACCEPTED 1 $75,210 9 $201,854 0 $0 0 $0 APPLICATIONS DENIED 0 $0 0 $0 0 $0 0 $0 APPLICATIONS WITHDRAWN 1 $155,700 2 $189,350 1 $229,190 0 $0 FILES CLOSED FOR INCOMPLETENESS 0 $0 0 $0 0 $0 0 $0
Aggregated Statistics For Year 2003(Based on 2 partial tracts) A) Conventional B) Refinancings C) Non-occupant Loans on Number Average Value Number Average Value Number Average Value
LOANS ORIGINATED 32 $155,159 33 $152,606 2 $72,120 APPLICATIONS APPROVED, NOT ACCEPTED 5 $163,504 7 $153,416 0 $0 APPLICATIONS DENIED 0 $0 0 $0 0 $0 APPLICATIONS WITHDRAWN 1 $51,320 4 $140,025 1 $207,950 FILES CLOSED FOR INCOMPLETENESS 1 $115,040 0 $0 0 $0
Detailed PMIC statistics for the following Tracts:
0003.00
, 0103.00 Hermantown compared to Minnesota state average:
Unemployed percentage below state average. Black race population percentage below state average. Hispanic race population percentage below state average. Foreign-born population percentage significantly below state average. Length of stay since moving in above state average. Institutionalized population percentage significantly above state average.
Top Patent Applicants
Anatoly Skirda (19)
Matthew D. Erickson (9)
Steven T. Letko (6)
Donald R. Fosnacht (4)
Thomas Knowles (3)
Donald Fostnacht (2)
Douglas S. States (1)
Donald Fosnacht (1)
David Andrew Rathbun (1)
Total of 46 patent applications in 2008-2024.


 Recent articles from our blog. Our writers, many of them Ph.D. graduates or candidates, create easy-to-read articles on a wide variety of topics.

 (5.2 miles
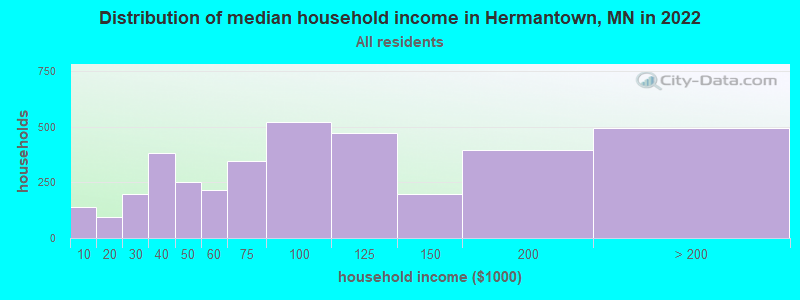


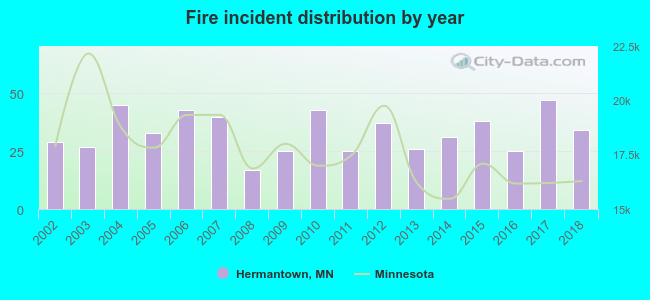 According to the data from the years 2002 - 2018 the average number of fire incidents per year is 33. The highest number of reported fire incidents - 47 took place in 2017, and the least - 17 in 2008. The data has a growing trend.
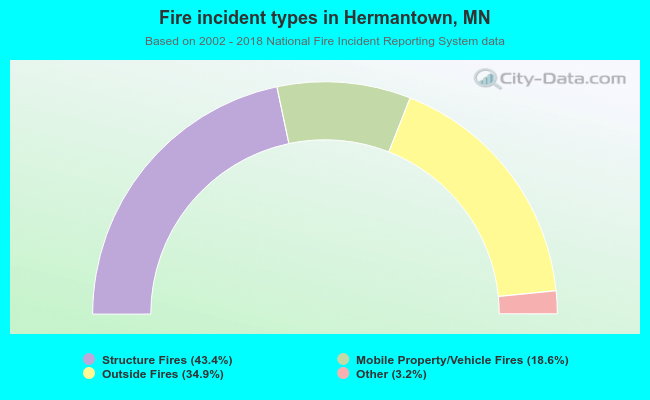 When looking into fire subcategories, the most reports belonged to: Structure Fires (43.4%), and Outside Fires (34.9%).