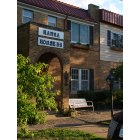
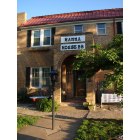
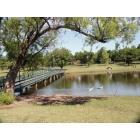
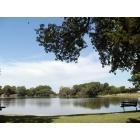
Hobart, Oklahoma Submit your own pictures of this city and show them to the world
OSM Map
General Map
Google Map
MSN Map
OSM Map
General Map
Google Map
MSN Map
OSM Map
General Map
Google Map
MSN Map
OSM Map
General Map
Google Map
MSN Map
Please wait while loading the map...
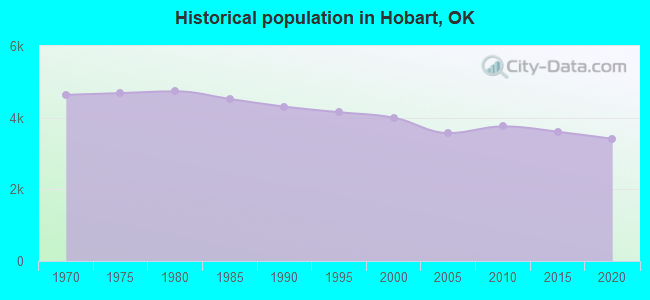
Population in 2022: 3,342 (96% urban, 4% rural). Population change since 2000: -16.4%Males: 1,556 Females: 1,786
March 2022 cost of living index in Hobart: 76.3 (low, U.S. average is 100) Percentage of residents living in poverty in 2022: 35.4%for White Non-Hispanic residents , 43.9% for Black residents , 55.6% for Hispanic or Latino residents , 4.2% for two or more races residents )Business Search - 14 Million verified businesses
Data:
Median household income ($)
Median household income (% change since 2000)
Household income diversity
Ratio of average income to average house value (%)
Ratio of average income to average rent
Median household income ($) - White
Median household income ($) - Black or African American
Median household income ($) - Asian
Median household income ($) - Hispanic or Latino
Median household income ($) - American Indian and Alaska Native
Median household income ($) - Multirace
Median household income ($) - Other Race
Median household income for houses/condos with a mortgage ($)
Median household income for apartments without a mortgage ($)
Races - White alone (%)
Races - White alone (% change since 2000)
Races - Black alone (%)
Races - Black alone (% change since 2000)
Races - American Indian alone (%)
Races - American Indian alone (% change since 2000)
Races - Asian alone (%)
Races - Asian alone (% change since 2000)
Races - Hispanic (%)
Races - Hispanic (% change since 2000)
Races - Native Hawaiian and Other Pacific Islander alone (%)
Races - Native Hawaiian and Other Pacific Islander alone (% change since 2000)
Races - Two or more races (%)
Races - Two or more races (% change since 2000)
Races - Other race alone (%)
Races - Other race alone (% change since 2000)
Racial diversity
Unemployment (%)
Unemployment (% change since 2000)
Unemployment (%) - White
Unemployment (%) - Black or African American
Unemployment (%) - Asian
Unemployment (%) - Hispanic or Latino
Unemployment (%) - American Indian and Alaska Native
Unemployment (%) - Multirace
Unemployment (%) - Other Race
Population density (people per square mile)
Population - Males (%)
Population - Females (%)
Population - Males (%) - White
Population - Males (%) - Black or African American
Population - Males (%) - Asian
Population - Males (%) - Hispanic or Latino
Population - Males (%) - American Indian and Alaska Native
Population - Males (%) - Multirace
Population - Males (%) - Other Race
Population - Females (%) - White
Population - Females (%) - Black or African American
Population - Females (%) - Asian
Population - Females (%) - Hispanic or Latino
Population - Females (%) - American Indian and Alaska Native
Population - Females (%) - Multirace
Population - Females (%) - Other Race
Coronavirus confirmed cases (Jun 16, 2024)
Deaths caused by coronavirus (Jun 16, 2024)
Coronavirus confirmed cases (per 100k population) (Jun 16, 2024)
Deaths caused by coronavirus (per 100k population) (Jun 16, 2024)
Daily increase in number of cases (Jun 16, 2024)
Weekly increase in number of cases (Jun 16, 2024)
Cases doubled (in days) (Jun 16, 2024)
Hospitalized patients (Apr 18, 2022)
Negative test results (Apr 18, 2022)
Total test results (Apr 18, 2022)
COVID Vaccine doses distributed (per 100k population) (Sep 19, 2023)
COVID Vaccine doses administered (per 100k population) (Sep 19, 2023)
COVID Vaccine doses distributed (Sep 19, 2023)
COVID Vaccine doses administered (Sep 19, 2023)
Likely homosexual households (%)
Likely homosexual households (% change since 2000)
Likely homosexual households - Lesbian couples (%)
Likely homosexual households - Lesbian couples (% change since 2000)
Likely homosexual households - Gay men (%)
Likely homosexual households - Gay men (% change since 2000)
Cost of living index
Median gross rent ($)
Median contract rent ($)
Median monthly housing costs ($)
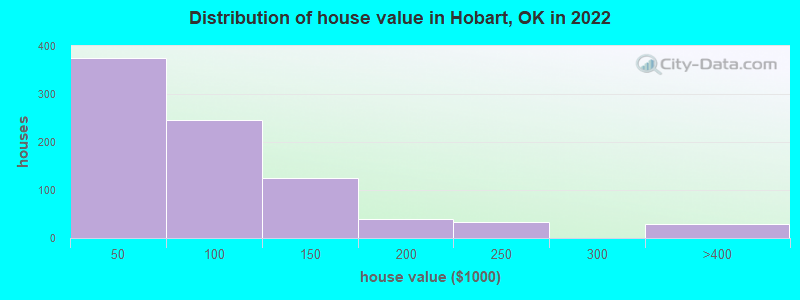
Median house or condo value ($)
Median house or condo value ($ change since 2000)
Mean house or condo value by units in structure - 1, detached ($)
Mean house or condo value by units in structure - 1, attached ($)
Mean house or condo value by units in structure - 2 ($)
Mean house or condo value by units in structure by units in structure - 3 or 4 ($)
Mean house or condo value by units in structure - 5 or more ($)
Mean house or condo value by units in structure - Boat, RV, van, etc. ($)
Mean house or condo value by units in structure - Mobile home ($)
Median house or condo value ($) - White
Median house or condo value ($) - Black or African American
Median house or condo value ($) - Asian
Median house or condo value ($) - Hispanic or Latino
Median house or condo value ($) - American Indian and Alaska Native
Median house or condo value ($) - Multirace
Median house or condo value ($) - Other Race
Median resident age
Resident age diversity
Median resident age - Males
Median resident age - Females
Median resident age - White
Median resident age - Black or African American
Median resident age - Asian
Median resident age - Hispanic or Latino
Median resident age - American Indian and Alaska Native
Median resident age - Multirace
Median resident age - Other Race
Median resident age - Males - White
Median resident age - Males - Black or African American
Median resident age - Males - Asian
Median resident age - Males - Hispanic or Latino
Median resident age - Males - American Indian and Alaska Native
Median resident age - Males - Multirace
Median resident age - Males - Other Race
Median resident age - Females - White
Median resident age - Females - Black or African American
Median resident age - Females - Asian
Median resident age - Females - Hispanic or Latino
Median resident age - Females - American Indian and Alaska Native
Median resident age - Females - Multirace
Median resident age - Females - Other Race
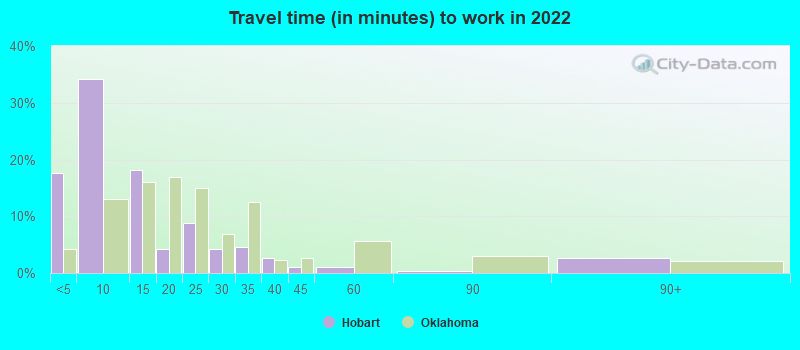
Commute - mean travel time to work (minutes)
Travel time to work - Less than 5 minutes (%)
Travel time to work - Less than 5 minutes (% change since 2000)
Travel time to work - 5 to 9 minutes (%)
Travel time to work - 5 to 9 minutes (% change since 2000)
Travel time to work - 10 to 19 minutes (%)
Travel time to work - 10 to 19 minutes (% change since 2000)
Travel time to work - 20 to 29 minutes (%)
Travel time to work - 20 to 29 minutes (% change since 2000)
Travel time to work - 30 to 39 minutes (%)
Travel time to work - 30 to 39 minutes (% change since 2000)
Travel time to work - 40 to 59 minutes (%)
Travel time to work - 40 to 59 minutes (% change since 2000)
Travel time to work - 60 to 89 minutes (%)
Travel time to work - 60 to 89 minutes (% change since 2000)
Travel time to work - 90 or more minutes (%)
Travel time to work - 90 or more minutes (% change since 2000)
Marital status - Never married (%)
Marital status - Now married (%)
Marital status - Separated (%)
Marital status - Widowed (%)
Marital status - Divorced (%)
Median family income ($)
Median family income (% change since 2000)
Median non-family income ($)
Median non-family income (% change since 2000)
Median per capita income ($)
Median per capita income (% change since 2000)
Median family income ($) - White
Median family income ($) - Black or African American
Median family income ($) - Asian
Median family income ($) - Hispanic or Latino
Median family income ($) - American Indian and Alaska Native
Median family income ($) - Multirace
Median family income ($) - Other Race
Median year house/condo built
Median year apartment built
Year house built - Built 2005 or later (%)
Year house built - Built 2000 to 2004 (%)
Year house built - Built 1990 to 1999 (%)
Year house built - Built 1980 to 1989 (%)
Year house built - Built 1970 to 1979 (%)
Year house built - Built 1960 to 1969 (%)
Year house built - Built 1950 to 1959 (%)
Year house built - Built 1940 to 1949 (%)
Year house built - Built 1939 or earlier (%)
Average household size
Household density (households per square mile)
Average household size - White
Average household size - Black or African American
Average household size - Asian
Average household size - Hispanic or Latino
Average household size - American Indian and Alaska Native
Average household size - Multirace
Average household size - Other Race
Occupied housing units (%)
Vacant housing units (%)
Owner occupied housing units (%)
Renter occupied housing units (%)
Vacancy status - For rent (%)
Vacancy status - For sale only (%)
Vacancy status - Rented or sold, not occupied (%)
Vacancy status - For seasonal, recreational, or occasional use (%)
Vacancy status - For migrant workers (%)
Vacancy status - Other vacant (%)
Residents with income below the poverty level (%)
Residents with income below 50% of the poverty level (%)
Children below poverty level (%)
Poor families by family type - Married-couple family (%)
Poor families by family type - Male, no wife present (%)
Poor families by family type - Female, no husband present (%)
Poverty status for native-born residents (%)
Poverty status for foreign-born residents (%)
Poverty among high school graduates not in families (%)
Poverty among people who did not graduate high school not in families (%)
Residents with income below the poverty level (%) - White
Residents with income below the poverty level (%) - Black or African American
Residents with income below the poverty level (%) - Asian
Residents with income below the poverty level (%) - Hispanic or Latino
Residents with income below the poverty level (%) - American Indian and Alaska Native
Residents with income below the poverty level (%) - Multirace
Residents with income below the poverty level (%) - Other Race
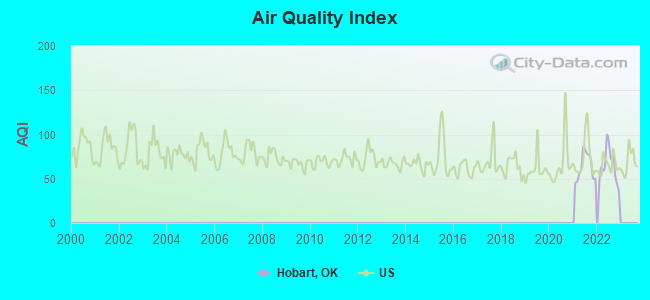
Air pollution - Air Quality Index (AQI)
Air pollution - CO
Air pollution - NO2
Air pollution - SO2
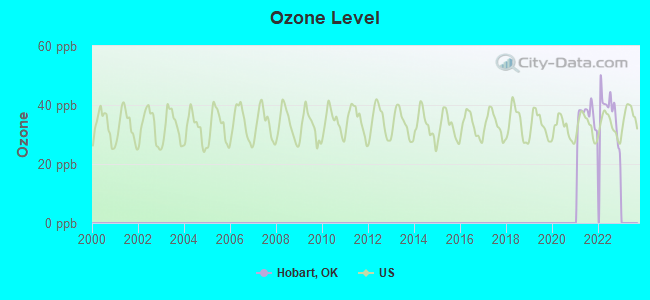
Air pollution - Ozone
Air pollution - PM10
Air pollution - PM25
Air pollution - Pb
Crime - Murders per 100,000 population
Crime - Rapes per 100,000 population
Crime - Robberies per 100,000 population
Crime - Assaults per 100,000 population
Crime - Burglaries per 100,000 population
Crime - Thefts per 100,000 population
Crime - Auto thefts per 100,000 population
Crime - Arson per 100,000 population
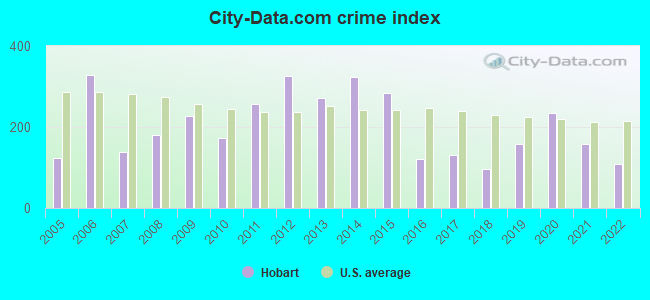
Crime - City-data.com crime index
Crime - Violent crime index
Crime - Property crime index
Crime - Murders per 100,000 population (5 year average)
Crime - Rapes per 100,000 population (5 year average)
Crime - Robberies per 100,000 population (5 year average)
Crime - Assaults per 100,000 population (5 year average)
Crime - Burglaries per 100,000 population (5 year average)
Crime - Thefts per 100,000 population (5 year average)
Crime - Auto thefts per 100,000 population (5 year average)
Crime - Arson per 100,000 population (5 year average)
Crime - City-data.com crime index (5 year average)
Crime - Violent crime index (5 year average)
Crime - Property crime index (5 year average)
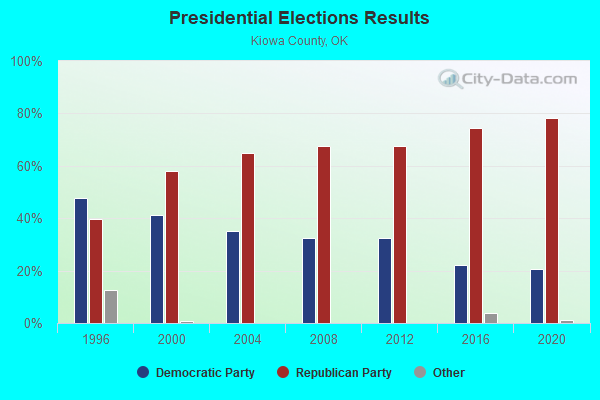
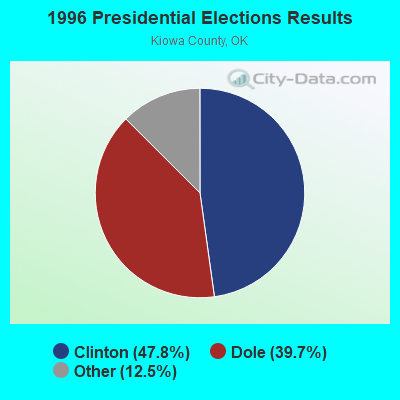
1996 Presidential Elections Results (%) - Democratic Party (Clinton)
1996 Presidential Elections Results (%) - Republican Party (Dole)
1996 Presidential Elections Results (%) - Other
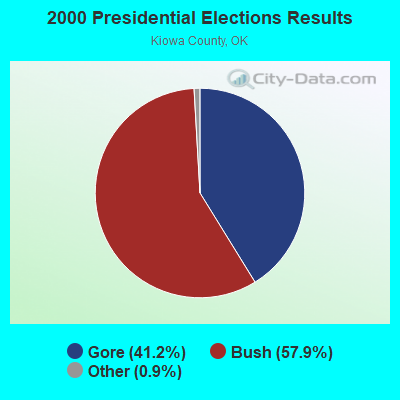
2000 Presidential Elections Results (%) - Democratic Party (Gore)
2000 Presidential Elections Results (%) - Republican Party (Bush)
2000 Presidential Elections Results (%) - Other
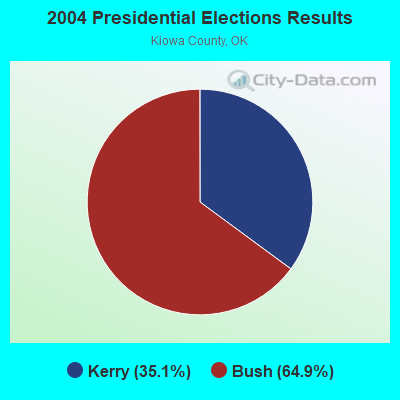
2004 Presidential Elections Results (%) - Democratic Party (Kerry)
2004 Presidential Elections Results (%) - Republican Party (Bush)
2004 Presidential Elections Results (%) - Other
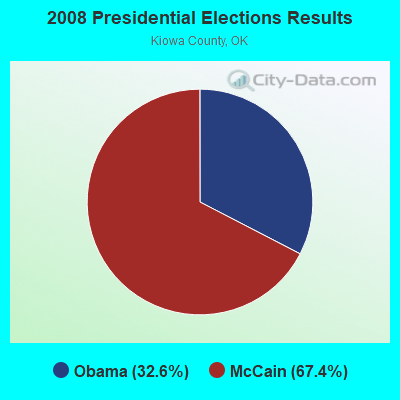
2008 Presidential Elections Results (%) - Democratic Party (Obama)
2008 Presidential Elections Results (%) - Republican Party (McCain)
2008 Presidential Elections Results (%) - Other
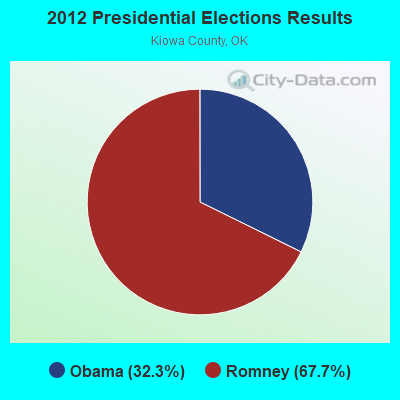
2012 Presidential Elections Results (%) - Democratic Party (Obama)
2012 Presidential Elections Results (%) - Republican Party (Romney)
2012 Presidential Elections Results (%) - Other
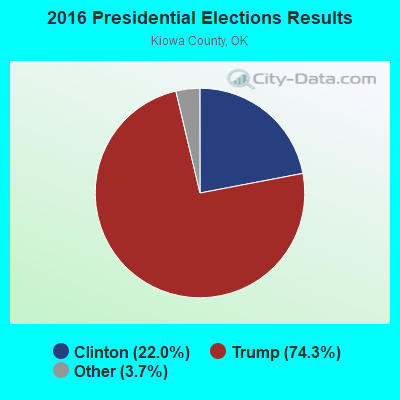
2016 Presidential Elections Results (%) - Democratic Party (Clinton)
2016 Presidential Elections Results (%) - Republican Party (Trump)
2016 Presidential Elections Results (%) - Other
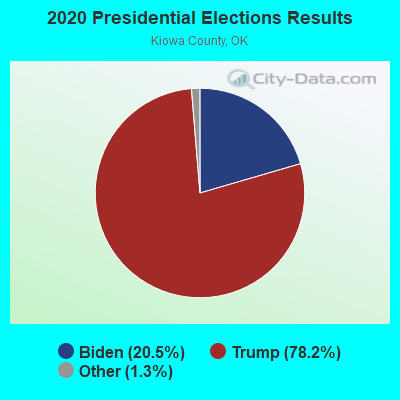
2020 Presidential Elections Results (%) - Democratic Party (Biden)
2020 Presidential Elections Results (%) - Republican Party (Trump)
2020 Presidential Elections Results (%) - Other
Ancestries Reported - Arab (%)
Ancestries Reported - Czech (%)
Ancestries Reported - Danish (%)
Ancestries Reported - Dutch (%)
Ancestries Reported - English (%)
Ancestries Reported - French (%)
Ancestries Reported - French Canadian (%)
Ancestries Reported - German (%)
Ancestries Reported - Greek (%)
Ancestries Reported - Hungarian (%)
Ancestries Reported - Irish (%)
Ancestries Reported - Italian (%)
Ancestries Reported - Lithuanian (%)
Ancestries Reported - Norwegian (%)
Ancestries Reported - Polish (%)
Ancestries Reported - Portuguese (%)
Ancestries Reported - Russian (%)
Ancestries Reported - Scotch-Irish (%)
Ancestries Reported - Scottish (%)
Ancestries Reported - Slovak (%)
Ancestries Reported - Subsaharan African (%)
Ancestries Reported - Swedish (%)
Ancestries Reported - Swiss (%)
Ancestries Reported - Ukrainian (%)
Ancestries Reported - United States (%)
Ancestries Reported - Welsh (%)
Ancestries Reported - West Indian (%)
Ancestries Reported - Other (%)
Educational Attainment - No schooling completed (%)
Educational Attainment - Less than high school (%)
Educational Attainment - High school or equivalent (%)
Educational Attainment - Less than 1 year of college (%)
Educational Attainment - 1 or more years of college (%)
Educational Attainment - Associate degree (%)
Educational Attainment - Bachelor's degree (%)
Educational Attainment - Master's degree (%)
Educational Attainment - Professional school degree (%)
Educational Attainment - Doctorate degree (%)
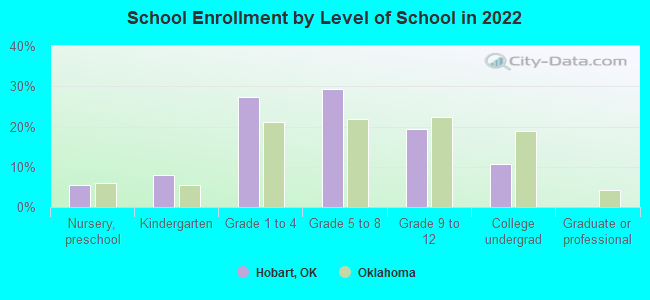
School Enrollment - Nursery, preschool (%)
School Enrollment - Kindergarten (%)
School Enrollment - Grade 1 to 4 (%)
School Enrollment - Grade 5 to 8 (%)
School Enrollment - Grade 9 to 12 (%)
School Enrollment - College undergrad (%)
School Enrollment - Graduate or professional (%)
School Enrollment - Not enrolled in school (%)
School enrollment - Public schools (%)
School enrollment - Private schools (%)
School enrollment - Not enrolled (%)
Median number of rooms in houses and condos
Median number of rooms in apartments
Housing units lacking complete plumbing facilities (%)
Housing units lacking complete kitchen facilities (%)
Density of houses
Urban houses (%)
Rural houses (%)
Households with people 60 years and over (%)
Households with people 65 years and over (%)
Households with people 75 years and over (%)
Households with one or more nonrelatives (%)
Households with no nonrelatives (%)
Population in households (%)
Family households (%)
Nonfamily households (%)
Population in families (%)
Family households with own children (%)
Median number of bedrooms in owner occupied houses
Mean number of bedrooms in owner occupied houses
Median number of bedrooms in renter occupied houses
Mean number of bedrooms in renter occupied houses
Median number of vehichles in owner occupied houses
Mean number of vehichles in owner occupied houses
Median number of vehichles in renter occupied houses
Mean number of vehichles in renter occupied houses
Mortgage status - with mortgage (%)
Mortgage status - with second mortgage (%)
Mortgage status - with home equity loan (%)
Mortgage status - with both second mortgage and home equity loan (%)
Mortgage status - without a mortgage (%)
Average family size
Average family size - White
Average family size - Black or African American
Average family size - Asian
Average family size - Hispanic or Latino
Average family size - American Indian and Alaska Native
Average family size - Multirace
Average family size - Other Race
Geographical mobility - Same house 1 year ago (%)
Geographical mobility - Moved within same county (%)
Geographical mobility - Moved from different county within same state (%)
Geographical mobility - Moved from different state (%)
Geographical mobility - Moved from abroad (%)
Place of birth - Born in state of residence (%)
Place of birth - Born in other state (%)
Place of birth - Native, outside of US (%)
Place of birth - Foreign born (%)
Housing units in structures - 1, detached (%)
Housing units in structures - 1, attached (%)
Housing units in structures - 2 (%)
Housing units in structures - 3 or 4 (%)
Housing units in structures - 5 to 9 (%)
Housing units in structures - 10 to 19 (%)
Housing units in structures - 20 to 49 (%)
Housing units in structures - 50 or more (%)
Housing units in structures - Mobile home (%)
Housing units in structures - Boat, RV, van, etc. (%)
House/condo owner moved in on average (years ago)
Renter moved in on average (years ago)
Year householder moved into unit - Moved in 1999 to March 2000 (%)
Year householder moved into unit - Moved in 1995 to 1998 (%)
Year householder moved into unit - Moved in 1990 to 1994 (%)
Year householder moved into unit - Moved in 1980 to 1989 (%)
Year householder moved into unit - Moved in 1970 to 1979 (%)
Year householder moved into unit - Moved in 1969 or earlier (%)
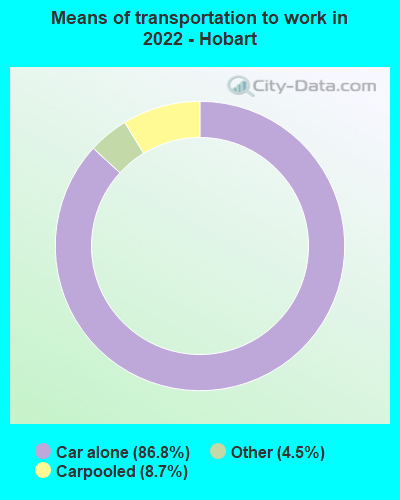
Means of transportation to work - Drove car alone (%)
Means of transportation to work - Carpooled (%)
Means of transportation to work - Public transportation (%)
Means of transportation to work - Bus or trolley bus (%)
Means of transportation to work - Streetcar or trolley car (%)
Means of transportation to work - Subway or elevated (%)
Means of transportation to work - Railroad (%)
Means of transportation to work - Ferryboat (%)
Means of transportation to work - Taxicab (%)
Means of transportation to work - Motorcycle (%)
Means of transportation to work - Bicycle (%)
Means of transportation to work - Walked (%)
Means of transportation to work - Other means (%)
Working at home (%)
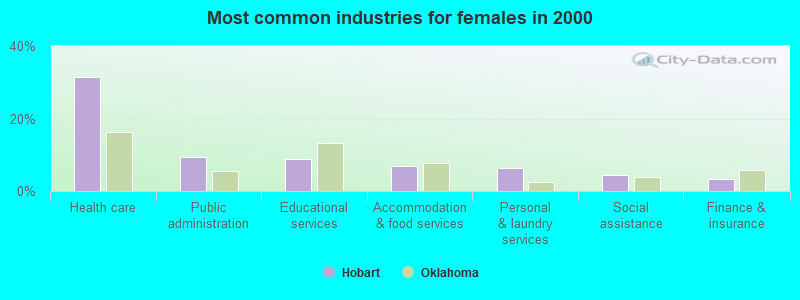
Industry diversity
Most Common Industries - Agriculture, forestry, fishing and hunting, and mining (%)
Most Common Industries - Agriculture, forestry, fishing and hunting (%)
Most Common Industries - Mining, quarrying, and oil and gas extraction (%)
Most Common Industries - Construction (%)
Most Common Industries - Manufacturing (%)
Most Common Industries - Wholesale trade (%)
Most Common Industries - Retail trade (%)
Most Common Industries - Transportation and warehousing, and utilities (%)
Most Common Industries - Transportation and warehousing (%)
Most Common Industries - Utilities (%)
Most Common Industries - Information (%)
Most Common Industries - Finance and insurance, and real estate and rental and leasing (%)
Most Common Industries - Finance and insurance (%)
Most Common Industries - Real estate and rental and leasing (%)
Most Common Industries - Professional, scientific, and management, and administrative and waste management services (%)
Most Common Industries - Professional, scientific, and technical services (%)
Most Common Industries - Management of companies and enterprises (%)
Most Common Industries - Administrative and support and waste management services (%)
Most Common Industries - Educational services, and health care and social assistance (%)
Most Common Industries - Educational services (%)
Most Common Industries - Health care and social assistance (%)
Most Common Industries - Arts, entertainment, and recreation, and accommodation and food services (%)
Most Common Industries - Arts, entertainment, and recreation (%)
Most Common Industries - Accommodation and food services (%)
Most Common Industries - Other services, except public administration (%)
Most Common Industries - Public administration (%)
Occupation diversity
Most Common Occupations - Management, business, science, and arts occupations (%)
Most Common Occupations - Management, business, and financial occupations (%)
Most Common Occupations - Management occupations (%)
Most Common Occupations - Business and financial operations occupations (%)
Most Common Occupations - Computer, engineering, and science occupations (%)
Most Common Occupations - Computer and mathematical occupations (%)
Most Common Occupations - Architecture and engineering occupations (%)
Most Common Occupations - Life, physical, and social science occupations (%)
Most Common Occupations - Education, legal, community service, arts, and media occupations (%)
Most Common Occupations - Community and social service occupations (%)
Most Common Occupations - Legal occupations (%)
Most Common Occupations - Education, training, and library occupations (%)
Most Common Occupations - Arts, design, entertainment, sports, and media occupations (%)
Most Common Occupations - Healthcare practitioners and technical occupations (%)
Most Common Occupations - Health diagnosing and treating practitioners and other technical occupations (%)
Most Common Occupations - Health technologists and technicians (%)
Most Common Occupations - Service occupations (%)
Most Common Occupations - Healthcare support occupations (%)
Most Common Occupations - Protective service occupations (%)
Most Common Occupations - Fire fighting and prevention, and other protective service workers including supervisors (%)
Most Common Occupations - Law enforcement workers including supervisors (%)
Most Common Occupations - Food preparation and serving related occupations (%)
Most Common Occupations - Building and grounds cleaning and maintenance occupations (%)
Most Common Occupations - Personal care and service occupations (%)
Most Common Occupations - Sales and office occupations (%)
Most Common Occupations - Sales and related occupations (%)
Most Common Occupations - Office and administrative support occupations (%)
Most Common Occupations - Natural resources, construction, and maintenance occupations (%)
Most Common Occupations - Farming, fishing, and forestry occupations (%)
Most Common Occupations - Construction and extraction occupations (%)
Most Common Occupations - Installation, maintenance, and repair occupations (%)
Most Common Occupations - Production, transportation, and material moving occupations (%)
Most Common Occupations - Production occupations (%)
Most Common Occupations - Transportation occupations (%)
Most Common Occupations - Material moving occupations (%)
People in Group quarters - Institutionalized population (%)
People in Group quarters - Correctional institutions (%)
People in Group quarters - Federal prisons and detention centers (%)
People in Group quarters - Halfway houses (%)
People in Group quarters - Local jails and other confinement facilities (including police lockups) (%)
People in Group quarters - Military disciplinary barracks (%)
People in Group quarters - State prisons (%)
People in Group quarters - Other types of correctional institutions (%)
People in Group quarters - Nursing homes (%)
People in Group quarters - Hospitals/wards, hospices, and schools for the handicapped (%)
People in Group quarters - Hospitals/wards and hospices for chronically ill (%)
People in Group quarters - Hospices or homes for chronically ill (%)
People in Group quarters - Military hospitals or wards for chronically ill (%)
People in Group quarters - Other hospitals or wards for chronically ill (%)
People in Group quarters - Hospitals or wards for drug/alcohol abuse (%)
People in Group quarters - Mental (Psychiatric) hospitals or wards (%)
People in Group quarters - Schools, hospitals, or wards for the mentally retarded (%)
People in Group quarters - Schools, hospitals, or wards for the physically handicapped (%)
People in Group quarters - Institutions for the deaf (%)
People in Group quarters - Institutions for the blind (%)
People in Group quarters - Orthopedic wards and institutions for the physically handicapped (%)
People in Group quarters - Wards in general hospitals for patients who have no usual home elsewhere (%)
People in Group quarters - Wards in military hospitals for patients who have no usual home elsewhere (%)
People in Group quarters - Juvenile institutions (%)
People in Group quarters - Long-term care (%)
People in Group quarters - Homes for abused, dependent, and neglected children (%)
People in Group quarters - Residential treatment centers for emotionally disturbed children (%)
People in Group quarters - Training schools for juvenile delinquents (%)
People in Group quarters - Short-term care, detention or diagnostic centers for delinquent children (%)
People in Group quarters - Type of juvenile institution unknown (%)
People in Group quarters - Noninstitutionalized population (%)
People in Group quarters - College dormitories (includes college quarters off campus) (%)
People in Group quarters - Military quarters (%)
People in Group quarters - On base (%)
People in Group quarters - Barracks, unaccompanied personnel housing (UPH), (Enlisted/Officer), ;and similar group living quarters for military personnel (%)
People in Group quarters - Transient quarters for temporary residents (%)
People in Group quarters - Military ships (%)
People in Group quarters - Group homes (%)
People in Group quarters - Homes or halfway houses for drug/alcohol abuse (%)
People in Group quarters - Homes for the mentally ill (%)
People in Group quarters - Homes for the mentally retarded (%)
People in Group quarters - Homes for the physically handicapped (%)
People in Group quarters - Other group homes (%)
People in Group quarters - Religious group quarters (%)
People in Group quarters - Dormitories (%)
People in Group quarters - Agriculture workers' dormitories on farms (%)
People in Group quarters - Job Corps and vocational training facilities (%)
People in Group quarters - Other workers' dormitories (%)
People in Group quarters - Crews of maritime vessels (%)
People in Group quarters - Other nonhousehold living situations (%)
People in Group quarters - Other noninstitutional group quarters (%)
Residents speaking English at home (%)
Residents speaking English at home - Born in the United States (%)
Residents speaking English at home - Native, born elsewhere (%)
Residents speaking English at home - Foreign born (%)
Residents speaking Spanish at home (%)
Residents speaking Spanish at home - Born in the United States (%)
Residents speaking Spanish at home - Native, born elsewhere (%)
Residents speaking Spanish at home - Foreign born (%)
Residents speaking other language at home (%)
Residents speaking other language at home - Born in the United States (%)
Residents speaking other language at home - Native, born elsewhere (%)
Residents speaking other language at home - Foreign born (%)
Class of Workers - Employee of private company (%)
Class of Workers - Self-employed in own incorporated business (%)
Class of Workers - Private not-for-profit wage and salary workers (%)
Class of Workers - Local government workers (%)
Class of Workers - State government workers (%)
Class of Workers - Federal government workers (%)
Class of Workers - Self-employed workers in own not incorporated business and Unpaid family workers (%)
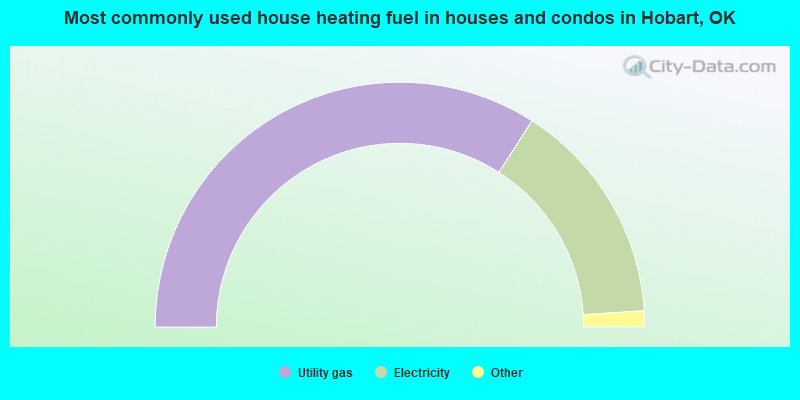
House heating fuel used in houses and condos - Utility gas (%)
House heating fuel used in houses and condos - Bottled, tank, or LP gas (%)
House heating fuel used in houses and condos - Electricity (%)
House heating fuel used in houses and condos - Fuel oil, kerosene, etc. (%)
House heating fuel used in houses and condos - Coal or coke (%)
House heating fuel used in houses and condos - Wood (%)
House heating fuel used in houses and condos - Solar energy (%)
House heating fuel used in houses and condos - Other fuel (%)
House heating fuel used in houses and condos - No fuel used (%)
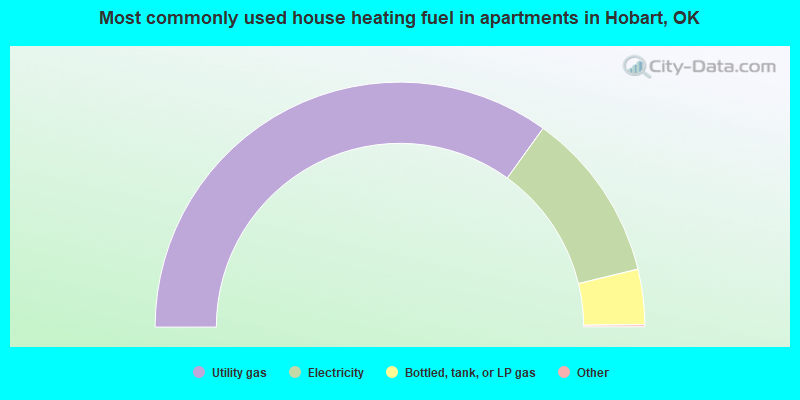
House heating fuel used in apartments - Utility gas (%)
House heating fuel used in apartments - Bottled, tank, or LP gas (%)
House heating fuel used in apartments - Electricity (%)
House heating fuel used in apartments - Fuel oil, kerosene, etc. (%)
House heating fuel used in apartments - Coal or coke (%)
House heating fuel used in apartments - Wood (%)
House heating fuel used in apartments - Solar energy (%)
House heating fuel used in apartments - Other fuel (%)
House heating fuel used in apartments - No fuel used (%)
Armed forces status - In Armed Forces (%)
Armed forces status - Civilian (%)
Armed forces status - Civilian - Veteran (%)
Armed forces status - Civilian - Nonveteran (%)
Fatal accidents locations in years 2005-2021
Fatal accidents locations in 2005
Fatal accidents locations in 2006
Fatal accidents locations in 2007
Fatal accidents locations in 2008
Fatal accidents locations in 2009
Fatal accidents locations in 2010
Fatal accidents locations in 2011
Fatal accidents locations in 2012
Fatal accidents locations in 2013
Fatal accidents locations in 2014
Fatal accidents locations in 2015
Fatal accidents locations in 2016
Fatal accidents locations in 2017
Fatal accidents locations in 2018
Fatal accidents locations in 2019
Fatal accidents locations in 2020
Fatal accidents locations in 2021
Alcohol use - People drinking some alcohol every month (%)
Alcohol use - People not drinking at all (%)
Alcohol use - Average days/month drinking alcohol
Alcohol use - Average drinks/week
Alcohol use - Average days/year people drink much
Audiometry - Average condition of hearing (%)
Audiometry - People that can hear a whisper from across a quiet room (%)
Audiometry - People that can hear normal voice from across a quiet room (%)
Audiometry - Ears ringing, roaring, buzzing (%)
Audiometry - Had a job exposure to loud noise (%)
Audiometry - Had off-work exposure to loud noise (%)
Blood Pressure & Cholesterol - Has high blood pressure (%)
Blood Pressure & Cholesterol - Checking blood pressure at home (%)
Blood Pressure & Cholesterol - Frequently checking blood cholesterol (%)
Blood Pressure & Cholesterol - Has high cholesterol level (%)
Consumer Behavior - Money monthly spent on food at supermarket/grocery store
Consumer Behavior - Money monthly spent on food at other stores
Consumer Behavior - Money monthly spent on eating out
Consumer Behavior - Money monthly spent on carryout/delivered foods
Consumer Behavior - Income spent on food at supermarket/grocery store (%)
Consumer Behavior - Income spent on food at other stores (%)
Consumer Behavior - Income spent on eating out (%)
Consumer Behavior - Income spent on carryout/delivered foods (%)
Current Health Status - General health condition (%)
Current Health Status - Blood donors (%)
Current Health Status - Has blood ever tested for HIV virus (%)
Current Health Status - Left-handed people (%)
Dermatology - People using sunscreen (%)
Diabetes - Diabetics (%)
Diabetes - Had a blood test for high blood sugar (%)
Diabetes - People taking insulin (%)
Diet Behavior & Nutrition - Diet health (%)
Diet Behavior & Nutrition - Milk product consumption (# of products/month)
Diet Behavior & Nutrition - Meals not home prepared (#/week)
Diet Behavior & Nutrition - Meals from fast food or pizza place (#/week)
Diet Behavior & Nutrition - Ready-to-eat foods (#/month)
Diet Behavior & Nutrition - Frozen meals/pizza (#/month)
Drug Use - People that ever used marijuana or hashish (%)
Drug Use - Ever used hard drugs (%)
Drug Use - Ever used any form of cocaine (%)
Drug Use - Ever used heroin (%)
Drug Use - Ever used methamphetamine (%)
Health Insurance - People covered by health insurance (%)
Kidney Conditions-Urology - Avg. # of times urinating at night
Medical Conditions - People with asthma (%)
Medical Conditions - People with anemia (%)
Medical Conditions - People with psoriasis (%)
Medical Conditions - People with overweight (%)
Medical Conditions - Elderly people having difficulties in thinking or remembering (%)
Medical Conditions - People who ever received blood transfusion (%)
Medical Conditions - People having trouble seeing even with glass/contacts (%)
Medical Conditions - People with arthritis (%)
Medical Conditions - People with gout (%)
Medical Conditions - People with congestive heart failure (%)
Medical Conditions - People with coronary heart disease (%)
Medical Conditions - People with angina pectoris (%)
Medical Conditions - People who ever had heart attack (%)
Medical Conditions - People who ever had stroke (%)
Medical Conditions - People with emphysema (%)
Medical Conditions - People with thyroid problem (%)
Medical Conditions - People with chronic bronchitis (%)
Medical Conditions - People with any liver condition (%)
Medical Conditions - People who ever had cancer or malignancy (%)
Mental Health - People who have little interest in doing things (%)
Mental Health - People feeling down, depressed, or hopeless (%)
Mental Health - People who have trouble sleeping or sleeping too much (%)
Mental Health - People feeling tired or having little energy (%)
Mental Health - People with poor appetite or overeating (%)
Mental Health - People feeling bad about themself (%)
Mental Health - People who have trouble concentrating on things (%)
Mental Health - People moving or speaking slowly or too fast (%)
Mental Health - People having thoughts they would be better off dead (%)
Oral Health - Average years since last visit a dentist
Oral Health - People embarrassed because of mouth (%)
Oral Health - People with gum disease (%)
Oral Health - General health of teeth and gums (%)
Oral Health - Average days a week using dental floss/device
Oral Health - Average days a week using mouthwash for dental problem
Oral Health - Average number of teeth
Pesticide Use - Households using pesticides to control insects (%)
Pesticide Use - Households using pesticides to kill weeds (%)
Physical Activity - People doing vigorous-intensity work activities (%)
Physical Activity - People doing moderate-intensity work activities (%)
Physical Activity - People walking or bicycling (%)
Physical Activity - People doing vigorous-intensity recreational activities (%)
Physical Activity - People doing moderate-intensity recreational activities (%)
Physical Activity - Average hours a day doing sedentary activities
Physical Activity - Average hours a day watching TV or videos
Physical Activity - Average hours a day using computer
Physical Functioning - People having limitations keeping them from working (%)
Physical Functioning - People limited in amount of work they can do (%)
Physical Functioning - People that need special equipment to walk (%)
Physical Functioning - People experiencing confusion/memory problems (%)
Physical Functioning - People requiring special healthcare equipment (%)
Prescription Medications - Average number of prescription medicines taking
Preventive Aspirin Use - Adults 40+ taking low-dose aspirin (%)
Reproductive Health - Vaginal deliveries (%)
Reproductive Health - Cesarean deliveries (%)
Reproductive Health - Deliveries resulted in a live birth (%)
Reproductive Health - Pregnancies resulted in a delivery (%)
Reproductive Health - Women breastfeeding newborns (%)
Reproductive Health - Women that had a hysterectomy (%)
Reproductive Health - Women that had both ovaries removed (%)
Reproductive Health - Women that have ever taken birth control pills (%)
Reproductive Health - Women taking birth control pills (%)
Reproductive Health - Women that have ever used Depo-Provera or injectables (%)
Reproductive Health - Women that have ever used female hormones (%)
Sexual Behavior - People 18+ that ever had sex (vaginal, anal, or oral) (%)
Sexual Behavior - Males 18+ that ever had vaginal sex with a woman (%)
Sexual Behavior - Males 18+ that ever performed oral sex on a woman (%)
Sexual Behavior - Males 18+ that ever had anal sex with a woman (%)
Sexual Behavior - Males 18+ that ever had any sex with a man (%)
Sexual Behavior - Females 18+ that ever had vaginal sex with a man (%)
Sexual Behavior - Females 18+ that ever performed oral sex on a man (%)
Sexual Behavior - Females 18+ that ever had anal sex with a man (%)
Sexual Behavior - Females 18+ that ever had any kind of sex with a woman (%)
Sexual Behavior - Average age people first had sex
Sexual Behavior - Average number of female sex partners in lifetime (males 18+)
Sexual Behavior - Average number of female vaginal sex partners in lifetime (males 18+)
Sexual Behavior - Average age people first performed oral sex on a woman (18+)
Sexual Behavior - Average number of woman performed oral sex on in lifetime (18+)
Sexual Behavior - Average number of male sex partners in lifetime (males 18+)
Sexual Behavior - Average number of male anal sex partners in lifetime (males 18+)
Sexual Behavior - Average age people first performed oral sex on a man (18+)
Sexual Behavior - Average number of male oral sex partners in lifetime (18+)
Sexual Behavior - People using protection when performing oral sex (%)
Sexual Behavior - Average number of times people have vaginal or anal sex a year
Sexual Behavior - People having sex without condom (%)
Sexual Behavior - Average number of male sex partners in lifetime (females 18+)
Sexual Behavior - Average number of male vaginal sex partners in lifetime (females 18+)
Sexual Behavior - Average number of female sex partners in lifetime (females 18+)
Sexual Behavior - Circumcised males 18+ (%)
Sleep Disorders - Average hours sleeping at night
Sleep Disorders - People that has trouble sleeping (%)
Smoking-Cigarette Use - People smoking cigarettes (%)
Taste & Smell - People 40+ having problems with smell (%)
Taste & Smell - People 40+ having problems with taste (%)
Taste & Smell - People 40+ that ever had wisdom teeth removed (%)
Taste & Smell - People 40+ that ever had tonsils teeth removed (%)
Taste & Smell - People 40+ that ever had a loss of consciousness because of a head injury (%)
Taste & Smell - People 40+ that ever had a broken nose or other serious injury to face or skull (%)
Taste & Smell - People 40+ that ever had two or more sinus infections (%)
Weight - Average height (inches)
Weight - Average weight (pounds)
Weight - Average BMI
Weight - People that are obese (%)
Weight - People that ever were obese (%)
Weight - People trying to lose weight (%)
According to our research of Oklahoma and other state lists, there were 7 registered sex offenders living in Hobart, Oklahoma as of June 16, 2024 . The ratio of all residents to sex offenders in Hobart is 530 to 1.The ratio of registered sex offenders to all residents in this city is near the state average.
Officers per 1,000 residents here:
2.06Oklahoma average:
2.27
Latest news from Hobart, OK collected exclusively by city-data.com from local newspapers, TV, and radio stations
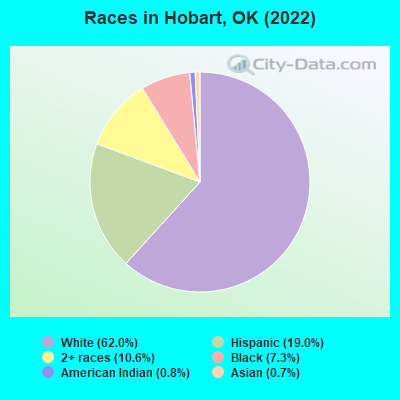
Ancestries: American (11.6%), German (7.0%), Irish (5.8%), English (5.5%), European (5.0%).
Current Local Time:
Land area: 2.71 square miles.
Population density: 1,232 people per square mile (low).
73 residents are foreign born (1.2% Latin America , 0.7% Asia ).
This city:
2.1%Oklahoma:
6.1%
Median real estate property taxes paid for housing units with mortgages in 2022: $531 (0.5%)Median real estate property taxes paid for housing units with no mortgage in 2022: $255 (0.5%)
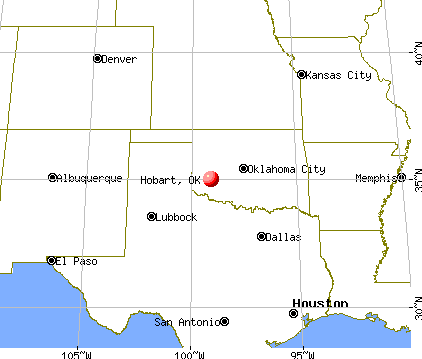
Nearest city with pop. 50,000+: Lawton, OK
Nearest city with pop. 200,000+: Oklahoma City, OK
Nearest city with pop. 1,000,000+: Dallas, TX
Nearest cities:
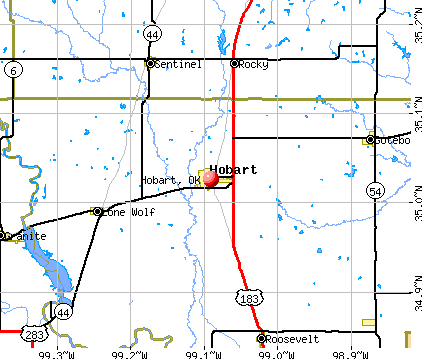
Rocky, OK (3.0 miles),
Cooperton, OK (4.1 miles),
Latitude: 35.03 N, Longitude: 99.09 W
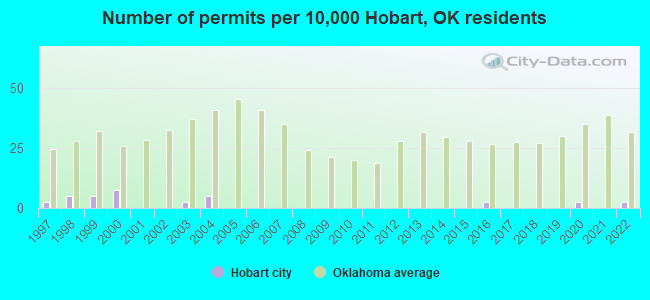
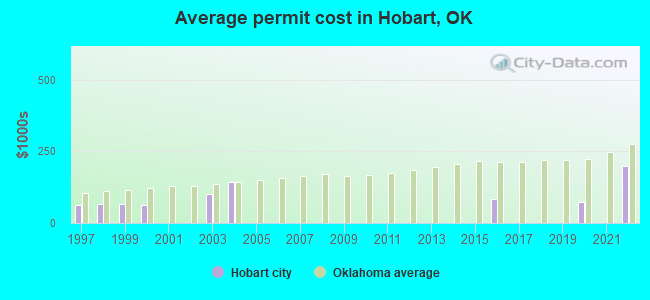
Single-family new house construction building permits:
2022: 1 building , cost: $200,0002020: 1 building , cost: $75,0002016: 1 building , cost: $85,0002004: 2 buildings , average cost: $142,0002003: 1 building , cost: $100,0002000: 3 buildings , average cost: $62,0001999: 2 buildings , average cost: $67,9001998: 2 buildings , average cost: $67,9001997: 1 building , cost: $62,300Unemployment in December 2023:
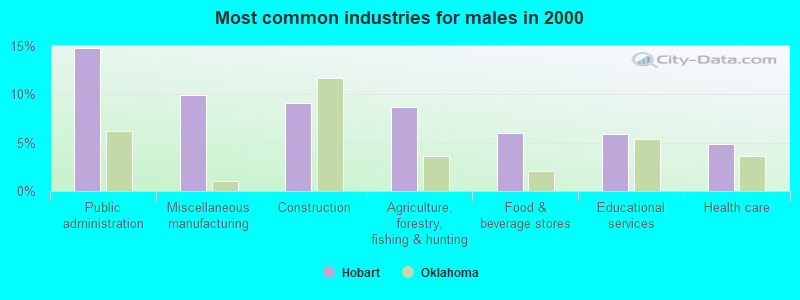
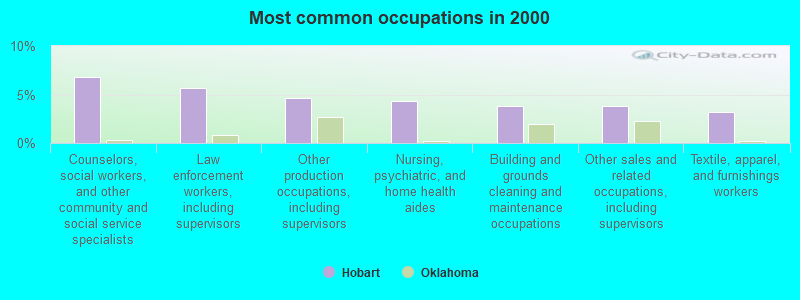
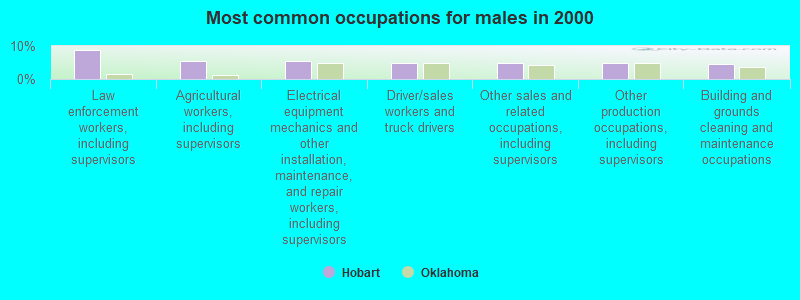
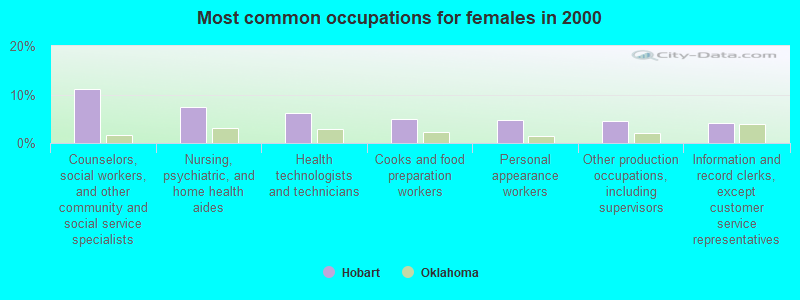
Most common occupations in Hobart, OK (%)
Both Males Females
Counselors, social workers, and other community and social service specialists (6.8%)
Law enforcement workers, including supervisors (5.7%)
Other production occupations, including supervisors (4.6%)
Nursing, psychiatric, and home health aides (4.3%)
Building and grounds cleaning and maintenance occupations (3.8%)
Other sales and related occupations, including supervisors (3.8%)
Textile, apparel, and furnishings workers (3.2%)
Law enforcement workers, including supervisors (8.8%)
Agricultural workers, including supervisors (5.4%)
Electrical equipment mechanics and other installation, maintenance, and repair workers, including supervisors (5.4%)
Driver/sales workers and truck drivers (4.8%)
Other sales and related occupations, including supervisors (4.7%)
Other production occupations, including supervisors (4.7%)
Building and grounds cleaning and maintenance occupations (4.5%)
Counselors, social workers, and other community and social service specialists (11.2%)
Nursing, psychiatric, and home health aides (7.5%)
Health technologists and technicians (6.2%)
Cooks and food preparation workers (4.9%)
Personal appearance workers (4.7%)
Other production occupations, including supervisors (4.6%)
Information and record clerks, except customer service representatives (4.2%)
Air pollution and air quality trends(lower is better)
AQI Ozone
Tornado activity:
Hobart-area historical tornado activity is near Oklahoma state average. It is 144% greater than the overall U.S. average.
On 5/25/1962, a category F4 (max. wind speeds 207-260 mph) tornado 18.0 miles away from the Hobart city center injured 9 people and caused between $50,000 and $500,000 in damages.
On 5/1/1954, a category F4 tornado 27.8 miles away from the city center injured 2 people and caused between $50,000 and $500,000 in damages.
Earthquake activity:
Hobart-area historical earthquake activity is significantly above Oklahoma state average. It is 704% greater than the overall U.S. average. On 9/3/2016 at 12:02:44, a magnitude 5.8 (5.8 MW, Depth: 3.5 mi, Class: Moderate, Intensity: VI - VII) earthquake occurred 155.2 miles away from Hobart center On 11/6/2011 at 03:53:10, a magnitude 5.7 (5.7 MW, Depth: 3.2 mi) earthquake occurred 135.9 miles away from Hobart center On 2/13/2016 at 17:07:06, a magnitude 5.1 (5.1 MW, Depth: 5.2 mi) earthquake occurred 103.5 miles away from the city center On 6/16/1978 at 11:46:54, a magnitude 5.3 (4.4 MB, 4.6 UK, 5.3 ML) earthquake occurred 168.2 miles away from the city center On 11/7/2016 at 01:44:24, a magnitude 5.0 (5.0 MW, Depth: 2.8 mi) earthquake occurred 145.1 miles away from the city center On 1/7/2016 at 04:27:57, a magnitude 4.7 (4.7 MW, Depth: 2.5 mi, Class: Light, Intensity: IV - V) earthquake occurred 103.7 miles away from the city center Magnitude types: body-wave magnitude (MB), local magnitude (ML), moment magnitude (MW) Natural disasters: The number of natural disasters in Kiowa County (30) is a lot greater than the US average (15).Major Disasters (Presidential) Declared: 22Emergencies Declared: 5Floods: 17, Storms: 14, Winter Storms: 10, Tornadoes: 8, Ice Storms: 2, Fire: 1, Hurricane: 1, Wind: 1, Other: 1 (Note: some incidents may be assigned to more than one category). Hospitals and medical centers in Hobart: KIOWA COUNTY HOSPITAL AUTHORITY (Government - Hospital District or Authority, provides emergency services, 429 WEST ELM STREET) ELKVIEW HOME HEALTH (101 SOUTH BROADWAY)
B AND K NURSING CENTER (101 SOUTH MAIN)
HOBART GOOD SAMARITAN HOME (330 NORTH RANDLETT)
HOBART LIVING CENTERS, INC (709 NORTH LOWE)
HOBART SAMARITAN CENTER (709 N LOWE)
Airports located in Hobart: Colleges/universities with over 2000 students nearest to Hobart:
Western Oklahoma State College (about 29 miles; Altus, OK ; Full-time enrollment: 2,054)
Southwestern Oklahoma State University (about 42 miles; Weatherford, OK ; FT enrollment: 4,126)
Cameron University (about 48 miles; Lawton, OK ; FT enrollment: 4,695)
Vernon College (about 62 miles; Vernon, TX ; FT enrollment: 2,216)
Midwestern State University (about 86 miles; Wichita Falls, TX ; FT enrollment: 4,901)
Mid-America Christian University (about 89 miles; Oklahoma City, OK ; FT enrollment: 2,869)
Southern Nazarene University (about 90 miles; Bethany, OK ; FT enrollment: 2,064)
Public high school in Hobart: HOBART HS Students: 248, Location: 400 N JEFFERSON STREET, Grades: 9-12)Public elementary/middle schools in Hobart: HOBART ES Students: 404, Location: 115 W IRIS, Grades: PK-5)HOBART MS Students: 181, Location: 410 N JEFFERSON STREET, Grades: 6-8)See full list of schools located in Hobart Library in Hobart: HOBART PUBLIC LIBRARY Operating income: $110,078; Location: 200 S MAIN; 26,940 books ; 425 audio materials ; 372 video materials ; 23 state licensed databases ; 23 print serial subscriptions )
Birthplace of: Boody Rogers - Cartoonist.
Kiowa County has a predicted average indoor radon screening level less than 2 pCi/L (pico curies per liter) - Low Potential Drinking water stations with addresses in Hobart and their reported violations in the past:
HOBART (Address: 111 East 3rd. Population served: 3,746, Surface water):
Past monitoring violations:
Monitoring, Routine (IDSE) - Between FEB-2009 and APR-2009, Contaminant: Total Haloacetic Acids (HAA5). Follow-up actions: Fed Violation/Reminder Notice (MAR-26-2009), St Compliance achieved (MAY-08-2014)
Monitoring, Routine (IDSE) - Between FEB-2009 and APR-2009, Contaminant: TTHM. Follow-up actions: Fed Violation/Reminder Notice (MAR-26-2009), St Compliance achieved (MAY-08-2014)
Average household size: This city:
2.4 peopleOklahoma:
2.5 people
Percentage of family households: This city:
61.5%Whole state:
66.8%
Percentage of households with unmarried partners: This city:
7.0%Whole state:
5.9%
Likely homosexual households (counted as self-reported same-sex unmarried-partner households)
Lesbian couples: 0.5% of all households Gay men: 0.1% of all households
People in group quarters in Hobart in 2010:
82 people in correctional residential facilities
18 people in local jails and other municipal confinement facilities
12 people in group homes intended for adults
People in group quarters in Hobart in 2000:
132 people in nursing homes
85 people in state prisons
25 people in local jails and other confinement facilities (including police lockups)
6 people in other nonhousehold living situations
Banks with branches in Hobart (2011 data):
InterBank: Hobart Drive Thru Branch at 429 South Jefferson, branch established on 2004/10/15; Hobart Branch at 400 South Main, branch established on 1999/07/28. Info updated 2011/08/30: Bank assets: $1,842.7 mil, Deposits: $1,589.2 mil, headquarters in Oklahoma City, OK, positive income , Agricultural Specialization, 33 total offices , Holding Company: Olney Bancshares Of Texas, Inc.
BancFirst: Hobart Branch at 105 W. 4th Street, branch established on 1902/01/01; Drive-In Branch at 401 South Broadway, branch established on 1970/10/14. Info updated 2012/02/24: Bank assets: $5,407.8 mil, Deposits: $4,893.4 mil, headquarters in Oklahoma City, OK, positive income , Commercial Lending Specialization, 101 total offices , Holding Company: Bancfirst Corporation
The First National Bank in Altus: Hobart Branch at 229 South Broadway, branch established on 1920/01/01. Info updated 2006/11/03: Bank assets: $287.0 mil, Deposits: $208.3 mil, headquarters in Altus, OK, positive income , Agricultural Specialization, 6 total offices , Holding Company: First Altus Bancorp, Inc.
Great Plains National Bank: Hobart Branch at 1000 S. Broadway, branch established on 2005/12/30. Info updated 2006/11/03: Bank assets: $395.1 mil, Deposits: $357.3 mil, headquarters in Elk City, OK, positive income , Agricultural Specialization, 12 total offices , Holding Company: Great Plains Bancshares, Inc.
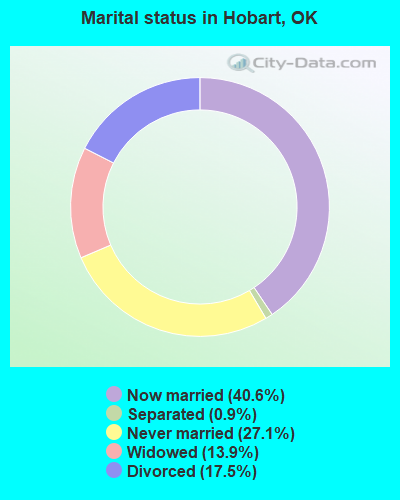
For population 15 years and over in Hobart:
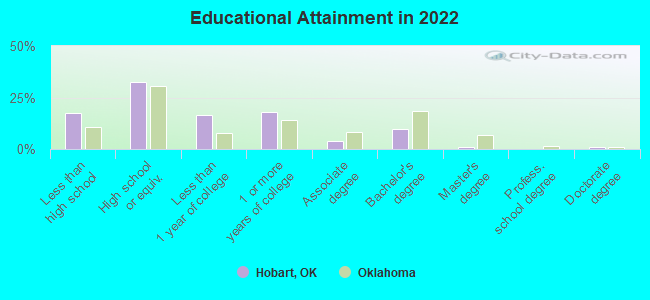
Never married: 27.1%Now married: 40.6%Separated: 0.9%Widowed: 13.9%Divorced: 17.5% For population 25 years and over in Hobart:
High school or higher: 81.6%Bachelor's degree or higher: 11.2%Graduate or professional degree: 1.9%Unemployed: 6.0%Mean travel time to work (commute): 15.5 minutes
Education Gini index (Inequality in education) Here:
11.3Oklahoma average:
11.3
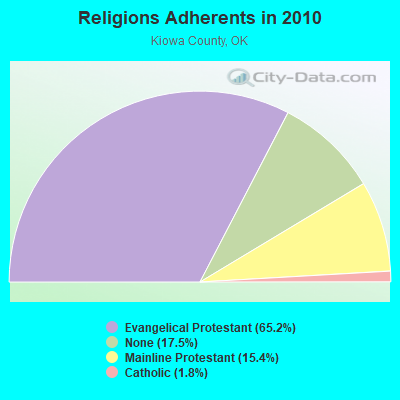
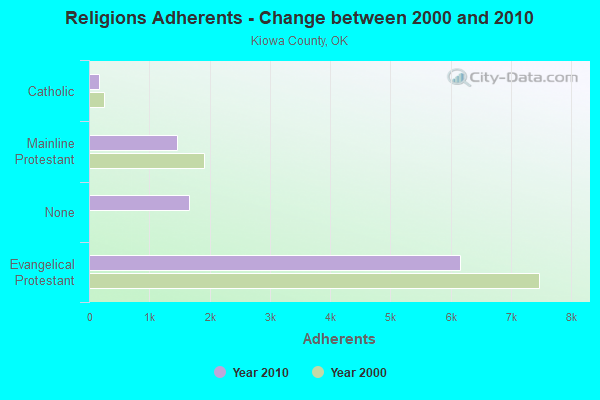
Religion statistics for Hobart, OK (based on Kiowa County data)
Religion Adherents Congregations Evangelical Protestant 6,160 28 Mainline Protestant 1,456 9 Catholic 172 1 Other 1 1 None 1,657 -
Source: Clifford Grammich, Kirk Hadaway, Richard Houseal, Dale E.Jones, Alexei Krindatch, Richie Stanley and Richard H.Taylor. 2012. 2010 U.S.Religion Census: Religious Congregations & Membership Study. Association of Statisticians of American Religious Bodies. Jones, Dale E., et al. 2002. Congregations and Membership in the United States 2000. Nashville, TN: Glenmary Research Center. Graphs represent county-level data
Food Environment Statistics: Number of grocery stores : 5Kiowa County :
5.30 / 10,000 pop.State :
1.97 / 10,000 pop.
Number of convenience stores (no gas) : 2Here :
2.12 / 10,000 pop.Oklahoma :
0.76 / 10,000 pop.
Number of convenience stores (with gas) : 5Kiowa County :
5.30 / 10,000 pop.State :
4.35 / 10,000 pop.
Number of full-service restaurants : 10This county :
10.61 / 10,000 pop.Oklahoma :
6.89 / 10,000 pop.
Adult diabetes rate : Kiowa County :
10.8%State :
10.3%
Adult obesity rate : Kiowa County :
28.4%Oklahoma :
29.2%
Health and Nutrition:
Average overall health of teeth and gums : People feeling badly about themselves : Hobart:
21.9%Oklahoma:
21.4%
People not drinking alcohol at all : Average hours sleeping at night : Overweight people : Hobart:
33.9%Oklahoma:
33.9%
General health condition : This city:
52.1%Oklahoma:
55.2%
Average condition of hearing : This city:
75.9%Oklahoma:
78.4%
More about Health and Nutrition of Hobart, OK Residents
Local government employment and payroll (March 2022)
Function
Full-time employees
Monthly full-time payroll
Average yearly full-time wage
Part-time employees
Monthly part-time payroll
Police Protection - Officers
6 $20,839 $41,678 0 $0 Firefighters
5 $16,235 $38,964 0 $0 Police - Other
5 $10,396 $24,950 0 $0 Solid Waste Management
4 $8,904 $26,712 0 $0 Other Government Administration
3 $10,110 $40,440 0 $0 Water Supply
3 $9,030 $36,120 0 $0 Local Libraries
2 $4,183 $25,098 0 $0 Streets and Highways
2 $5,952 $35,712 0 $0 Parks and Recreation
2 $5,531 $33,186 6 $1,360 Sewerage
1 $3,169 $38,028 0 $0 Airports
1 $2,221 $26,652 0 $0 Financial Administration
1 $3,306 $39,672 0 $0 Other and Unallocable
0 $0 1 $202
Totals for Government
35 $99,875 $34,243 7 $1,561
Hobart government finances - Expenditure in 2017 (per resident):
Construction - Regular Highways: $19,000 ($5.69)
Current Operations - Water Utilities: $1,290,000 ($386.00)
Police Protection: $552,000 ($165.17)Solid Waste Management: $431,000 ($128.96)Parks and Recreation: $354,000 ($105.92)Central Staff Services: $343,000 ($102.63)Local Fire Protection: $241,000 ($72.11)Health - Other: $120,000 ($35.91)Air Transportation: $108,000 ($32.32)Libraries: $66,000 ($19.75)Sewerage: $63,000 ($18.85)Judicial and Legal Services: $36,000 ($10.77)Housing and Community Development: $22,000 ($6.58)Miscellaneous Commercial Activities - Other: $1,000 ($0.30)General - Interest on Debt: $2,000 ($0.60)
Other Capital Outlay - Police Protection: $88,000 ($26.33)
Solid Waste Management: $29,000 ($8.68)Air Transportation: $24,000 ($7.18)Parks and Recreation: $20,000 ($5.98)Central Staff Services: $15,000 ($4.49)Miscellaneous Commercial Activities - Other: $4,000 ($1.20)Total Salaries and Wages: $1,244,000 ($372.23)
Water Utilities - Interest on Debt: $50,000 ($14.96)
Hobart government finances - Revenue in 2017 (per resident):
Charges - Solid Waste Management: $586,000 ($175.34)
Other: $427,000 ($127.77)Sewerage: $282,000 ($84.38)Air Transportation: $150,000 ($44.88)Parks and Recreation: $67,000 ($20.05)Miscellaneous Commercial Activities: $5,000 ($1.50)Federal Intergovernmental - Other: $38,000 ($11.37)
Miscellaneous - Fines and Forfeits: $74,000 ($22.14)
Royalties: $69,000 ($20.65)Rents: $48,000 ($14.36)Donations From Private Sources: $13,000 ($3.89)Interest Earnings: $13,000 ($3.89)Revenue - Water Utilities: $1,486,000 ($444.64)
State Intergovernmental - General Local Government Support: $80,000 ($23.94)
Other: $52,000 ($15.56)Highways: $33,000 ($9.87)Tax - General Sales and Gross Receipts: $1,297,000 ($388.09)
Public Utilities Sales: $98,000 ($29.32)Other Selective Sales: $4,000 ($1.20)
Hobart government finances - Debt in 2017 (per resident):
Long Term Debt - Beginning Outstanding - Unspecified Public Purpose: $1,298,000 ($388.39)
Outstanding Unspecified Public Purpose: $1,078,000 ($322.56)Retired Unspecified Public Purpose: $389,000 ($116.40)Issue, Unspecified Public Purpose: $169,000 ($50.57)
Hobart government finances - Cash and Securities in 2017 (per resident):
Other Funds - Cash and Securities: $2,548,000 ($762.42)
Businesses in Hobart, OK
Name Count Name Count
Ford 1 Subway 1 H&R Block 1 U-Haul 1 Pizza Hut 1 Walmart 1 SONIC Drive-In 1
Strongest AM radio stations in Hobart:
KTJS (1420 AM; 1 kW; HOBART, OK; Owner: FUCHS RADIO, LLC)
KOMA (1520 AM; 50 kW; OKLAHOMA CITY, OK; Owner: RENDA BROADCASTING CORP. OF NEVADA)
KJON (850 AM; daytime; 5 kW; ANADARKO, OK; Owner: CARROLLTON BROADCASTING OF TEXAS, LP)
KRMG (740 AM; 50 kW; TULSA, OK; Owner: CXR HOLDINGS, INC.)
KCAF (990 AM; 10 kW; FARMERSVILLE, TX; Owner: RENAISSANCE RADIO, INC.)
WBAP (820 AM; 50 kW; FORT WORTH, TX; Owner: WBAP-KSCS OPERATING, LTD.)
KGYN (1210 AM; 50 kW; GUYMON, OK; Owner: TELNS BROADCASTING COMPANY, INC.)
KRLD (1080 AM; 50 kW; DALLAS, TX; Owner: TEXAS INFINITY BROADCASTING L.P.)
KAHZ (1360 AM; 50 kW; HURST, TX)
KFAQ (1170 AM; 50 kW; TULSA, OK; Owner: JOURNAL BROADCAST CORPORATION)
KESS (1270 AM; 50 kW; FORT WORTH, TX; Owner: KESS-AM LICENSE CORP.)
KFXR (1190 AM; 50 kW; DALLAS, TX; Owner: CLEAR CHANNEL BROADCASTING LICENSES, INC.)
KICA (980 AM; 50 kW; CLOVIS, NM; Owner: BROADCAST ENTERTAINMENT CORPORATION)
Strongest FM radio stations in Hobart:
KQTZ (105.9 FM; HOBART, OK; Owner: ALTUS RADIO, INC.)
KTIJ (98.5 FM; ELK CITY, OK; Owner: FUCHS RADIO, LLC)
KRMP (103.5 FM; ANADARKO, OK; Owner: PERRY BROADCASTING OF SOUTHWEST OKLAHOMA, INC.)
KQMX (95.5 FM; CLINTON, OK; Owner: WRIGHT BROADCASTING SYSTEMS, INC)
KYCU (89.1 FM; CLINTON, OK; Owner: CAMERON UNIVERSITY)
KJCM (100.3 FM; SNYDER, OK; Owner: ALTUS EDUCATIONAL BROADCASTING FOUNDATION)
KECO (96.5 FM; ELK CITY, OK; Owner: PARAGON COMMUNICATIONS, INC.)
K209DI (89.7 FM; ELK CITY, OK; Owner: CALVARY CHAPEL OF TWIN FALLS, INC.)
KEYB (107.9 FM; ALTUS, OK; Owner: ALTUS FM, INC.)
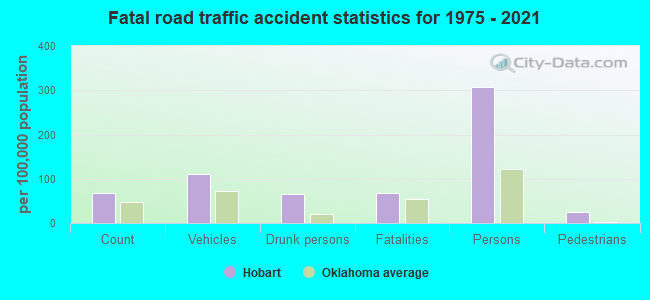
Hobart fatal accident statistics for 1975 - 2021
Hobart fatal accident list:
Nov 22, 1993 06:14 PM, 9bus, Vehicles: 1, Persons: 2, Pedestrians: 1, Fatalities: 1Vehicles: 2, Persons: 7, Fatalities: 1, Drunk persons involved: 2Vehicles: 2, Persons: 5, Fatalities: 1, Drunk persons involved: 1
National Bridge Inventory (NBI) Statistics 99 Number of bridges636ft / 194m Total length $34,465,000 Total costs151,486 Total average daily traffic28,134 Total average daily truck traffic238,360 Total future (year 2040) average daily traffic
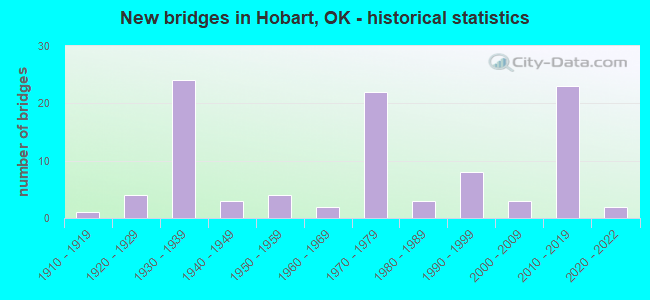
New bridges - historical statistics
1 1910-1919 4 1920-1929 24 1930-1939 3 1940-1949 4 1950-1959 2 1960-1969 22 1970-1979 3 1980-1989 8 1990-1999 3 2000-2009 23 2010-2019 2 2020-2022
See full National Bridge Inventory statistics for Hobart, OK
FCC Registered Cell Phone Towers: 3 (
See the full list of FCC Registered Cell Phone Towers in Hobart )
FCC Registered Antenna Towers: 75 (
See the full list of FCC Registered Antenna Towers )
FCC Registered Commercial Land Mobile Towers: 2 (
See the full list of FCC Registered Commercial Land Mobile Towers in Hobart, OK )
FCC Registered Broadcast Land Mobile Towers: 13 (
See the full list of FCC Registered Broadcast Land Mobile Towers )
FCC Registered Microwave Towers: 27 (
See the full list of FCC Registered Microwave Towers in this town )
FCC Registered Paging Towers: 1 (
See the full list of FCC Registered Paging Towers )
FCC Registered Maritime Coast & Aviation Ground Towers: 1 (
See the full list of FCC Registered Maritime Coast & Aviation Ground Towers )
FCC Registered Amateur Radio Licenses: 31 (
See the full list of FCC Registered Amateur Radio Licenses in Hobart )
FAA Registered Aircraft: 5
Aircraft: BEECH 35-B33 (Category: Land, Seats: 4, Weight: Up to 12,499 Pounds, Speed: 138 mph), Engine: CONT MOTOR I0-470 SERIES (260 HP) (Reciprocating)N-Number: 1482G, N1482G, N-1482G, Serial Number: CD-474, Year manufactured: 1962, Airworthiness Date: 02/21/1962, Certificate Issue Date: 03/14/2013Registrant (Individual): Michael D Krieger, 501 N Bailey St, Hobart, OK 73651Aircraft: PIPER PA-28-180 (Category: Land, Seats: 4, Weight: Up to 12,499 Pounds, Speed: 107 mph), Engine: LYCOMING O&VO-360 SER (180 HP) (Reciprocating)N-Number: 197SA, N197SA, N-197SA, Serial Number: 28-1087, Year manufactured: 1963, Airworthiness Date: 03/07/1963, Certificate Issue Date: 04/19/2011Registrant (LLC): Talley Rentals LLC, 123 W Dogwood St, Hobart, OK 73651Aircraft: CESSNA 150F (Category: Land, Seats: 2, Weight: Up to 12,499 Pounds, Speed: 90 mph), Engine: CONT MOTOR 0-200 SERIES (100 HP) (Reciprocating)N-Number: 6714F, N6714F, N-6714F, Serial Number: 15063314, Year manufactured: 1966, Airworthiness Date: 03/10/1966, Certificate Issue Date: 03/09/2005Registrant (Individual): Okey M Hall, Po Box 593, Hobart, OK 73651Aircraft: CESSNA 172K (Category: Land, Seats: 4, Weight: Up to 12,499 Pounds, Speed: 105 mph), Engine: LYCOMING 0-320 SERIES (180 HP) (4 Cycle)N-Number: 79068, N79068, N-79068, Serial Number: 17257858, Year manufactured: 1968, Airworthiness Date: 01/10/1969, Certificate Issue Date: 06/28/2005Registrant (Individual): Leonard Dale Padgett, 630 Terrace Dr, Hobart, OK 73651Aircraft: PIPER PA-22-135 (Category: Land, Seats: 4, Weight: Up to 12,499 Pounds, Speed: 94 mph), Engine: LYCOMING 0-290 SERIES (140 HP) (Reciprocating)N-Number: 8039C, N8039C, N-8039C, Serial Number: 22-2226, Year manufactured: 1954, Airworthiness Date: 12/28/1955, Certificate Issue Date: 01/03/2005Registrant (Individual): Norman K Preston, 715 N Broadway Ave, Hobart, OK 73651
Most common first names in Hobart, OK among deceased individuals Name Count Lived (average)
John 65 80.8 years William 64 76.5 years James 46 75.9 years Mary 45 76.9 years Robert 38 75.8 years Charles 25 73.8 years George 24 78.6 years Willie 23 86.2 years Anna 21 86.2 years Clarence 19 80.4 years
Most common last names in Hobart, OK among deceased individuals Last name Count Lived (average)
Smith 42 76.7 years Davis 39 77.7 years Harris 28 79.2 years Johnson 27 75.1 years Jones 22 74.8 years Williams 20 72.4 years Lee 15 81.1 years Moore 15 77.7 years Ellis 14 83.1 years Wright 14 78.7 years
Hobart compared to Oklahoma state average:
Median household income below state average. Median house value significantly below state average. Unemployed percentage below state average. Foreign-born population percentage significantly below state average. Length of stay since moving in significantly above state average. House age above state average. Number of college students below state average. Percentage of population with a bachelor's degree or higher below state average.


 Recent articles from our blog. Our writers, many of them Ph.D. graduates or candidates, create easy-to-read articles on a wide variety of topics.

 (47.9 miles
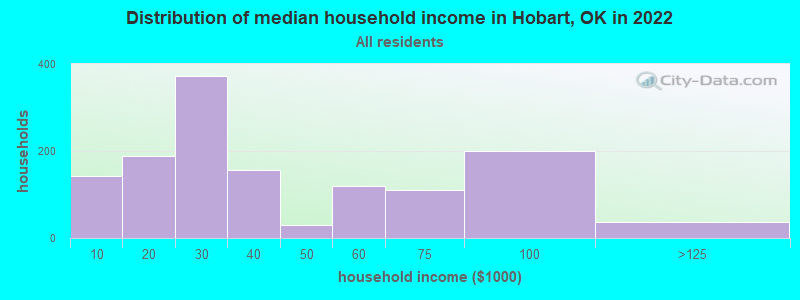


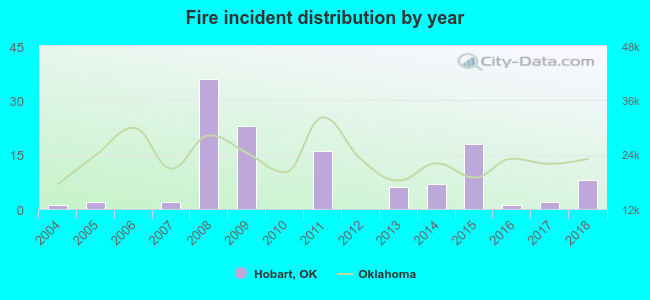 According to the data from the years 2004 - 2018 the average number of fire incidents per year is 8. The highest number of fire incidents - 36 took place in 2008, and the least - 0 in 2006. The data has an increasing trend.
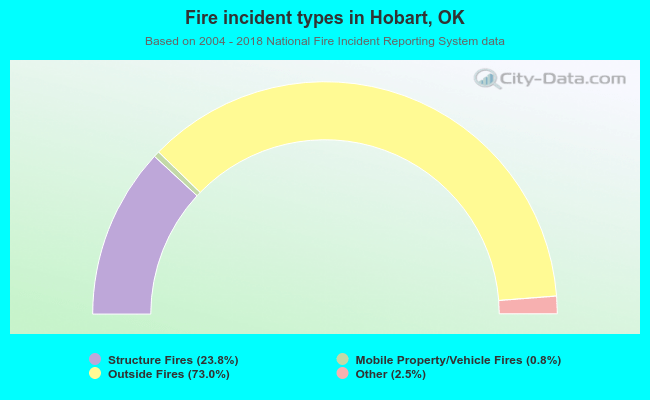 When looking into fire subcategories, the most reports belonged to: Outside Fires (73.0%), and Structure Fires (23.8%).