Indianola, Iowa Submit your own pictures of this city and show them to the world
OSM Map
General Map
Google Map
MSN Map
OSM Map
General Map
Google Map
MSN Map
OSM Map
General Map
Google Map
MSN Map
OSM Map
General Map
Google Map
MSN Map
Please wait while loading the map...
Population in 2022: 16,069 (96% urban, 4% rural). Population change since 2000: +23.6%Males: 7,739 Females: 8,330
March 2022 cost of living index in Indianola: 89.3 (less than average, U.S. average is 100) Percentage of residents living in poverty in 2022: 8.7%for White Non-Hispanic residents , 48.9% for Black residents , 53.1% for Hispanic or Latino residents , 75.9% for American Indian residents , 11.7% for two or more races residents )
Profiles of local businesses
Business Search - 14 Million verified businesses
Data:
Median household income ($)
Median household income (% change since 2000)
Household income diversity
Ratio of average income to average house value (%)
Ratio of average income to average rent
Median household income ($) - White
Median household income ($) - Black or African American
Median household income ($) - Asian
Median household income ($) - Hispanic or Latino
Median household income ($) - American Indian and Alaska Native
Median household income ($) - Multirace
Median household income ($) - Other Race
Median household income for houses/condos with a mortgage ($)
Median household income for apartments without a mortgage ($)
Races - White alone (%)
Races - White alone (% change since 2000)
Races - Black alone (%)
Races - Black alone (% change since 2000)
Races - American Indian alone (%)
Races - American Indian alone (% change since 2000)
Races - Asian alone (%)
Races - Asian alone (% change since 2000)
Races - Hispanic (%)
Races - Hispanic (% change since 2000)
Races - Native Hawaiian and Other Pacific Islander alone (%)
Races - Native Hawaiian and Other Pacific Islander alone (% change since 2000)
Races - Two or more races (%)
Races - Two or more races (% change since 2000)
Races - Other race alone (%)
Races - Other race alone (% change since 2000)
Racial diversity
Unemployment (%)
Unemployment (% change since 2000)
Unemployment (%) - White
Unemployment (%) - Black or African American
Unemployment (%) - Asian
Unemployment (%) - Hispanic or Latino
Unemployment (%) - American Indian and Alaska Native
Unemployment (%) - Multirace
Unemployment (%) - Other Race
Population density (people per square mile)
Population - Males (%)
Population - Females (%)
Population - Males (%) - White
Population - Males (%) - Black or African American
Population - Males (%) - Asian
Population - Males (%) - Hispanic or Latino
Population - Males (%) - American Indian and Alaska Native
Population - Males (%) - Multirace
Population - Males (%) - Other Race
Population - Females (%) - White
Population - Females (%) - Black or African American
Population - Females (%) - Asian
Population - Females (%) - Hispanic or Latino
Population - Females (%) - American Indian and Alaska Native
Population - Females (%) - Multirace
Population - Females (%) - Other Race
Coronavirus confirmed cases (Jun 16, 2024)
Deaths caused by coronavirus (Jun 16, 2024)
Coronavirus confirmed cases (per 100k population) (Jun 16, 2024)
Deaths caused by coronavirus (per 100k population) (Jun 16, 2024)
Daily increase in number of cases (Jun 16, 2024)
Weekly increase in number of cases (Jun 16, 2024)
Cases doubled (in days) (Jun 16, 2024)
Hospitalized patients (Apr 18, 2022)
Negative test results (Apr 18, 2022)
Total test results (Apr 18, 2022)
COVID Vaccine doses distributed (per 100k population) (Sep 19, 2023)
COVID Vaccine doses administered (per 100k population) (Sep 19, 2023)
COVID Vaccine doses distributed (Sep 19, 2023)
COVID Vaccine doses administered (Sep 19, 2023)
Likely homosexual households (%)
Likely homosexual households (% change since 2000)
Likely homosexual households - Lesbian couples (%)
Likely homosexual households - Lesbian couples (% change since 2000)
Likely homosexual households - Gay men (%)
Likely homosexual households - Gay men (% change since 2000)
Cost of living index
Median gross rent ($)
Median contract rent ($)
Median monthly housing costs ($)
Median house or condo value ($)
Median house or condo value ($ change since 2000)
Mean house or condo value by units in structure - 1, detached ($)
Mean house or condo value by units in structure - 1, attached ($)
Mean house or condo value by units in structure - 2 ($)
Mean house or condo value by units in structure by units in structure - 3 or 4 ($)
Mean house or condo value by units in structure - 5 or more ($)
Mean house or condo value by units in structure - Boat, RV, van, etc. ($)
Mean house or condo value by units in structure - Mobile home ($)
Median house or condo value ($) - White
Median house or condo value ($) - Black or African American
Median house or condo value ($) - Asian
Median house or condo value ($) - Hispanic or Latino
Median house or condo value ($) - American Indian and Alaska Native
Median house or condo value ($) - Multirace
Median house or condo value ($) - Other Race
Median resident age
Resident age diversity
Median resident age - Males
Median resident age - Females
Median resident age - White
Median resident age - Black or African American
Median resident age - Asian
Median resident age - Hispanic or Latino
Median resident age - American Indian and Alaska Native
Median resident age - Multirace
Median resident age - Other Race
Median resident age - Males - White
Median resident age - Males - Black or African American
Median resident age - Males - Asian
Median resident age - Males - Hispanic or Latino
Median resident age - Males - American Indian and Alaska Native
Median resident age - Males - Multirace
Median resident age - Males - Other Race
Median resident age - Females - White
Median resident age - Females - Black or African American
Median resident age - Females - Asian
Median resident age - Females - Hispanic or Latino
Median resident age - Females - American Indian and Alaska Native
Median resident age - Females - Multirace
Median resident age - Females - Other Race
Commute - mean travel time to work (minutes)
Travel time to work - Less than 5 minutes (%)
Travel time to work - Less than 5 minutes (% change since 2000)
Travel time to work - 5 to 9 minutes (%)
Travel time to work - 5 to 9 minutes (% change since 2000)
Travel time to work - 10 to 19 minutes (%)
Travel time to work - 10 to 19 minutes (% change since 2000)
Travel time to work - 20 to 29 minutes (%)
Travel time to work - 20 to 29 minutes (% change since 2000)
Travel time to work - 30 to 39 minutes (%)
Travel time to work - 30 to 39 minutes (% change since 2000)
Travel time to work - 40 to 59 minutes (%)
Travel time to work - 40 to 59 minutes (% change since 2000)
Travel time to work - 60 to 89 minutes (%)
Travel time to work - 60 to 89 minutes (% change since 2000)
Travel time to work - 90 or more minutes (%)
Travel time to work - 90 or more minutes (% change since 2000)
Marital status - Never married (%)
Marital status - Now married (%)
Marital status - Separated (%)
Marital status - Widowed (%)
Marital status - Divorced (%)
Median family income ($)
Median family income (% change since 2000)
Median non-family income ($)
Median non-family income (% change since 2000)
Median per capita income ($)
Median per capita income (% change since 2000)
Median family income ($) - White
Median family income ($) - Black or African American
Median family income ($) - Asian
Median family income ($) - Hispanic or Latino
Median family income ($) - American Indian and Alaska Native
Median family income ($) - Multirace
Median family income ($) - Other Race
Median year house/condo built
Median year apartment built
Year house built - Built 2005 or later (%)
Year house built - Built 2000 to 2004 (%)
Year house built - Built 1990 to 1999 (%)
Year house built - Built 1980 to 1989 (%)
Year house built - Built 1970 to 1979 (%)
Year house built - Built 1960 to 1969 (%)
Year house built - Built 1950 to 1959 (%)
Year house built - Built 1940 to 1949 (%)
Year house built - Built 1939 or earlier (%)
Average household size
Household density (households per square mile)
Average household size - White
Average household size - Black or African American
Average household size - Asian
Average household size - Hispanic or Latino
Average household size - American Indian and Alaska Native
Average household size - Multirace
Average household size - Other Race
Occupied housing units (%)
Vacant housing units (%)
Owner occupied housing units (%)
Renter occupied housing units (%)
Vacancy status - For rent (%)
Vacancy status - For sale only (%)
Vacancy status - Rented or sold, not occupied (%)
Vacancy status - For seasonal, recreational, or occasional use (%)
Vacancy status - For migrant workers (%)
Vacancy status - Other vacant (%)
Residents with income below the poverty level (%)
Residents with income below 50% of the poverty level (%)
Children below poverty level (%)
Poor families by family type - Married-couple family (%)
Poor families by family type - Male, no wife present (%)
Poor families by family type - Female, no husband present (%)
Poverty status for native-born residents (%)
Poverty status for foreign-born residents (%)
Poverty among high school graduates not in families (%)
Poverty among people who did not graduate high school not in families (%)
Residents with income below the poverty level (%) - White
Residents with income below the poverty level (%) - Black or African American
Residents with income below the poverty level (%) - Asian
Residents with income below the poverty level (%) - Hispanic or Latino
Residents with income below the poverty level (%) - American Indian and Alaska Native
Residents with income below the poverty level (%) - Multirace
Residents with income below the poverty level (%) - Other Race
Air pollution - Air Quality Index (AQI)
Air pollution - CO
Air pollution - NO2
Air pollution - SO2
Air pollution - Ozone
Air pollution - PM10
Air pollution - PM25
Air pollution - Pb
Crime - Murders per 100,000 population
Crime - Rapes per 100,000 population
Crime - Robberies per 100,000 population
Crime - Assaults per 100,000 population
Crime - Burglaries per 100,000 population
Crime - Thefts per 100,000 population
Crime - Auto thefts per 100,000 population
Crime - Arson per 100,000 population
Crime - City-data.com crime index
Crime - Violent crime index
Crime - Property crime index
Crime - Murders per 100,000 population (5 year average)
Crime - Rapes per 100,000 population (5 year average)
Crime - Robberies per 100,000 population (5 year average)
Crime - Assaults per 100,000 population (5 year average)
Crime - Burglaries per 100,000 population (5 year average)
Crime - Thefts per 100,000 population (5 year average)
Crime - Auto thefts per 100,000 population (5 year average)
Crime - Arson per 100,000 population (5 year average)
Crime - City-data.com crime index (5 year average)
Crime - Violent crime index (5 year average)
Crime - Property crime index (5 year average)
1996 Presidential Elections Results (%) - Democratic Party (Clinton)
1996 Presidential Elections Results (%) - Republican Party (Dole)
1996 Presidential Elections Results (%) - Other
2000 Presidential Elections Results (%) - Democratic Party (Gore)
2000 Presidential Elections Results (%) - Republican Party (Bush)
2000 Presidential Elections Results (%) - Other
2004 Presidential Elections Results (%) - Democratic Party (Kerry)
2004 Presidential Elections Results (%) - Republican Party (Bush)
2004 Presidential Elections Results (%) - Other
2008 Presidential Elections Results (%) - Democratic Party (Obama)
2008 Presidential Elections Results (%) - Republican Party (McCain)
2008 Presidential Elections Results (%) - Other
2012 Presidential Elections Results (%) - Democratic Party (Obama)
2012 Presidential Elections Results (%) - Republican Party (Romney)
2012 Presidential Elections Results (%) - Other
2016 Presidential Elections Results (%) - Democratic Party (Clinton)
2016 Presidential Elections Results (%) - Republican Party (Trump)
2016 Presidential Elections Results (%) - Other
2020 Presidential Elections Results (%) - Democratic Party (Biden)
2020 Presidential Elections Results (%) - Republican Party (Trump)
2020 Presidential Elections Results (%) - Other
Ancestries Reported - Arab (%)
Ancestries Reported - Czech (%)
Ancestries Reported - Danish (%)
Ancestries Reported - Dutch (%)
Ancestries Reported - English (%)
Ancestries Reported - French (%)
Ancestries Reported - French Canadian (%)
Ancestries Reported - German (%)
Ancestries Reported - Greek (%)
Ancestries Reported - Hungarian (%)
Ancestries Reported - Irish (%)
Ancestries Reported - Italian (%)
Ancestries Reported - Lithuanian (%)
Ancestries Reported - Norwegian (%)
Ancestries Reported - Polish (%)
Ancestries Reported - Portuguese (%)
Ancestries Reported - Russian (%)
Ancestries Reported - Scotch-Irish (%)
Ancestries Reported - Scottish (%)
Ancestries Reported - Slovak (%)
Ancestries Reported - Subsaharan African (%)
Ancestries Reported - Swedish (%)
Ancestries Reported - Swiss (%)
Ancestries Reported - Ukrainian (%)
Ancestries Reported - United States (%)
Ancestries Reported - Welsh (%)
Ancestries Reported - West Indian (%)
Ancestries Reported - Other (%)
Educational Attainment - No schooling completed (%)
Educational Attainment - Less than high school (%)
Educational Attainment - High school or equivalent (%)
Educational Attainment - Less than 1 year of college (%)
Educational Attainment - 1 or more years of college (%)
Educational Attainment - Associate degree (%)
Educational Attainment - Bachelor's degree (%)
Educational Attainment - Master's degree (%)
Educational Attainment - Professional school degree (%)
Educational Attainment - Doctorate degree (%)
School Enrollment - Nursery, preschool (%)
School Enrollment - Kindergarten (%)
School Enrollment - Grade 1 to 4 (%)
School Enrollment - Grade 5 to 8 (%)
School Enrollment - Grade 9 to 12 (%)
School Enrollment - College undergrad (%)
School Enrollment - Graduate or professional (%)
School Enrollment - Not enrolled in school (%)
School enrollment - Public schools (%)
School enrollment - Private schools (%)
School enrollment - Not enrolled (%)
Median number of rooms in houses and condos
Median number of rooms in apartments
Housing units lacking complete plumbing facilities (%)
Housing units lacking complete kitchen facilities (%)
Density of houses
Urban houses (%)
Rural houses (%)
Households with people 60 years and over (%)
Households with people 65 years and over (%)
Households with people 75 years and over (%)
Households with one or more nonrelatives (%)
Households with no nonrelatives (%)
Population in households (%)
Family households (%)
Nonfamily households (%)
Population in families (%)
Family households with own children (%)
Median number of bedrooms in owner occupied houses
Mean number of bedrooms in owner occupied houses
Median number of bedrooms in renter occupied houses
Mean number of bedrooms in renter occupied houses
Median number of vehichles in owner occupied houses
Mean number of vehichles in owner occupied houses
Median number of vehichles in renter occupied houses
Mean number of vehichles in renter occupied houses
Mortgage status - with mortgage (%)
Mortgage status - with second mortgage (%)
Mortgage status - with home equity loan (%)
Mortgage status - with both second mortgage and home equity loan (%)
Mortgage status - without a mortgage (%)
Average family size
Average family size - White
Average family size - Black or African American
Average family size - Asian
Average family size - Hispanic or Latino
Average family size - American Indian and Alaska Native
Average family size - Multirace
Average family size - Other Race
Geographical mobility - Same house 1 year ago (%)
Geographical mobility - Moved within same county (%)
Geographical mobility - Moved from different county within same state (%)
Geographical mobility - Moved from different state (%)
Geographical mobility - Moved from abroad (%)
Place of birth - Born in state of residence (%)
Place of birth - Born in other state (%)
Place of birth - Native, outside of US (%)
Place of birth - Foreign born (%)
Housing units in structures - 1, detached (%)
Housing units in structures - 1, attached (%)
Housing units in structures - 2 (%)
Housing units in structures - 3 or 4 (%)
Housing units in structures - 5 to 9 (%)
Housing units in structures - 10 to 19 (%)
Housing units in structures - 20 to 49 (%)
Housing units in structures - 50 or more (%)
Housing units in structures - Mobile home (%)
Housing units in structures - Boat, RV, van, etc. (%)
House/condo owner moved in on average (years ago)
Renter moved in on average (years ago)
Year householder moved into unit - Moved in 1999 to March 2000 (%)
Year householder moved into unit - Moved in 1995 to 1998 (%)
Year householder moved into unit - Moved in 1990 to 1994 (%)
Year householder moved into unit - Moved in 1980 to 1989 (%)
Year householder moved into unit - Moved in 1970 to 1979 (%)
Year householder moved into unit - Moved in 1969 or earlier (%)
Means of transportation to work - Drove car alone (%)
Means of transportation to work - Carpooled (%)
Means of transportation to work - Public transportation (%)
Means of transportation to work - Bus or trolley bus (%)
Means of transportation to work - Streetcar or trolley car (%)
Means of transportation to work - Subway or elevated (%)
Means of transportation to work - Railroad (%)
Means of transportation to work - Ferryboat (%)
Means of transportation to work - Taxicab (%)
Means of transportation to work - Motorcycle (%)
Means of transportation to work - Bicycle (%)
Means of transportation to work - Walked (%)
Means of transportation to work - Other means (%)
Working at home (%)
Industry diversity
Most Common Industries - Agriculture, forestry, fishing and hunting, and mining (%)
Most Common Industries - Agriculture, forestry, fishing and hunting (%)
Most Common Industries - Mining, quarrying, and oil and gas extraction (%)
Most Common Industries - Construction (%)
Most Common Industries - Manufacturing (%)
Most Common Industries - Wholesale trade (%)
Most Common Industries - Retail trade (%)
Most Common Industries - Transportation and warehousing, and utilities (%)
Most Common Industries - Transportation and warehousing (%)
Most Common Industries - Utilities (%)
Most Common Industries - Information (%)
Most Common Industries - Finance and insurance, and real estate and rental and leasing (%)
Most Common Industries - Finance and insurance (%)
Most Common Industries - Real estate and rental and leasing (%)
Most Common Industries - Professional, scientific, and management, and administrative and waste management services (%)
Most Common Industries - Professional, scientific, and technical services (%)
Most Common Industries - Management of companies and enterprises (%)
Most Common Industries - Administrative and support and waste management services (%)
Most Common Industries - Educational services, and health care and social assistance (%)
Most Common Industries - Educational services (%)
Most Common Industries - Health care and social assistance (%)
Most Common Industries - Arts, entertainment, and recreation, and accommodation and food services (%)
Most Common Industries - Arts, entertainment, and recreation (%)
Most Common Industries - Accommodation and food services (%)
Most Common Industries - Other services, except public administration (%)
Most Common Industries - Public administration (%)
Occupation diversity
Most Common Occupations - Management, business, science, and arts occupations (%)
Most Common Occupations - Management, business, and financial occupations (%)
Most Common Occupations - Management occupations (%)
Most Common Occupations - Business and financial operations occupations (%)
Most Common Occupations - Computer, engineering, and science occupations (%)
Most Common Occupations - Computer and mathematical occupations (%)
Most Common Occupations - Architecture and engineering occupations (%)
Most Common Occupations - Life, physical, and social science occupations (%)
Most Common Occupations - Education, legal, community service, arts, and media occupations (%)
Most Common Occupations - Community and social service occupations (%)
Most Common Occupations - Legal occupations (%)
Most Common Occupations - Education, training, and library occupations (%)
Most Common Occupations - Arts, design, entertainment, sports, and media occupations (%)
Most Common Occupations - Healthcare practitioners and technical occupations (%)
Most Common Occupations - Health diagnosing and treating practitioners and other technical occupations (%)
Most Common Occupations - Health technologists and technicians (%)
Most Common Occupations - Service occupations (%)
Most Common Occupations - Healthcare support occupations (%)
Most Common Occupations - Protective service occupations (%)
Most Common Occupations - Fire fighting and prevention, and other protective service workers including supervisors (%)
Most Common Occupations - Law enforcement workers including supervisors (%)
Most Common Occupations - Food preparation and serving related occupations (%)
Most Common Occupations - Building and grounds cleaning and maintenance occupations (%)
Most Common Occupations - Personal care and service occupations (%)
Most Common Occupations - Sales and office occupations (%)
Most Common Occupations - Sales and related occupations (%)
Most Common Occupations - Office and administrative support occupations (%)
Most Common Occupations - Natural resources, construction, and maintenance occupations (%)
Most Common Occupations - Farming, fishing, and forestry occupations (%)
Most Common Occupations - Construction and extraction occupations (%)
Most Common Occupations - Installation, maintenance, and repair occupations (%)
Most Common Occupations - Production, transportation, and material moving occupations (%)
Most Common Occupations - Production occupations (%)
Most Common Occupations - Transportation occupations (%)
Most Common Occupations - Material moving occupations (%)
People in Group quarters - Institutionalized population (%)
People in Group quarters - Correctional institutions (%)
People in Group quarters - Federal prisons and detention centers (%)
People in Group quarters - Halfway houses (%)
People in Group quarters - Local jails and other confinement facilities (including police lockups) (%)
People in Group quarters - Military disciplinary barracks (%)
People in Group quarters - State prisons (%)
People in Group quarters - Other types of correctional institutions (%)
People in Group quarters - Nursing homes (%)
People in Group quarters - Hospitals/wards, hospices, and schools for the handicapped (%)
People in Group quarters - Hospitals/wards and hospices for chronically ill (%)
People in Group quarters - Hospices or homes for chronically ill (%)
People in Group quarters - Military hospitals or wards for chronically ill (%)
People in Group quarters - Other hospitals or wards for chronically ill (%)
People in Group quarters - Hospitals or wards for drug/alcohol abuse (%)
People in Group quarters - Mental (Psychiatric) hospitals or wards (%)
People in Group quarters - Schools, hospitals, or wards for the mentally retarded (%)
People in Group quarters - Schools, hospitals, or wards for the physically handicapped (%)
People in Group quarters - Institutions for the deaf (%)
People in Group quarters - Institutions for the blind (%)
People in Group quarters - Orthopedic wards and institutions for the physically handicapped (%)
People in Group quarters - Wards in general hospitals for patients who have no usual home elsewhere (%)
People in Group quarters - Wards in military hospitals for patients who have no usual home elsewhere (%)
People in Group quarters - Juvenile institutions (%)
People in Group quarters - Long-term care (%)
People in Group quarters - Homes for abused, dependent, and neglected children (%)
People in Group quarters - Residential treatment centers for emotionally disturbed children (%)
People in Group quarters - Training schools for juvenile delinquents (%)
People in Group quarters - Short-term care, detention or diagnostic centers for delinquent children (%)
People in Group quarters - Type of juvenile institution unknown (%)
People in Group quarters - Noninstitutionalized population (%)
People in Group quarters - College dormitories (includes college quarters off campus) (%)
People in Group quarters - Military quarters (%)
People in Group quarters - On base (%)
People in Group quarters - Barracks, unaccompanied personnel housing (UPH), (Enlisted/Officer), ;and similar group living quarters for military personnel (%)
People in Group quarters - Transient quarters for temporary residents (%)
People in Group quarters - Military ships (%)
People in Group quarters - Group homes (%)
People in Group quarters - Homes or halfway houses for drug/alcohol abuse (%)
People in Group quarters - Homes for the mentally ill (%)
People in Group quarters - Homes for the mentally retarded (%)
People in Group quarters - Homes for the physically handicapped (%)
People in Group quarters - Other group homes (%)
People in Group quarters - Religious group quarters (%)
People in Group quarters - Dormitories (%)
People in Group quarters - Agriculture workers' dormitories on farms (%)
People in Group quarters - Job Corps and vocational training facilities (%)
People in Group quarters - Other workers' dormitories (%)
People in Group quarters - Crews of maritime vessels (%)
People in Group quarters - Other nonhousehold living situations (%)
People in Group quarters - Other noninstitutional group quarters (%)
Residents speaking English at home (%)
Residents speaking English at home - Born in the United States (%)
Residents speaking English at home - Native, born elsewhere (%)
Residents speaking English at home - Foreign born (%)
Residents speaking Spanish at home (%)
Residents speaking Spanish at home - Born in the United States (%)
Residents speaking Spanish at home - Native, born elsewhere (%)
Residents speaking Spanish at home - Foreign born (%)
Residents speaking other language at home (%)
Residents speaking other language at home - Born in the United States (%)
Residents speaking other language at home - Native, born elsewhere (%)
Residents speaking other language at home - Foreign born (%)
Class of Workers - Employee of private company (%)
Class of Workers - Self-employed in own incorporated business (%)
Class of Workers - Private not-for-profit wage and salary workers (%)
Class of Workers - Local government workers (%)
Class of Workers - State government workers (%)
Class of Workers - Federal government workers (%)
Class of Workers - Self-employed workers in own not incorporated business and Unpaid family workers (%)
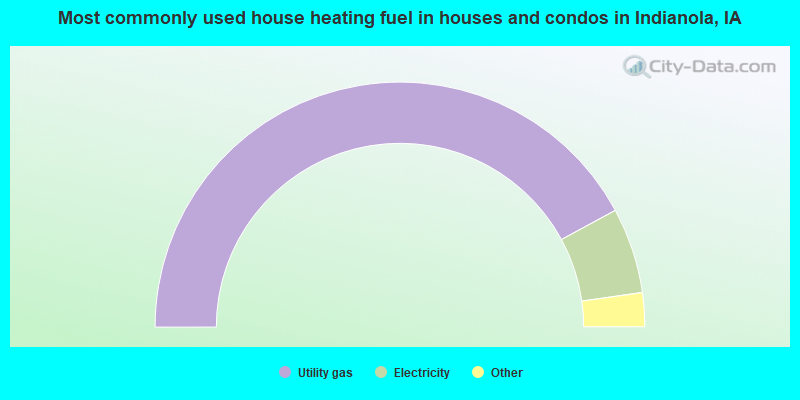
House heating fuel used in houses and condos - Utility gas (%)
House heating fuel used in houses and condos - Bottled, tank, or LP gas (%)
House heating fuel used in houses and condos - Electricity (%)
House heating fuel used in houses and condos - Fuel oil, kerosene, etc. (%)
House heating fuel used in houses and condos - Coal or coke (%)
House heating fuel used in houses and condos - Wood (%)
House heating fuel used in houses and condos - Solar energy (%)
House heating fuel used in houses and condos - Other fuel (%)
House heating fuel used in houses and condos - No fuel used (%)
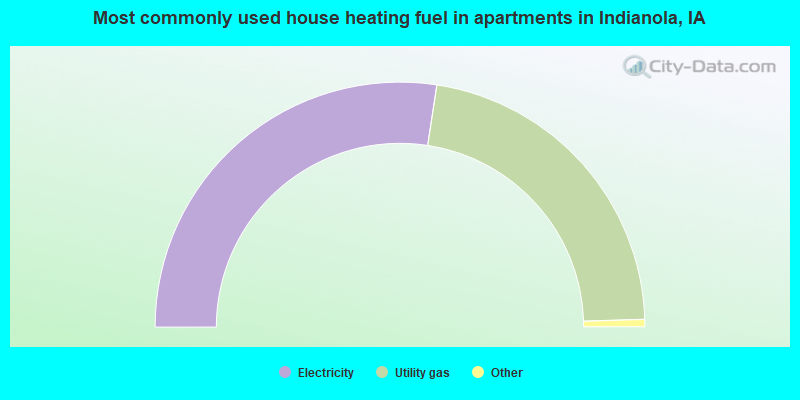
House heating fuel used in apartments - Utility gas (%)
House heating fuel used in apartments - Bottled, tank, or LP gas (%)
House heating fuel used in apartments - Electricity (%)
House heating fuel used in apartments - Fuel oil, kerosene, etc. (%)
House heating fuel used in apartments - Coal or coke (%)
House heating fuel used in apartments - Wood (%)
House heating fuel used in apartments - Solar energy (%)
House heating fuel used in apartments - Other fuel (%)
House heating fuel used in apartments - No fuel used (%)
Armed forces status - In Armed Forces (%)
Armed forces status - Civilian (%)
Armed forces status - Civilian - Veteran (%)
Armed forces status - Civilian - Nonveteran (%)
Fatal accidents locations in years 2005-2021
Fatal accidents locations in 2005
Fatal accidents locations in 2006
Fatal accidents locations in 2007
Fatal accidents locations in 2008
Fatal accidents locations in 2009
Fatal accidents locations in 2010
Fatal accidents locations in 2011
Fatal accidents locations in 2012
Fatal accidents locations in 2013
Fatal accidents locations in 2014
Fatal accidents locations in 2015
Fatal accidents locations in 2016
Fatal accidents locations in 2017
Fatal accidents locations in 2018
Fatal accidents locations in 2019
Fatal accidents locations in 2020
Fatal accidents locations in 2021
Alcohol use - People drinking some alcohol every month (%)
Alcohol use - People not drinking at all (%)
Alcohol use - Average days/month drinking alcohol
Alcohol use - Average drinks/week
Alcohol use - Average days/year people drink much
Audiometry - Average condition of hearing (%)
Audiometry - People that can hear a whisper from across a quiet room (%)
Audiometry - People that can hear normal voice from across a quiet room (%)
Audiometry - Ears ringing, roaring, buzzing (%)
Audiometry - Had a job exposure to loud noise (%)
Audiometry - Had off-work exposure to loud noise (%)
Blood Pressure & Cholesterol - Has high blood pressure (%)
Blood Pressure & Cholesterol - Checking blood pressure at home (%)
Blood Pressure & Cholesterol - Frequently checking blood cholesterol (%)
Blood Pressure & Cholesterol - Has high cholesterol level (%)
Consumer Behavior - Money monthly spent on food at supermarket/grocery store
Consumer Behavior - Money monthly spent on food at other stores
Consumer Behavior - Money monthly spent on eating out
Consumer Behavior - Money monthly spent on carryout/delivered foods
Consumer Behavior - Income spent on food at supermarket/grocery store (%)
Consumer Behavior - Income spent on food at other stores (%)
Consumer Behavior - Income spent on eating out (%)
Consumer Behavior - Income spent on carryout/delivered foods (%)
Current Health Status - General health condition (%)
Current Health Status - Blood donors (%)
Current Health Status - Has blood ever tested for HIV virus (%)
Current Health Status - Left-handed people (%)
Dermatology - People using sunscreen (%)
Diabetes - Diabetics (%)
Diabetes - Had a blood test for high blood sugar (%)
Diabetes - People taking insulin (%)
Diet Behavior & Nutrition - Diet health (%)
Diet Behavior & Nutrition - Milk product consumption (# of products/month)
Diet Behavior & Nutrition - Meals not home prepared (#/week)
Diet Behavior & Nutrition - Meals from fast food or pizza place (#/week)
Diet Behavior & Nutrition - Ready-to-eat foods (#/month)
Diet Behavior & Nutrition - Frozen meals/pizza (#/month)
Drug Use - People that ever used marijuana or hashish (%)
Drug Use - Ever used hard drugs (%)
Drug Use - Ever used any form of cocaine (%)
Drug Use - Ever used heroin (%)
Drug Use - Ever used methamphetamine (%)
Health Insurance - People covered by health insurance (%)
Kidney Conditions-Urology - Avg. # of times urinating at night
Medical Conditions - People with asthma (%)
Medical Conditions - People with anemia (%)
Medical Conditions - People with psoriasis (%)
Medical Conditions - People with overweight (%)
Medical Conditions - Elderly people having difficulties in thinking or remembering (%)
Medical Conditions - People who ever received blood transfusion (%)
Medical Conditions - People having trouble seeing even with glass/contacts (%)
Medical Conditions - People with arthritis (%)
Medical Conditions - People with gout (%)
Medical Conditions - People with congestive heart failure (%)
Medical Conditions - People with coronary heart disease (%)
Medical Conditions - People with angina pectoris (%)
Medical Conditions - People who ever had heart attack (%)
Medical Conditions - People who ever had stroke (%)
Medical Conditions - People with emphysema (%)
Medical Conditions - People with thyroid problem (%)
Medical Conditions - People with chronic bronchitis (%)
Medical Conditions - People with any liver condition (%)
Medical Conditions - People who ever had cancer or malignancy (%)
Mental Health - People who have little interest in doing things (%)
Mental Health - People feeling down, depressed, or hopeless (%)
Mental Health - People who have trouble sleeping or sleeping too much (%)
Mental Health - People feeling tired or having little energy (%)
Mental Health - People with poor appetite or overeating (%)
Mental Health - People feeling bad about themself (%)
Mental Health - People who have trouble concentrating on things (%)
Mental Health - People moving or speaking slowly or too fast (%)
Mental Health - People having thoughts they would be better off dead (%)
Oral Health - Average years since last visit a dentist
Oral Health - People embarrassed because of mouth (%)
Oral Health - People with gum disease (%)
Oral Health - General health of teeth and gums (%)
Oral Health - Average days a week using dental floss/device
Oral Health - Average days a week using mouthwash for dental problem
Oral Health - Average number of teeth
Pesticide Use - Households using pesticides to control insects (%)
Pesticide Use - Households using pesticides to kill weeds (%)
Physical Activity - People doing vigorous-intensity work activities (%)
Physical Activity - People doing moderate-intensity work activities (%)
Physical Activity - People walking or bicycling (%)
Physical Activity - People doing vigorous-intensity recreational activities (%)
Physical Activity - People doing moderate-intensity recreational activities (%)
Physical Activity - Average hours a day doing sedentary activities
Physical Activity - Average hours a day watching TV or videos
Physical Activity - Average hours a day using computer
Physical Functioning - People having limitations keeping them from working (%)
Physical Functioning - People limited in amount of work they can do (%)
Physical Functioning - People that need special equipment to walk (%)
Physical Functioning - People experiencing confusion/memory problems (%)
Physical Functioning - People requiring special healthcare equipment (%)
Prescription Medications - Average number of prescription medicines taking
Preventive Aspirin Use - Adults 40+ taking low-dose aspirin (%)
Reproductive Health - Vaginal deliveries (%)
Reproductive Health - Cesarean deliveries (%)
Reproductive Health - Deliveries resulted in a live birth (%)
Reproductive Health - Pregnancies resulted in a delivery (%)
Reproductive Health - Women breastfeeding newborns (%)
Reproductive Health - Women that had a hysterectomy (%)
Reproductive Health - Women that had both ovaries removed (%)
Reproductive Health - Women that have ever taken birth control pills (%)
Reproductive Health - Women taking birth control pills (%)
Reproductive Health - Women that have ever used Depo-Provera or injectables (%)
Reproductive Health - Women that have ever used female hormones (%)
Sexual Behavior - People 18+ that ever had sex (vaginal, anal, or oral) (%)
Sexual Behavior - Males 18+ that ever had vaginal sex with a woman (%)
Sexual Behavior - Males 18+ that ever performed oral sex on a woman (%)
Sexual Behavior - Males 18+ that ever had anal sex with a woman (%)
Sexual Behavior - Males 18+ that ever had any sex with a man (%)
Sexual Behavior - Females 18+ that ever had vaginal sex with a man (%)
Sexual Behavior - Females 18+ that ever performed oral sex on a man (%)
Sexual Behavior - Females 18+ that ever had anal sex with a man (%)
Sexual Behavior - Females 18+ that ever had any kind of sex with a woman (%)
Sexual Behavior - Average age people first had sex
Sexual Behavior - Average number of female sex partners in lifetime (males 18+)
Sexual Behavior - Average number of female vaginal sex partners in lifetime (males 18+)
Sexual Behavior - Average age people first performed oral sex on a woman (18+)
Sexual Behavior - Average number of woman performed oral sex on in lifetime (18+)
Sexual Behavior - Average number of male sex partners in lifetime (males 18+)
Sexual Behavior - Average number of male anal sex partners in lifetime (males 18+)
Sexual Behavior - Average age people first performed oral sex on a man (18+)
Sexual Behavior - Average number of male oral sex partners in lifetime (18+)
Sexual Behavior - People using protection when performing oral sex (%)
Sexual Behavior - Average number of times people have vaginal or anal sex a year
Sexual Behavior - People having sex without condom (%)
Sexual Behavior - Average number of male sex partners in lifetime (females 18+)
Sexual Behavior - Average number of male vaginal sex partners in lifetime (females 18+)
Sexual Behavior - Average number of female sex partners in lifetime (females 18+)
Sexual Behavior - Circumcised males 18+ (%)
Sleep Disorders - Average hours sleeping at night
Sleep Disorders - People that has trouble sleeping (%)
Smoking-Cigarette Use - People smoking cigarettes (%)
Taste & Smell - People 40+ having problems with smell (%)
Taste & Smell - People 40+ having problems with taste (%)
Taste & Smell - People 40+ that ever had wisdom teeth removed (%)
Taste & Smell - People 40+ that ever had tonsils teeth removed (%)
Taste & Smell - People 40+ that ever had a loss of consciousness because of a head injury (%)
Taste & Smell - People 40+ that ever had a broken nose or other serious injury to face or skull (%)
Taste & Smell - People 40+ that ever had two or more sinus infections (%)
Weight - Average height (inches)
Weight - Average weight (pounds)
Weight - Average BMI
Weight - People that are obese (%)
Weight - People that ever were obese (%)
Weight - People trying to lose weight (%)
According to our research of Iowa and other state lists, there were 26 registered sex offenders living in Indianola, Iowa as of June 16, 2024 . The ratio of all residents to sex offenders in Indianola is 595 to 1.The ratio of registered sex offenders to all residents in this city is lower than the state average.
Officers per 1,000 residents here:
1.42Iowa average:
1.76
Latest news from Indianola, IA collected exclusively by city-data.com from local newspapers, TV, and radio stations
Ancestries: German (24.4%), Irish (10.8%), American (9.8%), English (8.7%), European (5.9%), Ukrainian (4.5%).
Current Local Time:
Incorporated on 10/5/1863
Land area: 9.19 square miles.
Population density: 1,749 people per square mile (low).
369 residents are foreign born (1.4% Asia , 0.6% Europe , 0.3% Latin America ).
Median real estate property taxes paid for housing units with mortgages in 2022: $3,594 (1.6%)Median real estate property taxes paid for housing units with no mortgage in 2022: $3,554 (1.6%)
Nearest city with pop. 50,000+: Des Moines, IA
Nearest city with pop. 200,000+: Omaha, NE
Nearest city with pop. 1,000,000+: Chicago, IL
Nearest cities:
Ackworth, IA (2.2 miles),
Spring Hill, IA (2.4 miles),
Sandyville, IA (3.0 miles),
St. Marys, IA (3.1 miles),
Latitude: 41.36 N, Longitude: 93.56 W
Daytime population change due to commuting: -1,407 (-8.8%)Workers who live and work in this city: 3,842 (49.6%)
Single-family new house construction building permits:
2022: 46 buildings , average cost: $367,9002021: 65 buildings , average cost: $305,0002020: 81 buildings , average cost: $194,4002019: 56 buildings , average cost: $179,1002018: 30 buildings , average cost: $193,7002017: 39 buildings , average cost: $173,3002016: 40 buildings , average cost: $181,2002015: 39 buildings , average cost: $180,5002014: 29 buildings , average cost: $183,8002013: 47 buildings , average cost: $171,3002012: 13 buildings , average cost: $156,6002011: 21 buildings , average cost: $160,1002010: 115 buildings , average cost: $106,8002009: 22 buildings , average cost: $161,0002008: 80 buildings , average cost: $105,9002007: 63 buildings , average cost: $167,8002006: 87 buildings , average cost: $162,8002005: 75 buildings , average cost: $160,7002004: 89 buildings , average cost: $172,1002003: 80 buildings , average cost: $122,8002002: 77 buildings , average cost: $141,2002001: 72 buildings , average cost: $148,3002000: 53 buildings , average cost: $157,1001999: 77 buildings , average cost: $146,6001998: 43 buildings , average cost: $124,4001997: 3 buildings , average cost: $111,100Unemployment in December 2023:
Population change in the 1990s: +1,850 (+16.6%).
Most common occupations in Indianola, IA (%)
Both Males Females
Other sales and related occupations, including supervisors (5.0%)
Other office and administrative support workers, including supervisors (4.8%)
Secretaries and administrative assistants (4.6%)
Other management occupations, except farmers and farm managers (3.9%)
Information and record clerks, except customer service representatives (3.6%)
Preschool, kindergarten, elementary, and middle school teachers (3.5%)
Other production occupations, including supervisors (3.3%)
Other sales and related occupations, including supervisors (5.7%)
Other management occupations, except farmers and farm managers (5.4%)
Computer specialists (4.3%)
Other production occupations, including supervisors (4.2%)
Driver/sales workers and truck drivers (4.0%)
Electrical equipment mechanics and other installation, maintenance, and repair workers, including supervisors (3.9%)
Cooks and food preparation workers (3.7%)
Secretaries and administrative assistants (8.6%)
Other office and administrative support workers, including supervisors (7.1%)
Information and record clerks, except customer service representatives (6.3%)
Preschool, kindergarten, elementary, and middle school teachers (5.3%)
Other sales and related occupations, including supervisors (4.4%)
Nursing, psychiatric, and home health aides (4.1%)
Financial clerks, except bookkeeping, accounting and auditing clerks (3.6%)
Tornado activity:
Indianola-area historical tornado activity is near Iowa state average. It is 93% greater than the overall U.S. average.
On 6/18/1974, a category F4 (max. wind speeds 207-260 mph) tornado 11.1 miles away from the Indianola city center killed 2 people and injured 50 people and caused between $5,000,000 and $50,000,000 in damages.
On 6/13/1976, a category F5 (max. wind speeds 261-318 mph) tornado 42.4 miles away from the city center injured 9 people and caused between $5,000,000 and $50,000,000 in damages.
Earthquake activity:
Indianola-area historical earthquake activity is significantly above Iowa state average. It is 230% greater than the overall U.S. average. On 9/3/2016 at 12:02:44, a magnitude 5.8 (5.8 MW, Depth: 3.5 mi, Class: Moderate, Intensity: VI - VII) earthquake occurred 386.5 miles away from the city center On 4/18/2008 at 09:36:59, a magnitude 5.4 (5.1 MB, 4.8 MS, 5.4 MW, 5.2 MW) earthquake occurred 362.1 miles away from Indianola center On 11/6/2011 at 03:53:10, a magnitude 5.7 (5.7 MW, Depth: 3.2 mi) earthquake occurred 438.9 miles away from the city center On 4/18/2008 at 09:36:59, a magnitude 5.2 (5.2 MW, Depth: 8.9 mi) earthquake occurred 362.1 miles away from the city center On 6/10/1987 at 23:48:54, a magnitude 5.1 (4.9 MB, 4.4 MS, 4.6 MS, 5.1 LG) earthquake occurred 348.0 miles away from the city center On 9/26/1990 at 13:18:51, a magnitude 5.0 (4.7 MB, 4.8 LG, 5.0 LG, Depth: 7.7 mi) earthquake occurred 361.4 miles away from Indianola center Magnitude types: regional Lg-wave magnitude (LG), body-wave magnitude (MB), surface-wave magnitude (MS), moment magnitude (MW) Natural disasters: The number of natural disasters in Warren County (15) is near the US average (15).Major Disasters (Presidential) Declared: 13Emergencies Declared: 1Floods: 11, Storms: 11, Tornadoes: 6, Winds: 3, Hurricane: 1, Snow: 1, Winter Storm: 1, Other: 1 (Note: some incidents may be assigned to more than one category). Hospitals and medical centers in Indianola: EASTON GROUP HOME (808 NORTH 14TH STREET) SOUTHVIEW GROUP HOME (101 EAST FOURTH STREET) WARREN COUNTY HEALTH SERVICES (301 NORTH BUXTON SUITE 203)
GOOD SAMARITAN SOCIETY - INDIANOLA (708 SOUTH JEFFERSON PO BOX 319)
THE VILLAGE (1203 NORTH E STREET)
WESTVIEW OF INDIANOLA CARE CENTER (1900 WEST THIRD PLACE)
College/University in Indianola: Simpson College Full-time enrollment: 1,926; Location: 701 North C St; Private, not-for-profit; Website: www.simpson.edu; Offers Master's degree )
Colleges/universities with over 2000 students nearest to Indianola:
Drake University (about 18 miles; Des Moines, IA ; Full-time enrollment: 3,768)
Des Moines Area Community College (about 25 miles; Ankeny, IA ; FT enrollment: 15,337)
Iowa State University (about 47 miles; Ames, IA ; FT enrollment: 28,662)
Indian Hills Community College (about 65 miles; Ottumwa, IA ; FT enrollment: 4,034)
Iowa Central Community College (about 85 miles; Fort Dodge, IA ; FT enrollment: 4,682)
Truman State University (about 97 miles; Kirksville, MO ; FT enrollment: 5,553)
Hawkeye Community College (about 98 miles; Waterloo, IA ; FT enrollment: 7,160)
Public high school in Indianola:
Private high school in Indianola:
Public elementary/middle schools in Indianola: INDIANOLA MIDDLE SCHOOL Students: 729, Location: 403 S 15TH ST, Grades: 6-8)EMERSON ELEMENTARY SCHOOL Students: 507, Location: 1109 E EUCLID, Grades: PK-5)IRVING ELEMENTARY SCHOOL Location: 500 W CLINTON, Grades: KG-5)
WHITTIER ELEMENTARY SCHOOL Location: 1306 W SALEM, Grades: PK-5)
WILDER ELEMENTARY SCHOOL Location: 2303 W. EUCLID, Grades: PK-5)
See full list of schools located in Indianola Library in Indianola: INDIANOLA PUBLIC LIBRARY Operating income: $508,889; Location: 207 N B ST; 41,942 books ; 2,517 audio materials ; 1,761 video materials ; 6 local licensed databases ; 25 state licensed databases ; 136 print serial subscriptions ; 1 electronic serial subscriptions )
User-submitted facts and corrections:
Add another church to the list please: Indianola Community Church
State Representative Mark Davitt, House District 74 Phone: 515-962-9345 (home Phone: 515-281-3221 (office/ while in session e-mail: mark.davitt at legis.state.ia.us 611 W. Ashland, Indianola, IA 50125 web address: http://www.legis.state.ia.us/
Notable locations in Indianola: (A) , Heartland Co-op Elevator (B) , Indianola Country Club (C) , Indianola Tennis Court Complex (D) , Indianola Soccer/Baseball Complex (E) , Warren County Fairgrounds (F) , Deer Run Golf Club (G) , Indianola City Hall (H) , Warren County Courthouse (I) , Warren County Historical Museum (J) , Indianola Police Department (K) , Indianola Fire Department (L) , Warren County Sheriffs Office (M) , Indianola City Public Library (N) , National Balloon Museum (O) , Wallace Hall (P) , Buxton Residence Hall (Q) , College Hall (R) , Mary Berry Hall (S) , Picken Residence Hall (T) . Display/hide their locations on the map
Churches in Indianola include: (A) , Church of Christ (B) , Trinity United Presbyterian Church (C) , Nazarene Church (D) , First Baptist Church (E) , Mount Calvary Lutheran Church (F) , Indianola Regular Baptist Church (G) , Kingdom Hall of Jehovahs Witnesses (H) , First United Methodist Church (I) . Display/hide their locations on the map
Cemeteries: (1) , Indianola City Cemetery (2) . Display/hide their locations on the map
Parks in Indianola include: (1) , Downey Memorial Park (2) , Easton Park (3) , Barker Park (4) , South Town Park (5) , McCord Park (6) , Memorial Park (7) , Dayton Park (8) , Moats Park (9) . Display/hide their locations on the map
Tourist attractions:
Hotels:
Courts:
Birthplace of: George Windle Read - General, Priscilla Lane - Actor, James C. Hickman - Statistician, Junior D. Edwards - Korean War Medal of Honor recipient, Ilo Wallace - Second Lady of the, John Paul Jones (artist) - Painter and printmaker.
Warren County has a predicted average indoor radon screening level greater than 4 pCi/L (pico curies per liter) - Highest Potential Drinking water stations with addresses in Indianola that have no violations reported:
INDIANOLA WATER SUPPLY (Population served: 14,782, Primary Water Source Type: Groundwater)
Average household size: This city:
2.4 peopleIowa:
2.4 people
Percentage of family households: This city:
65.3%Whole state:
64.7%
Percentage of households with unmarried partners: This city:
5.7%Whole state:
6.7%
Likely homosexual households (counted as self-reported same-sex unmarried-partner households)
Lesbian couples: 0.3% of all households Gay men: 0.2% of all households
People in group quarters in Indianola in 2010:
1,191 people in college/university student housing
266 people in nursing facilities/skilled-nursing facilities
45 people in group homes intended for adults
17 people in local jails and other municipal confinement facilities
People in group quarters in Indianola in 2000:
966 people in college dormitories (includes college quarters off campus)
366 people in nursing homes
34 people in other noninstitutional group quarters
28 people in local jails and other confinement facilities (including police lockups)
26 people in homes for the mentally ill
16 people in homes for the mentally retarded
Banks with branches in Indianola (2011 data):
Community Bank: West Roads Branch at 1901 West 2nd Avenue, branch established on 2000/06/09; at 1401 North Jefferson, Orchard Plaza, branch established on 1883/01/01. Info updated 2007/10/30: Bank assets: $159.1 mil, Deposits: $127.9 mil, local headquarters , positive income , Agricultural Specialization, 6 total offices , Holding Company: Community Bancshares Corp.
City State Bank: - Indianola Branch at 1510 North 1st Street, branch established on 2007/03/14. Info updated 2006/11/03: Bank assets: $236.0 mil, Deposits: $196.7 mil, headquarters in Norwalk, IA, positive income , Commercial Lending Specialization, 8 total offices , Holding Company: Albrecht Financial Services, Inc.
Peoples Savings Bank: at 400 East Iowa Avenue, branch established on 1998/11/20. Info updated 2006/11/03: Bank assets: $143.3 mil, Deposits: $122.1 mil, local headquarters , positive income , 4 total offices , Holding Company: Central South Bancorporation, Inc.
Bank of the West: Indianola at 211 E. Boston Avenue, branch established on 1916/01/01. Info updated 2009/11/16: Bank assets: $62,408.3 mil, Deposits: $43,995.2 mil, headquarters in San Francisco, CA, positive income , 647 total offices , Holding Company: Bnp Paribas
Wells Fargo Bank, National Association: Indianola Branch at 509 N Jefferson Street, branch established on 1945/04/07. Info updated 2011/04/05: Bank assets: $1,161,490.0 mil, Deposits: $905,653.0 mil, headquarters in Sioux Falls, SD, positive income , 6395 total offices , Holding Company: Wells Fargo & Company
Regions Bank: Indianola at 114 North Howard Street, branch established on 1919/02/26. Info updated 2011/02/24: Bank assets: $123,368.2 mil, Deposits: $98,301.3 mil, headquarters in Birmingham, AL, positive income , Commercial Lending Specialization, 1778 total offices , Holding Company: Regions Financial Corporation
For population 15 years and over in Indianola:
Never married: 34.9%Now married: 47.7%Separated: 1.1%Widowed: 6.4%Divorced: 10.0% For population 25 years and over in Indianola:
High school or higher: 96.5%Bachelor's degree or higher: 33.1%Graduate or professional degree: 10.9%Unemployed: 5.6%Mean travel time to work (commute): 19.7 minutes
Education Gini index (Inequality in education) Here:
9.4Iowa average:
10.5
Religion statistics for Indianola, IA (based on Warren County data)
Religion Adherents Congregations Mainline Protestant 9,123 29 Catholic 4,646 6 Evangelical Protestant 4,222 28 Other 331 3 None 27,903 -
Source: Clifford Grammich, Kirk Hadaway, Richard Houseal, Dale E.Jones, Alexei Krindatch, Richie Stanley and Richard H.Taylor. 2012. 2010 U.S.Religion Census: Religious Congregations & Membership Study. Association of Statisticians of American Religious Bodies. Jones, Dale E., et al. 2002. Congregations and Membership in the United States 2000. Nashville, TN: Glenmary Research Center. Graphs represent county-level data
Food Environment Statistics: Number of grocery stores : 5This county :
1.13 / 10,000 pop.Iowa :
2.14 / 10,000 pop.
Number of supercenters and club stores : 1Warren County :
0.23 / 10,000 pop.Iowa :
0.23 / 10,000 pop.
Number of convenience stores (no gas) : 1Warren County :
0.23 / 10,000 pop.Iowa :
0.43 / 10,000 pop.
Number of convenience stores (with gas) : 23This county :
5.18 / 10,000 pop.Iowa :
5.55 / 10,000 pop.
Number of full-service restaurants : 17Here :
3.83 / 10,000 pop.Iowa :
8.01 / 10,000 pop.
Adult obesity rate : This county :
30.6%State :
27.3%
Low-income preschool obesity rate : Warren County :
14.0%Iowa :
14.5%
Health and Nutrition:
Average overall health of teeth and gums : People feeling badly about themselves : People not drinking alcohol at all : Indianola:
8.0%State:
10.4%
Average hours sleeping at night : Overweight people : Indianola:
33.5%Iowa:
33.8%
General health condition : Indianola:
61.6%Iowa:
55.9%
Average condition of hearing : Indianola:
80.3%Iowa:
77.7%
More about Health and Nutrition of Indianola, IA Residents
Local government employment and payroll (March 2022)
Function
Full-time employees
Monthly full-time payroll
Average yearly full-time wage
Part-time employees
Monthly part-time payroll
Police Protection - Officers
23 $148,304 $77,376 0 $0 Electric Power
15 $97,468 $77,974 0 $0 Firefighters
13 $95,699 $88,338 24 $25,579 Financial Administration
12 $63,275 $63,275 0 $0 Other and Unallocable
11 $91,317 $99,619 0 $0 Other Government Administration
10 $39,802 $47,762 1 $253 Parks and Recreation
9 $45,893 $61,191 20 $4,522 Streets and Highways
7 $39,255 $67,294 0 $0 Water Supply
6 $39,202 $78,404 0 $0 Sewerage
6 $37,884 $75,768 0 $0 Local Libraries
4 $20,241 $60,723 5 $5,372 Police - Other
3 $13,275 $53,100 5 $4,690 Housing and Community Development (Local)
3 $19,326 $77,304 0 $0 Solid Waste Management
0 $0 2 $2,003
Totals for Government
122 $750,942 $73,863 57 $42,419
Indianola government finances - Expenditure in 2021 (per resident):
Construction - Sewerage: $23,589,000 ($1467.98)
Regular Highways: $1,399,000 ($87.06)Electric Utilities: $776,000 ($48.29)Water Utilities: $459,000 ($28.56)Current Operations - Electric Utilities: $13,814,000 ($859.67)
Police Protection: $3,191,000 ($198.58)Miscellaneous Commercial Activities - Other: $2,682,000 ($166.91)Sewerage: $1,790,000 ($111.39)Health - Other: $1,701,000 ($105.86)Parks and Recreation: $1,487,000 ($92.54)Water Utilities: $1,461,000 ($90.92)Regular Highways: $1,347,000 ($83.83)Central Staff Services: $748,000 ($46.55)Libraries: $641,000 ($39.89)Local Fire Protection: $592,000 ($36.84)General - Other: $546,000 ($33.98)Solid Waste Management: $418,000 ($26.01)Protective Inspection and Regulation - Other: $414,000 ($25.76)Financial Administration: $408,000 ($25.39)General Public Buildings: $282,000 ($17.55)Judicial and Legal Services: $55,000 ($3.42)Electric Utilities - Interest on Debt: $358,000 ($22.28)
General - Interest on Debt: $1,124,000 ($69.95)
Other Capital Outlay - General - Other: $986,000 ($61.36)
Miscellaneous Commercial Activities - Other: $413,000 ($25.70)Total Salaries and Wages: $8,561,000 ($532.76)
Water Utilities - Interest on Debt: $5,000 ($0.31)
Indianola government finances - Revenue in 2021 (per resident):
Charges - Sewerage: $4,382,000 ($272.70)
Miscellaneous Commercial Activities: $3,518,000 ($218.93)Other: $683,000 ($42.50)Solid Waste Management: $386,000 ($24.02)Parks and Recreation: $158,000 ($9.83)Federal Intergovernmental - Other: $554,000 ($34.48)
Local Intergovernmental - Other: $1,495,000 ($93.04)
Miscellaneous - Rents: $553,000 ($34.41)
Interest Earnings: $501,000 ($31.18)General Revenue - Other: $441,000 ($27.44)Fines and Forfeits: $56,000 ($3.48)Special Assessments: $30,000 ($1.87)Sale of Property: $7,000 ($0.44)Revenue - Electric Utilities: $16,096,000 ($1001.68)
Water Utilities: $2,524,000 ($157.07)State Intergovernmental - Highways: $2,212,000 ($137.66)
General Local Government Support: $208,000 ($12.94)Other: $123,000 ($7.65)Tax - Property: $10,223,000 ($636.19)
General Sales and Gross Receipts: $2,248,000 ($139.90)Public Utilities Sales: $364,000 ($22.65)Other License: $267,000 ($16.62)Other Selective Sales: $137,000 ($8.53)
Indianola government finances - Debt in 2021 (per resident):
Long Term Debt - Outstanding Unspecified Public Purpose: $75,385,000 ($4691.33)
Beginning Outstanding - Unspecified Public Purpose: $51,322,000 ($3193.85)Issue, Unspecified Public Purpose: $31,818,000 ($1980.09)Retired Unspecified Public Purpose: $7,755,000 ($482.61)
Indianola government finances - Cash and Securities in 2021 (per resident):
Other Funds - Cash and Securities: $64,000 ($3.98)
Sinking Funds - Cash and Securities: $52,479,000 ($3265.85)
Businesses in Indianola, IA
Name Count Name Count
Arby's 1 Nike 1 Burger King 1 Pizza Hut 1 Curves 1 Quiznos 1 Dairy Queen 1 RadioShack 1 FedEx 2 Subway 2 Ford 1 Super 8 1 H&R Block 1 True Value 1 Jimmy John's 1 U-Haul 1 Little Caesars Pizza 1 U.S. Cellular 1 MasterBrand Cabinets 1 UPS 3 Maurices 1 Walgreens 1 McDonald's 1 Walmart 1
Strongest AM radio stations in Indianola:
KXLQ (1490 AM; 1 kW; INDIANOLA, IA; Owner: WARREN BROADCASTING, INC.)
WHO (1040 AM; 50 kW; DES MOINES, IA; Owner: CITICASTERS LICENSES, L.P.)
KPSZ (940 AM; 10 kW; DES MOINES, IA; Owner: SAGA COMMUNICATIONS OF IOWA, LLC)
KBGG (1700 AM; 10 kW; DES MOINES, IA; Owner: CITADEL BROADCASTING COMPANY)
KRNT (1350 AM; 5 kW; DES MOINES, IA; Owner: SAGA COMMUNICATIONS OF IOWA, LLC)
KWKY (1150 AM; 1 kW; DES MOINES, IA; Owner: PUTBRESE COMMUNICATIONS, LTD.)
KXNO (1460 AM; 5 kW; DES MOINES, IA; Owner: CAPSTAR TX LIMITED PARTNERSHIP)
KXEL (1540 AM; 50 kW; WATERLOO, IA; Owner: KXEL BROADCASTING COMPANY, INC.)
WOI (640 AM; 5 kW; AMES, IA; Owner: IOWA STATE UNIV., OF SCIENCE & TECH.)
KOIL (1020 AM; 50 kW; PLATTSMOUTH, NE; Owner: WAITT RADIO, INC.)
KFAB (1110 AM; 50 kW; OMAHA, NE; Owner: CAPSTAR TX LIMITED PARTNERSHIP)
WHB (810 AM; 50 kW; KANSAS CITY, MO; Owner: UNION BROADCASTING, INC.)
KKAR (1290 AM; 50 kW; OMAHA, NE; Owner: WAITT RADIO, INC.)
Strongest FM radio stations in Indianola:
KSTM (88.9 FM; INDIANOLA, IA; Owner: SIMPSON COLLEGE)
KIOA (93.3 FM; DES MOINES, IA; Owner: SAGA COMMUNICATIONS OF IOWA, LLC)
KAZR (103.3 FM; PELLA, IA; Owner: SAGA COMMUNICATIONS OF IOWA, LLC)
KGGO (94.9 FM; DES MOINES, IA; Owner: CITADEL BROADCASTING COMPANY)
KMXD (100.3 FM; DES MOINES, IA; Owner: CITICASTERS LICENSES, L.P.)
WOI-FM (90.1 FM; AMES, IA; Owner: IOWA STATE UNIVERSITY OF SCI & TECH)
KSTZ (102.5 FM; DES MOINES, IA; Owner: SAGA COMMUNICATIONS OF IOWA, LLC)
KJMC (89.3 FM; DES MOINES, IA; Owner: MINORITY COMMUNICATIONS, INC.)
KKDM (107.5 FM; DES MOINES, IA; Owner: CLEAR CHANNEL BROADCASTING LICENSES, INC.)
KDFR (91.3 FM; DES MOINES, IA; Owner: FAMILY STATIONS, INC.)
KJJY (92.5 FM; WEST DES MOINES, IA; Owner: CITADEL BROADCASTING COMPANY)
KJJC (107.1 FM; OSCEOLA, IA; Owner: THOMAS H. BURKE, RECEIVER FOR LIFESTYLE COMMUNICATIONS CORP.)
K269EJ (101.7 FM; DES MOINES, IA; Owner: UNIVERSITY OF NORTHERN IOWA)
KLTI-FM (104.1 FM; AMES, IA; Owner: SAGA COMMUNICATIONS OF IOWA, LLC)
KHKI (97.3 FM; DES MOINES, IA; Owner: CITADEL BROADCASTING COMPANY)
KZZQ (99.5 FM; WINTERSET, IA; Owner: POSITIVE IMPACT MEDIA, INC.)
KVJZ (106.3 FM; ANKENY, IA; Owner: CITICASTERS LICENSES, L.P.)
KELR-FM (105.3 FM; CHARITON, IA; Owner: FMC BROADCASTING, INC.)
TV broadcast stations around Indianola:
WOI-TV (Channel 5; AMES, IA; Owner: CAPITAL COMMUNICATIONS COMPANY, INC.)
WBXF-CA (Channel 4; DES MOINES, IA; Owner: THE BOX WORLDWIDE LLC)
KDIN-TV (Channel 11; DES MOINES, IA; Owner: IOWA PUBLIC BROADCASTING BOARD)
KPWB-TV (Channel 23; AMES, IA; Owner: PAPPAS TELECASTING OF IOWA, L.L.C.)
KDSM-TV (Channel 17; DES MOINES, IA; Owner: KDSM LICENSEE, LLC)
KCCI (Channel 8; DES MOINES, IA; Owner: DES MOINES HEARST-ARGYLE TV, INC.)
WHO-TV (Channel 13; DES MOINES, IA; Owner: NEW YORK TIMES MANAGEMENT SERVICES)
KRPG-LP (Channel 43; DES MOINES, IA; Owner: TIGER EYE BROADCASTING CORPORATION)
K41DD (Channel 41; DES MOINES, IA; Owner: VENTANA TELEVISION, INC.)
K29EA (Channel 29; DES MOINES, IA; Owner: TV-45, INC.)
Medal of Honor Recipients
Medal of Honor Recipient born in Indianola: Junior D. Edwards.
National Bridge Inventory (NBI) Statistics 22 Number of bridges351ft / 107m Total length31,195 Total average daily traffic1,889 Total average daily truck traffic31,195 Total future (year 2040) average daily traffic
New bridges - historical statistics
1 1940-1949 2 1950-1959 4 1960-1969 3 1970-1979 3 1980-1989 3 1990-1999 1 2000-2009 5 2010-2019
See full National Bridge Inventory statistics for Indianola, IA
Home Mortgage Disclosure Act Aggregated Statistics For Year 2009(Based on 1 full and 3 partial tracts) A) FHA, FSA/RHS & VA B) Conventional C) Refinancings D) Home Improvement Loans E) Loans on Dwellings For 5+ Families F) Non-occupant Loans on G) Loans On Manufactured Number Average Value Number Average Value Number Average Value Number Average Value Number Average Value Number Average Value Number Average Value
LOANS ORIGINATED 77 $142,317 52 $139,980 361 $151,893 24 $64,813 2 $1,069,500 17 $103,182 5 $135,580 APPLICATIONS APPROVED, NOT ACCEPTED 4 $111,735 5 $116,426 26 $130,993 2 $12,420 0 $0 3 $107,463 0 $0 APPLICATIONS DENIED 13 $143,546 10 $143,897 75 $144,267 19 $23,945 0 $0 5 $45,326 3 $66,127 APPLICATIONS WITHDRAWN 7 $122,466 7 $143,846 93 $162,577 8 $53,005 0 $0 2 $149,000 0 $0 FILES CLOSED FOR INCOMPLETENESS 0 $0 2 $65,260 8 $134,632 0 $0 0 $0 1 $58,220 0 $0
Aggregated Statistics For Year 2008(Based on 1 full and 3 partial tracts) A) FHA, FSA/RHS & VA B) Conventional C) Refinancings D) Home Improvement Loans E) Loans on Dwellings For 5+ Families F) Non-occupant Loans on G) Loans On Manufactured Number Average Value Number Average Value Number Average Value Number Average Value Number Average Value Number Average Value Number Average Value
LOANS ORIGINATED 50 $140,372 97 $121,823 190 $125,629 47 $46,361 1 $1,156,000 33 $84,294 2 $4,435 APPLICATIONS APPROVED, NOT ACCEPTED 3 $146,653 6 $81,640 31 $127,955 5 $15,572 0 $0 1 $60,640 1 $41,580 APPLICATIONS DENIED 5 $97,620 13 $124,152 122 $127,354 27 $58,940 0 $0 3 $69,150 4 $93,118 APPLICATIONS WITHDRAWN 1 $115,510 7 $119,514 51 $154,400 6 $28,907 0 $0 1 $149,000 1 $64,970 FILES CLOSED FOR INCOMPLETENESS 2 $178,625 2 $63,730 12 $145,882 1 $9,530 0 $0 2 $45,500 0 $0
Aggregated Statistics For Year 2007(Based on 1 full and 3 partial tracts) A) FHA, FSA/RHS & VA B) Conventional C) Refinancings D) Home Improvement Loans E) Loans on Dwellings For 5+ Families F) Non-occupant Loans on G) Loans On Manufactured Number Average Value Number Average Value Number Average Value Number Average Value Number Average Value Number Average Value Number Average Value
LOANS ORIGINATED 19 $169,864 213 $118,410 203 $107,283 57 $33,947 5 $779,812 43 $90,006 4 $51,955 APPLICATIONS APPROVED, NOT ACCEPTED 0 $0 24 $105,267 51 $115,633 11 $31,445 1 $146,000 4 $107,578 1 $22,520 APPLICATIONS DENIED 4 $108,132 37 $114,568 123 $125,577 42 $45,240 1 $150,000 7 $123,936 7 $39,946 APPLICATIONS WITHDRAWN 2 $185,785 12 $126,152 42 $136,297 7 $52,474 0 $0 2 $123,910 1 $15,860 FILES CLOSED FOR INCOMPLETENESS 1 $82,640 8 $126,538 24 $166,779 1 $18,000 0 $0 0 $0 0 $0
Aggregated Statistics For Year 2006(Based on 1 full and 3 partial tracts) A) FHA, FSA/RHS & VA B) Conventional C) Refinancings D) Home Improvement Loans E) Loans on Dwellings For 5+ Families F) Non-occupant Loans on G) Loans On Manufactured Number Average Value Number Average Value Number Average Value Number Average Value Number Average Value Number Average Value Number Average Value
LOANS ORIGINATED 18 $145,467 234 $123,573 220 $97,805 58 $39,798 2 $1,666,920 23 $100,065 2 $39,415 APPLICATIONS APPROVED, NOT ACCEPTED 4 $143,910 28 $128,636 54 $91,397 9 $42,006 1 $495,750 4 $58,932 5 $40,544 APPLICATIONS DENIED 2 $204,070 26 $100,854 128 $116,541 24 $25,925 0 $0 1 $5,000 7 $73,029 APPLICATIONS WITHDRAWN 2 $140,205 13 $91,603 66 $120,754 7 $43,093 0 $0 3 $89,623 2 $38,505 FILES CLOSED FOR INCOMPLETENESS 0 $0 13 $128,297 41 $113,226 1 $122,000 0 $0 3 $59,107 0 $0
Aggregated Statistics For Year 2005(Based on 1 full and 3 partial tracts) A) FHA, FSA/RHS & VA B) Conventional C) Refinancings D) Home Improvement Loans E) Loans on Dwellings For 5+ Families F) Non-occupant Loans on G) Loans On Manufactured Number Average Value Number Average Value Number Average Value Number Average Value Number Average Value Number Average Value Number Average Value
LOANS ORIGINATED 16 $126,032 267 $112,512 262 $109,449 49 $27,797 2 $612,500 41 $93,356 5 $44,382 APPLICATIONS APPROVED, NOT ACCEPTED 1 $164,000 40 $105,135 47 $111,687 6 $19,458 0 $0 3 $101,217 2 $31,460 APPLICATIONS DENIED 2 $95,035 38 $104,589 129 $112,673 30 $23,283 0 $0 3 $39,347 6 $12,995 APPLICATIONS WITHDRAWN 1 $112,630 45 $109,733 80 $116,868 8 $54,572 0 $0 5 $89,036 1 $53,940 FILES CLOSED FOR INCOMPLETENESS 0 $0 10 $121,027 43 $122,319 2 $230,000 0 $0 1 $47,590 0 $0
Aggregated Statistics For Year 2004(Based on 1 full and 3 partial tracts) A) FHA, FSA/RHS & VA B) Conventional C) Refinancings D) Home Improvement Loans E) Loans on Dwellings For 5+ Families F) Non-occupant Loans on G) Loans On Manufactured Number Average Value Number Average Value Number Average Value Number Average Value Number Average Value Number Average Value Number Average Value
LOANS ORIGINATED 17 $133,255 204 $110,049 286 $108,036 38 $35,778 7 $776,846 39 $87,231 8 $67,764 APPLICATIONS APPROVED, NOT ACCEPTED 1 $116,950 30 $96,857 40 $105,140 3 $7,333 0 $0 3 $57,473 1 $20,000 APPLICATIONS DENIED 3 $181,433 36 $97,741 106 $98,289 28 $26,661 0 $0 8 $67,128 8 $49,180 APPLICATIONS WITHDRAWN 1 $244,000 27 $135,580 82 $114,261 6 $121,940 0 $0 1 $44,420 1 $20,000 FILES CLOSED FOR INCOMPLETENESS 2 $107,080 11 $149,954 39 $129,733 1 $139,930 0 $0 2 $71,055 0 $0
Aggregated Statistics For Year 2003(Based on 1 full and 3 partial tracts) A) FHA, FSA/RHS & VA B) Conventional C) Refinancings D) Home Improvement Loans E) Loans on Dwellings For 5+ Families F) Non-occupant Loans on Number Average Value Number Average Value Number Average Value Number Average Value Number Average Value Number Average Value
LOANS ORIGINATED 24 $110,611 187 $113,106 721 $110,957 57 $15,838 8 $377,596 37 $79,915 APPLICATIONS APPROVED, NOT ACCEPTED 2 $104,040 21 $109,967 67 $95,151 11 $24,043 0 $0 1 $35,000 APPLICATIONS DENIED 1 $119,550 21 $97,800 178 $107,345 22 $21,304 0 $0 6 $74,752 APPLICATIONS WITHDRAWN 1 $87,340 16 $87,632 103 $101,197 2 $45,045 0 $0 1 $43,310 FILES CLOSED FOR INCOMPLETENESS 2 $100,420 9 $127,729 24 $101,885 2 $23,270 0 $0 1 $127,000
Aggregated Statistics For Year 2002(Based on 1 full and 3 partial tracts) A) FHA, FSA/RHS & VA B) Conventional C) Refinancings D) Home Improvement Loans E) Loans on Dwellings For 5+ Families F) Non-occupant Loans on Number Average Value Number Average Value Number Average Value Number Average Value Number Average Value Number Average Value
LOANS ORIGINATED 35 $111,465 169 $102,588 414 $101,203 44 $20,072 1 $206,230 22 $70,597 APPLICATIONS APPROVED, NOT ACCEPTED 1 $123,000 24 $124,282 49 $85,434 10 $21,093 0 $0 2 $50,610 APPLICATIONS DENIED 2 $75,250 26 $95,110 104 $103,750 15 $9,817 0 $0 1 $19,830 APPLICATIONS WITHDRAWN 1 $74,500 19 $98,937 91 $104,554 5 $21,868 0 $0 2 $31,330 FILES CLOSED FOR INCOMPLETENESS 0 $0 8 $107,281 29 $102,708 0 $0 0 $0 2 $73,680
Aggregated Statistics For Year 2001(Based on 1 full and 3 partial tracts) A) FHA, FSA/RHS & VA B) Conventional C) Refinancings D) Home Improvement Loans E) Loans on Dwellings For 5+ Families F) Non-occupant Loans on Number Average Value Number Average Value Number Average Value Number Average Value Number Average Value Number Average Value
LOANS ORIGINATED 44 $104,618 154 $101,462 358 $98,036 55 $18,816 4 $88,378 19 $71,932 APPLICATIONS APPROVED, NOT ACCEPTED 1 $107,060 20 $79,917 40 $83,264 7 $24,544 0 $0 5 $72,594 APPLICATIONS DENIED 1 $99,620 39 $73,058 93 $89,175 19 $17,932 0 $0 4 $69,615 APPLICATIONS WITHDRAWN 0 $0 12 $103,569 60 $97,430 1 $13,860 0 $0 4 $74,725 FILES CLOSED FOR INCOMPLETENESS 0 $0 3 $86,743 22 $105,612 0 $0 0 $0 0 $0
Aggregated Statistics For Year 2000(Based on 1 full and 3 partial tracts) A) FHA, FSA/RHS & VA B) Conventional C) Refinancings D) Home Improvement Loans E) Loans on Dwellings For 5+ Families F) Non-occupant Loans on Number Average Value Number Average Value Number Average Value Number Average Value Number Average Value Number Average Value
LOANS ORIGINATED 30 $97,216 119 $96,051 88 $83,787 70 $17,664 1 $193,540 12 $78,099 APPLICATIONS APPROVED, NOT ACCEPTED 2 $58,695 19 $53,438 24 $81,384 12 $37,944 0 $0 2 $114,340 APPLICATIONS DENIED 1 $121,000 51 $57,362 56 $67,181 22 $13,038 0 $0 4 $68,138 APPLICATIONS WITHDRAWN 2 $104,160 15 $82,583 38 $67,298 1 $100,000 0 $0 2 $36,885 FILES CLOSED FOR INCOMPLETENESS 0 $0 3 $83,520 9 $98,361 0 $0 0 $0 0 $0
Aggregated Statistics For Year 1999(Based on 1 full and 3 partial tracts) A) FHA, FSA/RHS & VA B) Conventional C) Refinancings D) Home Improvement Loans E) Loans on Dwellings For 5+ Families F) Non-occupant Loans on Number Average Value Number Average Value Number Average Value Number Average Value Number Average Value Number Average Value
LOANS ORIGINATED 49 $91,705 152 $92,260 173 $83,015 52 $16,190 3 $346,330 16 $59,612 APPLICATIONS APPROVED, NOT ACCEPTED 1 $112,000 12 $62,820 22 $71,955 14 $22,681 0 $0 3 $28,607 APPLICATIONS DENIED 2 $76,520 32 $43,086 50 $58,986 30 $20,203 0 $0 2 $57,190 APPLICATIONS WITHDRAWN 1 $57,000 3 $90,150 28 $72,991 2 $12,425 0 $0 5 $54,490 FILES CLOSED FOR INCOMPLETENESS 0 $0 0 $0 12 $82,704 0 $0 0 $0 0 $0
Detailed HMDA statistics for the following Tracts:
0207.00
, 0208.00 , 0209.00 , 0210.00
Private Mortgage Insurance Companies Aggregated Statistics For Year 2009(Based on 1 full and 3 partial tracts) A) Conventional B) Refinancings C) Non-occupant Loans on Number Average Value Number Average Value Number Average Value
LOANS ORIGINATED 12 $181,697 17 $156,283 0 $0 APPLICATIONS APPROVED, NOT ACCEPTED 2 $86,440 7 $184,527 1 $375,640 APPLICATIONS DENIED 3 $142,813 2 $115,650 0 $0 APPLICATIONS WITHDRAWN 0 $0 2 $132,975 0 $0 FILES CLOSED FOR INCOMPLETENESS 0 $0 1 $97,030 0 $0
Aggregated Statistics For Year 2008(Based on 1 full and 3 partial tracts) A) Conventional B) Refinancings C) Non-occupant Loans on D) Loans On Manufactured Number Average Value Number Average Value Number Average Value Number Average Value
LOANS ORIGINATED 43 $147,652 28 $163,463 5 $101,276 0 $0 APPLICATIONS APPROVED, NOT ACCEPTED 10 $169,019 13 $154,866 1 $80,110 0 $0 APPLICATIONS DENIED 1 $58,910 0 $0 0 $0 1 $58,910 APPLICATIONS WITHDRAWN 2 $120,500 1 $103,090 0 $0 0 $0 FILES CLOSED FOR INCOMPLETENESS 0 $0 2 $186,500 2 $186,500 0 $0
Aggregated Statistics For Year 2007(Based on 1 full and 3 partial tracts) A) Conventional B) Refinancings C) Non-occupant Loans on D) Loans On Manufactured Number Average Value Number Average Value Number Average Value Number Average Value
LOANS ORIGINATED 80 $130,911 28 $172,934 3 $107,537 1 $94,430 APPLICATIONS APPROVED, NOT ACCEPTED 5 $225,572 7 $228,239 0 $0 0 $0 APPLICATIONS DENIED 0 $0 1 $141,800 0 $0 0 $0 APPLICATIONS WITHDRAWN 3 $93,653 4 $159,725 0 $0 0 $0 FILES CLOSED FOR INCOMPLETENESS 0 $0 1 $71,390 0 $0 0 $0
Aggregated Statistics For Year 2006(Based on 1 full and 3 partial tracts) A) Conventional B) Refinancings C) Non-occupant Loans on Number Average Value Number Average Value Number Average Value
LOANS ORIGINATED 61 $129,411 21 $138,606 2 $119,375 APPLICATIONS APPROVED, NOT ACCEPTED 4 $174,352 12 $150,433 0 $0 APPLICATIONS DENIED 0 $0 0 $0 0 $0 APPLICATIONS WITHDRAWN 3 $155,667 5 $153,418 0 $0 FILES CLOSED FOR INCOMPLETENESS 1 $43,310 0 $0 0 $0
Aggregated Statistics For Year 2005(Based on 1 full and 3 partial tracts) A) Conventional B) Refinancings C) Non-occupant Loans on D) Loans On Manufactured Number Average Value Number Average Value Number Average Value Number Average Value
LOANS ORIGINATED 70 $127,856 29 $156,703 2 $94,500 1 $146,000 APPLICATIONS APPROVED, NOT ACCEPTED 16 $140,589 20 $170,428 2 $110,500 0 $0 APPLICATIONS DENIED 2 $89,000 1 $151,000 0 $0 0 $0 APPLICATIONS WITHDRAWN 4 $160,000 0 $0 0 $0 0 $0 FILES CLOSED FOR INCOMPLETENESS 1 $83,290 1 $69,010 0 $0 0 $0
Aggregated Statistics For Year 2004(Based on 1 full and 3 partial tracts) A) Conventional B) Refinancings C) Non-occupant Loans on Number Average Value Number Average Value Number Average Value
LOANS ORIGINATED 49 $124,981 43 $142,334 5 $86,412 APPLICATIONS APPROVED, NOT ACCEPTED 13 $146,159 23 $125,361 1 $61,040 APPLICATIONS DENIED 0 $0 1 $523,080 0 $0 APPLICATIONS WITHDRAWN 7 $130,853 5 $116,302 1 $219,170 FILES CLOSED FOR INCOMPLETENESS 2 $105,250 0 $0 0 $0
Aggregated Statistics For Year 2003(Based on 1 full and 3 partial tracts) A) Conventional B) Refinancings C) Non-occupant Loans on Number Average Value Number Average Value Number Average Value
LOANS ORIGINATED 66 $120,981 85 $131,806 0 $0 APPLICATIONS APPROVED, NOT ACCEPTED 11 $118,355 28 $143,184 2 $94,685 APPLICATIONS DENIED 0 $0 0 $0 0 $0 APPLICATIONS WITHDRAWN 6 $144,685 6 $146,237 0 $0 FILES CLOSED FOR INCOMPLETENESS 1 $109,460 0 $0 0 $0
Aggregated Statistics For Year 2002(Based on 1 full and 3 partial tracts) A) Conventional B) Refinancings C) Non-occupant Loans on Number Average Value Number Average Value Number Average Value
LOANS ORIGINATED 72 $121,823 56 $121,395 2 $82,605 APPLICATIONS APPROVED, NOT ACCEPTED 11 $120,779 13 $122,101 0 $0 APPLICATIONS DENIED 0 $0 1 $136,170 0 $0 APPLICATIONS WITHDRAWN 4 $142,358 4 $161,155 0 $0 FILES CLOSED FOR INCOMPLETENESS 0 $0 0 $0 0 $0
Aggregated Statistics For Year 2001(Based on 1 full and 3 partial tracts) A) Conventional B) Refinancings C) Non-occupant Loans on Number Average Value Number Average Value Number Average Value
LOANS ORIGINATED 68 $114,875 54 $118,422 1 $71,040 APPLICATIONS APPROVED, NOT ACCEPTED 8 $107,869 13 $88,658 0 $0 APPLICATIONS DENIED 1 $124,750 1 $105,000 0 $0 APPLICATIONS WITHDRAWN 2 $94,660 1 $112,690 0 $0 FILES CLOSED FOR INCOMPLETENESS 0 $0 0 $0 0 $0
Aggregated Statistics For Year 2000(Based on 1 full and 3 partial tracts) A) Conventional B) Refinancings Number Average Value Number Average Value
LOANS ORIGINATED 45 $124,488 12 $131,882 APPLICATIONS APPROVED, NOT ACCEPTED 0 $0 2 $114,435 APPLICATIONS DENIED 0 $0 1 $140,860 APPLICATIONS WITHDRAWN 2 $96,345 3 $152,297 FILES CLOSED FOR INCOMPLETENESS 0 $0 0 $0
Aggregated Statistics For Year 1999(Based on 1 full and 3 partial tracts) A) Conventional B) Refinancings C) Non-occupant Loans on Number Average Value Number Average Value Number Average Value
LOANS ORIGINATED 46 $112,641 15 $110,684 1 $90,600 APPLICATIONS APPROVED, NOT ACCEPTED 7 $124,889 3 $94,080 0 $0 APPLICATIONS DENIED 0 $0 2 $104,205 0 $0 APPLICATIONS WITHDRAWN 2 $128,060 0 $0 0 $0 FILES CLOSED FOR INCOMPLETENESS 0 $0 0 $0 0 $0
Detailed PMIC statistics for the following Tracts:
0207.00
, 0208.00 , 0209.00 , 0210.00 Fire-safe hotels and motels in Indianola, Iowa:
Apple Tree Inn, 1215 N Jefferson, Indianola, Iowa 50125 Phone: (515) 961-0551, Fax: (515) 961-0555
Quality Inn, 1701 N Jefferson Way, Indianola, Iowa 50125 Phone: (515) 961-0058, Fax: (515) 961-0709
Country Inn & Suites By Carlson - Indianola, 501 E Trl Ridge Ave, Indianola, Iowa 50125 Phone: (515) 962-5777
All 3 fire-safe hotels and motels in Indianola, Iowa
Most common first names in Indianola, IA among deceased individuals Name Count Lived (average)
Mary 87 82.9 years William 77 76.0 years Robert 71 71.7 years John 70 77.2 years Charles 60 78.2 years James 50 78.1 years George 45 78.7 years Helen 44 81.9 years Ruth 43 82.8 years Donald 42 72.5 years
Most common last names in Indianola, IA among deceased individuals Last name Count Lived (average)
Smith 39 80.8 years Miller 35 78.2 years Brown 28 76.2 years Wood 28 79.8 years Wilson 24 80.3 years King 23 82.2 years Johnson 22 75.1 years Williams 21 83.1 years Jones 20 72.7 years Young 20 76.8 years
Indianola compared to Iowa state average:
Unemployed percentage below state average. Black race population percentage significantly below state average. Hispanic race population percentage below state average. Median age significantly below state average. Foreign-born population percentage below state average. Length of stay since moving in above state average. House age below state average. Percentage of population with a bachelor's degree or higher above state average.
Top Patent Applicants
Roderick D. Lee (8)
Jos Kobussen (2)
John David Canny (2)
David Alexander (2)
Jos J. Kobussen (2)
J. Ewing Lambert (2)
Richard J. Erwin (1)
Joe Gezel (1)
Eric L. Baker (1)
Thomas Nicholson (1)
Total of 29 patent applications in 2008-2024.


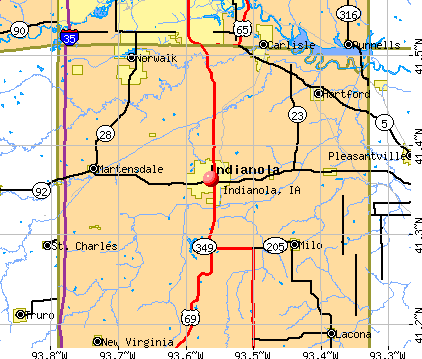


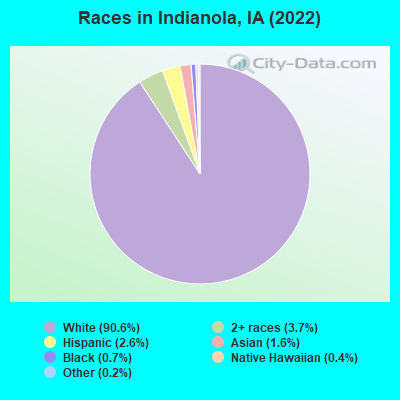
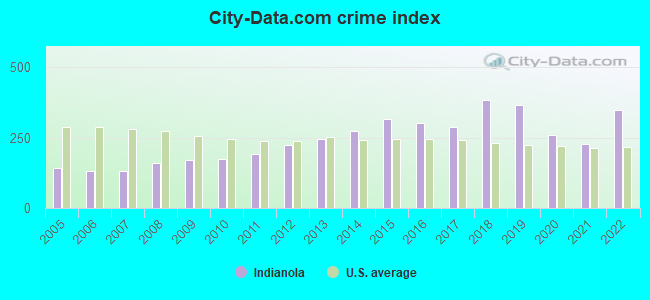
 Recent articles from our blog. Our writers, many of them Ph.D. graduates or candidates, create easy-to-read articles on a wide variety of topics.

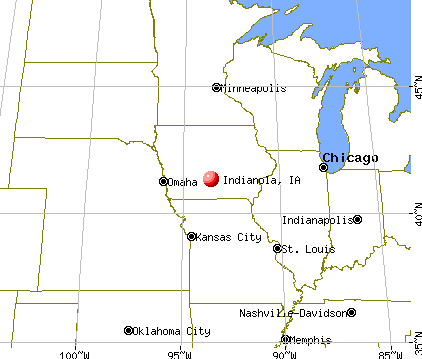
 (16.1 miles
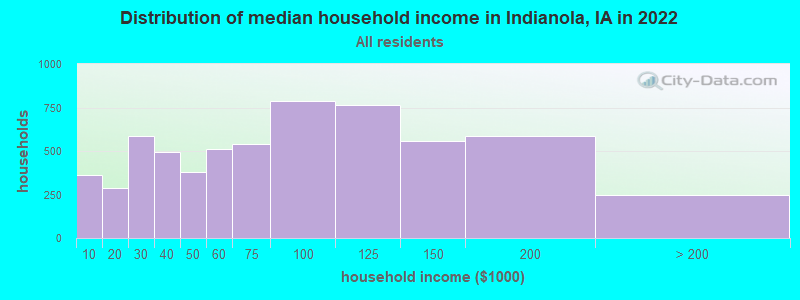
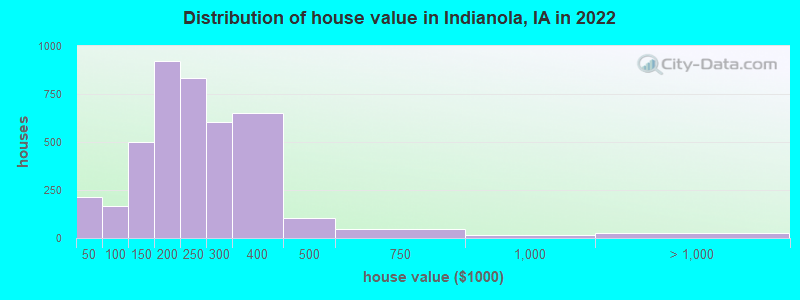
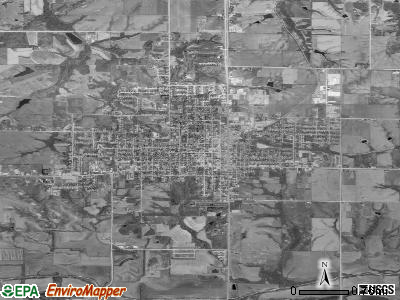
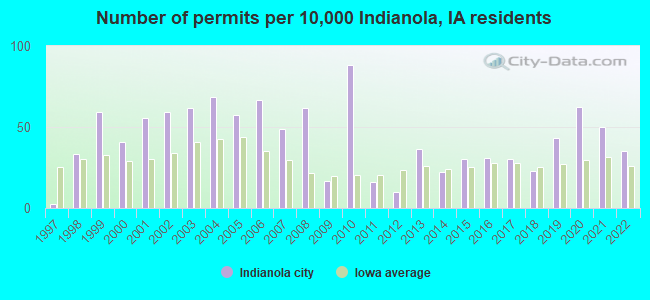
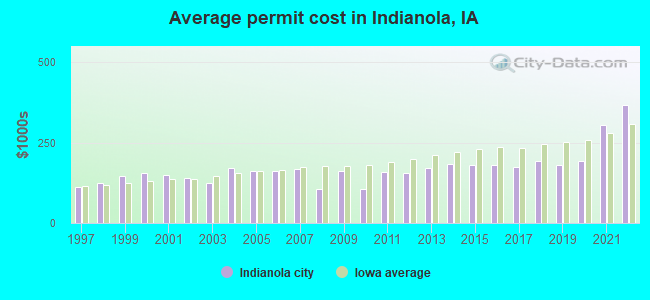
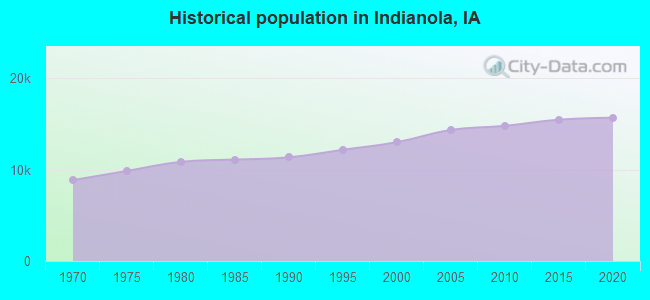
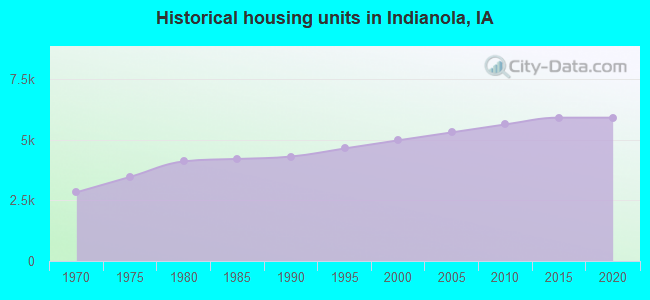
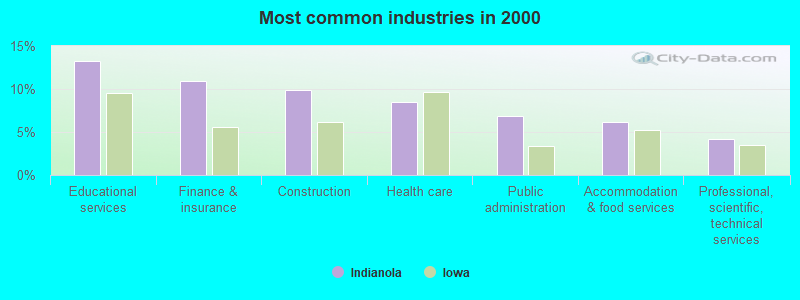
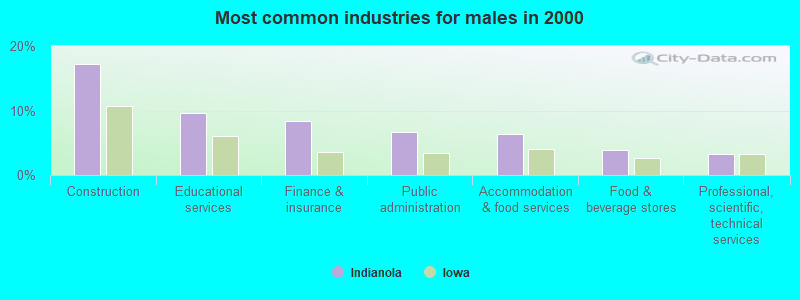
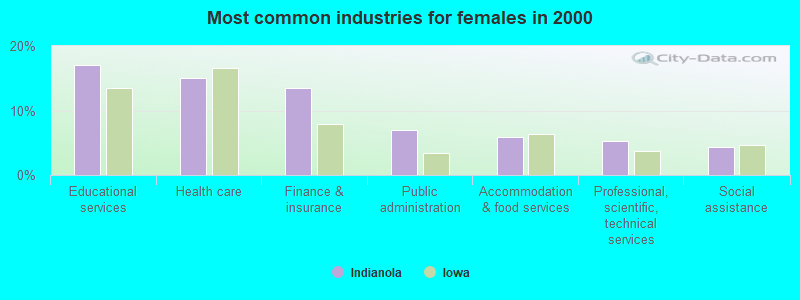
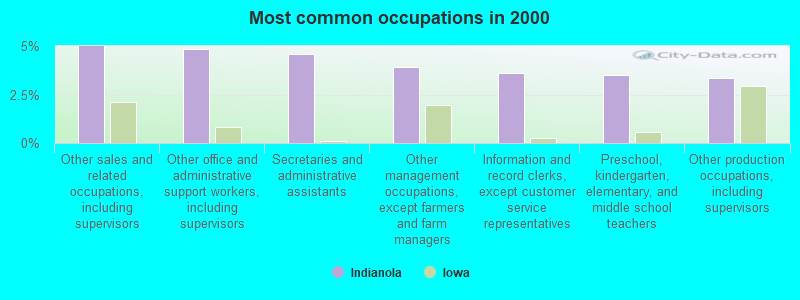
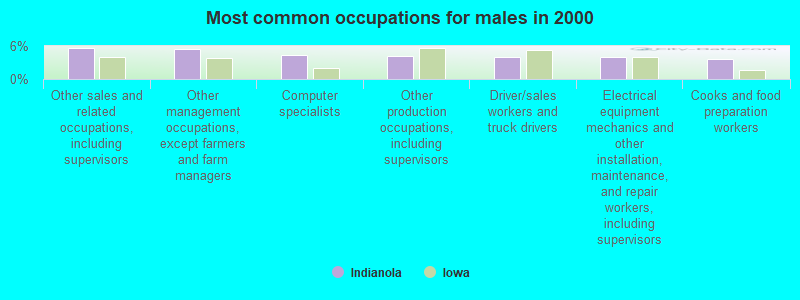
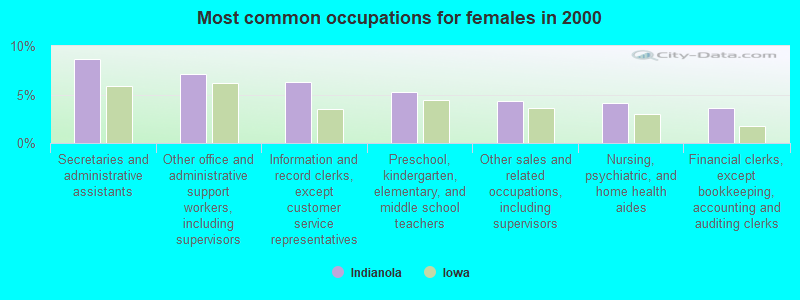


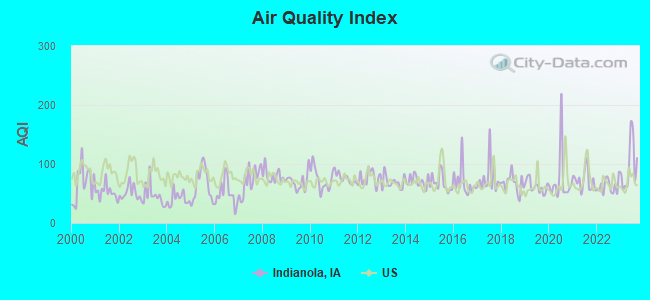
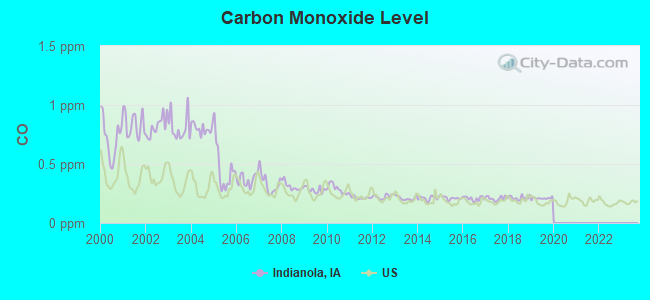
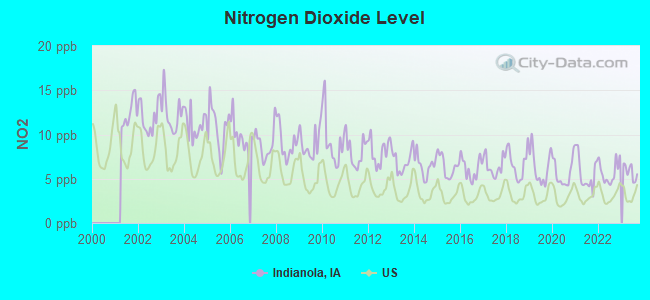
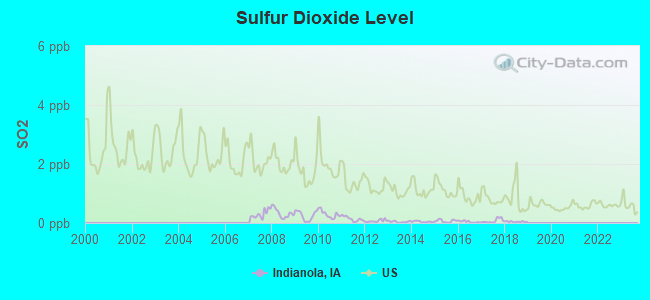
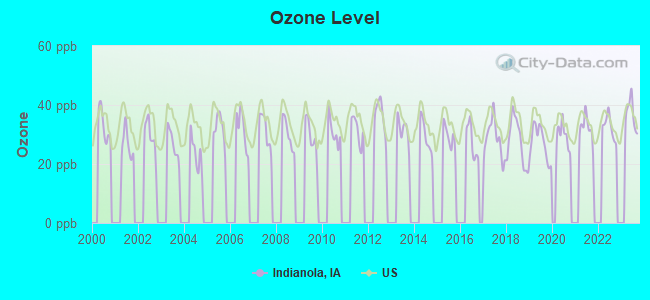
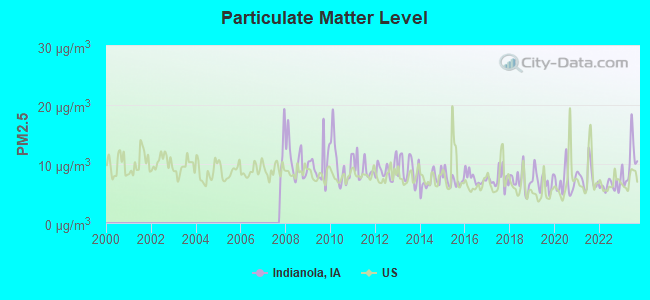

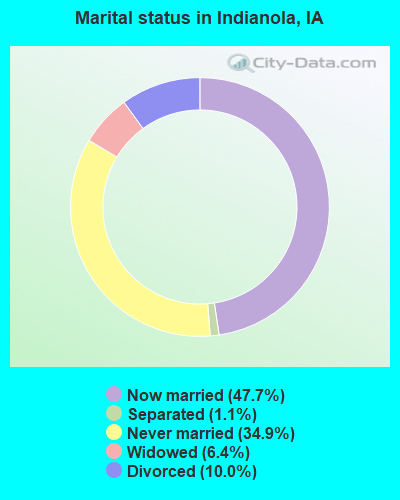
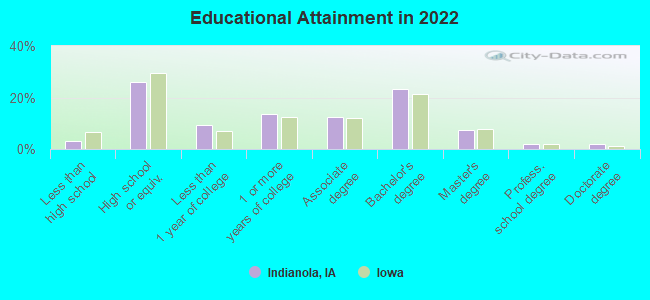
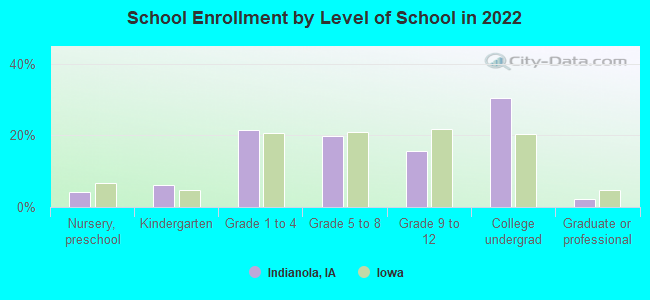
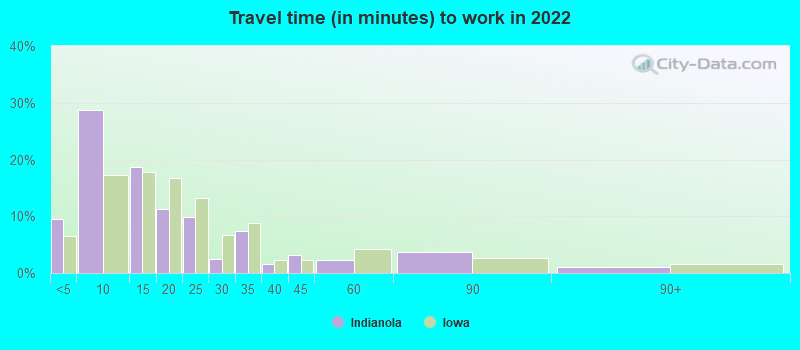
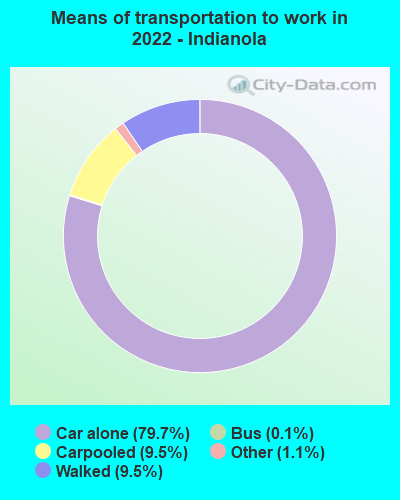
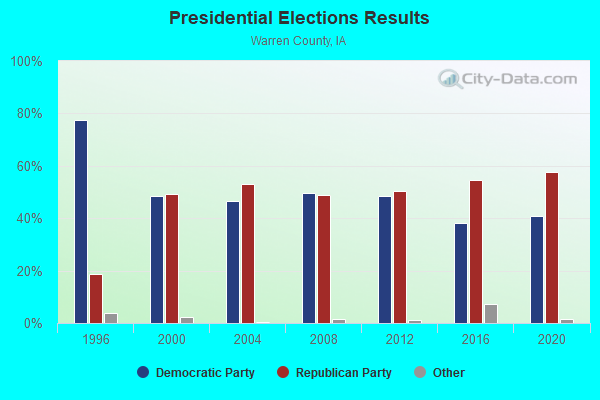
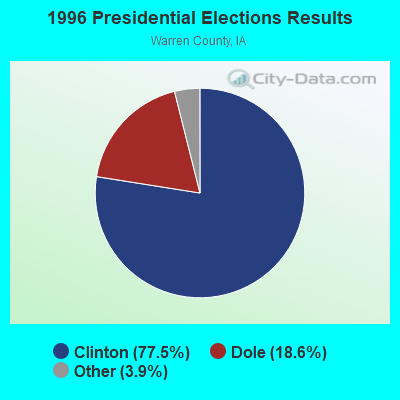
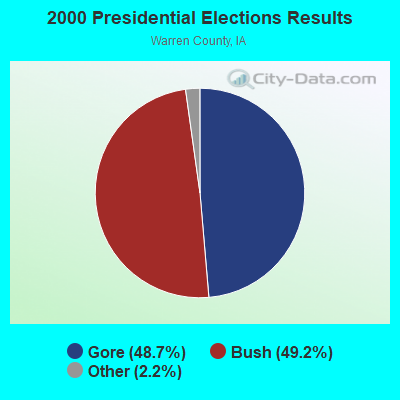
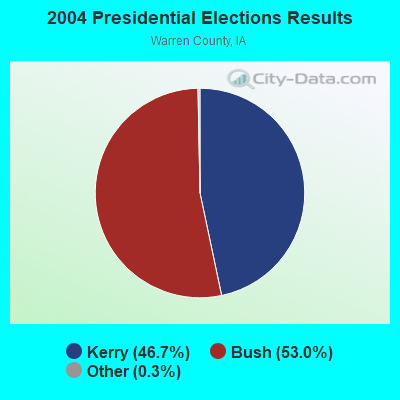
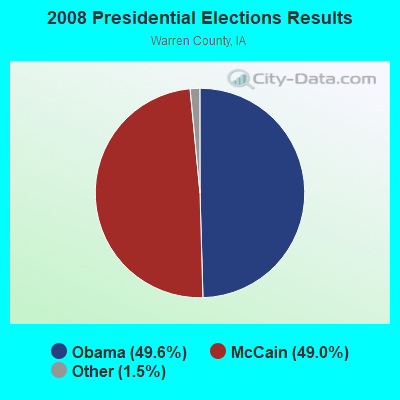

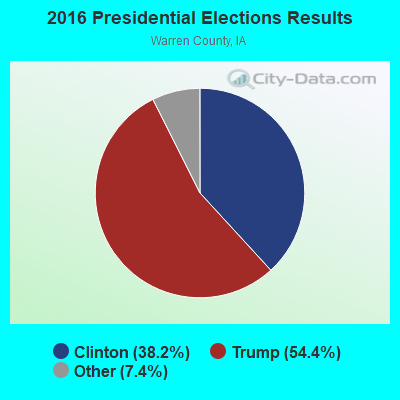
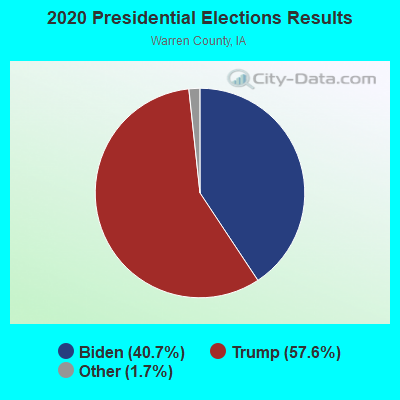
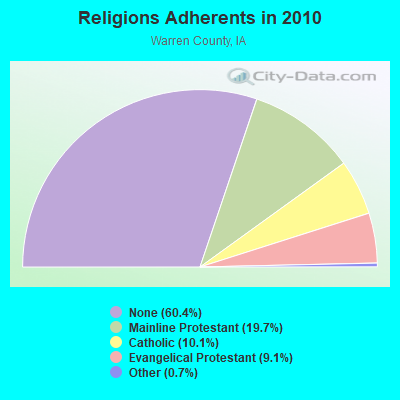
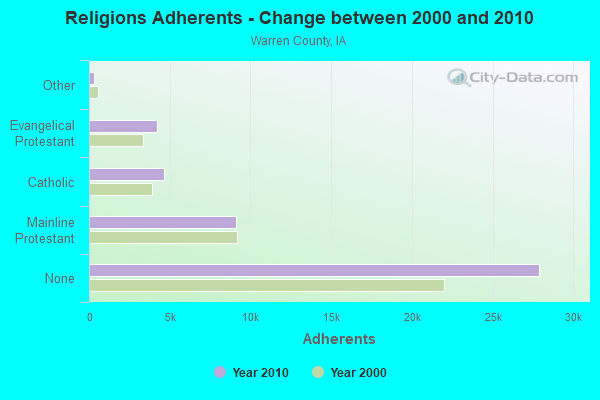
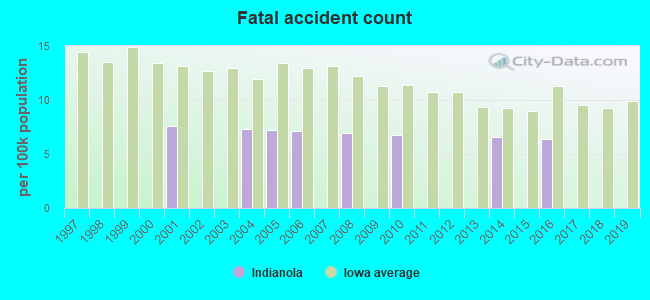
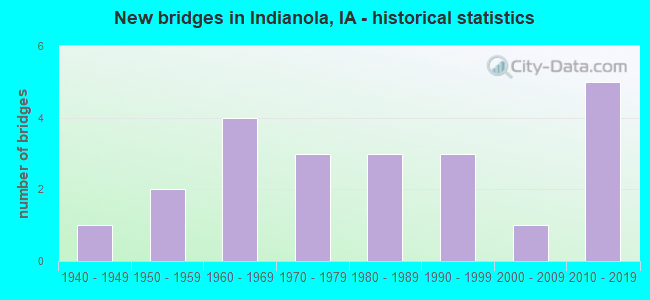
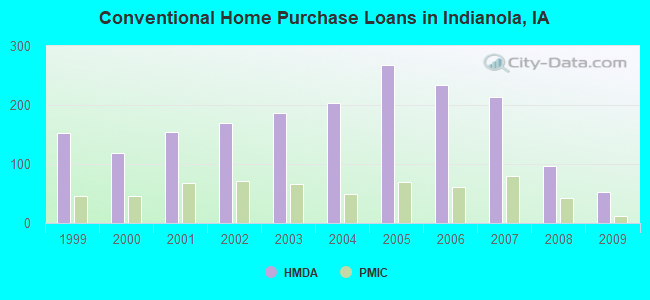
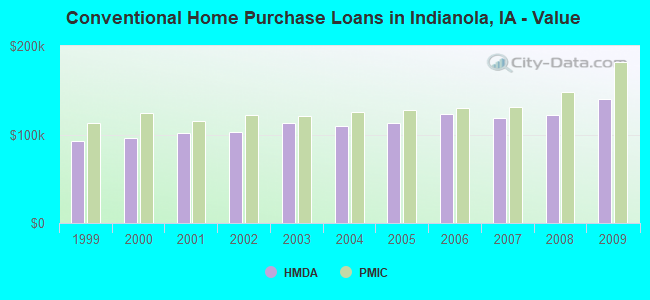
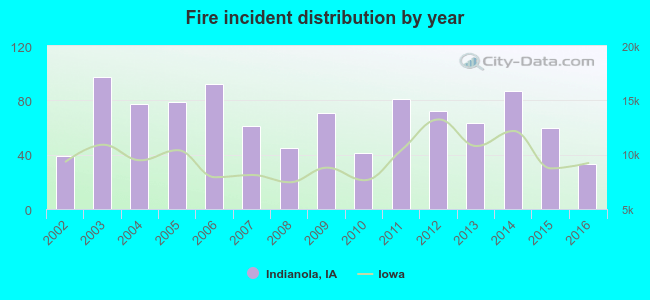 According to the data from the years 2002 - 2016 the average number of fire incidents per year is 67. The highest number of reported fire incidents - 97 took place in 2003, and the least - 33 in 2016. The data has a declining trend.
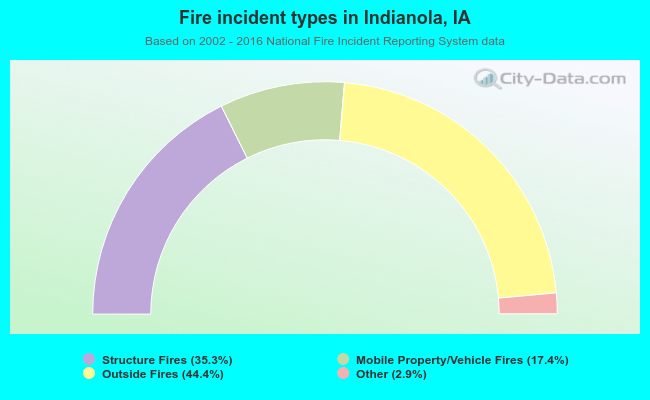 When looking into fire subcategories, the most incidents belonged to: Outside Fires (44.4%), and Structure Fires (35.3%).