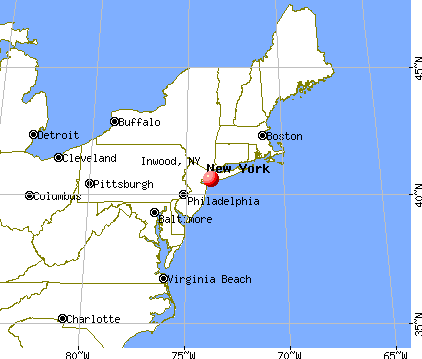
Inwood, New York Submit your own pictures of this place and show them to the world
OSM Map
General Map
Google Map
MSN Map
OSM Map
General Map
Google Map
MSN Map
OSM Map
General Map
Google Map
MSN Map
OSM Map
General Map
Google Map
MSN Map
Please wait while loading the map...
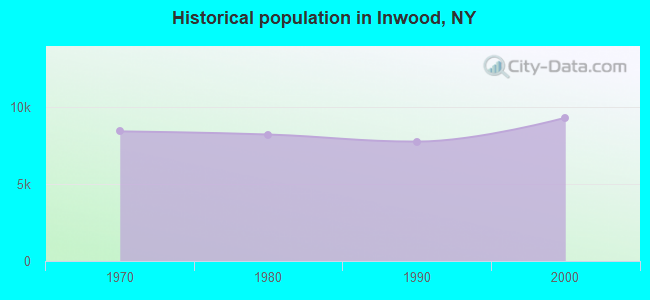
Population in 2010: 9,792. Population change since 2000: +5.0%Males: 4,908 Females: 4,884
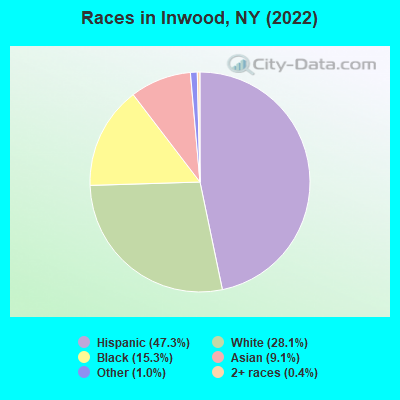
March 2022 cost of living index in Inwood: 155.0 (very high, U.S. average is 100) Percentage of residents living in poverty in 2022: 16.9%for White Non-Hispanic residents , 6.1% for Black residents , 27.9% for Hispanic or Latino residents , 26.8% for other race residents , 16.5% for two or more races residents )
Profiles of local businesses
Business Search - 14 Million verified businesses
Data:
Median household income ($)
Median household income (% change since 2000)
Household income diversity
Ratio of average income to average house value (%)
Ratio of average income to average rent
Median household income ($) - White
Median household income ($) - Black or African American
Median household income ($) - Asian
Median household income ($) - Hispanic or Latino
Median household income ($) - American Indian and Alaska Native
Median household income ($) - Multirace
Median household income ($) - Other Race
Median household income for houses/condos with a mortgage ($)
Median household income for apartments without a mortgage ($)
Races - White alone (%)
Races - White alone (% change since 2000)
Races - Black alone (%)
Races - Black alone (% change since 2000)
Races - American Indian alone (%)
Races - American Indian alone (% change since 2000)
Races - Asian alone (%)
Races - Asian alone (% change since 2000)
Races - Hispanic (%)
Races - Hispanic (% change since 2000)
Races - Native Hawaiian and Other Pacific Islander alone (%)
Races - Native Hawaiian and Other Pacific Islander alone (% change since 2000)
Races - Two or more races (%)
Races - Two or more races (% change since 2000)
Races - Other race alone (%)
Races - Other race alone (% change since 2000)
Racial diversity
Unemployment (%)
Unemployment (% change since 2000)
Unemployment (%) - White
Unemployment (%) - Black or African American
Unemployment (%) - Asian
Unemployment (%) - Hispanic or Latino
Unemployment (%) - American Indian and Alaska Native
Unemployment (%) - Multirace
Unemployment (%) - Other Race
Population density (people per square mile)
Population - Males (%)
Population - Females (%)
Population - Males (%) - White
Population - Males (%) - Black or African American
Population - Males (%) - Asian
Population - Males (%) - Hispanic or Latino
Population - Males (%) - American Indian and Alaska Native
Population - Males (%) - Multirace
Population - Males (%) - Other Race
Population - Females (%) - White
Population - Females (%) - Black or African American
Population - Females (%) - Asian
Population - Females (%) - Hispanic or Latino
Population - Females (%) - American Indian and Alaska Native
Population - Females (%) - Multirace
Population - Females (%) - Other Race
Coronavirus confirmed cases (Jun 15, 2024)
Deaths caused by coronavirus (Jun 15, 2024)
Coronavirus confirmed cases (per 100k population) (Jun 15, 2024)
Deaths caused by coronavirus (per 100k population) (Jun 15, 2024)
Daily increase in number of cases (Jun 15, 2024)
Weekly increase in number of cases (Jun 15, 2024)
Cases doubled (in days) (Jun 15, 2024)
Hospitalized patients (Apr 18, 2022)
Negative test results (Apr 18, 2022)
Total test results (Apr 18, 2022)
COVID Vaccine doses distributed (per 100k population) (Sep 19, 2023)
COVID Vaccine doses administered (per 100k population) (Sep 19, 2023)
COVID Vaccine doses distributed (Sep 19, 2023)
COVID Vaccine doses administered (Sep 19, 2023)
Likely homosexual households (%)
Likely homosexual households (% change since 2000)
Likely homosexual households - Lesbian couples (%)
Likely homosexual households - Lesbian couples (% change since 2000)
Likely homosexual households - Gay men (%)
Likely homosexual households - Gay men (% change since 2000)
Cost of living index
Median gross rent ($)
Median contract rent ($)
Median monthly housing costs ($)
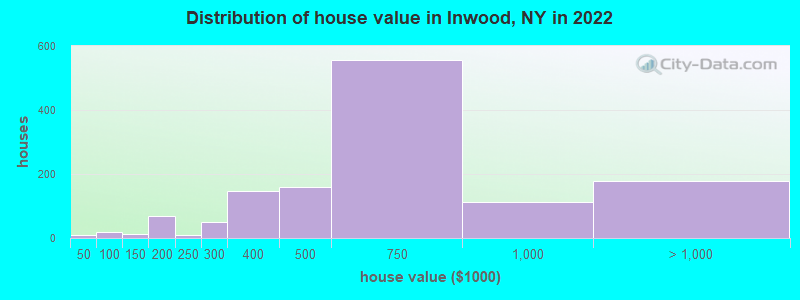
Median house or condo value ($)
Median house or condo value ($ change since 2000)
Mean house or condo value by units in structure - 1, detached ($)
Mean house or condo value by units in structure - 1, attached ($)
Mean house or condo value by units in structure - 2 ($)
Mean house or condo value by units in structure by units in structure - 3 or 4 ($)
Mean house or condo value by units in structure - 5 or more ($)
Mean house or condo value by units in structure - Boat, RV, van, etc. ($)
Mean house or condo value by units in structure - Mobile home ($)
Median house or condo value ($) - White
Median house or condo value ($) - Black or African American
Median house or condo value ($) - Asian
Median house or condo value ($) - Hispanic or Latino
Median house or condo value ($) - American Indian and Alaska Native
Median house or condo value ($) - Multirace
Median house or condo value ($) - Other Race
Median resident age
Resident age diversity
Median resident age - Males
Median resident age - Females
Median resident age - White
Median resident age - Black or African American
Median resident age - Asian
Median resident age - Hispanic or Latino
Median resident age - American Indian and Alaska Native
Median resident age - Multirace
Median resident age - Other Race
Median resident age - Males - White
Median resident age - Males - Black or African American
Median resident age - Males - Asian
Median resident age - Males - Hispanic or Latino
Median resident age - Males - American Indian and Alaska Native
Median resident age - Males - Multirace
Median resident age - Males - Other Race
Median resident age - Females - White
Median resident age - Females - Black or African American
Median resident age - Females - Asian
Median resident age - Females - Hispanic or Latino
Median resident age - Females - American Indian and Alaska Native
Median resident age - Females - Multirace
Median resident age - Females - Other Race
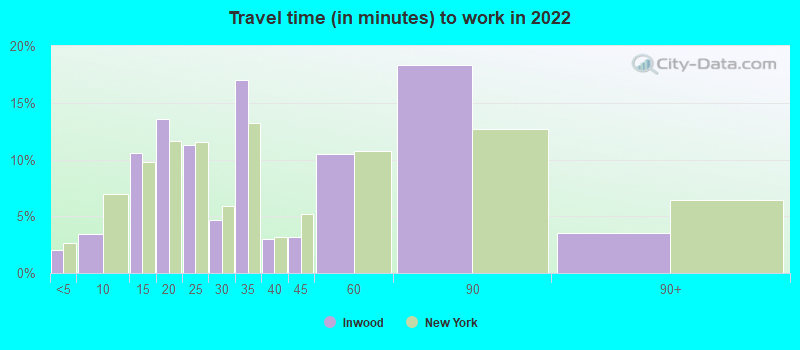
Commute - mean travel time to work (minutes)
Travel time to work - Less than 5 minutes (%)
Travel time to work - Less than 5 minutes (% change since 2000)
Travel time to work - 5 to 9 minutes (%)
Travel time to work - 5 to 9 minutes (% change since 2000)
Travel time to work - 10 to 19 minutes (%)
Travel time to work - 10 to 19 minutes (% change since 2000)
Travel time to work - 20 to 29 minutes (%)
Travel time to work - 20 to 29 minutes (% change since 2000)
Travel time to work - 30 to 39 minutes (%)
Travel time to work - 30 to 39 minutes (% change since 2000)
Travel time to work - 40 to 59 minutes (%)
Travel time to work - 40 to 59 minutes (% change since 2000)
Travel time to work - 60 to 89 minutes (%)
Travel time to work - 60 to 89 minutes (% change since 2000)
Travel time to work - 90 or more minutes (%)
Travel time to work - 90 or more minutes (% change since 2000)
Marital status - Never married (%)
Marital status - Now married (%)
Marital status - Separated (%)
Marital status - Widowed (%)
Marital status - Divorced (%)
Median family income ($)
Median family income (% change since 2000)
Median non-family income ($)
Median non-family income (% change since 2000)
Median per capita income ($)
Median per capita income (% change since 2000)
Median family income ($) - White
Median family income ($) - Black or African American
Median family income ($) - Asian
Median family income ($) - Hispanic or Latino
Median family income ($) - American Indian and Alaska Native
Median family income ($) - Multirace
Median family income ($) - Other Race
Median year house/condo built
Median year apartment built
Year house built - Built 2005 or later (%)
Year house built - Built 2000 to 2004 (%)
Year house built - Built 1990 to 1999 (%)
Year house built - Built 1980 to 1989 (%)
Year house built - Built 1970 to 1979 (%)
Year house built - Built 1960 to 1969 (%)
Year house built - Built 1950 to 1959 (%)
Year house built - Built 1940 to 1949 (%)
Year house built - Built 1939 or earlier (%)
Average household size
Household density (households per square mile)
Average household size - White
Average household size - Black or African American
Average household size - Asian
Average household size - Hispanic or Latino
Average household size - American Indian and Alaska Native
Average household size - Multirace
Average household size - Other Race
Occupied housing units (%)
Vacant housing units (%)
Owner occupied housing units (%)
Renter occupied housing units (%)
Vacancy status - For rent (%)
Vacancy status - For sale only (%)
Vacancy status - Rented or sold, not occupied (%)
Vacancy status - For seasonal, recreational, or occasional use (%)
Vacancy status - For migrant workers (%)
Vacancy status - Other vacant (%)
Residents with income below the poverty level (%)
Residents with income below 50% of the poverty level (%)
Children below poverty level (%)
Poor families by family type - Married-couple family (%)
Poor families by family type - Male, no wife present (%)
Poor families by family type - Female, no husband present (%)
Poverty status for native-born residents (%)
Poverty status for foreign-born residents (%)
Poverty among high school graduates not in families (%)
Poverty among people who did not graduate high school not in families (%)
Residents with income below the poverty level (%) - White
Residents with income below the poverty level (%) - Black or African American
Residents with income below the poverty level (%) - Asian
Residents with income below the poverty level (%) - Hispanic or Latino
Residents with income below the poverty level (%) - American Indian and Alaska Native
Residents with income below the poverty level (%) - Multirace
Residents with income below the poverty level (%) - Other Race
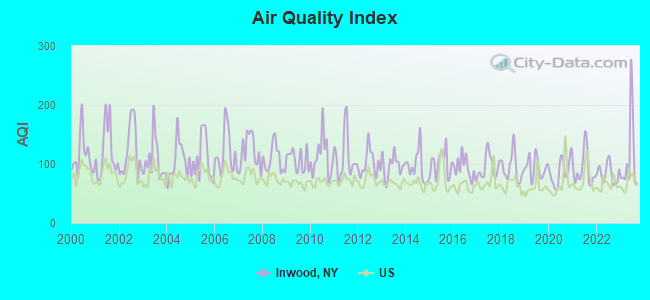
Air pollution - Air Quality Index (AQI)
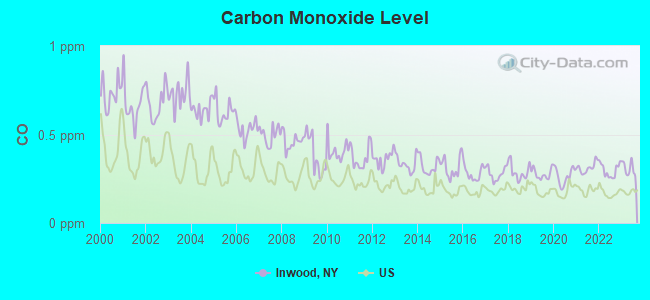
Air pollution - CO
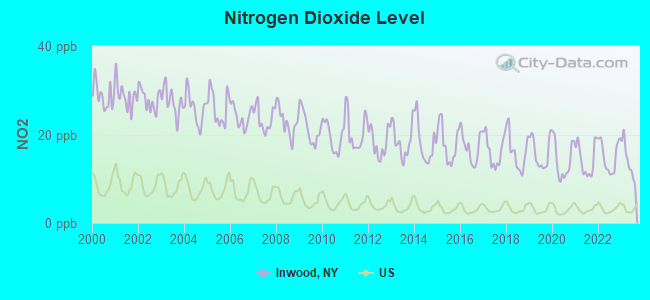
Air pollution - NO2
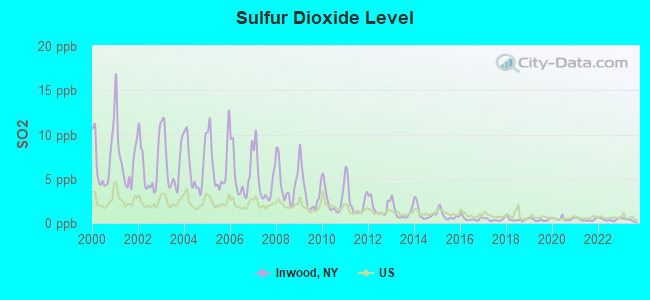
Air pollution - SO2
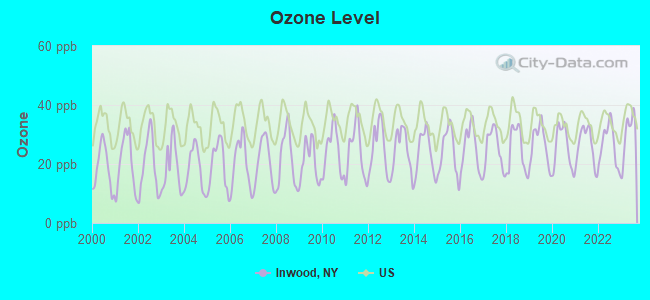
Air pollution - Ozone
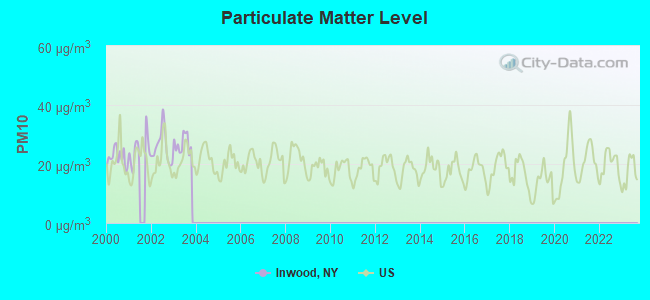
Air pollution - PM10
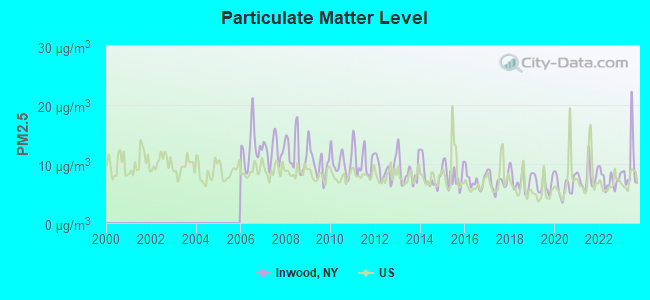
Air pollution - PM25
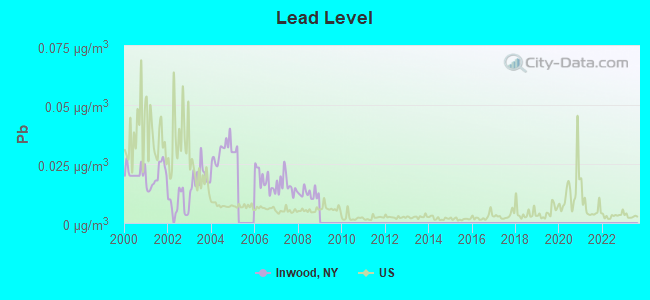
Air pollution - Pb
Crime - Murders per 100,000 population
Crime - Rapes per 100,000 population
Crime - Robberies per 100,000 population
Crime - Assaults per 100,000 population
Crime - Burglaries per 100,000 population
Crime - Thefts per 100,000 population
Crime - Auto thefts per 100,000 population
Crime - Arson per 100,000 population
Crime - City-data.com crime index
Crime - Violent crime index
Crime - Property crime index
Crime - Murders per 100,000 population (5 year average)
Crime - Rapes per 100,000 population (5 year average)
Crime - Robberies per 100,000 population (5 year average)
Crime - Assaults per 100,000 population (5 year average)
Crime - Burglaries per 100,000 population (5 year average)
Crime - Thefts per 100,000 population (5 year average)
Crime - Auto thefts per 100,000 population (5 year average)
Crime - Arson per 100,000 population (5 year average)
Crime - City-data.com crime index (5 year average)
Crime - Violent crime index (5 year average)
Crime - Property crime index (5 year average)
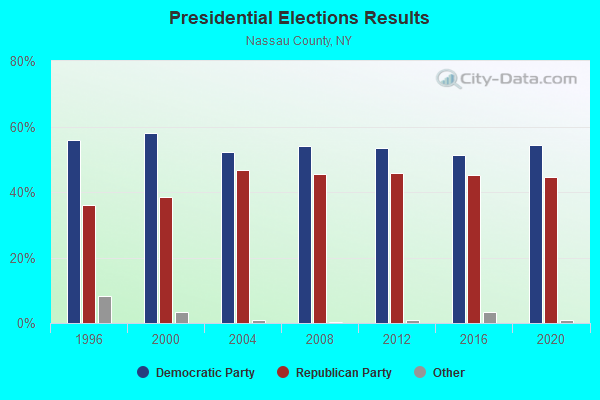
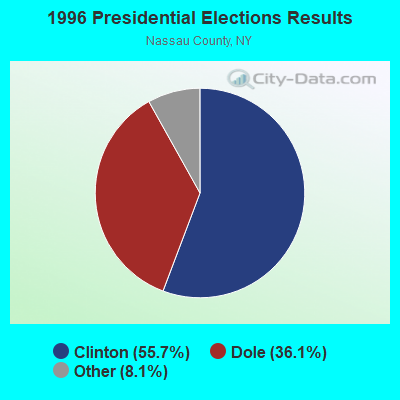
1996 Presidential Elections Results (%) - Democratic Party (Clinton)
1996 Presidential Elections Results (%) - Republican Party (Dole)
1996 Presidential Elections Results (%) - Other
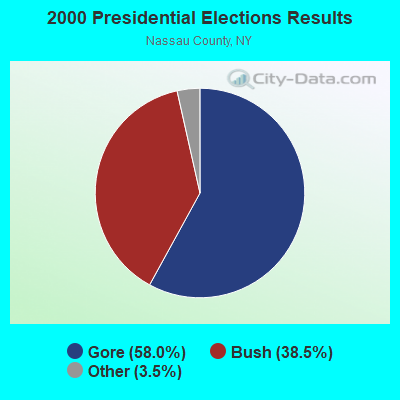
2000 Presidential Elections Results (%) - Democratic Party (Gore)
2000 Presidential Elections Results (%) - Republican Party (Bush)
2000 Presidential Elections Results (%) - Other
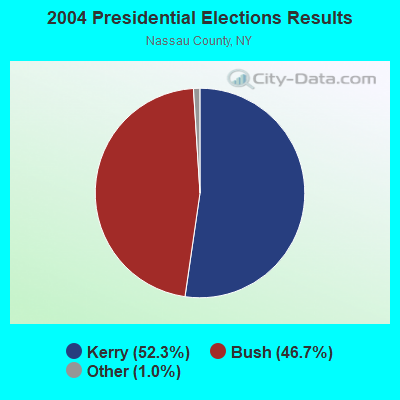
2004 Presidential Elections Results (%) - Democratic Party (Kerry)
2004 Presidential Elections Results (%) - Republican Party (Bush)
2004 Presidential Elections Results (%) - Other
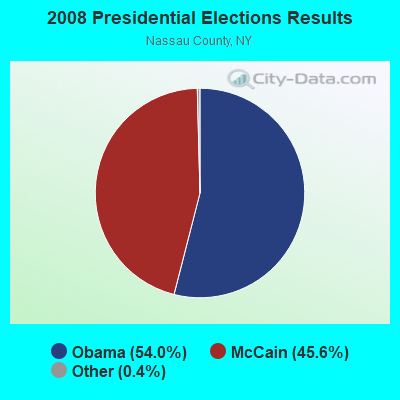
2008 Presidential Elections Results (%) - Democratic Party (Obama)
2008 Presidential Elections Results (%) - Republican Party (McCain)
2008 Presidential Elections Results (%) - Other
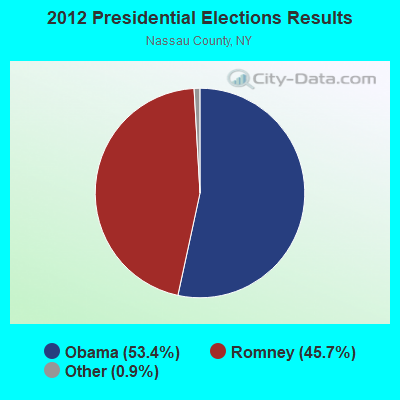
2012 Presidential Elections Results (%) - Democratic Party (Obama)
2012 Presidential Elections Results (%) - Republican Party (Romney)
2012 Presidential Elections Results (%) - Other
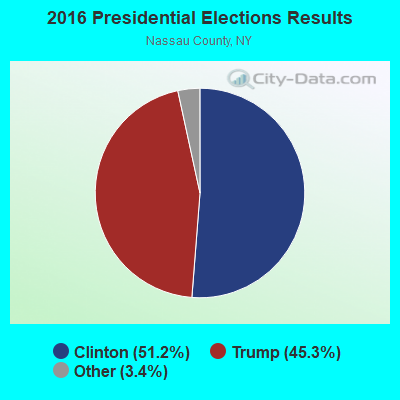
2016 Presidential Elections Results (%) - Democratic Party (Clinton)
2016 Presidential Elections Results (%) - Republican Party (Trump)
2016 Presidential Elections Results (%) - Other
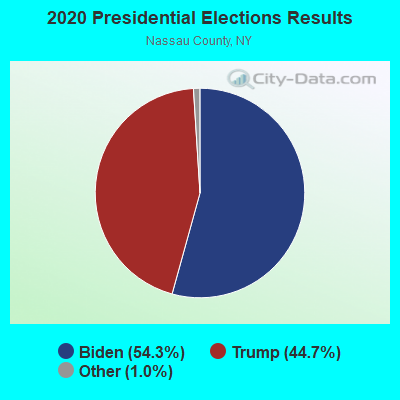
2020 Presidential Elections Results (%) - Democratic Party (Biden)
2020 Presidential Elections Results (%) - Republican Party (Trump)
2020 Presidential Elections Results (%) - Other
Ancestries Reported - Arab (%)
Ancestries Reported - Czech (%)
Ancestries Reported - Danish (%)
Ancestries Reported - Dutch (%)
Ancestries Reported - English (%)
Ancestries Reported - French (%)
Ancestries Reported - French Canadian (%)
Ancestries Reported - German (%)
Ancestries Reported - Greek (%)
Ancestries Reported - Hungarian (%)
Ancestries Reported - Irish (%)
Ancestries Reported - Italian (%)
Ancestries Reported - Lithuanian (%)
Ancestries Reported - Norwegian (%)
Ancestries Reported - Polish (%)
Ancestries Reported - Portuguese (%)
Ancestries Reported - Russian (%)
Ancestries Reported - Scotch-Irish (%)
Ancestries Reported - Scottish (%)
Ancestries Reported - Slovak (%)
Ancestries Reported - Subsaharan African (%)
Ancestries Reported - Swedish (%)
Ancestries Reported - Swiss (%)
Ancestries Reported - Ukrainian (%)
Ancestries Reported - United States (%)
Ancestries Reported - Welsh (%)
Ancestries Reported - West Indian (%)
Ancestries Reported - Other (%)
Educational Attainment - No schooling completed (%)
Educational Attainment - Less than high school (%)
Educational Attainment - High school or equivalent (%)
Educational Attainment - Less than 1 year of college (%)
Educational Attainment - 1 or more years of college (%)
Educational Attainment - Associate degree (%)
Educational Attainment - Bachelor's degree (%)
Educational Attainment - Master's degree (%)
Educational Attainment - Professional school degree (%)
Educational Attainment - Doctorate degree (%)
School Enrollment - Nursery, preschool (%)
School Enrollment - Kindergarten (%)
School Enrollment - Grade 1 to 4 (%)
School Enrollment - Grade 5 to 8 (%)
School Enrollment - Grade 9 to 12 (%)
School Enrollment - College undergrad (%)
School Enrollment - Graduate or professional (%)
School Enrollment - Not enrolled in school (%)
School enrollment - Public schools (%)
School enrollment - Private schools (%)
School enrollment - Not enrolled (%)
Median number of rooms in houses and condos
Median number of rooms in apartments
Housing units lacking complete plumbing facilities (%)
Housing units lacking complete kitchen facilities (%)
Density of houses
Urban houses (%)
Rural houses (%)
Households with people 60 years and over (%)
Households with people 65 years and over (%)
Households with people 75 years and over (%)
Households with one or more nonrelatives (%)
Households with no nonrelatives (%)
Population in households (%)
Family households (%)
Nonfamily households (%)
Population in families (%)
Family households with own children (%)
Median number of bedrooms in owner occupied houses
Mean number of bedrooms in owner occupied houses
Median number of bedrooms in renter occupied houses
Mean number of bedrooms in renter occupied houses
Median number of vehichles in owner occupied houses
Mean number of vehichles in owner occupied houses
Median number of vehichles in renter occupied houses
Mean number of vehichles in renter occupied houses
Mortgage status - with mortgage (%)
Mortgage status - with second mortgage (%)
Mortgage status - with home equity loan (%)
Mortgage status - with both second mortgage and home equity loan (%)
Mortgage status - without a mortgage (%)
Average family size
Average family size - White
Average family size - Black or African American
Average family size - Asian
Average family size - Hispanic or Latino
Average family size - American Indian and Alaska Native
Average family size - Multirace
Average family size - Other Race
Geographical mobility - Same house 1 year ago (%)
Geographical mobility - Moved within same county (%)
Geographical mobility - Moved from different county within same state (%)
Geographical mobility - Moved from different state (%)
Geographical mobility - Moved from abroad (%)
Place of birth - Born in state of residence (%)
Place of birth - Born in other state (%)
Place of birth - Native, outside of US (%)
Place of birth - Foreign born (%)
Housing units in structures - 1, detached (%)
Housing units in structures - 1, attached (%)
Housing units in structures - 2 (%)
Housing units in structures - 3 or 4 (%)
Housing units in structures - 5 to 9 (%)
Housing units in structures - 10 to 19 (%)
Housing units in structures - 20 to 49 (%)
Housing units in structures - 50 or more (%)
Housing units in structures - Mobile home (%)
Housing units in structures - Boat, RV, van, etc. (%)
House/condo owner moved in on average (years ago)
Renter moved in on average (years ago)
Year householder moved into unit - Moved in 1999 to March 2000 (%)
Year householder moved into unit - Moved in 1995 to 1998 (%)
Year householder moved into unit - Moved in 1990 to 1994 (%)
Year householder moved into unit - Moved in 1980 to 1989 (%)
Year householder moved into unit - Moved in 1970 to 1979 (%)
Year householder moved into unit - Moved in 1969 or earlier (%)
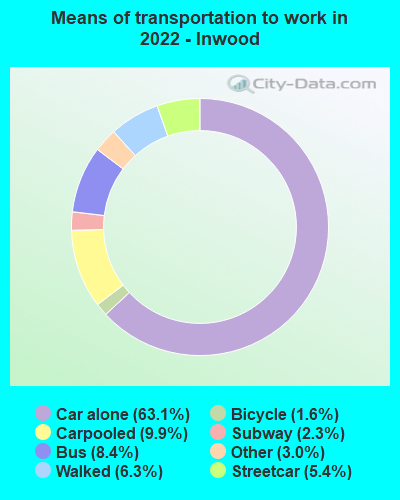
Means of transportation to work - Drove car alone (%)
Means of transportation to work - Carpooled (%)
Means of transportation to work - Public transportation (%)
Means of transportation to work - Bus or trolley bus (%)
Means of transportation to work - Streetcar or trolley car (%)
Means of transportation to work - Subway or elevated (%)
Means of transportation to work - Railroad (%)
Means of transportation to work - Ferryboat (%)
Means of transportation to work - Taxicab (%)
Means of transportation to work - Motorcycle (%)
Means of transportation to work - Bicycle (%)
Means of transportation to work - Walked (%)
Means of transportation to work - Other means (%)
Working at home (%)
Industry diversity
Most Common Industries - Agriculture, forestry, fishing and hunting, and mining (%)
Most Common Industries - Agriculture, forestry, fishing and hunting (%)
Most Common Industries - Mining, quarrying, and oil and gas extraction (%)
Most Common Industries - Construction (%)
Most Common Industries - Manufacturing (%)
Most Common Industries - Wholesale trade (%)
Most Common Industries - Retail trade (%)
Most Common Industries - Transportation and warehousing, and utilities (%)
Most Common Industries - Transportation and warehousing (%)
Most Common Industries - Utilities (%)
Most Common Industries - Information (%)
Most Common Industries - Finance and insurance, and real estate and rental and leasing (%)
Most Common Industries - Finance and insurance (%)
Most Common Industries - Real estate and rental and leasing (%)
Most Common Industries - Professional, scientific, and management, and administrative and waste management services (%)
Most Common Industries - Professional, scientific, and technical services (%)
Most Common Industries - Management of companies and enterprises (%)
Most Common Industries - Administrative and support and waste management services (%)
Most Common Industries - Educational services, and health care and social assistance (%)
Most Common Industries - Educational services (%)
Most Common Industries - Health care and social assistance (%)
Most Common Industries - Arts, entertainment, and recreation, and accommodation and food services (%)
Most Common Industries - Arts, entertainment, and recreation (%)
Most Common Industries - Accommodation and food services (%)
Most Common Industries - Other services, except public administration (%)
Most Common Industries - Public administration (%)
Occupation diversity
Most Common Occupations - Management, business, science, and arts occupations (%)
Most Common Occupations - Management, business, and financial occupations (%)
Most Common Occupations - Management occupations (%)
Most Common Occupations - Business and financial operations occupations (%)
Most Common Occupations - Computer, engineering, and science occupations (%)
Most Common Occupations - Computer and mathematical occupations (%)
Most Common Occupations - Architecture and engineering occupations (%)
Most Common Occupations - Life, physical, and social science occupations (%)
Most Common Occupations - Education, legal, community service, arts, and media occupations (%)
Most Common Occupations - Community and social service occupations (%)
Most Common Occupations - Legal occupations (%)
Most Common Occupations - Education, training, and library occupations (%)
Most Common Occupations - Arts, design, entertainment, sports, and media occupations (%)
Most Common Occupations - Healthcare practitioners and technical occupations (%)
Most Common Occupations - Health diagnosing and treating practitioners and other technical occupations (%)
Most Common Occupations - Health technologists and technicians (%)
Most Common Occupations - Service occupations (%)
Most Common Occupations - Healthcare support occupations (%)
Most Common Occupations - Protective service occupations (%)
Most Common Occupations - Fire fighting and prevention, and other protective service workers including supervisors (%)
Most Common Occupations - Law enforcement workers including supervisors (%)
Most Common Occupations - Food preparation and serving related occupations (%)
Most Common Occupations - Building and grounds cleaning and maintenance occupations (%)
Most Common Occupations - Personal care and service occupations (%)
Most Common Occupations - Sales and office occupations (%)
Most Common Occupations - Sales and related occupations (%)
Most Common Occupations - Office and administrative support occupations (%)
Most Common Occupations - Natural resources, construction, and maintenance occupations (%)
Most Common Occupations - Farming, fishing, and forestry occupations (%)
Most Common Occupations - Construction and extraction occupations (%)
Most Common Occupations - Installation, maintenance, and repair occupations (%)
Most Common Occupations - Production, transportation, and material moving occupations (%)
Most Common Occupations - Production occupations (%)
Most Common Occupations - Transportation occupations (%)
Most Common Occupations - Material moving occupations (%)
People in Group quarters - Institutionalized population (%)
People in Group quarters - Correctional institutions (%)
People in Group quarters - Federal prisons and detention centers (%)
People in Group quarters - Halfway houses (%)
People in Group quarters - Local jails and other confinement facilities (including police lockups) (%)
People in Group quarters - Military disciplinary barracks (%)
People in Group quarters - State prisons (%)
People in Group quarters - Other types of correctional institutions (%)
People in Group quarters - Nursing homes (%)
People in Group quarters - Hospitals/wards, hospices, and schools for the handicapped (%)
People in Group quarters - Hospitals/wards and hospices for chronically ill (%)
People in Group quarters - Hospices or homes for chronically ill (%)
People in Group quarters - Military hospitals or wards for chronically ill (%)
People in Group quarters - Other hospitals or wards for chronically ill (%)
People in Group quarters - Hospitals or wards for drug/alcohol abuse (%)
People in Group quarters - Mental (Psychiatric) hospitals or wards (%)
People in Group quarters - Schools, hospitals, or wards for the mentally retarded (%)
People in Group quarters - Schools, hospitals, or wards for the physically handicapped (%)
People in Group quarters - Institutions for the deaf (%)
People in Group quarters - Institutions for the blind (%)
People in Group quarters - Orthopedic wards and institutions for the physically handicapped (%)
People in Group quarters - Wards in general hospitals for patients who have no usual home elsewhere (%)
People in Group quarters - Wards in military hospitals for patients who have no usual home elsewhere (%)
People in Group quarters - Juvenile institutions (%)
People in Group quarters - Long-term care (%)
People in Group quarters - Homes for abused, dependent, and neglected children (%)
People in Group quarters - Residential treatment centers for emotionally disturbed children (%)
People in Group quarters - Training schools for juvenile delinquents (%)
People in Group quarters - Short-term care, detention or diagnostic centers for delinquent children (%)
People in Group quarters - Type of juvenile institution unknown (%)
People in Group quarters - Noninstitutionalized population (%)
People in Group quarters - College dormitories (includes college quarters off campus) (%)
People in Group quarters - Military quarters (%)
People in Group quarters - On base (%)
People in Group quarters - Barracks, unaccompanied personnel housing (UPH), (Enlisted/Officer), ;and similar group living quarters for military personnel (%)
People in Group quarters - Transient quarters for temporary residents (%)
People in Group quarters - Military ships (%)
People in Group quarters - Group homes (%)
People in Group quarters - Homes or halfway houses for drug/alcohol abuse (%)
People in Group quarters - Homes for the mentally ill (%)
People in Group quarters - Homes for the mentally retarded (%)
People in Group quarters - Homes for the physically handicapped (%)
People in Group quarters - Other group homes (%)
People in Group quarters - Religious group quarters (%)
People in Group quarters - Dormitories (%)
People in Group quarters - Agriculture workers' dormitories on farms (%)
People in Group quarters - Job Corps and vocational training facilities (%)
People in Group quarters - Other workers' dormitories (%)
People in Group quarters - Crews of maritime vessels (%)
People in Group quarters - Other nonhousehold living situations (%)
People in Group quarters - Other noninstitutional group quarters (%)
Residents speaking English at home (%)
Residents speaking English at home - Born in the United States (%)
Residents speaking English at home - Native, born elsewhere (%)
Residents speaking English at home - Foreign born (%)
Residents speaking Spanish at home (%)
Residents speaking Spanish at home - Born in the United States (%)
Residents speaking Spanish at home - Native, born elsewhere (%)
Residents speaking Spanish at home - Foreign born (%)
Residents speaking other language at home (%)
Residents speaking other language at home - Born in the United States (%)
Residents speaking other language at home - Native, born elsewhere (%)
Residents speaking other language at home - Foreign born (%)
Class of Workers - Employee of private company (%)
Class of Workers - Self-employed in own incorporated business (%)
Class of Workers - Private not-for-profit wage and salary workers (%)
Class of Workers - Local government workers (%)
Class of Workers - State government workers (%)
Class of Workers - Federal government workers (%)
Class of Workers - Self-employed workers in own not incorporated business and Unpaid family workers (%)
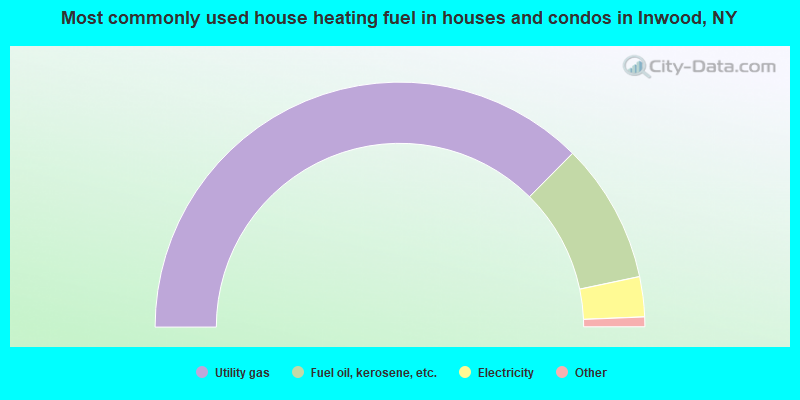
House heating fuel used in houses and condos - Utility gas (%)
House heating fuel used in houses and condos - Bottled, tank, or LP gas (%)
House heating fuel used in houses and condos - Electricity (%)
House heating fuel used in houses and condos - Fuel oil, kerosene, etc. (%)
House heating fuel used in houses and condos - Coal or coke (%)
House heating fuel used in houses and condos - Wood (%)
House heating fuel used in houses and condos - Solar energy (%)
House heating fuel used in houses and condos - Other fuel (%)
House heating fuel used in houses and condos - No fuel used (%)
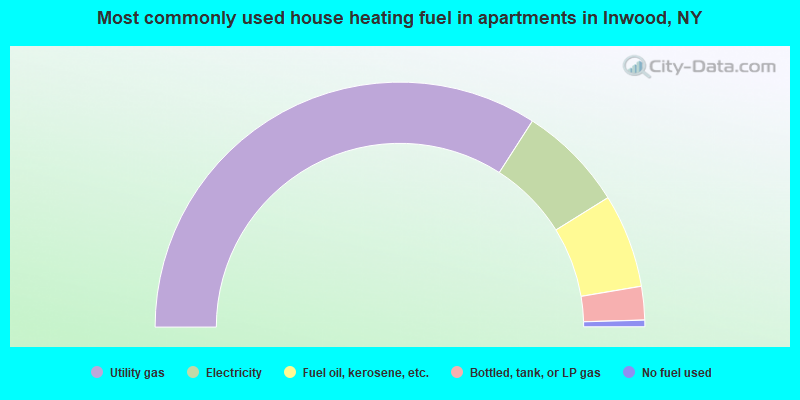
House heating fuel used in apartments - Utility gas (%)
House heating fuel used in apartments - Bottled, tank, or LP gas (%)
House heating fuel used in apartments - Electricity (%)
House heating fuel used in apartments - Fuel oil, kerosene, etc. (%)
House heating fuel used in apartments - Coal or coke (%)
House heating fuel used in apartments - Wood (%)
House heating fuel used in apartments - Solar energy (%)
House heating fuel used in apartments - Other fuel (%)
House heating fuel used in apartments - No fuel used (%)
Armed forces status - In Armed Forces (%)
Armed forces status - Civilian (%)
Armed forces status - Civilian - Veteran (%)
Armed forces status - Civilian - Nonveteran (%)
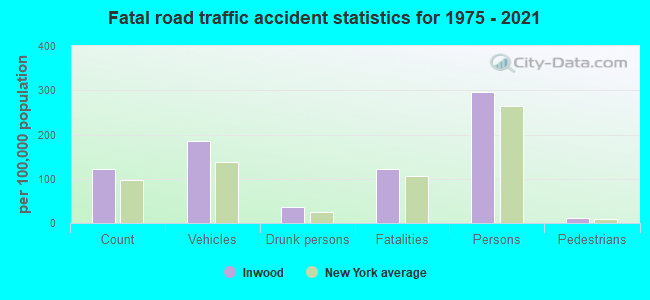
Fatal accidents locations in years 2005-2021
Fatal accidents locations in 2005
Fatal accidents locations in 2006
Fatal accidents locations in 2007
Fatal accidents locations in 2008
Fatal accidents locations in 2009
Fatal accidents locations in 2010
Fatal accidents locations in 2011
Fatal accidents locations in 2012
Fatal accidents locations in 2013
Fatal accidents locations in 2014
Fatal accidents locations in 2015
Fatal accidents locations in 2016
Fatal accidents locations in 2017
Fatal accidents locations in 2018
Fatal accidents locations in 2019
Fatal accidents locations in 2020
Fatal accidents locations in 2021
Alcohol use - People drinking some alcohol every month (%)
Alcohol use - People not drinking at all (%)
Alcohol use - Average days/month drinking alcohol
Alcohol use - Average drinks/week
Alcohol use - Average days/year people drink much
Audiometry - Average condition of hearing (%)
Audiometry - People that can hear a whisper from across a quiet room (%)
Audiometry - People that can hear normal voice from across a quiet room (%)
Audiometry - Ears ringing, roaring, buzzing (%)
Audiometry - Had a job exposure to loud noise (%)
Audiometry - Had off-work exposure to loud noise (%)
Blood Pressure & Cholesterol - Has high blood pressure (%)
Blood Pressure & Cholesterol - Checking blood pressure at home (%)
Blood Pressure & Cholesterol - Frequently checking blood cholesterol (%)
Blood Pressure & Cholesterol - Has high cholesterol level (%)
Consumer Behavior - Money monthly spent on food at supermarket/grocery store
Consumer Behavior - Money monthly spent on food at other stores
Consumer Behavior - Money monthly spent on eating out
Consumer Behavior - Money monthly spent on carryout/delivered foods
Consumer Behavior - Income spent on food at supermarket/grocery store (%)
Consumer Behavior - Income spent on food at other stores (%)
Consumer Behavior - Income spent on eating out (%)
Consumer Behavior - Income spent on carryout/delivered foods (%)
Current Health Status - General health condition (%)
Current Health Status - Blood donors (%)
Current Health Status - Has blood ever tested for HIV virus (%)
Current Health Status - Left-handed people (%)
Dermatology - People using sunscreen (%)
Diabetes - Diabetics (%)
Diabetes - Had a blood test for high blood sugar (%)
Diabetes - People taking insulin (%)
Diet Behavior & Nutrition - Diet health (%)
Diet Behavior & Nutrition - Milk product consumption (# of products/month)
Diet Behavior & Nutrition - Meals not home prepared (#/week)
Diet Behavior & Nutrition - Meals from fast food or pizza place (#/week)
Diet Behavior & Nutrition - Ready-to-eat foods (#/month)
Diet Behavior & Nutrition - Frozen meals/pizza (#/month)
Drug Use - People that ever used marijuana or hashish (%)
Drug Use - Ever used hard drugs (%)
Drug Use - Ever used any form of cocaine (%)
Drug Use - Ever used heroin (%)
Drug Use - Ever used methamphetamine (%)
Health Insurance - People covered by health insurance (%)
Kidney Conditions-Urology - Avg. # of times urinating at night
Medical Conditions - People with asthma (%)
Medical Conditions - People with anemia (%)
Medical Conditions - People with psoriasis (%)
Medical Conditions - People with overweight (%)
Medical Conditions - Elderly people having difficulties in thinking or remembering (%)
Medical Conditions - People who ever received blood transfusion (%)
Medical Conditions - People having trouble seeing even with glass/contacts (%)
Medical Conditions - People with arthritis (%)
Medical Conditions - People with gout (%)
Medical Conditions - People with congestive heart failure (%)
Medical Conditions - People with coronary heart disease (%)
Medical Conditions - People with angina pectoris (%)
Medical Conditions - People who ever had heart attack (%)
Medical Conditions - People who ever had stroke (%)
Medical Conditions - People with emphysema (%)
Medical Conditions - People with thyroid problem (%)
Medical Conditions - People with chronic bronchitis (%)
Medical Conditions - People with any liver condition (%)
Medical Conditions - People who ever had cancer or malignancy (%)
Mental Health - People who have little interest in doing things (%)
Mental Health - People feeling down, depressed, or hopeless (%)
Mental Health - People who have trouble sleeping or sleeping too much (%)
Mental Health - People feeling tired or having little energy (%)
Mental Health - People with poor appetite or overeating (%)
Mental Health - People feeling bad about themself (%)
Mental Health - People who have trouble concentrating on things (%)
Mental Health - People moving or speaking slowly or too fast (%)
Mental Health - People having thoughts they would be better off dead (%)
Oral Health - Average years since last visit a dentist
Oral Health - People embarrassed because of mouth (%)
Oral Health - People with gum disease (%)
Oral Health - General health of teeth and gums (%)
Oral Health - Average days a week using dental floss/device
Oral Health - Average days a week using mouthwash for dental problem
Oral Health - Average number of teeth
Pesticide Use - Households using pesticides to control insects (%)
Pesticide Use - Households using pesticides to kill weeds (%)
Physical Activity - People doing vigorous-intensity work activities (%)
Physical Activity - People doing moderate-intensity work activities (%)
Physical Activity - People walking or bicycling (%)
Physical Activity - People doing vigorous-intensity recreational activities (%)
Physical Activity - People doing moderate-intensity recreational activities (%)
Physical Activity - Average hours a day doing sedentary activities
Physical Activity - Average hours a day watching TV or videos
Physical Activity - Average hours a day using computer
Physical Functioning - People having limitations keeping them from working (%)
Physical Functioning - People limited in amount of work they can do (%)
Physical Functioning - People that need special equipment to walk (%)
Physical Functioning - People experiencing confusion/memory problems (%)
Physical Functioning - People requiring special healthcare equipment (%)
Prescription Medications - Average number of prescription medicines taking
Preventive Aspirin Use - Adults 40+ taking low-dose aspirin (%)
Reproductive Health - Vaginal deliveries (%)
Reproductive Health - Cesarean deliveries (%)
Reproductive Health - Deliveries resulted in a live birth (%)
Reproductive Health - Pregnancies resulted in a delivery (%)
Reproductive Health - Women breastfeeding newborns (%)
Reproductive Health - Women that had a hysterectomy (%)
Reproductive Health - Women that had both ovaries removed (%)
Reproductive Health - Women that have ever taken birth control pills (%)
Reproductive Health - Women taking birth control pills (%)
Reproductive Health - Women that have ever used Depo-Provera or injectables (%)
Reproductive Health - Women that have ever used female hormones (%)
Sexual Behavior - People 18+ that ever had sex (vaginal, anal, or oral) (%)
Sexual Behavior - Males 18+ that ever had vaginal sex with a woman (%)
Sexual Behavior - Males 18+ that ever performed oral sex on a woman (%)
Sexual Behavior - Males 18+ that ever had anal sex with a woman (%)
Sexual Behavior - Males 18+ that ever had any sex with a man (%)
Sexual Behavior - Females 18+ that ever had vaginal sex with a man (%)
Sexual Behavior - Females 18+ that ever performed oral sex on a man (%)
Sexual Behavior - Females 18+ that ever had anal sex with a man (%)
Sexual Behavior - Females 18+ that ever had any kind of sex with a woman (%)
Sexual Behavior - Average age people first had sex
Sexual Behavior - Average number of female sex partners in lifetime (males 18+)
Sexual Behavior - Average number of female vaginal sex partners in lifetime (males 18+)
Sexual Behavior - Average age people first performed oral sex on a woman (18+)
Sexual Behavior - Average number of woman performed oral sex on in lifetime (18+)
Sexual Behavior - Average number of male sex partners in lifetime (males 18+)
Sexual Behavior - Average number of male anal sex partners in lifetime (males 18+)
Sexual Behavior - Average age people first performed oral sex on a man (18+)
Sexual Behavior - Average number of male oral sex partners in lifetime (18+)
Sexual Behavior - People using protection when performing oral sex (%)
Sexual Behavior - Average number of times people have vaginal or anal sex a year
Sexual Behavior - People having sex without condom (%)
Sexual Behavior - Average number of male sex partners in lifetime (females 18+)
Sexual Behavior - Average number of male vaginal sex partners in lifetime (females 18+)
Sexual Behavior - Average number of female sex partners in lifetime (females 18+)
Sexual Behavior - Circumcised males 18+ (%)
Sleep Disorders - Average hours sleeping at night
Sleep Disorders - People that has trouble sleeping (%)
Smoking-Cigarette Use - People smoking cigarettes (%)
Taste & Smell - People 40+ having problems with smell (%)
Taste & Smell - People 40+ having problems with taste (%)
Taste & Smell - People 40+ that ever had wisdom teeth removed (%)
Taste & Smell - People 40+ that ever had tonsils teeth removed (%)
Taste & Smell - People 40+ that ever had a loss of consciousness because of a head injury (%)
Taste & Smell - People 40+ that ever had a broken nose or other serious injury to face or skull (%)
Taste & Smell - People 40+ that ever had two or more sinus infections (%)
Weight - Average height (inches)
Weight - Average weight (pounds)
Weight - Average BMI
Weight - People that are obese (%)
Weight - People that ever were obese (%)
Weight - People trying to lose weight (%)
According to our research of New York and other state lists, there were 2 registered sex offenders living in Inwood, New York as of June 15, 2024 . The ratio of all residents to sex offenders in Inwood is 4,890 to 1.The ratio of registered sex offenders to all residents in this city is much lower than the state average.
Latest news from Inwood, NY collected exclusively by city-data.com from local newspapers, TV, and radio stations
Ancestries: Italian (10.2%), Jamaican (2.9%), Polish (2.5%), American (2.5%), European (2.1%), Guyanese (1.5%).
Current Local Time:
Land area: 1.70 square miles.
Population density: 5,763 people per square mile (average).
4,168 residents are foreign born (27.4% Latin America , 6.6% Asia ).
This place:
37.5%New York:
22.6%
Median real estate property taxes paid for housing units with mortgages in 2022: $10,001 (1.9%)Median real estate property taxes paid for housing units with no mortgage in 2022: $7,952 (1.3%)
Nearest city with pop. 50,000+: Queens, NY
Nearest cities:
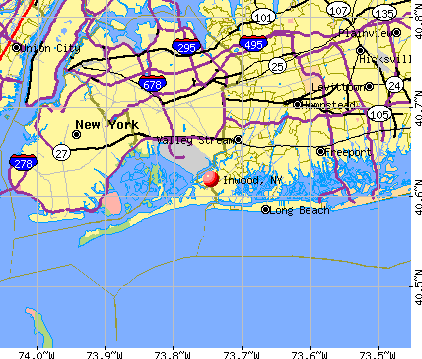
Latitude: 40.62 N, Longitude: 73.75 W
Daytime population change due to commuting: -6 (-0.1%)Workers who live and work in this place: 1,075 (21.8%)
Unemployment in December 2023:
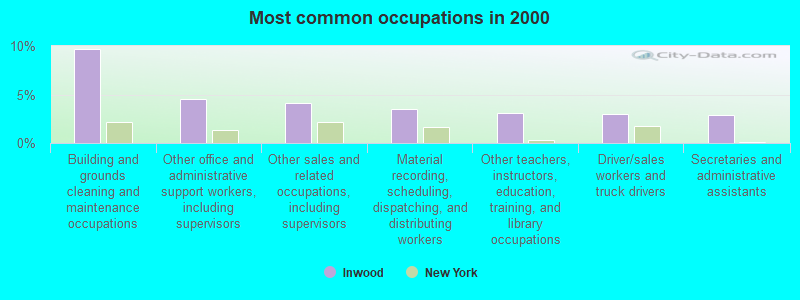
Most common occupations in Inwood, NY (%)
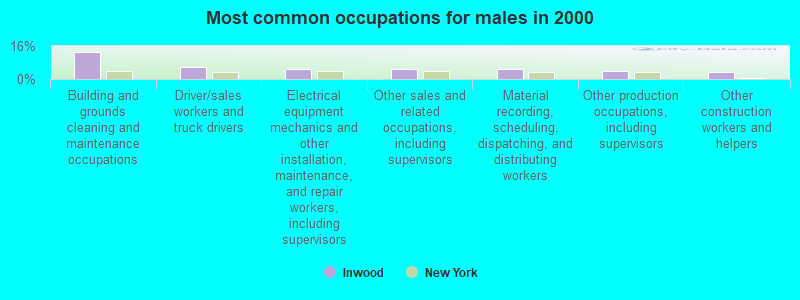
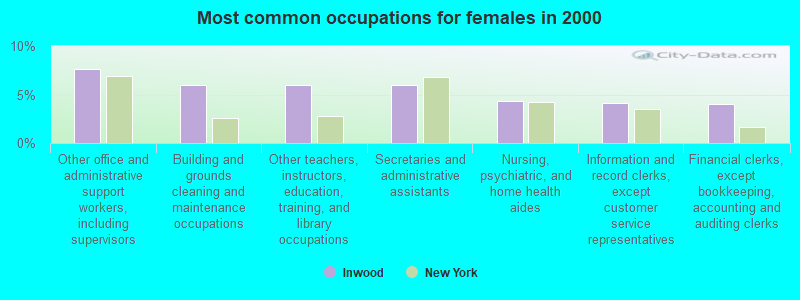
Both Males Females
Building and grounds cleaning and maintenance occupations (9.7%)
Other office and administrative support workers, including supervisors (4.6%)
Other sales and related occupations, including supervisors (4.1%)
Material recording, scheduling, dispatching, and distributing workers (3.5%)
Other teachers, instructors, education, training, and library occupations (3.1%)
Driver/sales workers and truck drivers (3.0%)
Secretaries and administrative assistants (2.9%)
Building and grounds cleaning and maintenance occupations (13.2%)
Driver/sales workers and truck drivers (5.8%)
Electrical equipment mechanics and other installation, maintenance, and repair workers, including supervisors (5.1%)
Other sales and related occupations, including supervisors (4.8%)
Material recording, scheduling, dispatching, and distributing workers (4.7%)
Other production occupations, including supervisors (3.7%)
Other construction workers and helpers (3.6%)
Other office and administrative support workers, including supervisors (7.6%)
Building and grounds cleaning and maintenance occupations (6.0%)
Other teachers, instructors, education, training, and library occupations (6.0%)
Secretaries and administrative assistants (5.9%)
Nursing, psychiatric, and home health aides (4.3%)
Information and record clerks, except customer service representatives (4.2%)
Financial clerks, except bookkeeping, accounting and auditing clerks (4.0%)
Tornado activity:
Inwood-area historical tornado activity is slightly above New York state average. It is 51% smaller than the overall U.S. average.
On 9/7/1998, a category F2 (max. wind speeds 113-157 mph) tornado 4.1 miles away from the Inwood place center injured 6 people and caused $1 million in damages.
On 9/18/1973, a category F2 tornado 13.1 miles away from the place center .
Earthquake activity:
Inwood-area historical earthquake activity is significantly above New York state average. It is 70% smaller than the overall U.S. average. On 8/23/2011 at 17:51:04, a magnitude 5.8 (5.8 MW, Depth: 3.7 mi, Class: Moderate, Intensity: VI - VII) earthquake occurred 292.3 miles away from the city center On 10/7/1983 at 10:18:46, a magnitude 5.3 (5.1 MB, 5.3 LG, 5.1 ML) earthquake occurred 232.6 miles away from the city center On 1/16/1994 at 01:49:16, a magnitude 4.6 (4.6 MB, 4.6 LG, Depth: 3.1 mi, Class: Light, Intensity: IV - V) earthquake occurred 122.2 miles away from the city center On 4/20/2002 at 10:50:47, a magnitude 5.3 (5.3 ML, Depth: 3.0 mi) earthquake occurred 269.3 miles away from the city center On 4/20/2002 at 10:50:47, a magnitude 5.2 (5.2 MB, 4.2 MS, 5.2 MW, 5.0 MW) earthquake occurred 267.5 miles away from the city center On 8/22/1992 at 12:20:32, a magnitude 4.8 (4.8 MB, 3.8 MS, 4.7 LG, Depth: 6.2 mi) earthquake occurred 209.9 miles away from Inwood center Magnitude types: regional Lg-wave magnitude (LG), body-wave magnitude (MB), local magnitude (ML), surface-wave magnitude (MS), moment magnitude (MW) Natural disasters: The number of natural disasters in Nassau County (25) is a lot greater than the US average (15).Major Disasters (Presidential) Declared: 17Emergencies Declared: 7Hurricanes: 8, Storms: 7, Floods: 6, Blizzards: 2, Snowstorms: 2, Heavy Rain: 1, Power Outage: 1, Tropical Depression: 1, Tropical Storm: 1, Water Shortage: 1, Winter Storm: 1, Other: 3 (Note: some incidents may be assigned to more than one category). Hospitals and medical centers near Inwood: OHEL CHILDREN'S HOME AND FAMILY SERVICES, INC. (Hospital, about 1 miles away; FAR ROCKAWAY, NY)
HAVEN MANOR HEALTH CARE CENTER L L C (Nursing Home, about 2 miles away; FAR ROCKAWAY, NY)
HEARTSHARE HUMAN SERVICES (Hospital, about 2 miles away; FAR ROCKAWAY, NY)
QUEENS NASSAU REHABILITATION AND NURSING CENTER (Nursing Home, about 2 miles away; FAR ROCKAWAY, NY)
OCEANVIEW NURSING AND REHABILITATION CENTER L L C (Nursing Home, about 2 miles away; FAR ROCKAWAY, NY)
ST JOHN'S EPISCOPAL HOSPITAL AT SOUTH SHORE (about 2 miles away; FAR ROCKAWAY, NY)
BROOKHAVEN REHAB AND HEALTH CARE CENTER L L C (Nursing Home, about 2 miles away; FAR ROCKAWAY, NY)
Amtrak stations near Inwood: 3 miles: KENNEDY AIRPORT NEW YORK (QUEENS, ) - Bus Station Services: enclosed waiting area, public restrooms, public payphones, snack bar and vending machines, ATM, paid short-term parking, paid long-term parking, car rental agency, taxi stand.
13 miles: LA GUARDIA AIRPORT (QUEENS, ) - Bus Station Services: enclosed waiting area, public restrooms, public payphones, snack bar and vending machines, ATM, paid short-term parking, paid long-term parking, car rental agency, taxi stand.
16 miles: NEW YORK (PENN STA) (NEW YORK, 7TH AVE. & W. 32ND ST.) Services: ticket office, fully wheelchair accessible, enclosed waiting area, public restrooms, public payphones, full-service food facilities, snack bar, vending machines, ATM, paid short-term parking, paid long-term parking, call for car rental service, taxi stand, public transit connection.
Colleges/universities with over 2000 students nearest to Inwood:
CUNY York College (about 7 miles; Jamaica, NY ; Full-time enrollment: 6,312)
St John's University-New York (about 8 miles; Queens, NY ; FT enrollment: 15,175)
Molloy College (about 8 miles; Rockville Centre, NY ; FT enrollment: 3,962)
Adelphi University (about 9 miles; Garden City, NY ; FT enrollment: 7,312)
CUNY Queens College (about 9 miles; Flushing, NY ; FT enrollment: 15,769)
CUNY Queensborough Community College (about 10 miles; Bayside, NY ; FT enrollment: 11,931)
Hofstra University (about 11 miles; Hempstead, NY ; FT enrollment: 9,429)
Public elementary/middle school in Inwood: 2 SCHOOL Location: 1 DONAHUE AVE, Grades: 1-4)
Private elementary/middle school in Inwood:
See full list of schools located in Inwood
Notable locations in Inwood: (A) , Inwood Country Club (B) , Inwood Fire Department (C) , Five Towns Community House (D) . Display/hide their locations on the map
Shopping Center: (1) . Display/hide its location on the map
Churches in Inwood include: (A) , Gethsemane Church of God (B) , Fivetown Seventh Day Adventist Church (C) , First Calvary Baptist Church (D) , Jewish Community Center of Inwood (E) , Community Bible Church (F) , Saint Johns Baptist Church (G) , Roman Catholic Church of Our Lady of Good Counsel (H) , First Baptist Church (I) . Display/hide their locations on the map
Cemetery: (1) . Display/hide its location on the map
Creek: (A) . Display/hide its location on the map
Park in Inwood: (1) . Display/hide its location on the map
Tourist attraction:
Nassau County has a predicted average indoor radon screening level less than 2 pCi/L (pico curies per liter) - Low Potential Average household size: This place:
3.3 peopleNew York:
2.6 people
Percentage of family households: This place:
75.4%Whole state:
63.5%
Percentage of households with unmarried partners: This place:
5.9%Whole state:
6.8%
Likely homosexual households (counted as self-reported same-sex unmarried-partner households)
Lesbian couples: 0.4% of all households Gay men: 0.2% of all households
People in group quarters in Inwood in 2010:
12 people in group homes intended for adults
7 people in other noninstitutional facilities
2 people in nursing facilities/skilled-nursing facilities
People in group quarters in Inwood in 2000:
12 people in homes for the mentally retarded
4 people in homes for the mentally ill
4 people in religious group quarters
Banks with branches in Inwood (2011 data):
JPMorgan Chase Bank, National Association: Lawrence Branch at 335 Rockaway Turnpike, branch established on 1965/01/16; Inwood Branch at 583 Burnside Avenue, branch established on 2003/08/11. Info updated 2011/11/10: Bank assets: $1,811,678.0 mil, Deposits: $1,190,738.0 mil, headquarters in Columbus, OH, positive income , International Specialization, 5577 total offices , Holding Company: Jpmorgan Chase & Co.
Citibank, National Association: Inwood Branch at 140 Doughty Boulevard, branch established on 1954/11/15. Info updated 2012/01/10: Bank assets: $1,288,658.0 mil, Deposits: $882,541.0 mil, headquarters in Sioux Falls, SD, positive income , International Specialization, 1048 total offices , Holding Company: Citigroup Inc.
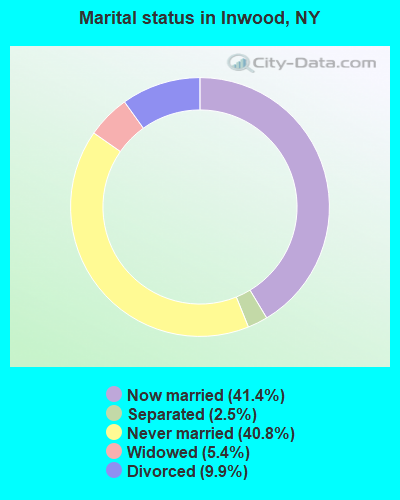
For population 15 years and over in Inwood:
Never married: 40.8%Now married: 41.4%Separated: 2.5%Widowed: 5.4%Divorced: 9.9% For population 25 years and over in Inwood:
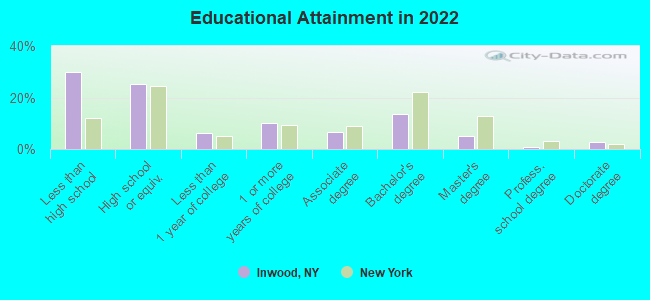
High school or higher: 71.8%Bachelor's degree or higher: 21.8%Graduate or professional degree: 8.1%Unemployed: 6.2%Mean travel time to work (commute): 30.9 minutes
Education Gini index (Inequality in education) Here:
22.7New York average:
13.9
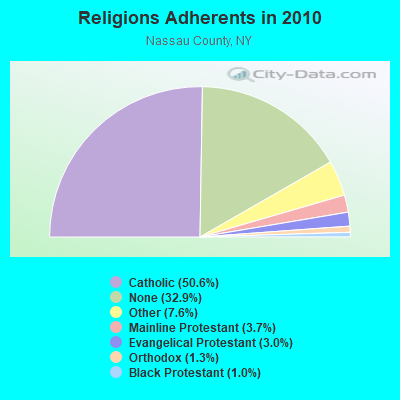
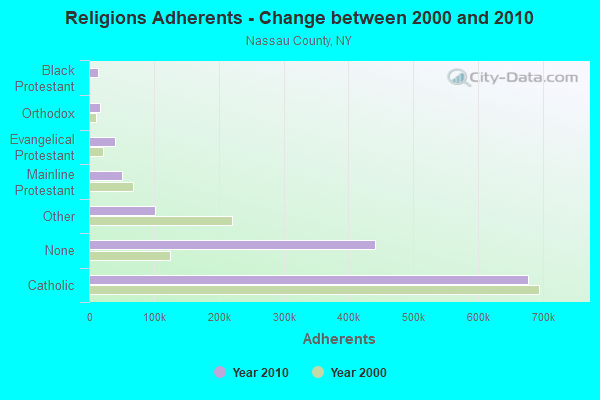
Religion statistics for Inwood, NY (based on Nassau County data)
Religion Adherents Congregations Catholic 677,149 73 Other 102,012 168 Mainline Protestant 50,181 184 Evangelical Protestant 39,923 251 Orthodox 16,758 22 Black Protestant 13,189 45 None 440,320 -
Source: Clifford Grammich, Kirk Hadaway, Richard Houseal, Dale E.Jones, Alexei Krindatch, Richie Stanley and Richard H.Taylor. 2012. 2010 U.S.Religion Census: Religious Congregations & Membership Study. Association of Statisticians of American Religious Bodies. Jones, Dale E., et al. 2002. Congregations and Membership in the United States 2000. Nashville, TN: Glenmary Research Center. Graphs represent county-level data
Food Environment Statistics: Number of grocery stores : 556This county :
4.11 / 10,000 pop.New York :
4.13 / 10,000 pop.
Number of supercenters and club stores : 7Here :
0.05 / 10,000 pop.New York :
0.06 / 10,000 pop.
Number of convenience stores (no gas) : 201This county :
1.49 / 10,000 pop.New York :
0.92 / 10,000 pop.
Number of convenience stores (with gas) : 174This county :
1.29 / 10,000 pop.State :
1.68 / 10,000 pop.
Number of full-service restaurants : 1,219Nassau County :
9.01 / 10,000 pop.New York :
8.82 / 10,000 pop.
Adult obesity rate : This county :
20.9%State :
23.8%
Low-income preschool obesity rate : This county :
22.2%New York :
15.6%
Health and Nutrition: Healthy diet rate : Inwood:
47.6%New York:
50.1%
Average overall health of teeth and gums : This city:
45.8%State:
48.1%
People feeling badly about themselves : People not drinking alcohol at all : Inwood:
12.0%New York:
11.1%
Average hours sleeping at night : General health condition : Inwood:
53.7%New York:
56.5%
Average condition of hearing : More about Health and Nutrition of Inwood, NY Residents
4.70% of this county's 2021 resident taxpayers lived in other counties in 2020 ($121,726 average adjusted gross income )
Here:
4.70%New York average:
5.29%
0.01% of residents moved from foreign countries ($55 average AGI )Nassau County:
0.01%New York average:
0.01%
Top counties from which taxpayers relocated into this county between 2020 and 2021:
5.44% of this county's 2020 resident taxpayers moved to other counties in 2021 ($120,429 average adjusted gross income )
Here:
5.44%New York average:
6.93%
0.01% of residents moved to foreign countries ($114 average AGI )Nassau County:
0.01%New York average:
0.02%
Top counties to which taxpayers relocated from this county between 2020 and 2021:
Businesses in Inwood, NY
Name Count Name Count
CVS 1 Stop & Shop 1 FedEx 3 Subway 1 Nissan 1 U-Haul 1 Papa John's Pizza 1 UPS 3
Strongest AM radio stations in Inwood:
WQEW (1560 AM; 50 kW; NEW YORK, NY; Owner: THE NEW YORK TIMES ELECTRONIC MEDIA COMPANY)
WFAN (660 AM; 50 kW; NEW YORK, NY; Owner: INFINITY BROADCASTING OPERATIONS, INC.)
WCBS (880 AM; 50 kW; NEW YORK, NY; Owner: INFINITY BROADCASTING OPERATIONS, INC.)
WMCA (570 AM; 50 kW; NEW YORK, NY; Owner: SALEM MEDIA OF NEW YORK, LLC)
WOR (710 AM; 50 kW; NEW YORK, NY; Owner: BUCKLEY BROADCASTING CORPORATION)
WHLI (1100 AM; daytime; 10 kW; HEMPSTEAD, NY)
WBBR (1130 AM; 50 kW; NEW YORK, NY; Owner: BLOOMBERG COMMUNICATIONS INC.)
WEPN (1050 AM; 50 kW; NEW YORK, NY; Owner: NEW YORK AM RADIO, LLC)
WABC (770 AM; 50 kW; NEW YORK, NY; Owner: WABC-AM RADIO, INC.)
WINS (1010 AM; 50 kW; NEW YORK, NY; Owner: INFINITY BROADCASTING OPERATIONS, INC.)
WADO (1280 AM; 50 kW; NEW YORK, NY; Owner: WADO-AM LICENSE CORP.)
WGSM (740 AM; 25 kW; HUNTINGTON, NY; Owner: K RADIO LICENSEE, INC.)
WLIB (1190 AM; 30 kW; NEW YORK, NY; Owner: ICBC BROADCAST HOLDINGS-NY, INC.)
Strongest FM radio stations in Inwood:
WNYC-FM (93.9 FM; NEW YORK, NY; Owner: WNYC RADIO)
WPAT-FM (93.1 FM; PATERSON, NJ; Owner: WPAT LICENSING, INC.)
WQCD (101.9 FM; NEW YORK, NY; Owner: EMMIS RADIO LICENSE CORPORATION)
WCAA (105.9 FM; NEWARK, NJ; Owner: WADO-AM LICENSE CORP. ("WADO"))
WKTU (103.5 FM; LAKE SUCCESS, NY; Owner: AMFM RADIO LICENSES, LLC)
WBAI (99.5 FM; NEW YORK, NY; Owner: PACIFICA FOUNDATION, INC.)
WBLS (107.5 FM; NEW YORK, NY; Owner: ICBC BROADCAST HOLDINGS-NY, INC.)
WLTW (106.7 FM; NEW YORK, NY; Owner: AMFM NEW YORK LICENSES, LLC)
WQXR-FM (96.3 FM; NEW YORK, NY; Owner: THE NEW YORK TIMES ELECTRONIC MEDIA COMPANY)
WSKQ-FM (97.9 FM; NEW YORK, NY; Owner: WSKQ LICENSING, INC.)
WXRK (92.3 FM; NEW YORK, NY; Owner: INFINITY BROADCASTING OPERATIONS, INC.)
WQHT (97.1 FM; NEW YORK, NY; Owner: EMMIS LICENSE CORPORATION OF NEW YORK)
WAXQ (104.3 FM; NEW YORK, NY; Owner: AMFM NEW YORK LICENSES, LLC)
WHTZ (100.3 FM; NEWARK, NJ; Owner: AMFM RADIO LICENSES, L.L.C.)
WWPR-FM (105.1 FM; NEW YORK, NY; Owner: AMFM RADIO LICENSES, L.L.C.)
WCBS-FM (101.1 FM; NEW YORK, NY; Owner: INFINITY BROADCASTING OPERATIONS, INC.)
WKCR-FM (89.9 FM; NEW YORK, NY; Owner: TRUSTEES OF COLUMBIA UNIVERSITY IN NEW YORK)
WLIR-FM (92.7 FM; GARDEN CITY, NY; Owner: JARAD BROADCASTING COMPANY INC.)
WNEW (102.7 FM; NEW YORK, NY; Owner: INFINITY BROADCASTING OPERATIONS, INC.)
WKJY (98.3 FM; HEMPSTEAD, NY; Owner: LONG ISLAND BROADCASTING, INC.)
TV broadcast stations around Inwood:
WNYW (Channel 5; NEW YORK, NY; Owner: FOX TELEVISION STATIONS, INC.)
WCBS-TV (Channel 2; NEW YORK, NY; Owner: CBS BROADCASTING INC.)
WABC-TV (Channel 7; NEW YORK, NY; Owner: AMERICAN BROADCASTING COMPANIES, INC)
WPIX (Channel 11; NEW YORK, NY; Owner: WPIX, INC.)
WWOR-TV (Channel 9; SECAUCUS, NJ; Owner: FOX TELEVISION STATIONS, INC.)
WXNY-LP (Channel 32; NEW YORK, NY; Owner: ISLAND BROADCASTING COMPANY)
WPXN-TV (Channel 31; NEW YORK, NY; Owner: PAXSON COMMUNICATIONS LICENSE COMPANY, LLC)
WNJU (Channel 47; LINDEN, NJ; Owner: WNJU LICENSE CORPORATION)
WNBC (Channel 4; NEW YORK, NY; Owner: NATIONAL BROADCASTING COMPANY, INC.)
WNET (Channel 13; NEWARK, NJ; Owner: EDUCATIONAL BROADCASTING CORPORATION)
WXTV (Channel 41; PATERSON, NJ; Owner: WXTV LICENSE PARTNERSHIP, G.P.)
WFUT (Channel 68; NEWARK, NJ; Owner: UNIVISION NEW YORK LLC)
WNYE-TV (Channel 25; NEW YORK, NY; Owner: NEW YORK CITY BOARD OF EDUCATION)
WKOB-LP (Channel 53; NEW YORK, NY; Owner: WKOB COMMUNICATIONS, INC.)
WEBR-CA (Channel 17; MANHATTAN, NY; Owner: K LICENSEE INC.)
WRNN-LP (Channel 57; NYACK, NY; Owner: LP NYACK LIMITED PARTNERSHIP)
W60AI (Channel 60; NEW YORK, NY; Owner: VENTANA TELEVISION, INC.)
WNYX-LP (Channel 35; NEW YORK, NY; Owner: ISLAND BROADCASTING COMPANY)
W33BS (Channel 33; DARIEN, CT; Owner: CT&T BROADCASTING, INC.)
WNYN-LP (Channel 39; NEW YORK, NY; Owner: ISLAND BROADCASTING COMPANY)
WNXY-LP (Channel 26; NEW YORK, NY; Owner: ISLAND BROADCASTING COMPANY)
WPXO-LP (Channel 34; EAST ORANGE, NJ; Owner: PAXSON COMMUNICATIONS LPTV, INC.)
WLIG-LP (Channel 54; MINEOLA, NY; Owner: WLNY-TV, INC.)
WPXU-LP (Channel 38; AMITYVILLE, NY; Owner: PAXSON COMMUNICATIONS LPTV, INC.)
W68DN (Channel 68; CHERRY HILL, ETC., NJ; Owner: MARCIA COHEN)
FCC Registered Antenna Towers: 23 (
See the full list of FCC Registered Antenna Towers in Inwood )
FCC Registered Broadcast Land Mobile Towers: 10 (
See the full list of FCC Registered Broadcast Land Mobile Towers in Inwood, NY )
FCC Registered Microwave Towers: 5
Various Locations (Lat: 40.622861 Lon: -73.749556), Overall height: 6.1 m, Call Sign: WPJC838, Assigned Frequencies: 952.681 MHz, Grant Date: 11/10/2020, Expiration Date: 12/14/2030, Certifier: Lynda Nicolino, Registrant: Long Island Power Authority, 175 E. Old Country Rd., Operations 2 Bldg 2nd Floor, Hicksville, NY 11801, Phone: (516) 949-2100, Fax: (516) 949-8346, Email:
INWOOD, Various Locations (Lat: 40.622861 Lon: -73.749556), Type: N/A, Structure height: 6.1 m, Call Sign: WPOQ271, Licensee ID: L00194394, Assigned Frequencies: 956.418 MHz, 956.418 MHz, 956.418 MHz, Grant Date: 09/05/2018, Expiration Date: 10/21/2028, Certifier: Lynda Nicolino, Registrant: Long Island Power Authority 280 HENRY STREET, 280 Henry Street (Lat: 40.621389 Lon: -73.741417), Type: Tower, Structure height: 44.2 m, Overall height: 47.2 m, Call Sign: WQJX783, Assigned Frequencies: 17850.0 MHz, Grant Date: 02/05/2009, Expiration Date: 02/01/2019, Cancellation Date: 01/11/2010, Certifier: James J.R. Talbot, Registrant: At&t Corp., 2315 Salem Road, First Floor, H9, Conyers, GA 30013, Phone: (770) 602-2065, Fax: (770) 929-4454, Email:
NY-LIS5009A, 280 Henry Street (307196) (Lat: 40.621417 Lon: -73.741444), Type: Tower, Structure height: 40.5 m, Overall height: 44.5 m, Call Sign: WQLT809, Assigned Frequencies: 10775.0 MHz, 17965.0 MHz, 10855.0 MHz, 10775.0 MHz, 23325.0 MHz, Grant Date: 07/13/2020, Expiration Date: 04/23/2030, Cancellation Date: 09/13/2021, Certifier: Nadja S Sodos-Wallace, Registrant: T-Mobile Usa, Inc., 12920 Se 38th Street, Bellevue, WA 98006, Phone: (425) 383-8402, Fax: (425) 383-4840, Email:
INWOOD, Bayview Ave (At Intersection Of Alemada Ave) Mineola, Ny 11096 (Lat: 40.613833 Lon: -73.759361), Type: Ltower, Structure height: 51.8 m, Call Sign: WQTU852, Assigned Frequencies: 10715.0 MHz, 6034.15 MHz, 5945.20 MHz, 6555.00 MHz, 6685.00 MHz, Grant Date: 01/23/2024, Expiration Date: 04/17/2034, Certifier: Elizabeth Bella, Registrant: Nassau County Police Department, 1194 Prospect Avenue, Westbury, NY 11590, Phone: (516) 573-8640, Fax: (516) 573-8764, Email:
FCC Registered Amateur Radio Licenses: 8 (
See the full list of FCC Registered Amateur Radio Licenses in Inwood )
FAA Registered Aircraft Manufacturers and Dealers: 1
TAVALARO JOSEPH DBA, 111 Roger Ave, Inwood, NY 11096Certificate: 04-1310 (Individual), Certificate Issue Date: 06/29/2004, Expiration Date: 06/28/2005
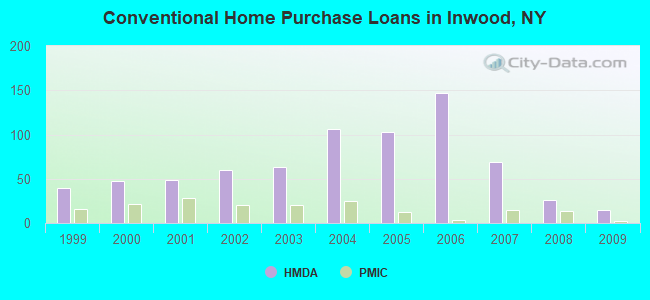
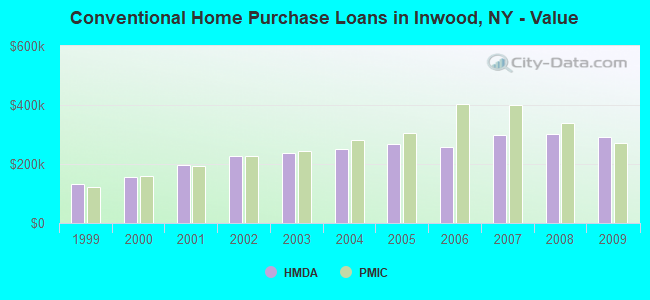
Home Mortgage Disclosure Act Aggregated Statistics For Year 2009(Based on 2 full tracts) A) FHA, FSA/RHS & VA B) Conventional C) Refinancings D) Home Improvement Loans E) Loans on Dwellings For 5+ Families F) Non-occupant Loans on Number Average Value Number Average Value Number Average Value Number Average Value Number Average Value Number Average Value
LOANS ORIGINATED 12 $321,722 15 $290,242 37 $260,810 6 $127,110 0 $0 4 $302,850 APPLICATIONS APPROVED, NOT ACCEPTED 1 $908,270 0 $0 9 $255,556 3 $59,890 0 $0 0 $0 APPLICATIONS DENIED 5 $380,832 5 $308,992 35 $274,017 6 $58,928 1 $15,652,900 6 $283,793 APPLICATIONS WITHDRAWN 1 $295,000 1 $300,000 17 $326,298 0 $0 0 $0 1 $300,000 FILES CLOSED FOR INCOMPLETENESS 0 $0 2 $360,455 4 $217,848 1 $489,000 0 $0 0 $0
Aggregated Statistics For Year 2008(Based on 2 full tracts) A) FHA, FSA/RHS & VA B) Conventional C) Refinancings D) Home Improvement Loans F) Non-occupant Loans on G) Loans On Manufactured Number Average Value Number Average Value Number Average Value Number Average Value Number Average Value Number Average Value
LOANS ORIGINATED 4 $299,000 26 $301,564 38 $277,463 13 $38,255 7 $261,211 0 $0 APPLICATIONS APPROVED, NOT ACCEPTED 1 $354,000 6 $346,145 17 $298,146 3 $35,333 1 $471,580 0 $0 APPLICATIONS DENIED 0 $0 21 $278,655 63 $338,651 11 $110,249 14 $290,999 0 $0 APPLICATIONS WITHDRAWN 2 $338,000 0 $0 8 $301,782 4 $235,138 2 $227,005 1 $84,750 FILES CLOSED FOR INCOMPLETENESS 0 $0 4 $392,502 10 $362,851 1 $24,930 2 $234,295 0 $0
Aggregated Statistics For Year 2007(Based on 2 full tracts) A) FHA, FSA/RHS & VA B) Conventional C) Refinancings D) Home Improvement Loans E) Loans on Dwellings For 5+ Families F) Non-occupant Loans on Number Average Value Number Average Value Number Average Value Number Average Value Number Average Value Number Average Value
LOANS ORIGINATED 1 $300,000 69 $299,485 101 $276,804 13 $150,226 1 $469,590 15 $274,499 APPLICATIONS APPROVED, NOT ACCEPTED 0 $0 12 $265,838 45 $288,889 10 $65,976 0 $0 5 $364,378 APPLICATIONS DENIED 0 $0 67 $333,477 121 $331,983 32 $127,389 0 $0 29 $280,251 APPLICATIONS WITHDRAWN 0 $0 7 $284,663 44 $356,239 2 $152,000 0 $0 4 $436,368 FILES CLOSED FOR INCOMPLETENESS 0 $0 8 $281,032 20 $296,909 1 $40,000 0 $0 6 $271,127
Aggregated Statistics For Year 2006(Based on 2 full tracts) A) FHA, FSA/RHS & VA B) Conventional C) Refinancings D) Home Improvement Loans E) Loans on Dwellings For 5+ Families F) Non-occupant Loans on G) Loans On Manufactured Number Average Value Number Average Value Number Average Value Number Average Value Number Average Value Number Average Value Number Average Value
LOANS ORIGINATED 2 $244,090 147 $256,472 166 $284,797 15 $218,411 1 $525,000 30 $355,650 0 $0 APPLICATIONS APPROVED, NOT ACCEPTED 1 $265,200 30 $236,704 38 $256,521 9 $119,001 0 $0 1 $390,820 0 $0 APPLICATIONS DENIED 0 $0 74 $267,266 121 $301,458 21 $115,696 1 $14,207,250 9 $315,569 3 $163,840 APPLICATIONS WITHDRAWN 1 $440,670 25 $320,455 78 $284,181 8 $154,870 0 $0 6 $286,850 0 $0 FILES CLOSED FOR INCOMPLETENESS 0 $0 4 $375,000 25 $305,721 1 $260,000 0 $0 2 $306,080 0 $0
Aggregated Statistics For Year 2005(Based on 2 full tracts) A) FHA, FSA/RHS & VA B) Conventional C) Refinancings D) Home Improvement Loans E) Loans on Dwellings For 5+ Families F) Non-occupant Loans on Number Average Value Number Average Value Number Average Value Number Average Value Number Average Value Number Average Value
LOANS ORIGINATED 4 $310,565 103 $267,626 186 $248,240 20 $168,114 1 $498,500 23 $264,910 APPLICATIONS APPROVED, NOT ACCEPTED 0 $0 21 $256,430 38 $265,039 5 $235,624 0 $0 6 $271,380 APPLICATIONS DENIED 1 $393,820 44 $286,494 115 $277,971 26 $174,717 0 $0 10 $388,027 APPLICATIONS WITHDRAWN 1 $318,000 37 $277,454 106 $257,399 16 $277,388 0 $0 16 $221,293 FILES CLOSED FOR INCOMPLETENESS 0 $0 7 $246,749 59 $308,847 1 $25,000 0 $0 1 $249,250
Aggregated Statistics For Year 2004(Based on 2 full tracts) A) FHA, FSA/RHS & VA B) Conventional C) Refinancings D) Home Improvement Loans E) Loans on Dwellings For 5+ Families F) Non-occupant Loans on Number Average Value Number Average Value Number Average Value Number Average Value Number Average Value Number Average Value
LOANS ORIGINATED 3 $227,240 106 $249,169 167 $228,530 16 $106,184 1 $300,000 33 $249,008 APPLICATIONS APPROVED, NOT ACCEPTED 0 $0 32 $286,371 53 $240,367 7 $231,354 0 $0 10 $288,800 APPLICATIONS DENIED 0 $0 44 $268,983 119 $250,307 30 $68,892 0 $0 15 $246,723 APPLICATIONS WITHDRAWN 0 $0 23 $304,961 104 $214,365 10 $145,070 0 $0 7 $243,253 FILES CLOSED FOR INCOMPLETENESS 0 $0 6 $255,797 31 $263,013 6 $210,963 0 $0 3 $149,000
Aggregated Statistics For Year 2003(Based on 2 full tracts) A) FHA, FSA/RHS & VA B) Conventional C) Refinancings D) Home Improvement Loans E) Loans on Dwellings For 5+ Families F) Non-occupant Loans on Number Average Value Number Average Value Number Average Value Number Average Value Number Average Value Number Average Value
LOANS ORIGINATED 15 $230,457 63 $235,867 236 $184,439 11 $65,689 1 $300,000 29 $181,269 APPLICATIONS APPROVED, NOT ACCEPTED 1 $194,000 12 $258,716 49 $182,515 3 $42,593 0 $0 6 $233,917 APPLICATIONS DENIED 2 $186,180 24 $255,687 99 $177,534 22 $44,728 0 $0 15 $185,138 APPLICATIONS WITHDRAWN 2 $162,510 16 $227,256 92 $182,080 7 $29,960 0 $0 10 $196,802 FILES CLOSED FOR INCOMPLETENESS 1 $169,000 0 $0 9 $180,854 2 $43,870 0 $0 2 $144,565
Aggregated Statistics For Year 2002(Based on 2 full tracts) A) FHA, FSA/RHS & VA B) Conventional C) Refinancings D) Home Improvement Loans E) Loans on Dwellings For 5+ Families F) Non-occupant Loans on Number Average Value Number Average Value Number Average Value Number Average Value Number Average Value Number Average Value
LOANS ORIGINATED 11 $179,342 60 $226,273 165 $161,865 12 $40,638 0 $0 19 $206,279 APPLICATIONS APPROVED, NOT ACCEPTED 1 $250,250 19 $247,015 46 $172,345 13 $37,280 1 $219,340 4 $252,242 APPLICATIONS DENIED 0 $0 26 $243,382 108 $174,319 26 $43,603 0 $0 10 $163,359 APPLICATIONS WITHDRAWN 1 $158,000 11 $221,874 56 $171,921 14 $48,034 0 $0 2 $232,095 FILES CLOSED FOR INCOMPLETENESS 0 $0 0 $0 24 $146,745 0 $0 0 $0 0 $0
Aggregated Statistics For Year 2001(Based on 2 full tracts) A) FHA, FSA/RHS & VA B) Conventional C) Refinancings D) Home Improvement Loans E) Loans on Dwellings For 5+ Families F) Non-occupant Loans on Number Average Value Number Average Value Number Average Value Number Average Value Number Average Value Number Average Value
LOANS ORIGINATED 10 $177,246 49 $195,823 119 $147,001 14 $88,737 1 $311,000 10 $167,809 APPLICATIONS APPROVED, NOT ACCEPTED 0 $0 5 $178,604 34 $127,100 5 $47,994 0 $0 3 $143,357 APPLICATIONS DENIED 6 $184,093 15 $229,243 85 $129,744 21 $31,440 0 $0 7 $155,289 APPLICATIONS WITHDRAWN 6 $204,940 5 $177,864 47 $128,846 3 $26,587 0 $0 3 $214,730 FILES CLOSED FOR INCOMPLETENESS 0 $0 3 $161,200 14 $163,079 0 $0 0 $0 1 $208,000
Aggregated Statistics For Year 2000(Based on 2 full tracts) A) FHA, FSA/RHS & VA B) Conventional C) Refinancings D) Home Improvement Loans F) Non-occupant Loans on Number Average Value Number Average Value Number Average Value Number Average Value Number Average Value
LOANS ORIGINATED 16 $186,845 48 $157,504 52 $122,864 12 $22,552 10 $135,130 APPLICATIONS APPROVED, NOT ACCEPTED 1 $127,000 11 $147,316 9 $116,059 12 $36,882 1 $158,000 APPLICATIONS DENIED 3 $171,667 33 $162,485 75 $105,355 31 $32,017 7 $97,970 APPLICATIONS WITHDRAWN 1 $171,480 10 $150,661 61 $103,979 4 $44,385 2 $73,500 FILES CLOSED FOR INCOMPLETENESS 2 $190,925 3 $133,000 17 $146,611 1 $25,000 2 $205,080
Aggregated Statistics For Year 1999(Based on 1 full and 1 partial tracts) A) FHA, FSA/RHS & VA B) Conventional C) Refinancings D) Home Improvement Loans E) Loans on Dwellings For 5+ Families F) Non-occupant Loans on Number Average Value Number Average Value Number Average Value Number Average Value Number Average Value Number Average Value
LOANS ORIGINATED 16 $165,406 40 $133,533 70 $115,518 23 $20,960 1 $155,830 12 $132,028 APPLICATIONS APPROVED, NOT ACCEPTED 0 $0 11 $127,663 29 $100,836 5 $39,394 0 $0 2 $126,915 APPLICATIONS DENIED 2 $192,745 22 $134,764 52 $96,280 10 $40,720 0 $0 4 $120,128 APPLICATIONS WITHDRAWN 4 $124,225 9 $122,214 66 $101,949 8 $49,392 0 $0 4 $119,705 FILES CLOSED FOR INCOMPLETENESS 1 $226,000 5 $115,050 10 $138,808 1 $16,800 0 $0 0 $0
Detailed HMDA statistics for the following Tracts:
4110.00
, 4111.00
Private Mortgage Insurance Companies Aggregated Statistics For Year 2009(Based on 1 full tract) A) Conventional Number Average Value
LOANS ORIGINATED 2 $269,500 APPLICATIONS APPROVED, NOT ACCEPTED 2 $299,500 APPLICATIONS DENIED 1 $352,000 APPLICATIONS WITHDRAWN 1 $342,000 FILES CLOSED FOR INCOMPLETENESS 1 $298,000
Aggregated Statistics For Year 2008(Based on 2 full tracts) A) Conventional B) Refinancings C) Non-occupant Loans on Number Average Value Number Average Value Number Average Value
LOANS ORIGINATED 14 $339,728 2 $372,480 1 $396,000 APPLICATIONS APPROVED, NOT ACCEPTED 7 $295,834 6 $450,375 1 $322,030 APPLICATIONS DENIED 2 $306,500 0 $0 1 $315,000 APPLICATIONS WITHDRAWN 2 $314,500 1 $376,870 0 $0 FILES CLOSED FOR INCOMPLETENESS 1 $568,290 1 $325,000 2 $446,645
Aggregated Statistics For Year 2007(Based on 2 full tracts) A) Conventional B) Refinancings C) Non-occupant Loans on Number Average Value Number Average Value Number Average Value
LOANS ORIGINATED 15 $399,164 4 $403,638 0 $0 APPLICATIONS APPROVED, NOT ACCEPTED 3 $277,900 2 $396,875 0 $0 APPLICATIONS DENIED 1 $371,000 1 $395,810 0 $0 APPLICATIONS WITHDRAWN 1 $765,000 0 $0 1 $765,000 FILES CLOSED FOR INCOMPLETENESS 0 $0 0 $0 0 $0
Aggregated Statistics For Year 2006(Based on 2 full tracts) A) Conventional B) Refinancings C) Non-occupant Loans on Number Average Value Number Average Value Number Average Value
LOANS ORIGINATED 3 $404,667 2 $410,805 1 $395,000 APPLICATIONS APPROVED, NOT ACCEPTED 3 $302,090 3 $421,567 0 $0 APPLICATIONS DENIED 0 $0 0 $0 0 $0 APPLICATIONS WITHDRAWN 1 $191,420 0 $0 1 $191,420 FILES CLOSED FOR INCOMPLETENESS 0 $0 0 $0 0 $0
Aggregated Statistics For Year 2005(Based on 2 full tracts) A) Conventional B) Refinancings C) Non-occupant Loans on Number Average Value Number Average Value Number Average Value
LOANS ORIGINATED 12 $305,282 5 $324,270 2 $229,350 APPLICATIONS APPROVED, NOT ACCEPTED 2 $279,000 5 $288,252 2 $279,000 APPLICATIONS DENIED 0 $0 1 $360,000 1 $360,000 APPLICATIONS WITHDRAWN 2 $428,195 1 $260,220 0 $0 FILES CLOSED FOR INCOMPLETENESS 1 $167,000 0 $0 1 $167,000
Aggregated Statistics For Year 2004(Based on 2 full tracts) A) Conventional B) Refinancings C) Non-occupant Loans on Number Average Value Number Average Value Number Average Value
LOANS ORIGINATED 25 $280,244 6 $283,898 2 $290,115 APPLICATIONS APPROVED, NOT ACCEPTED 12 $287,645 0 $0 0 $0 APPLICATIONS DENIED 0 $0 3 $349,967 2 $342,000 APPLICATIONS WITHDRAWN 1 $167,000 2 $367,405 2 $253,500 FILES CLOSED FOR INCOMPLETENESS 0 $0 1 $201,390 0 $0
Aggregated Statistics For Year 2003(Based on 2 full tracts) A) Conventional B) Refinancings C) Non-occupant Loans on Number Average Value Number Average Value Number Average Value
LOANS ORIGINATED 20 $242,714 11 $220,645 1 $137,590 APPLICATIONS APPROVED, NOT ACCEPTED 8 $280,336 5 $207,400 0 $0 APPLICATIONS DENIED 0 $0 1 $354,930 1 $354,930 APPLICATIONS WITHDRAWN 3 $289,400 1 $292,120 0 $0 FILES CLOSED FOR INCOMPLETENESS 0 $0 0 $0 0 $0
Aggregated Statistics For Year 2002(Based on 2 full tracts) A) Conventional B) Refinancings C) Non-occupant Loans on Number Average Value Number Average Value Number Average Value
LOANS ORIGINATED 20 $225,499 6 $378,250 2 $117,345 APPLICATIONS APPROVED, NOT ACCEPTED 10 $232,156 4 $273,838 0 $0 APPLICATIONS DENIED 1 $352,000 2 $358,000 0 $0 APPLICATIONS WITHDRAWN 1 $244,260 1 $265,000 0 $0 FILES CLOSED FOR INCOMPLETENESS 0 $0 0 $0 0 $0
Aggregated Statistics For Year 2001(Based on 2 full tracts) A) Conventional B) Refinancings Number Average Value Number Average Value
LOANS ORIGINATED 28 $194,744 7 $180,089 APPLICATIONS APPROVED, NOT ACCEPTED 6 $184,415 2 $178,500 APPLICATIONS DENIED 1 $301,090 1 $207,380 APPLICATIONS WITHDRAWN 0 $0 0 $0 FILES CLOSED FOR INCOMPLETENESS 1 $225,000 0 $0
Aggregated Statistics For Year 2000(Based on 2 full tracts) A) Conventional B) Refinancings C) Non-occupant Loans on Number Average Value Number Average Value Number Average Value
LOANS ORIGINATED 22 $159,074 3 $181,667 2 $117,345 APPLICATIONS APPROVED, NOT ACCEPTED 4 $142,250 2 $172,215 0 $0 APPLICATIONS DENIED 1 $135,000 1 $132,000 0 $0 APPLICATIONS WITHDRAWN 1 $222,000 0 $0 0 $0 FILES CLOSED FOR INCOMPLETENESS 0 $0 0 $0 0 $0
Aggregated Statistics For Year 1999(Based on 1 full and 1 partial tracts) A) Conventional B) Refinancings C) Non-occupant Loans on Number Average Value Number Average Value Number Average Value
LOANS ORIGINATED 16 $122,399 7 $157,101 0 $0 APPLICATIONS APPROVED, NOT ACCEPTED 2 $115,915 1 $201,550 0 $0 APPLICATIONS DENIED 4 $198,518 1 $201,550 1 $122,240 APPLICATIONS WITHDRAWN 1 $140,000 0 $0 0 $0 FILES CLOSED FOR INCOMPLETENESS 0 $0 0 $0 0 $0
Detailed PMIC statistics for the following Tracts:
4110.00
, 4111.00
Most common first names in Inwood, NY among deceased individuals Name Count Lived (average)
John 82 73.2 years Joseph 64 71.9 years Mary 58 79.3 years Frank 46 71.9 years James 43 70.1 years William 38 69.8 years Anthony 28 72.5 years Anna 27 80.8 years Rose 26 78.7 years Margaret 25 79.5 years
Most common last names in Inwood, NY among deceased individuals Last name Count Lived (average)
Johnson 22 70.0 years Brown 21 75.0 years Davis 18 72.7 years Smith 17 67.1 years Rizzo 17 77.1 years Ferraro 14 79.4 years Wilson 14 74.9 years Capone 14 78.8 years Williams 13 75.4 years Jones 12 61.7 years
Inwood compared to New York state average:
Unemployed percentage below state average. Hispanic race population percentage above state average. Median age below state average. Foreign-born population percentage above state average. Length of stay since moving in significantly above state average.
#14 on the list of "Top 101 cities with the most residents born in El Salvador (population 500+)"
#15 on the list of "Top 101 cities with the most residents born in Trinidad and Tobago (population 500+)"
#22 on the list of "Top 101 cities with largest percentage of females in industries: other services, except public administration (population 5,000+)"
#26 on the list of "Top 101 cities with the most people taking a taxi to work (population 5,000+)"
#30 on the list of "Top 101 cities with largest percentage of males in industries: administrative and support and waste management services (population 5,000+)"
#32 on the list of "Top 101 cities with largest percentage of females in occupations: building and grounds cleaning and maintenance occupations (population 5,000+)"
#38 on the list of "Top 101 cities with the most residents born in Chile (population 500+)"
#51 on the list of "Top 101 cities with largest percentage of males in occupations: building and grounds cleaning and maintenance occupations (population 5,000+)"
#72 on the list of "Top 101 cities with the most residents born in Italy (population 500+)"
#74 on the list of "Top 101 cities with largest percentage of females in industries: transportation and warehousing (population 5,000+)"
#85 on the list of "Top 101 cities with largest percentage of females in occupations: personal care and service occupations (population 5,000+)"
#98 on the list of "Top 101 cities with the most people taking subway or elevated to work (population 5,000+)"
#8 on the list of "Top 101 counties with the most Orthodox adherents"
#9 on the list of "Top 101 counties with the most Catholic adherents"
#11 on the list of "Top 101 counties with the lowest percentage of residents that keep firearms around their homes"
#13 on the list of "Top 101 counties with the highest ground withdrawal of fresh water for public supply"
#13 on the list of "Top 101 counties with the most Orthodox congregations"
Top Patent Applicants
Nissim Isaacson (1)
William Frei (1)
Shankar Hariharan (1)
Zoltan Olah (1)
Stephanie Jo Rodgers (1)
Glenn Jawitz (1)
Eddie Cross (1)
Total of 5 patent applications in 2008-2024.


 Recent articles from our blog. Our writers, many of them Ph.D. graduates or candidates, create easy-to-read articles on a wide variety of topics.

 (7.7 miles
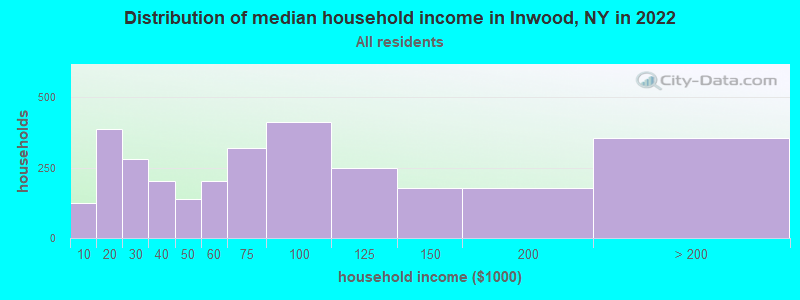


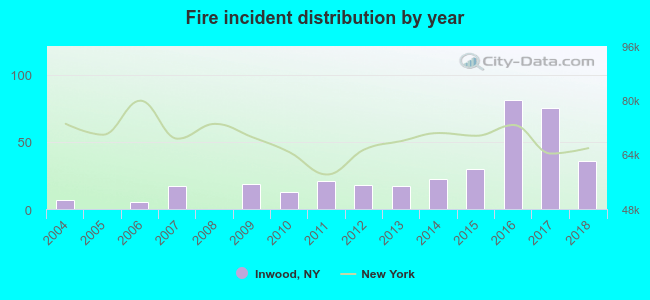 According to the data from the years 2004 - 2018 the average number of fires per year is 24. The highest number of reported fire incidents - 81 took place in 2016, and the least - 0 in 2005. The data has an increasing trend.
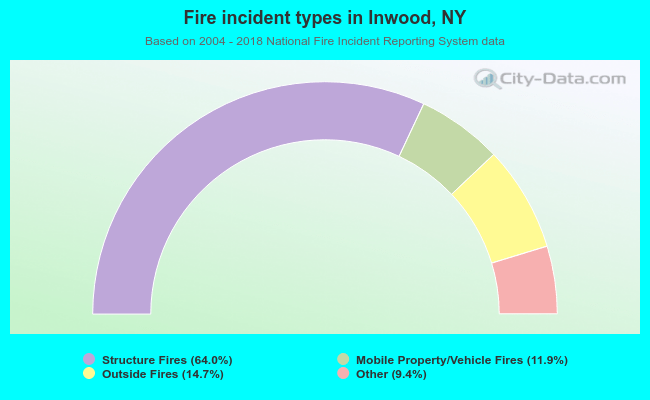 When looking into fire subcategories, the most incidents belonged to: Structure Fires (64.0%), and Outside Fires (14.7%).