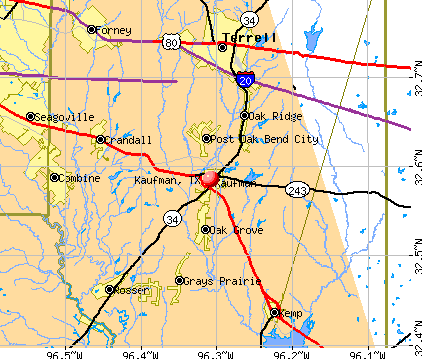
Kaufman, Texas
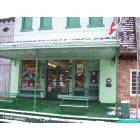
Kaufman: Greenslade Drug Store in Kaufman - Snow in Texas
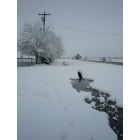
Kaufman: 2010 Kaufman, TX
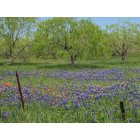
Kaufman: Bluebonnets
- add
your
Submit your own pictures of this city and show them to the world
- OSM Map
- General Map
- Google Map
- MSN Map
Population change since 2000: +29.2%
 |
| Males: 4,129 | |
| Females: 4,259 |
| Median resident age: | 29.6 years |
| Texas median age: | 35.6 years |
Zip codes: 75142.
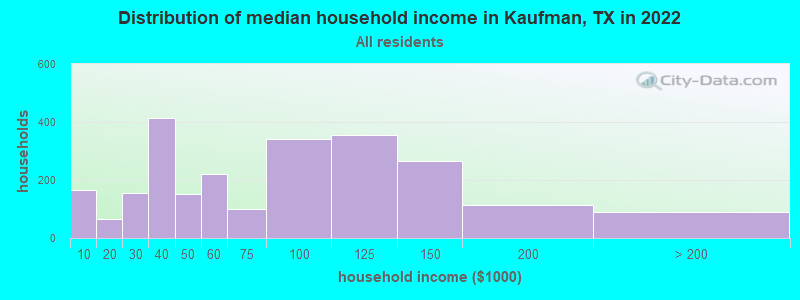
| Kaufman: | $62,454 |
| TX: | $72,284 |
Estimated per capita income in 2022: $26,210 (it was $15,024 in 2000)
Kaufman city income, earnings, and wages data
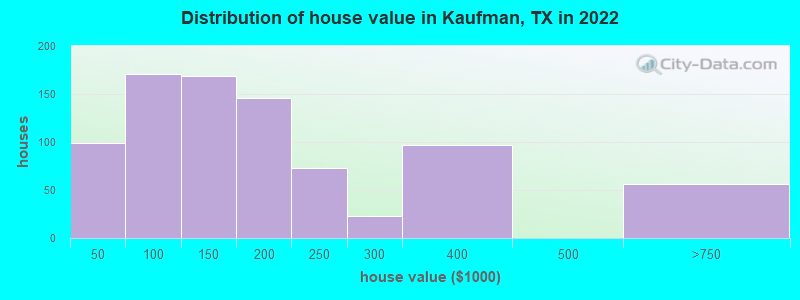
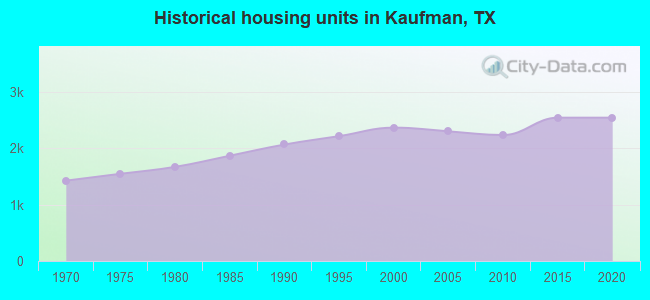
Estimated median house or condo value in 2022: $186,032 (it was $61,000 in 2000)
| Kaufman: | $186,032 |
| TX: | $275,400 |
Mean prices in 2022: all housing units: $419,762; detached houses: $442,029; mobile homes: $141,797
Median gross rent in 2022: $1,390.
(9.4% for White Non-Hispanic residents, 26.9% for Black residents, 27.2% for Hispanic or Latino residents, 11.7% for other race residents, 9.5% for two or more races residents)
Detailed information about poverty and poor residents in Kaufman, TX


Compare current foreclosures near Kaufman, TX:
| Photo | Address | Area | Beds / Baths | Price | Details |
|---|---|---|---|---|---|

|
#1
E Grove St
Kaufman, TX 75142
|
2,945 sq. feet
|
3 baths 4 beds |
show details | |

|
#2
W 4th St
Kaufman, TX 75142
|
1,568 sq. feet
|
1 baths - beds |
show details | |

|
#3
Co Rd 122
Kaufman, TX 75142
|
- sq. feet
|
2 baths 5 beds |
show details | |

|
#4
Lee St
Kaufman, TX 75142
|
1,252 sq. feet
|
2 baths - beds |
show details | |

|
#5
Leon St
Kaufman, TX 75142
|
2,196 sq. feet
|
1 baths - beds |
show details | |

|
#6
E 9th St
Kaufman, TX 75142
|
1,575 sq. feet
|
2 baths - beds |
show details | |

|
#7
Cabell St
Kaufman, TX 75142
|
1,064 sq. feet
|
1 baths - beds |
show details | |

|
#8
Frann Dr
Kaufman, TX 75142
|
1,624 sq. feet
|
1 baths - beds |
show details | |

|
#9
County Road 103
Kaufman, TX 75142
|
- sq. feet
|
- baths - beds |
show details | |

|
#10
Cheryl Ln
Kaufman, TX 75142
|
2,432 sq. feet
|
- baths - beds |
show details |
| Photo | Address | Area | Beds / Baths | Price | Details |
|---|---|---|---|---|---|

|
#11
County Road 4098
Kaufman, TX 75142
|
2,823 sq. feet
|
- baths - beds |
show details | |

|
#12
Melody Cir
Kaufman, TX 75142
|
- sq. feet
|
- baths - beds |
show details | |

|
#13
S Monroe St
Kaufman, TX 75142
|
- sq. feet
|
- baths - beds |
show details | |

|
#14
County Road 107
Kaufman, TX 75142
|
- sq. feet
|
- baths - beds |
show details | |

|
#15
County Road 158
Kaufman, TX 75142
|
- sq. feet
|
- baths - beds |
show details | |

|
#16
Highland Acres Dr
Kaufman, TX 75142
|
- sq. feet
|
- baths - beds |
show details | |

|
#17
Spangler Ct
Kaufman, TX 75142
|
- sq. feet
|
- baths - beds |
show details | |

|
#18
Sublett Way
Kaufman, TX 75142
|
- sq. feet
|
- baths - beds |
show details | |

|
#19
Tavistock Road
Forney, TX 75126
|
2,857 sq. feet
|
2 baths 3 beds |
$354,900
|
show details |

|
#20
County Road 122
Kaufman, TX 75142
|
- sq. feet
|
- baths - beds |
show details |
| Photo | Address | Area | Beds / Baths | Price | Details |
|---|---|---|---|---|---|

|
#21
Clear Springs Dr
Forney, TX 75126
|
1,654 sq. feet
|
2 baths 3 beds |
show details | |

|
#22
Pheasant Ln
Forney, TX 75126
|
4,918 sq. feet
|
3 baths 4 beds |
show details | |

|
#23
County Road 376
Terrell, TX 75161
|
1,152 sq. feet
|
2 baths 3 beds |
show details | |

|
#24
Homestead Ln
Forney, TX 75126
|
1,724 sq. feet
|
2 baths 4 beds |
show details | |

|
#25
Prairie Lakes Ln
Forney, TX 75126
|
2,854 sq. feet
|
3 baths 4 beds |
show details | |

|
#26
Knoxbridge Rd
Forney, TX 75126
|
- sq. feet
|
3 baths 4 beds |
show details | |

|
#27
Josefina Lane
Forney, TX 75126
|
1,508 sq. feet
|
2 baths 3 beds |
show details | |

|
#28
Thedford Rd
Seagoville, TX 75159
|
1,248 sq. feet
|
2 baths 3 beds |
show details | |

|
#29
Samantha Ln
Forney, TX 75126
|
3,310 sq. feet
|
2 baths 4 beds |
show details | |

|
#30
Bantry Ln
Forney, TX 75126
|
2,392 sq. feet
|
2 baths 3 beds |
show details |
| Photo | Address | Area | Beds / Baths | Price | Details |
|---|---|---|---|---|---|

|
#31
Willow Creek Ln
Terrell, TX 75160
|
1,634 sq. feet
|
2 baths 3 beds |
show details | |

|
#32
Woodside Ln
Seagoville, TX 75159
|
1,316 sq. feet
|
2 baths 3 beds |
show details | |

|
#33
Silver Creek Dr
Mesquite, TX 75181
|
2,667 sq. feet
|
2 baths 4 beds |
show details | |

|
#34
Glenwood Trl
Forney, TX 75126
|
3,424 sq. feet
|
3 baths 4 beds |
show details | |

|
#35
Angel Way
Forney, TX 75126
|
1,408 sq. feet
|
2 baths 3 beds |
show details | |

|
#36
Angel Way
Forney, TX 75126
|
985 sq. feet
|
2 baths 3 beds |
show details | |

|
#37
Creekwood Ct
Forney, TX 75126
|
2,802 sq. feet
|
2 baths 4 beds |
show details | |

|
#38
Eric Dr
Forney, TX 75126
|
1,506 sq. feet
|
2 baths 3 beds |
show details | |

|
#39
Sparrow
Forney, TX 75126
|
2,921 sq. feet
|
3 baths 4 beds |
show details | |

|
#40
Stagecoach Trl
Forney, TX 75126
|
1,509 sq. feet
|
2 baths 3 beds |
show details |
| Photo | Address | Area | Beds / Baths | Price | Details |
|---|---|---|---|---|---|

|
#41
Fox Chase Dr
Forney, TX 75126
|
2,718 sq. feet
|
2 baths 3 beds |
show details | |

|
#42
Ard Rd
Seagoville, TX 75159
|
1,930 sq. feet
|
2 baths 3 beds |
show details | |

|
#43
Elmo Dr
Seagoville, TX 75159
|
500 sq. feet
|
1 baths 1 beds |
show details | |

|
#44
Creekwood Trl
Forney, TX 75126
|
2,804 sq. feet
|
2 baths 4 beds |
show details | |

|
#45
Painted Trl
Forney, TX 75126
|
1,811 sq. feet
|
2 baths 3 beds |
show details | |

|
#46
Club Oak Dr
Forney, TX 75126
|
1,950 sq. feet
|
2 baths 3 beds |
show details | |

|
#47
Meg Ln
Forney, TX 75126
|
2,969 sq. feet
|
3 baths 4 beds |
show details | |

|
#48
Monarch Dr
Mesquite, TX 75181
|
2,891 sq. feet
|
2 baths 4 beds |
show details | |

|
#49
Monarch Dr
Mesquite, TX 75181
|
3,596 sq. feet
|
2 baths 4 beds |
show details | |

|
Check over 1 million property listings on Foreclosure.com!
|
browse all offers | |||


- 4,07747.1%White alone
- 3,30138.1%Hispanic
- 1,05812.2%Black alone
- 1551.8%Two or more races
- 150.2%American Indian alone
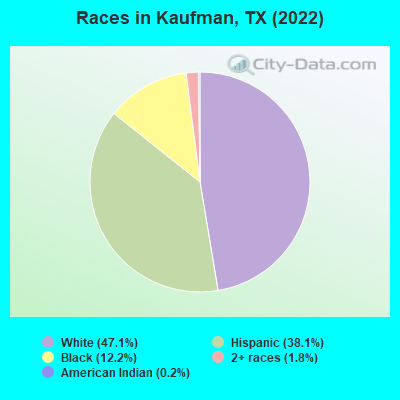
Races in Kaufman detailed stats: ancestries, foreign born residents, place of birth
According to our research of Texas and other state lists, there were 55 registered sex offenders living in Kaufman, Texas as of June 16, 2024.
The ratio of all residents to sex offenders in Kaufman is 133 to 1.
Type |
2009 |
2010 |
2011 |
2012 |
2013 |
2014 |
2015 |
2016 |
2017 |
2018 |
2019 |
2020 |
2021 |
2022 |
|---|---|---|---|---|---|---|---|---|---|---|---|---|---|---|
| Murders (per 100,000) | 0 (0.0) | 0 (0.0) | 0 (0.0) | 0 (0.0) | 1 (14.6) | 0 (0.0) | 0 (0.0) | 0 (0.0) | 0 (0.0) | 0 (0.0) | 0 (0.0) | 0 (0.0) | 0 (0.0) | 0 (0.0) |
| Rapes (per 100,000) | 0 (0.0) | 0 (0.0) | 0 (0.0) | 0 (0.0) | 0 (0.0) | 2 (28.7) | 3 (42.6) | 1 (13.8) | 6 (82.5) | 4 (53.9) | 4 (52.8) | 3 (37.8) | 2 (22.7) | 1 (12.8) |
| Robberies (per 100,000) | 4 (44.1) | 4 (59.7) | 5 (73.1) | 4 (57.7) | 5 (72.8) | 6 (86.1) | 2 (28.4) | 0 (0.0) | 4 (55.0) | 1 (13.5) | 2 (26.4) | 3 (37.8) | 0 (0.0) | 3 (38.3) |
| Assaults (per 100,000) | 11 (121.2) | 15 (223.8) | 11 (160.7) | 13 (187.5) | 6 (87.4) | 7 (100.4) | 10 (141.9) | 4 (55.2) | 18 (247.4) | 11 (148.1) | 11 (145.1) | 24 (302.6) | 14 (159.0) | 20 (255.5) |
| Burglaries (per 100,000) | 42 (462.9) | 45 (671.3) | 30 (438.3) | 28 (403.8) | 48 (699.2) | 14 (200.8) | 19 (269.6) | 7 (96.6) | 21 (288.6) | 32 (430.8) | 19 (250.7) | 24 (302.6) | 10 (113.6) | 6 (76.6) |
| Thefts (per 100,000) | 120 (1,323) | 112 (1,671) | 103 (1,505) | 73 (1,053) | 68 (990.5) | 119 (1,707) | 116 (1,646) | 28 (386.5) | 133 (1,828) | 129 (1,737) | 114 (1,504) | 123 (1,551) | 76 (863.2) | 58 (740.8) |
| Auto thefts (per 100,000) | 8 (88.2) | 6 (89.5) | 8 (116.9) | 8 (115.4) | 7 (102.0) | 8 (114.8) | 15 (212.9) | 1 (13.8) | 17 (233.6) | 17 (228.9) | 15 (197.9) | 18 (227.0) | 9 (102.2) | 7 (89.4) |
| Arson (per 100,000) | 3 (33.1) | 0 (0.0) | 0 (0.0) | 0 (0.0) | 0 (0.0) | 0 (0.0) | 0 (0.0) | 0 (0.0) | 0 (0.0) | 0 (0.0) | 0 (0.0) | 0 (0.0) | 1 (11.4) | 0 (0.0) |
| City-Data.com crime index | 129.8 | 183.6 | 154.3 | 134.4 | 165.2 | 160.4 | 172.7 | 45.4 | 244.0 | 194.7 | 172.7 | 203.5 | 100.6 | 115.0 |
The City-Data.com crime index weighs serious crimes and violent crimes more heavily. Higher means more crime, U.S. average is 246.1. It adjusts for the number of visitors and daily workers commuting into cities.
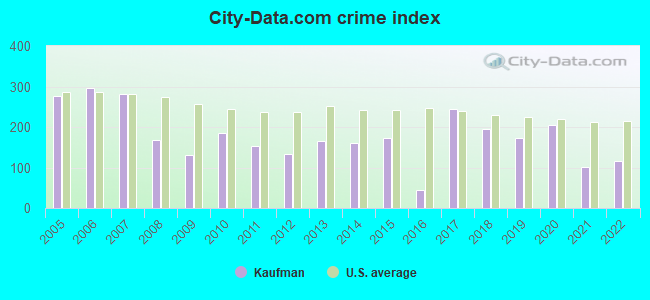
Crime rate in Kaufman detailed stats: murders, rapes, robberies, assaults, burglaries, thefts, arson
Full-time law enforcement employees in 2021, including police officers: 19 (16 officers - 13 male; 3 female).
| Officers per 1,000 residents here: | 1.82 |
| Texas average: | 2.07 |
 Recent articles from our blog. Our writers, many of them Ph.D. graduates or candidates, create easy-to-read articles on a wide variety of topics.


Latest news from Kaufman, TX collected exclusively by city-data.com from local newspapers, TV, and radio stations
Ancestries: English (10.3%), American (8.5%), Irish (5.7%), German (5.1%), European (1.7%).
Current Local Time: CST time zone
Land area: 6.64 square miles.
Population density: 1,264 people per square mile (low).
686 residents are foreign born (8.7% Latin America).
| This city: | 7.9% |
| Texas: | 17.1% |
Median real estate property taxes paid for housing units with mortgages in 2022: $2,973 (1.5%)
Median real estate property taxes paid for housing units with no mortgage in 2022: $1,907 (1.3%)
Nearest city with pop. 50,000+: Mesquite, TX  (22.3 miles , pop. 124,523).
Nearest city with pop. 200,000+: Garland, TX (29.3 miles , pop. 215,768).
Nearest city with pop. 1,000,000+: Dallas, TX (31.6 miles , pop. 1,188,580).
Nearest cities:
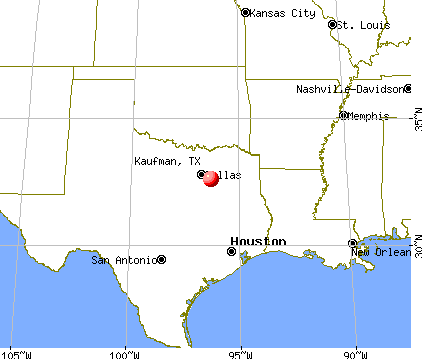
), ), ), ), ), ), )Latitude: 32.59 N, Longitude: 96.31 W
Daytime population change due to commuting: +1,404 (+16.2%)
Workers who live and work in this city: 1,051 (28.3%)
Area codes: 469, 972

Kaufman, Texas accommodation & food services, waste management - Economy and Business Data
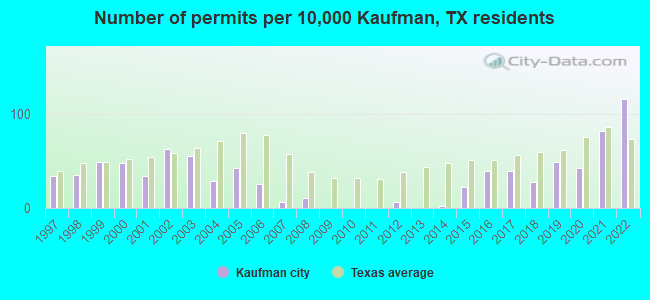
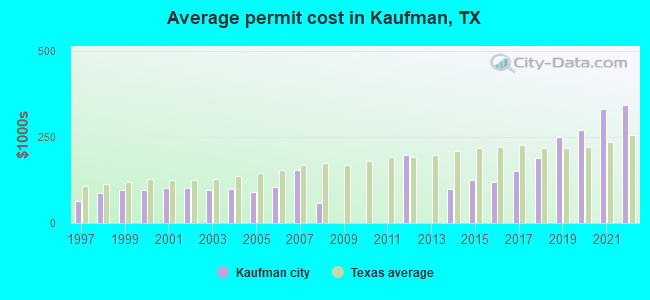
Single-family new house construction building permits:
- 2022: 75 buildings, average cost: $343,400
- 2021: 53 buildings, average cost: $332,000
- 2020: 28 buildings, average cost: $268,800
- 2019: 32 buildings, average cost: $248,600
- 2018: 18 buildings, average cost: $188,200
- 2017: 25 buildings, average cost: $151,000
- 2016: 25 buildings, average cost: $119,300
- 2015: 14 buildings, average cost: $123,800
- 2014: 1 building, cost: $100,000
- 2012: 4 buildings, average cost: $197,000
- 2008: 7 buildings, average cost: $59,400
- 2007: 4 buildings, average cost: $153,100
- 2006: 17 buildings, average cost: $105,900
- 2005: 28 buildings, average cost: $88,600
- 2004: 19 buildings, average cost: $98,100
- 2003: 36 buildings, average cost: $95,000
- 2002: 41 buildings, average cost: $101,400
- 2001: 22 buildings, average cost: $101,300
- 2000: 31 buildings, average cost: $95,900
- 1999: 32 buildings, average cost: $95,400
- 1998: 23 buildings, average cost: $87,800
- 1997: 22 buildings, average cost: $65,300
| Here: | 3.7% |
| Texas: | 3.5% |
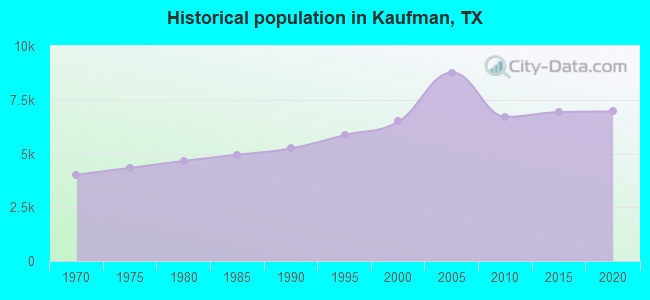
Population change in the 1990s: +972 (+17.6%).
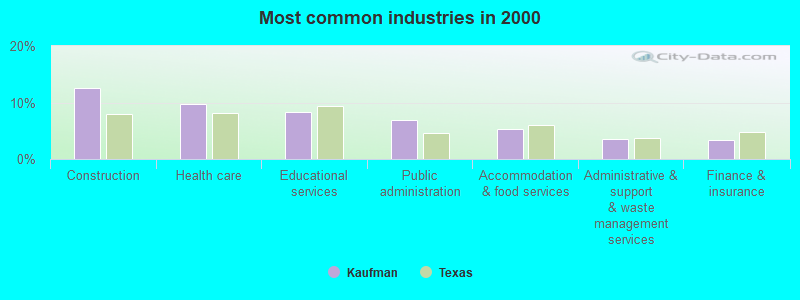
- Construction (12.6%)
- Health care (9.7%)
- Educational services (8.3%)
- Public administration (6.8%)
- Accommodation & food services (5.3%)
- Administrative & support & waste management services (3.6%)
- Finance & insurance (3.4%)
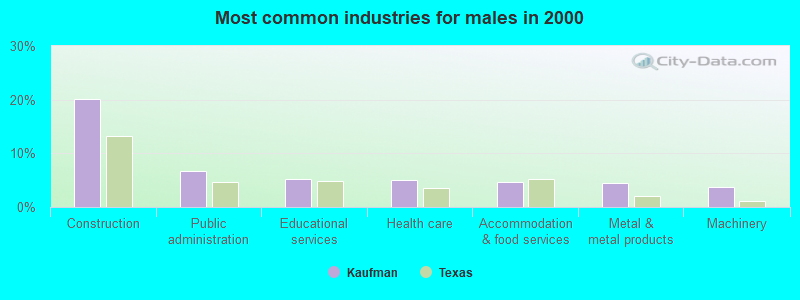
- Construction (20.2%)
- Public administration (6.6%)
- Educational services (5.3%)
- Health care (5.0%)
- Accommodation & food services (4.6%)
- Metal & metal products (4.5%)
- Machinery (3.8%)
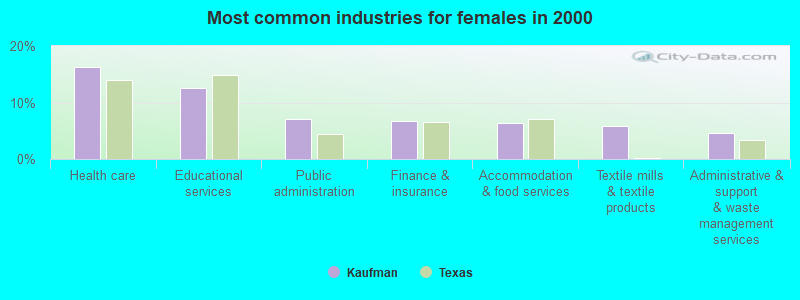
- Health care (16.2%)
- Educational services (12.5%)
- Public administration (7.1%)
- Finance & insurance (6.8%)
- Accommodation & food services (6.3%)
- Textile mills & textile products (5.8%)
- Administrative & support & waste management services (4.6%)
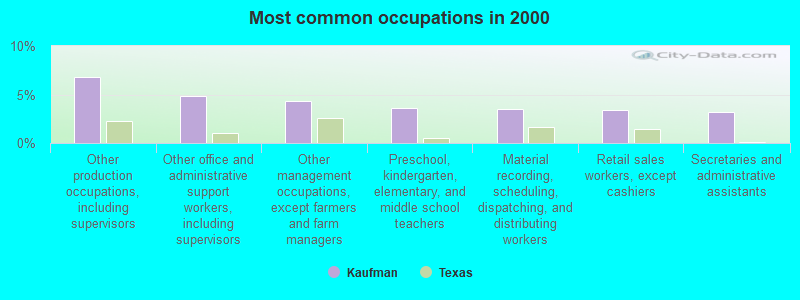
- Other production occupations, including supervisors (6.8%)
- Other office and administrative support workers, including supervisors (4.9%)
- Other management occupations, except farmers and farm managers (4.3%)
- Preschool, kindergarten, elementary, and middle school teachers (3.6%)
- Material recording, scheduling, dispatching, and distributing workers (3.5%)
- Retail sales workers, except cashiers (3.4%)
- Secretaries and administrative assistants (3.2%)
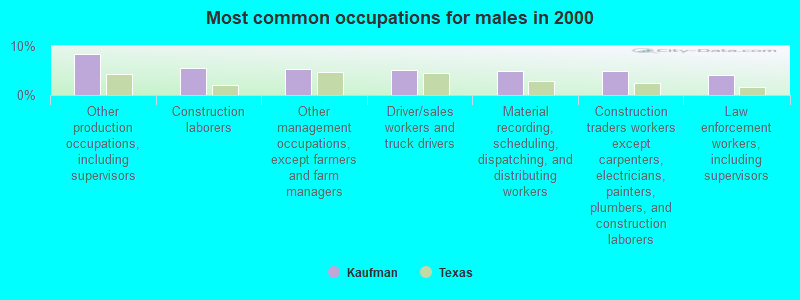
- Other production occupations, including supervisors (8.5%)
- Construction laborers (5.5%)
- Other management occupations, except farmers and farm managers (5.3%)
- Driver/sales workers and truck drivers (5.1%)
- Material recording, scheduling, dispatching, and distributing workers (5.0%)
- Construction traders workers except carpenters, electricians, painters, plumbers, and construction laborers (4.8%)
- Law enforcement workers, including supervisors (4.1%)
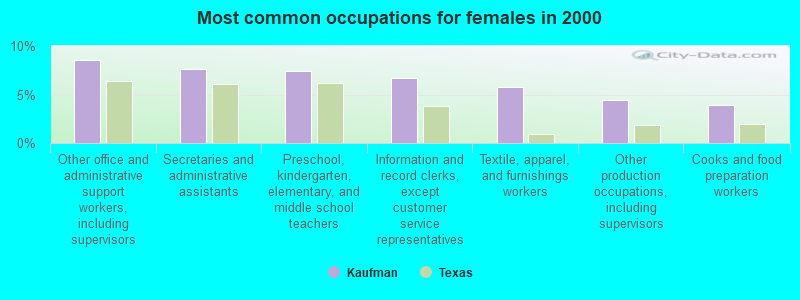
- Other office and administrative support workers, including supervisors (8.5%)
- Secretaries and administrative assistants (7.7%)
- Preschool, kindergarten, elementary, and middle school teachers (7.4%)
- Information and record clerks, except customer service representatives (6.7%)
- Textile, apparel, and furnishings workers (5.7%)
- Other production occupations, including supervisors (4.4%)
- Cooks and food preparation workers (4.0%)
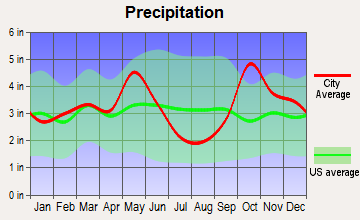
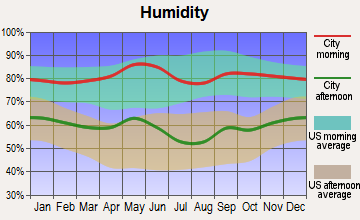
Average climate in Kaufman, Texas
Based on data reported by over 4,000 weather stations


|
|


(lower is better)
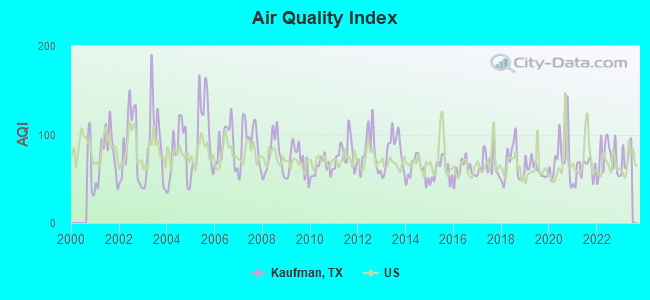
Air Quality Index (AQI) level in 2022 was 73.6. This is about average.
| City: | 73.6 |
| U.S.: | 72.6 |
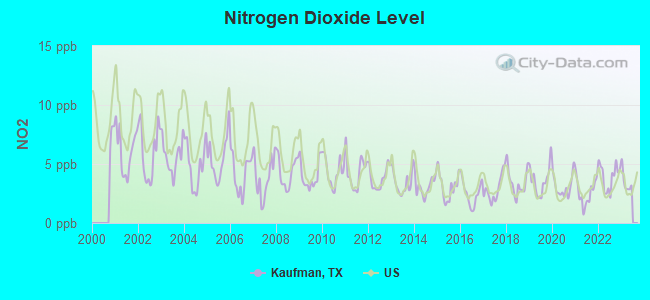
Nitrogen Dioxide (NO2) [ppb] level in 2022 was 3.93. This is better than average. Closest monitor was 1.5 miles away from the city center.
| City: | 3.93 |
| U.S.: | 5.11 |
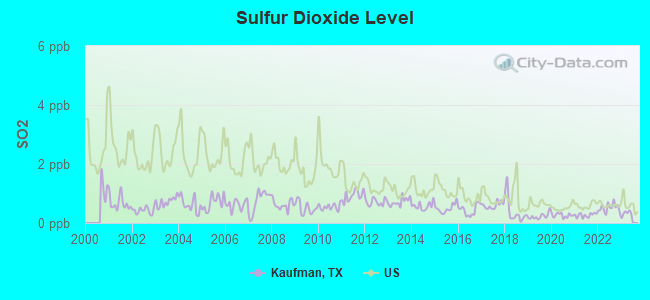
Sulfur Dioxide (SO2) [ppb] level in 2022 was 0.517. This is significantly better than average. Closest monitor was 1.5 miles away from the city center.
| City: | 0.517 |
| U.S.: | 1.515 |
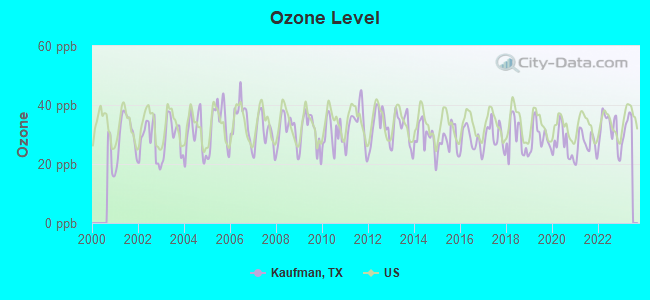
Ozone [ppb] level in 2022 was 31.8. This is about average. Closest monitor was 1.5 miles away from the city center.
| City: | 31.8 |
| U.S.: | 33.3 |
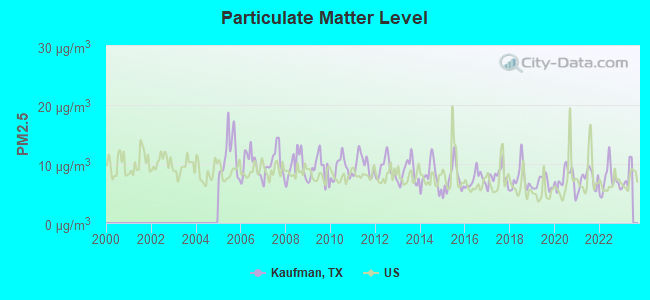
Particulate Matter (PM2.5) [µg/m3] level in 2022 was 7.28. This is about average. Closest monitor was 1.5 miles away from the city center.
| City: | 7.28 |
| U.S.: | 8.11 |
Tornado activity:
Kaufman-area historical tornado activity is above Texas state average. It is 131% greater than the overall U.S. average.
On 4/25/1994, a category F4 (max. wind speeds 207-260 mph) tornado 21.9 miles away from the Kaufman city center killed 3 people and injured 48 people and caused between $50,000,000 and $500,000,000 in damages.
On 3/11/1963, a category F3 (max. wind speeds 158-206 mph) tornado 0.6 miles away from the city center caused between $50,000 and $500,000 in damages.
Earthquake activity:
Kaufman-area historical earthquake activity is significantly above Texas state average. It is 434% greater than the overall U.S. average.On 11/6/2011 at 03:53:10, a magnitude 5.7 (5.7 MW, Depth: 3.2 mi, Class: Moderate, Intensity: VI - VII) earthquake occurred 205.5 miles away from the city center
On 9/3/2016 at 12:02:44, a magnitude 5.8 (5.8 MW, Depth: 3.5 mi) earthquake occurred 267.9 miles away from the city center
On 5/17/2012 at 08:12:00, a magnitude 4.8 (4.8 MW, Depth: 3.1 mi, Class: Light, Intensity: IV - V) earthquake occurred 122.2 miles away from Kaufman center
On 6/16/1978 at 11:46:54, a magnitude 5.3 (4.4 MB, 4.6 UK, 5.3 ML) earthquake occurred 261.0 miles away from the city center
On 11/7/2016 at 01:44:24, a magnitude 5.0 (5.0 MW, Depth: 2.8 mi) earthquake occurred 237.2 miles away from the city center
On 9/6/1997 at 23:38:00, a magnitude 4.5 (4.5 LG, 4.2 LG, Depth: 3.1 mi) earthquake occurred 143.7 miles away from the city center
Magnitude types: regional Lg-wave magnitude (LG), body-wave magnitude (MB), local magnitude (ML), moment magnitude (MW)
Natural disasters:
The number of natural disasters in Kaufman County (14) is near the US average (15).Major Disasters (Presidential) Declared: 6
Emergencies Declared: 7
Causes of natural disasters: Floods: 5, Tornadoes: 5, Hurricanes: 4, Storms: 4, Fires: 3, Winds: 2, Winter Storm: 1, Other: 2 (Note: some incidents may be assigned to more than one category).
Hospitals and medical centers in Kaufman:
- TEXAS HEALTH PRESBYTERIAN HOSPITAL KAUFMAN (Voluntary non-profit - Private, 850 ED HALL)
- KAUFMAN HEALTHCARE CENTER (3001 S HOUSTON ST)
- LEISURE LODGE KAUFMAN (3001 S HOUSTON ST)
- PRESBYTERIAN HOSPITAL OF KA (HWY 243 W AT HWY 175)
- ROSE HAVEN RETREAT NURSING HOME (1803 E HWY 243)
- SUNFLOWER PARK HEALTH CARE (1803 HIGHWAY 243 EAST)
- SUNFLOWER PARK NURSING HOME (1803 EAST HIGHWAY 243)
- FRESENIUS MEDICAL CARE KAUFMAN (2213 OLD KEMP HIGHWAY)
- KAUFMAN DIALYSIS (2851 MILLENIUM DRIVE)
- YOUR HEALTH TEAM (1512 FM 2727)
Airports and heliports located in Kaufman:
- Baum Airport (TA46) (Runways: 1)
- Connies Aviation Airport (XA42) (Runways: 1)
- Erco Field Airport (0TA4) (Runways: 1)
- Flying G Airport (28XS) (Runways: 1)
- Moore Airport (8TS6) (Runways: 1)
- Texas Health Resources Kaufman Heliport (2TS5)
Colleges/universities with over 2000 students nearest to Kaufman:
- Eastfield College (about 26 miles; Mesquite, TX; Full-time enrollment: 8,323)
- Cedar Valley College (about 27 miles; Lancaster, TX; FT enrollment: 3,603)
- El Centro College (about 32 miles; Dallas, TX; FT enrollment: 6,086)
- Southern Methodist University (about 34 miles; Dallas, TX; FT enrollment: 9,150)
- Richland College (about 34 miles; Dallas, TX; FT enrollment: 11,617)
- Mountain View College (about 37 miles; Dallas, TX; FT enrollment: 4,988)
- Navarro College (about 37 miles; Corsicana, TX; FT enrollment: 7,711)
Public high schools in Kaufman:
- KAUFMAN H S (Students: 965, Location: 3205 S HOUSTON ST, Grades: 9-12)
- NORMAN J H (Students: 536, Location: 3701 S HOUSTON ST, Grades: 7-9)
- GARY W CAMPBELL H S (Location: 4814 COUNTY RD 151, Grades: 9-12)
Public elementary/middle schools in Kaufman:
- PHILLIPS ELEMENTARY (Students: 589, Location: 1501 ROYAL, Grades: 3-4)
- MONDAY PRI (Students: 574, Location: 905 S MADISON, Grades: 1-2)
- LUCILLE NASH INTERMEDIATE (Students: 535, Location: 1002 S HOUSTON ST, Grades: 5-6)
Private elementary/middle school in Kaufman:
Points of interest:
Notable locations in Kaufman: Kaufman County Courthouse (A), Kaufman Volunteer Fire Department (B), East Texas Medical Center Emergency Medical Service Kaufman (C). Display/hide their locations on the map
Churches in Kaufman include: Saint Ann Church (A), College Heights Church (B), Episcopal Church of Our Merciful Saviour (C), Free Church of God True Holiness (D), Church of Christ (E), Southside Baptist Church (F), Macedonia Baptist Church (G), First Baptist Church (H), Faith of Deliverance Baptist Church (I). Display/hide their locations on the map
Reservoirs: Kaufman City Lakes (A), Lake 1 (B), Lake 2 (C). Display/hide their locations on the map
Parks in Kaufman include: Shannon Park (1), Lions Stadium (2). Display/hide their locations on the map
Tourist attraction: Franklin County Historical Association (Cultural Attractions- Events- & Facilities; 107 South).
Hotel: Best Western La Hacienda Inn (200 East Highway 175).
Birthplace of: Sonny Strait - Voice actor, Carl Birdsong - Football player, Johnny Hall - Football player.
Drinking water stations with addresses in Kaufman and their reported violations in the past:
BECKER JIBA WSC (Population served: 2,520, Purch surface water):Past health violations:Past monitoring violations:
- MCL, Average - Between JUL-2007 and SEP-2007, Contaminant: TTHM. Follow-up actions: St Public Notif requested (NOV-15-2007), St Violation/Reminder Notice (NOV-15-2007), St Public Notif received (2 times from FEB-07-2008 to FEB-07-2008), St Compliance achieved (APR-15-2008)
- MCL, Average - Between APR-2007 and JUN-2007, Contaminant: TTHM. Follow-up actions: St Public Notif requested (AUG-10-2007), St Violation/Reminder Notice (AUG-10-2007), St Public Notif received (SEP-25-2007), St Compliance achieved (APR-15-2008)
- MCL, Average - Between JAN-2007 and MAR-2007, Contaminant: TTHM. Follow-up actions: St Public Notif requested (MAY-18-2007), St Violation/Reminder Notice (MAY-18-2007), St Public Notif received (SEP-25-2007), St Compliance achieved (APR-15-2008)
- MCL, Average - Between OCT-2006 and DEC-2006, Contaminant: TTHM. Follow-up actions: St Public Notif requested (JAN-30-2007), St Violation/Reminder Notice (JAN-30-2007), St Public Notif received (SEP-25-2007), St Compliance achieved (APR-15-2008)
- MCL, Average - Between JUL-2006 and SEP-2006, Contaminant: TTHM. Follow-up actions: St Public Notif requested (NOV-10-2006), St Violation/Reminder Notice (NOV-10-2006), St Public Notif received (FEB-01-2007), St Compliance achieved (APR-15-2008)
- MCL, Average - Between APR-2006 and JUN-2006, Contaminant: TTHM. Follow-up actions: St Public Notif requested (JUL-20-2006), St Violation/Reminder Notice (JUL-20-2006), St Public Notif received (AUG-24-2006), St Compliance achieved (APR-15-2008)
- 4 other older health violations
- One routine major monitoring violation
- One regular monitoring violation
| This city: | 2.9 people |
| Texas: | 2.8 people |
| This city: | 70.3% |
| Whole state: | 69.9% |
| This city: | 7.7% |
| Whole state: | 6.0% |
Likely homosexual households (counted as self-reported same-sex unmarried-partner households)
- Lesbian couples: 0.3% of all households
- Gay men: 0.2% of all households
People in group quarters in Kaufman in 2010:
- 137 people in nursing facilities/skilled-nursing facilities
- 14 people in group homes for juveniles (non-correctional)
- 2 people in workers' group living quarters and job corps centers
People in group quarters in Kaufman in 2000:
- 149 people in local jails and other confinement facilities (including police lockups)
- 68 people in nursing homes
- 32 people in other noninstitutional group quarters
Banks with branches in Kaufman (2011 data):
- Wells Fargo Bank, National Association: Kaufman Branch at 2100 South Washington Street, branch established on 1975/07/30; Tx-Kaufman County 1 Branch at 2100 S Washington St, branch established on 2002/06/14. Info updated 2011/04/05: Bank assets: $1,161,490.0 mil, Deposits: $905,653.0 mil, headquarters in Sioux Falls, SD, positive income, 6395 total offices, Holding Company: Wells Fargo & Company
- Citizens National Bank of Texas: Citizens National Bank - Brookshires at 2235 South Washington, branch established on 2003/09/22. Info updated 2007/10/16: Bank assets: $565.0 mil, Deposits: $483.4 mil, headquarters in Waxahachie, TX, positive income, Commercial Lending Specialization, 13 total offices, Holding Company: First Citizens Bancshares, Inc.
- The American National Bank of Texas: Kaufman Branch at 2700 South Washington, branch established on 1991/07/08. Info updated 2008/06/26: Bank assets: $2,334.7 mil, Deposits: $2,095.6 mil, headquarters in Terrell, TX, positive income, Commercial Lending Specialization, 28 total offices, Holding Company: A.N.b. Holding Company, Ltd.
- Compass Bank: Kaufman Branch at 2219 South Washington Street, branch established on 2009/08/22. Info updated 2011/02/24: Bank assets: $63,107.0 mil, Deposits: $46,232.4 mil, headquarters in Birmingham, AL, negative income in the last year, Commercial Lending Specialization, 720 total offices, Holding Company: Banco Bilbao Vizcaya Argentaria, S.A.
For population 15 years and over in Kaufman:
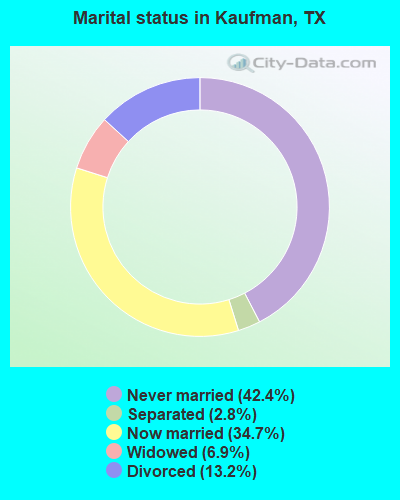
- Never married: 42.4%
- Now married: 34.7%
- Separated: 2.8%
- Widowed: 6.9%
- Divorced: 13.2%
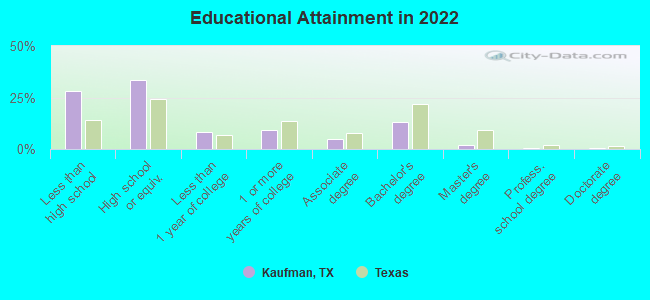
For population 25 years and over in Kaufman:
- High school or higher: 74.4%
- Bachelor's degree or higher: 13.5%
- Graduate or professional degree: 2.6%
- Unemployed: 4.5%
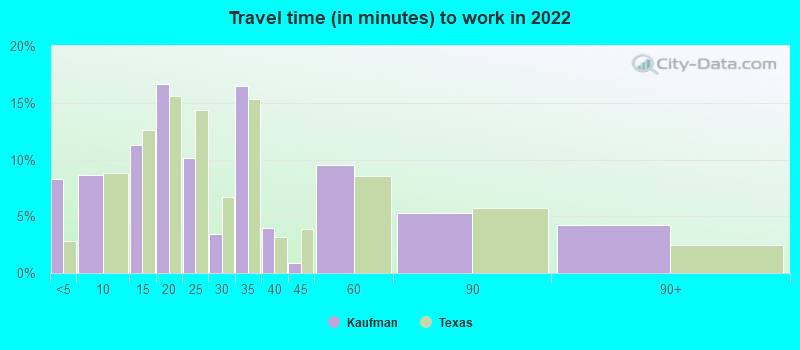
- Mean travel time to work (commute): 35.3 minutes
| Here: | 14.2 |
| Texas average: | 14.0 |
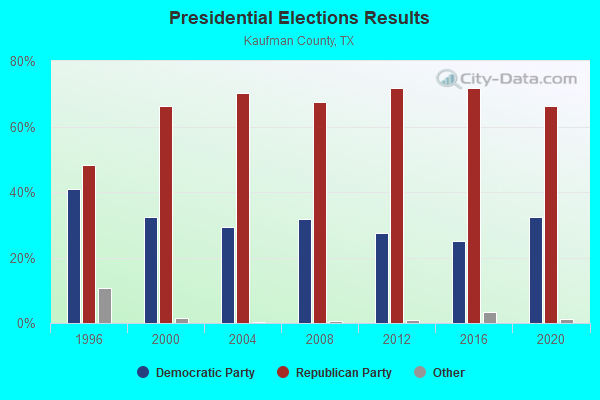
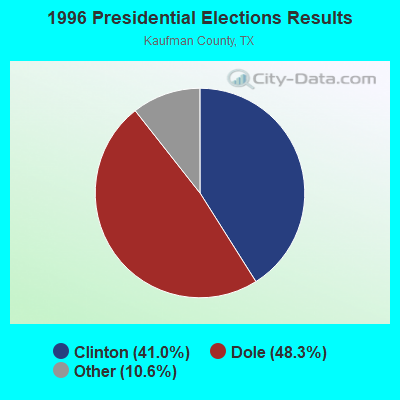


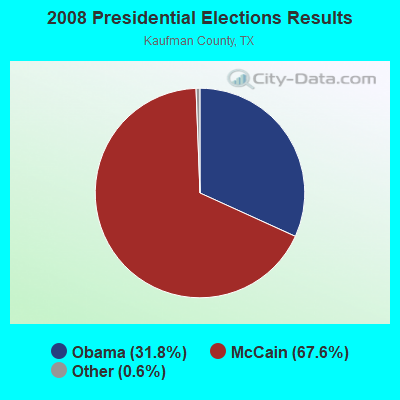
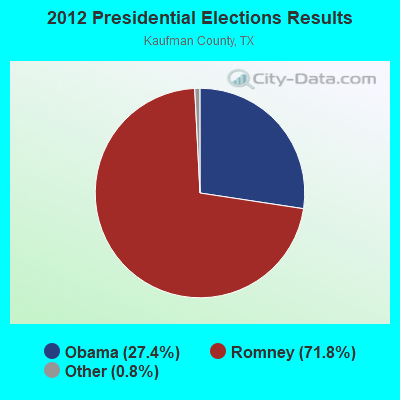
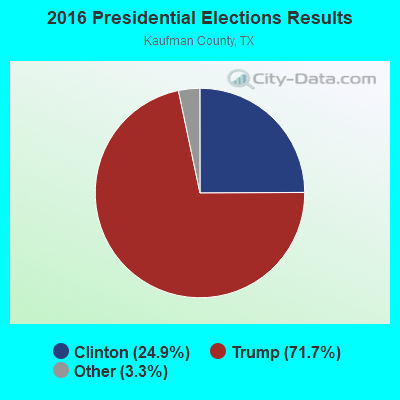

Graphs represent county-level data. Detailed 2008 Election Results
Religion statistics for Kaufman, TX (based on Kaufman County data)
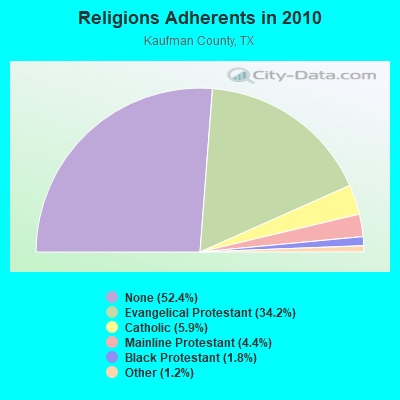
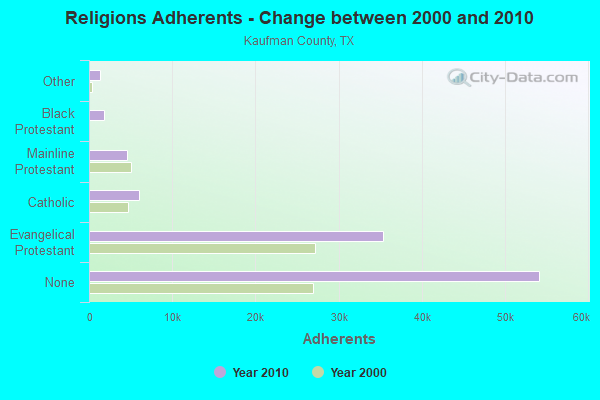
| Religion | Adherents | Congregations |
|---|---|---|
| Evangelical Protestant | 35,395 | 96 |
| Catholic | 6,064 | 3 |
| Mainline Protestant | 4,554 | 22 |
| Black Protestant | 1,860 | 16 |
| Other | 1,282 | 6 |
| Orthodox | 43 | 1 |
| None | 54,152 | - |
Food Environment Statistics:
| Kaufman County: | 1.14 / 10,000 pop. |
| State: | 1.47 / 10,000 pop. |
| Here: | 0.21 / 10,000 pop. |
| State: | 0.14 / 10,000 pop. |
| Kaufman County: | 1.35 / 10,000 pop. |
| Texas: | 1.11 / 10,000 pop. |
| This county: | 4.35 / 10,000 pop. |
| State: | 3.95 / 10,000 pop. |
| This county: | 4.46 / 10,000 pop. |
| State: | 6.13 / 10,000 pop. |
| Kaufman County: | 8.3% |
| Texas: | 8.9% |
| This county: | 26.9% |
| Texas: | 26.6% |
| Kaufman County: | 16.3% |
| Texas: | 15.7% |
Health and Nutrition:
| Kaufman: | 46.3% |
| Texas: | 48.6% |
| This city: | 43.1% |
| State: | 47.4% |
| This city: | 28.8 |
| Texas: | 28.5 |
| Kaufman: | 21.1% |
| Texas: | 20.6% |
| Kaufman: | 11.1% |
| Texas: | 10.3% |
| Kaufman: | 6.8 |
| Texas: | 6.8 |
| Kaufman: | 31.4% |
| Texas: | 33.1% |
| Here: | 53.9% |
| Texas: | 56.2% |
| This city: | 79.5% |
| State: | 80.7% |
More about Health and Nutrition of Kaufman, TX Residents
| Local government employment and payroll (March 2022) | |||||
| Function | Full-time employees | Monthly full-time payroll | Average yearly full-time wage | Part-time employees | Monthly part-time payroll |
|---|---|---|---|---|---|
| Police Protection - Officers | 21 | $114,707 | $65,547 | 0 | $0 |
| Water Supply | 10 | $48,643 | $58,372 | 0 | $0 |
| Firefighters | 8 | $45,419 | $68,129 | 0 | $0 |
| Other Government Administration | 7 | $50,216 | $86,085 | 0 | $0 |
| Housing and Community Development (Local) | 7 | $22,349 | $38,313 | 0 | $0 |
| Financial Administration | 6 | $25,354 | $50,708 | 0 | $0 |
| Parks and Recreation | 5 | $13,715 | $32,916 | 0 | $0 |
| Police - Other | 3 | $12,486 | $49,944 | 0 | $0 |
| Sewerage | 2 | $10,035 | $60,210 | 0 | $0 |
| Other and Unallocable | 1 | $7,214 | $86,568 | 0 | $0 |
| Judicial and Legal | 1 | $3,448 | $41,376 | 1 | $3,020 |
| Totals for Government | 71 | $353,586 | $59,761 | 1 | $3,020 |
Kaufman government finances - Expenditure in 2017 (per resident):
- Current Operations - Police Protection: $1,682,000 ($200.52)
Water Utilities: $1,620,000 ($193.13)
Central Staff Services: $1,182,000 ($140.92)
Local Fire Protection: $524,000 ($62.47)
Regular Highways: $501,000 ($59.73)
Sewerage: $451,000 ($53.77)
Housing and Community Development: $384,000 ($45.78)
Financial Administration: $361,000 ($43.04)
Parks and Recreation: $324,000 ($38.63)
Judicial and Legal Services: $152,000 ($18.12)
Protective Inspection and Regulation - Other: $79,000 ($9.42)
General - Other: $78,000 ($9.30)
Health - Other: $74,000 ($8.82)
Solid Waste Management: $44,000 ($5.25)
- General - Interest on Debt: $531,000 ($63.30)
- Intergovernmental to Local - Other - Local Fire Protection: $21,000 ($2.50)
Other - Libraries: $15,000 ($1.79)
Other - Parks and Recreation: $10,000 ($1.19)
- Other Capital Outlay - Regular Highways: $4,641,000 ($553.29)
Parks and Recreation: $1,679,000 ($200.17)
Central Staff Services: $291,000 ($34.69)
Sewerage: $122,000 ($14.54)
Local Fire Protection: $49,000 ($5.84)
Police Protection: $18,000 ($2.15)
- Total Salaries and Wages: $3,040,000 ($362.42)
- Water Utilities - Interest on Debt: $150,000 ($17.88)
Kaufman government finances - Revenue in 2017 (per resident):
- Charges - Sewerage: $1,496,000 ($178.35)
Solid Waste Management: $266,000 ($31.71)
Other: $11,000 ($1.31)
Parks and Recreation: $2,000 ($0.24)
- Federal Intergovernmental - Highways: $24,000 ($2.86)
- Local Intergovernmental - General Local Government Support: $387,000 ($46.14)
Other: $4,000 ($0.48)
- Miscellaneous - Donations From Private Sources: $293,000 ($34.93)
Fines and Forfeits: $232,000 ($27.66)
Special Assessments: $202,000 ($24.08)
General Revenue - Other: $23,000 ($2.74)
Interest Earnings: $16,000 ($1.91)
Rents: $12,000 ($1.43)
- Revenue - Water Utilities: $2,454,000 ($292.56)
- State Intergovernmental - General Local Government Support: $8,000 ($0.95)
- Tax - Property: $2,161,000 ($257.63)
General Sales and Gross Receipts: $2,023,000 ($241.18)
Public Utilities Sales: $403,000 ($48.04)
Other License: $251,000 ($29.92)
Other Selective Sales: $33,000 ($3.93)
Alcoholic Beverage License: $10,000 ($1.19)
Amusements License: $4,000 ($0.48)
Kaufman government finances - Debt in 2017 (per resident):
- Long Term Debt - Outstanding Unspecified Public Purpose: $25,040,000 ($2985.22)
Beginning Outstanding - Unspecified Public Purpose: $17,947,000 ($2139.60)
Issue, Unspecified Public Purpose: $8,940,000 ($1065.81)
Retired Unspecified Public Purpose: $1,847,000 ($220.20)
Kaufman government finances - Cash and Securities in 2017 (per resident):
- Bond Funds - Cash and Securities: $294,000 ($35.05)
- Other Funds - Cash and Securities: $9,960,000 ($1187.41)
- Sinking Funds - Cash and Securities: $948,000 ($113.02)
| Businesses in Kaufman, TX | ||||
| Name | Count | Name | Count | |
|---|---|---|---|---|
| 7-Eleven | 1 | Jack In The Box | 1 | |
| AT&T | 1 | KFC | 1 | |
| Ace Hardware | 1 | Lane Furniture | 1 | |
| AutoZone | 1 | McDonald's | 1 | |
| Best Western | 1 | Nike | 1 | |
| CVS | 1 | Pizza Hut | 1 | |
| Chevrolet | 1 | SONIC Drive-In | 1 | |
| Circle K | 1 | Sprint Nextel | 1 | |
| ColorTyme | 1 | Subway | 1 | |
| Dairy Queen | 1 | Taco Bell | 1 | |
| Dennys | 1 | U-Haul | 1 | |
| FedEx | 2 | UPS | 2 | |
| H&R Block | 1 | |||
Strongest AM radio stations in Kaufman:
- KFXR (1190 AM; 50 kW; DALLAS, TX; Owner: CLEAR CHANNEL BROADCASTING LICENSES, INC.)
- KRLD (1080 AM; 50 kW; DALLAS, TX; Owner: TEXAS INFINITY BROADCASTING L.P.)
- KSKY (660 AM; 20 kW; BALCH SPRINGS, TX; Owner: BISON MEDIA, INC.)
- WBAP (820 AM; 50 kW; FORT WORTH, TX; Owner: WBAP-KSCS OPERATING, LTD.)
- KZMP (1540 AM; 50 kW; UNIVERSITY PARK, TX; Owner: ENTRAVISION HOLDINGS, LLC)
- KESS (1270 AM; 50 kW; FORT WORTH, TX; Owner: KESS-AM LICENSE CORP.)
- KBIS (1150 AM; 25 kW; HIGHLAND PARK, TX; Owner: DALLAS AM RADIO PARTNERS, L.P.)
- KAAM (770 AM; 10 kW; GARLAND, TX; Owner: DONTRON, INC.)
- KAHZ (1360 AM; 50 kW; HURST, TX)
- KHCK (1480 AM; 5 kW; DALLAS, TX; Owner: KMRT-AM LICENSE CORPORATION)
- KDFT (540 AM; 1 kW; FERRIS, TX; Owner: WAY BROADCASTING, INC.)
- KGGR (1040 AM; daytime; 5 kW; DALLAS, TX; Owner: MORTENSON BROADCASTING COMPANY)
- KRVA (1600 AM; 5 kW; COCKRELL HILL, TX; Owner: ENTRAVISION HOLDINGS, LLC)
Strongest FM radio stations in Kaufman:
- KLTY (94.9 FM; ARLINGTON, TX; Owner: INSPIRATION MEDIA OF TEXAS, LLC)
- WRR (101.1 FM; DALLAS, TX; Owner: CITY OF DALLAS, TEXAS)
- KLUV-FM (98.7 FM; DALLAS, TX; Owner: INFINITY BROADCASTING CORPORATION OF DALLAS)
- KRBV (100.3 FM; DALLAS, TX; Owner: INFINITY BROADCASTING CORP. OF FORT WORTH)
- KLLI (105.3 FM; DALLAS, TX; Owner: INFINITY BROADCASTING CORPORATION OF DALLAS)
- KEGL (97.1 FM; FORT WORTH, TX; Owner: CITICASTERS LICENSES, L.P.)
- KOAI (107.5 FM; FORT WORTH, TX; Owner: INFINITY KOAI-FM, INC.)
- KVIL-FM (103.7 FM; HIGHLAND PARK-DALLAS, TX; Owner: INFINITY BROADCASTING CORPORATION OF TEXAS)
- KHKS (106.1 FM; DENTON, TX; Owner: AMFM TEXAS LICENSES LIMITED PARTNERSHIP)
- KZPS (92.5 FM; DALLAS, TX; Owner: AMFM TEXAS LICENSES LIMITED PARTNERSHIP)
- KKDA-FM (104.5 FM; DALLAS, TX; Owner: SERVICE BROADCASTING I, LTD.)
- KBFB (97.9 FM; DALLAS, TX; Owner: RADIO ONE LICENSES, LLC)
- KSCS (96.3 FM; FORT WORTH, TX; Owner: WBAP-KSCS OPERATING, LTD.)
- KLNO (94.1 FM; FORT WORTH, TX; Owner: HBC LICENSE CORPORATION)
- KCBI (90.9 FM; DALLAS, TX; Owner: CRISWELL CENTER FOR BIBLICAL STUDIES)
- KDGE (102.1 FM; FORT WORTH-DALLAS, TX; Owner: CAPSTAR TX LIMITED PARTNERSHIP)
- KDMX (102.9 FM; DALLAS, TX; Owner: CITICASTERS LICENSES, L.P.)
- KERA (90.1 FM; DALLAS, TX; Owner: NORTH TEXAS PUBLIC BROADCASTING, INC.)
- KPLX (99.5 FM; FORT WORTH, TX; Owner: KPLX LICO, INC.)
- KEOM (88.5 FM; MESQUITE, TX; Owner: MESQUITE INDEPENDENT SCHOOL DISTRICT)
TV broadcast stations around Kaufman:
- KTVT (Channel 11; FORT WORTH, TX; Owner: CBS STATIONS GROUP OF TEXAS L.P.)
- KXAS-TV (Channel 5; FORT WORTH, TX; Owner: STATION VENTURE OPERATIONS, LP)
- KJJM-LP (Channel 46; DALLAS/MESQUITE, TX; Owner: JANE McGINNIS)
- KDTN (Channel 2; DENTON, TX; Owner: NORTH TEXAS PUBLIC BROADCASTING, INC.)
- KDAF (Channel 33; DALLAS, TX; Owner: TRIBUNE TELEVISION COMPANY)
- KMPX (Channel 29; DECATUR, TX; Owner: WORD OF GOD FELLOWSHIP, INC.)
- KTXA (Channel 21; FORT WORTH, TX; Owner: VIACOM TELEVISION STATIONS GROUP OF DALLAS/FORT WORTH L.P.)
- KUVN (Channel 23; GARLAND, TX; Owner: KUVN LICENSE PARTNERSHIP, L.P.)
- KSTR-TV (Channel 49; IRVING, TX; Owner: TELEFUTURA DALLAS LLC)
- KERA-TV (Channel 13; DALLAS, TX; Owner: NORTH TEXAS PUBLIC BROADCASTING, INC.)
- KPXD (Channel 68; ARLINGTON, TX; Owner: PAXSON DALLAS LICENSE, INC.)
- KDFI (Channel 27; DALLAS, TX; Owner: NEW DMIC, INC.)
- WFAA-TV (Channel 8; DALLAS, TX; Owner: WFAA-TV, L.P.)
- KXTX-TV (Channel 39; DALLAS, TX; Owner: TELEMUNDO OF TEXAS PARTNERSHIP, LP)
- KDTX-TV (Channel 58; DALLAS, TX; Owner: TRINITY BROADCASTING OF TEXAS, INC.)
- KDFW (Channel 4; DALLAS, TX; Owner: KDFW LICENSE, INC.)
- KTAQ (Channel 47; GREENVILLE, TX; Owner: MIKE SIMONS)
- KLDT (Channel 55; LAKE DALLAS, TX; Owner: JOHNSON BROADCASTING OF DALLAS, INC.)
- KLEG-LP (Channel 44; DALLAS, TX; Owner: DILIP VISWANATH)
- K26HF (Channel 26; BRITTON, TX; Owner: MAKO COMMUNICATIONS, LLC)
- KHPK-LP (Channel 28; DE SOTO, TX; Owner: MAKO COMMUNICATIONS, LLC)
- KATA-LP (Channel 60; MESQUITE, TX; Owner: JANE McGINNIS)
- K25FW (Channel 25; CORSICANA, TX; Owner: VENTANA TELEVISION, INC.)
- KVFW-LP (Channel 65; FORT WORTH, TX; Owner: GERALD BENAVIDES)
- National Bridge Inventory (NBI) Statistics
- 60Number of bridges
- 1,119ft / 341mTotal length
- $93,000Total costs
- 510,494Total average daily traffic
- 61,071Total average daily truck traffic
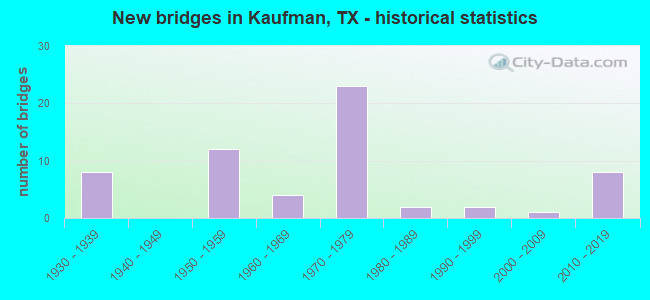
- New bridges - historical statistics
- 81930-1939
- 121950-1959
- 41960-1969
- 231970-1979
- 21980-1989
- 21990-1999
- 12000-2009
- 82010-2019
FCC Registered Antenna Towers: 170 (See the full list of FCC Registered Antenna Towers)
FCC Registered Commercial Land Mobile Towers: 1 (See the full list of FCC Registered Commercial Land Mobile Towers in Kaufman, TX)
FCC Registered Private Land Mobile Towers: 1 (See the full list of FCC Registered Private Land Mobile Towers)
FCC Registered Broadcast Land Mobile Towers: 12 (See the full list of FCC Registered Broadcast Land Mobile Towers)
FCC Registered Microwave Towers: 68 (See the full list of FCC Registered Microwave Towers in this town)
FCC Registered Paging Towers: 1 (See the full list of FCC Registered Paging Towers)
FCC Registered Amateur Radio Licenses: 92 (See the full list of FCC Registered Amateur Radio Licenses in Kaufman)
FAA Registered Aircraft: 15 (See the full list of FAA Registered Aircraft in Kaufman)
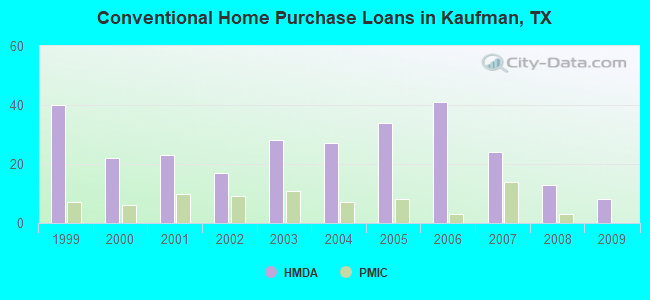
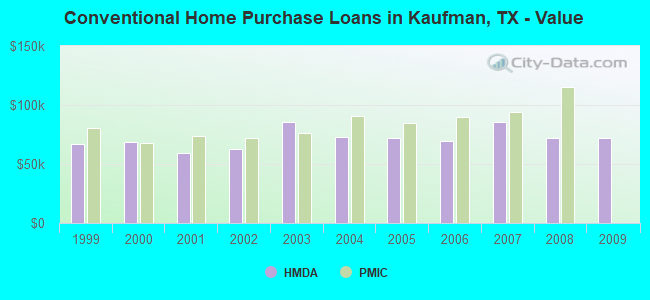
| Home Mortgage Disclosure Act Aggregated Statistics For Year 2009 (Based on 2 partial tracts) | ||||||||||||
| A) FHA, FSA/RHS & VA Home Purchase Loans | B) Conventional Home Purchase Loans | C) Refinancings | D) Home Improvement Loans | F) Non-occupant Loans on < 5 Family Dwellings (A B C & D) | G) Loans On Manufactured Home Dwelling (A B C & D) | |||||||
|---|---|---|---|---|---|---|---|---|---|---|---|---|
| Number | Average Value | Number | Average Value | Number | Average Value | Number | Average Value | Number | Average Value | Number | Average Value | |
| LOANS ORIGINATED | 8 | $94,469 | 8 | $71,826 | 17 | $119,833 | 4 | $16,930 | 5 | $28,900 | 2 | $67,695 |
| APPLICATIONS APPROVED, NOT ACCEPTED | 1 | $142,410 | 3 | $53,773 | 2 | $127,175 | 0 | $0 | 0 | $0 | 3 | $54,080 |
| APPLICATIONS DENIED | 0 | $0 | 5 | $67,218 | 14 | $85,072 | 5 | $20,344 | 1 | $46,990 | 2 | $70,255 |
| APPLICATIONS WITHDRAWN | 0 | $0 | 0 | $0 | 8 | $150,130 | 1 | $95,150 | 1 | $134,040 | 1 | $106,810 |
| FILES CLOSED FOR INCOMPLETENESS | 0 | $0 | 0 | $0 | 2 | $74,990 | 1 | $23,760 | 0 | $0 | 0 | $0 |
Detailed HMDA statistics for the following Tracts: 0510.00 , 0511.00
| Private Mortgage Insurance Companies Aggregated Statistics For Year 2009 (Based on 1 partial tract) | ||
| B) Refinancings | ||
|---|---|---|
| Number | Average Value | |
| LOANS ORIGINATED | 1 | $217,890 |
| APPLICATIONS APPROVED, NOT ACCEPTED | 0 | $0 |
| APPLICATIONS DENIED | 0 | $0 |
| APPLICATIONS WITHDRAWN | 0 | $0 |
| FILES CLOSED FOR INCOMPLETENESS | 0 | $0 |
Detailed PMIC statistics for the following Tracts: 0510.00 , 0511.00
2003 - 2018 National Fire Incident Reporting System (NFIRS) incidents
- Fire incident types reported to NFIRS in Kaufman, TX
- 1,16559.0%Outside Fires
- 55127.9%Structure Fires
- 23211.7%Mobile Property/Vehicle Fires
- 271.4%Other
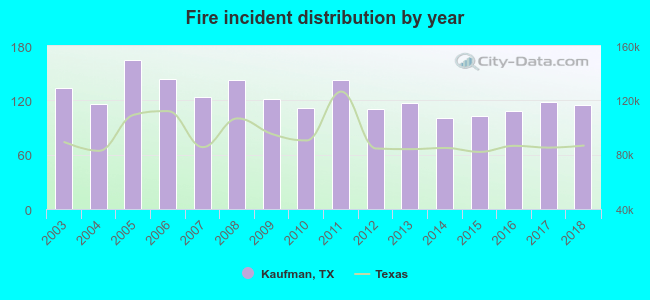 Based on the data from the years 2003 - 2018 the average number of fire incidents per year is 123. The highest number of fire incidents - 165 took place in 2005, and the least - 101 in 2014. The data has a decreasing trend.
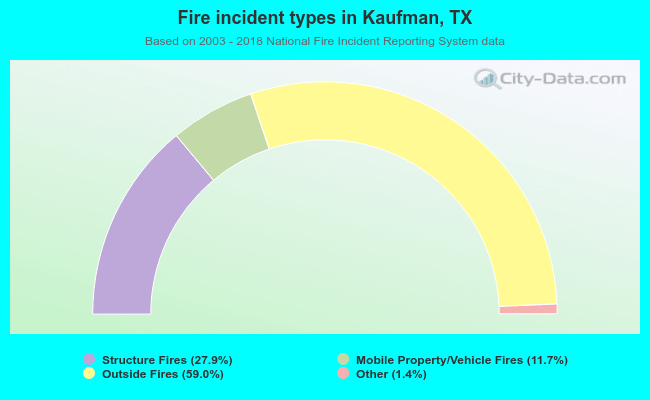 When looking into fire subcategories, the most incidents belonged to: Outside Fires (59.0%), and Structure Fires (27.9%).
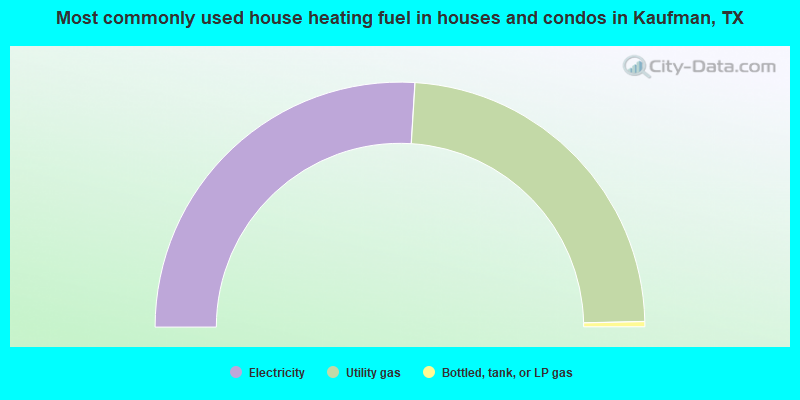
- 51.9%Electricity
- 47.3%Utility gas
- 0.7%Bottled, tank, or LP gas
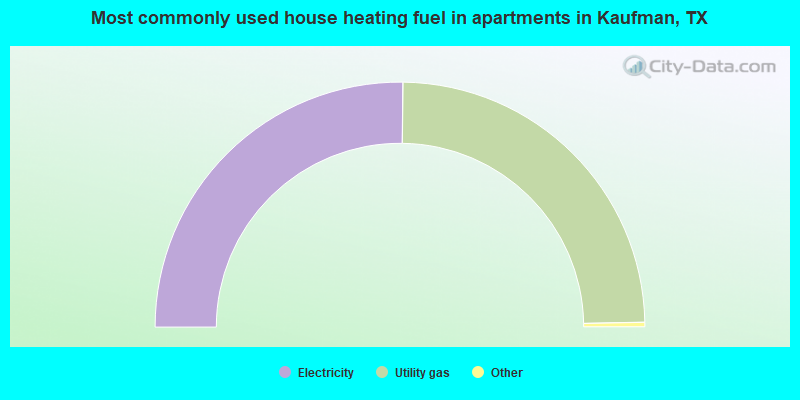
- 50.4%Electricity
- 49.0%Utility gas
- 0.4%No fuel used
- 0.1%Other fuel
Kaufman compared to Texas state average:
- Unemployed percentage significantly below state average.
- Foreign-born population percentage below state average.
- Length of stay since moving in significantly above state average.
- Number of college students below state average.
- Percentage of population with a bachelor's degree or higher below state average.
Kaufman on our top lists:
- #59 on the list of "Top 101 cities with the largest city-data.com crime index decrease from 2002 to 2012 (population 5,000+)"
- #18 on the list of "Top 101 counties with the largest decrease in the number of deaths per 1000 residents 2000-2006 to 2007-2013 (pop. 50,000+)"
- #32 on the list of "Top 101 counties with the lowest Nitrogen Dioxide air pollution readings in 2012 (ppm)"
- #76 on the list of "Top 101 counties with highest percentage of residents voting for Romney (Republican) in the 2012 Presidential Election (pop. 50,000+)"

|
|
Total of 15 patent applications in 2008-2024.