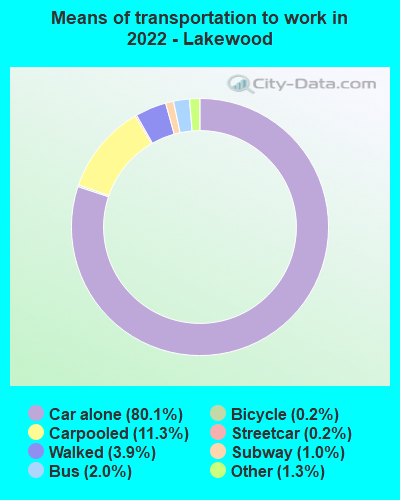
Lakewood, New Jersey

Lakewood: Lakewood Post office crest.
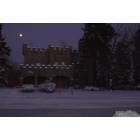
Lakewood: Castle in Lakewood before it was demolished
Lakewood: This is a sideview shot of the Arts Theater on Mainstreet in Lakewood
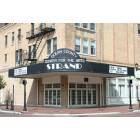
Lakewood: This is a shot of the Arts Theater on Mainstreet in Lakewood
Lakewood: Post office of Lakewood NJ
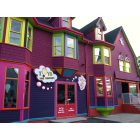
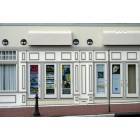
Lakewood: 110 year old Victorian building. Was bein used as a crack house, today is the largest independent toy Store in the USA
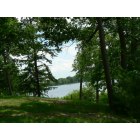
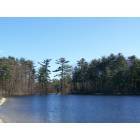
Lakewood: Lakewood, NJ really does have a lake... and woods! It's lovely here!
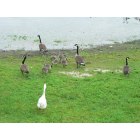
Lakewood: Every spring, Lakewooders and visitors are privileged to see scenes like this one.
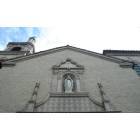
Lakewood: Top of the Lakewood Church
Lakewood: Ocean county park
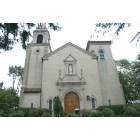
Lakewood: Front view of the Lakewood Church
- see
16
more - add
your
Submit your own pictures of this place and show them to the world
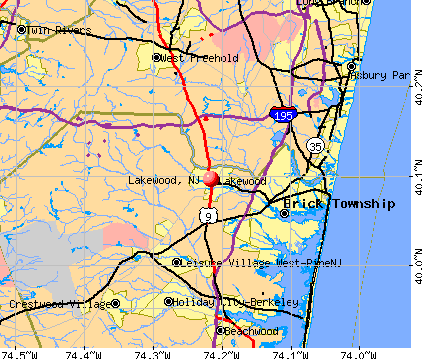
- OSM Map
- General Map
- Google Map
- MSN Map
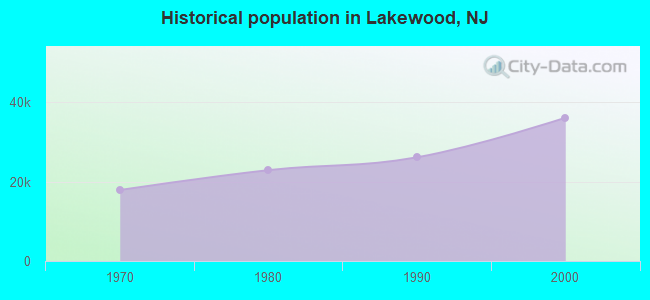
Population change since 2000: +106.5%
| Males: 37,851 | |
| Females: 36,634 |
| Median resident age: | 17.6 years |
| New Jersey median age: | 40.4 years |
Zip codes: 08701.
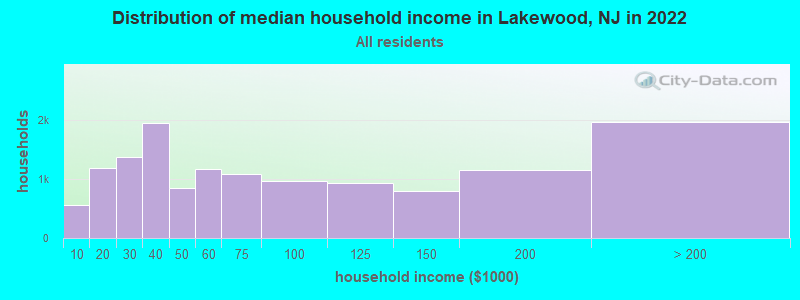
| Lakewood: | $59,460 |
| NJ: | $96,346 |
Estimated per capita income in 2022: $17,815 (it was $11,802 in 2000)
Lakewood CDP income, earnings, and wages data
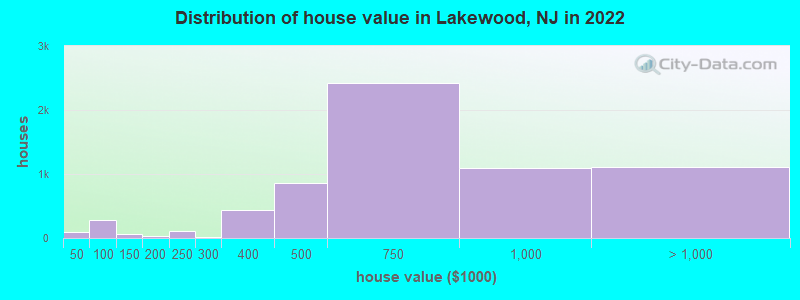
Estimated median house or condo value in 2022: $831,600 (it was $131,600 in 2000)
| Lakewood: | $831,600 |
| NJ: | $428,900 |
Mean prices in 2022: all housing units: $583,182; detached houses: $616,597; townhouses or other attached units: $529,689; in 2-unit structures: $512,631; in 5-or-more-unit structures: $423,963
Median gross rent in 2022: $1,494.
(39.9% for White Non-Hispanic residents, 50.9% for Black residents, 18.5% for Hispanic or Latino residents, 100.0% for Native Hawaiian and other Pacific Islander residents, 10.8% for other race residents, 35.5% for two or more races residents)
Detailed information about poverty and poor residents in Lakewood, NJ


Compare current foreclosures in Lakewood, NJ:
| Photo | Address | Area | Beds / Baths | Price | Details |
|---|---|---|---|---|---|

|
#1
Buckingham Dr
Lakewood, NJ 08701
|
928 sq. feet
|
1 baths 2 beds |
show details | |

|
#2
Balmoral Ct
Lakewood, NJ 08701
|
858 sq. feet
|
1 baths 2 beds |
show details | |

|
#3
Fife Ct
Lakewood, NJ 08701
|
982 sq. feet
|
1 baths 2 beds |
show details | |

|
#4
Argyll Cir
Lakewood, NJ 08701
|
858 sq. feet
|
1 baths 2 beds |
show details | |

|
#5
Aspen Ct
Lakewood, NJ 08701
|
1,328 sq. feet
|
3 baths 3 beds |
show details | |

|
#6
Madison Ave
Lakewood, NJ 08701
|
4,600 sq. feet
|
- baths - beds |
show details | |

|
#7
Carey St
Lakewood, NJ 08701
|
3,500 sq. feet
|
- baths - beds |
show details | |

|
#8
Marble Way
Lakewood, NJ 08701
|
2,652 sq. feet
|
- baths - beds |
show details | |

|
#9
C Shetland Dr 1211 C
Lakewood, NJ 08701
|
858 sq. feet
|
- baths - beds |
show details | |

|
#10
E County Line Rd
Lakewood, NJ 08701
|
1,269 sq. feet
|
- baths - beds |
show details |
| Photo | Address | Area | Beds / Baths | Price | Details |
|---|---|---|---|---|---|

|
#11
Somerset Ave
Lakewood, NJ 08701
|
5,958 sq. feet
|
- baths - beds |
show details | |

|
#12
Balmoral C E
Lakewood, NJ 08701
|
- sq. feet
|
- baths - beds |
show details | |

|
#13
Blue Jay Way
Lakewood, NJ 08701
|
- sq. feet
|
- baths - beds |
show details | |

|
#14
Buckingham D D
Lakewood, NJ 08701
|
- sq. feet
|
- baths - beds |
show details | |

|
#15
Thornbury C B
Lakewood, NJ 08701
|
- sq. feet
|
- baths - beds |
show details | |

|
#16
Greylawn Dr
Lakewood, NJ 08701
|
1,512 sq. feet
|
- baths - beds |
show details | |

|
#17
E 4th St
Lakewood, NJ 08701
|
- sq. feet
|
- baths - beds |
show details | |

|
#18
Rockaway Rd
Lakewood, NJ 08701
|
1,628 sq. feet
|
- baths - beds |
show details | |

|
#19
Halsey St
Lakewood, NJ 08701
|
- sq. feet
|
- baths - beds |
show details | |

|
#20
Sampson Ave
Lakewood, NJ 08701
|
2,479 sq. feet
|
- baths - beds |
show details |
| Photo | Address | Area | Beds / Baths | Price | Details |
|---|---|---|---|---|---|

|
#21
Aberdeen Dr
Lakewood, NJ 08701
|
- sq. feet
|
- baths - beds |
show details | |

|
#22
Schoolhouse Ln
Lakewood, NJ 08701
|
1,600 sq. feet
|
- baths - beds |
show details | |

|
#23
Myrtle Pl
Lakewood, NJ 08701
|
1,040 sq. feet
|
- baths - beds |
show details | |

|
#24
Argyll Cir
Lakewood, NJ 08701
|
- sq. feet
|
- baths - beds |
show details | |

|
#25
Engleberg Ter
Lakewood, NJ 08701
|
3,221 sq. feet
|
- baths - beds |
show details | |

|
#26
Caranetta Dr
Lakewood, NJ 08701
|
1,322 sq. feet
|
- baths - beds |
show details | |

|
#27
Prospect St
Lakewood, NJ 08701
|
- sq. feet
|
- baths - beds |
show details | |

|
#28
Thornhill Ct
Lakewood, NJ 08701
|
982 sq. feet
|
- baths - beds |
show details | |

|
#29
Lynn Ct
Lakewood, NJ 08701
|
1,610 sq. feet
|
- baths - beds |
show details | |

|
#30
Madison Ave
Lakewood, NJ 08701
|
- sq. feet
|
- baths - beds |
show details |
| Photo | Address | Area | Beds / Baths | Price | Details |
|---|---|---|---|---|---|

|
#31
Roselle Ct
Lakewood, NJ 08701
|
1,940 sq. feet
|
- baths - beds |
show details | |

|
#32
Engleberg Ter
Lakewood, NJ 08701
|
2,495 sq. feet
|
- baths - beds |
show details | |

|
#33
Balmoral Ct
Lakewood, NJ 08701
|
- sq. feet
|
- baths - beds |
show details | |

|
#34
Kelm Woods Ave
Lakewood, NJ 08701
|
2,362 sq. feet
|
- baths - beds |
show details | |

|
#35
Buckingham Dr
Lakewood, NJ 08701
|
928 sq. feet
|
- baths - beds |
show details | |

|
#36
Rudwin St
Lakewood, NJ 08701
|
2,338 sq. feet
|
- baths - beds |
show details | |

|
#37
Elaine St
Lakewood, NJ 08701
|
1,729 sq. feet
|
- baths - beds |
show details | |

|
#38
Albert Ave
Lakewood, NJ 08701
|
- sq. feet
|
- baths - beds |
show details | |

|
#39
Argyll Ci C
Lakewood, NJ 08701
|
- sq. feet
|
- baths - beds |
show details | |

|
#40
Prospect St
Lakewood, NJ 08701
|
- sq. feet
|
- baths - beds |
show details |
| Photo | Address | Area | Beds / Baths | Price | Details |
|---|---|---|---|---|---|

|
#41
Kingston Ct
Lakewood, NJ 08701
|
- sq. feet
|
- baths - beds |
show details | |

|
#42
Portsmouth Dr
Lakewood, NJ 08701
|
1,246 sq. feet
|
- baths - beds |
show details | |

|
#43
Balmoral Ct
Lakewood, NJ 08701
|
- sq. feet
|
- baths - beds |
show details | |

|
#44
Inverness Ct
Lakewood, NJ 08701
|
- sq. feet
|
- baths - beds |
show details | |

|
#45
River Ave Apt D
Lakewood, NJ 08701
|
- sq. feet
|
- baths - beds |
show details | |

|
#46
Thornhill C A
Lakewood, NJ 08701
|
- sq. feet
|
- baths - beds |
show details | |

|
#47
B Aberdeen Dr
Lakewood, NJ 08701
|
- sq. feet
|
- baths - beds |
show details | |

|
#48
Colony Cir
Lakewood, NJ 08701
|
1,420 sq. feet
|
- baths - beds |
show details | |

|
#49
Picardy C B
Lakewood, NJ 08701
|
- sq. feet
|
- baths - beds |
show details | |

|
Check over 1 million property listings on Foreclosure.com!
|
browse all offers | |||


- 58,35682.9%White alone
- 8,60512.2%Hispanic
- 1,1481.6%Black alone
- 8891.3%Two or more races
- 6680.9%Other race alone
- 4160.6%Asian alone
- 110.02%Native Hawaiian and Other
Pacific Islander alone
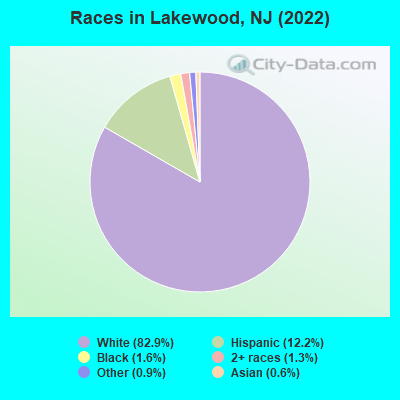
Races in Lakewood detailed stats: ancestries, foreign born residents, place of birth
According to our research of New Jersey and other state lists, there were 36 registered sex offenders living in Lakewood, New Jersey as of June 16, 2024.
The ratio of all residents to sex offenders in Lakewood is 1,535 to 1.
The ratio of registered sex offenders to all residents in this city is near the state average.
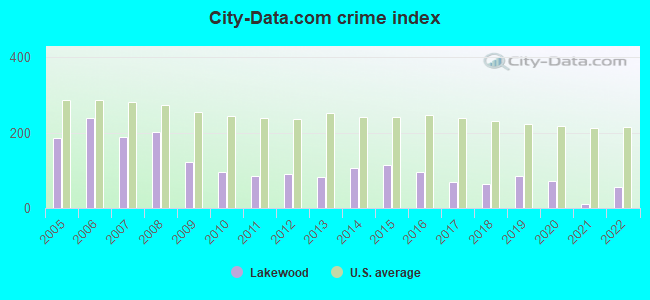
The City-Data.com crime index weighs serious crimes and violent crimes more heavily. Higher means more crime, U.S. average is 246.1. It adjusts for the number of visitors and daily workers commuting into cities.
- means the value is smaller than the state average.- means the value is about the same as the state average.
Crime rate in Lakewood detailed stats: murders, rapes, robberies, assaults, burglaries, thefts, arson
Full-time law enforcement employees in 2021, including police officers: 188 (148 officers - 139 male; 9 female).
| Officers per 1,000 residents here: | 1.30 |
| New Jersey average: | 5.53 |
 Recent articles from our blog. Our writers, many of them Ph.D. graduates or candidates, create easy-to-read articles on a wide variety of topics.


Latest news from Lakewood, NJ collected exclusively by city-data.com from local newspapers, TV, and radio stations
Ancestries: American (26.7%), European (7.3%), Polish (5.1%), Eastern European (2.2%), Hungarian (1.7%), Lithuanian (1.2%).
Current Local Time: EST time zone
Elevation: 91 feet
Land area: 7.16 square miles.
Population density: 10,408 people per square mile (high).
6,001 residents are foreign born (4.5% Latin America, 1.8% Europe, 1.0% Asia).
| This place: | 8.5% |
| New Jersey: | 23.2% |
Median real estate property taxes paid for housing units with mortgages in 2022: $10,001 (1.1%)
Median real estate property taxes paid for housing units with no mortgage in 2022: $9,245 (1.6%)
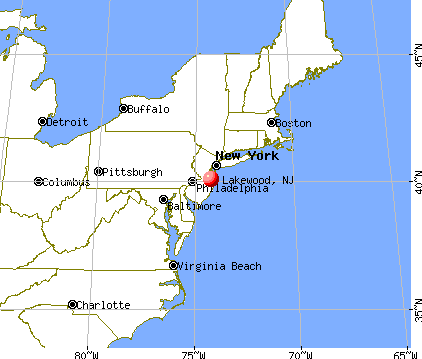
Nearest city with pop. 50,000+: Toms River, NJ  (8.5 miles , pop. 86,327).
Nearest city with pop. 200,000+: Staten Island, NY (33.8 miles , pop. 443,728).
Nearest city with pop. 1,000,000+: Brooklyn, NY (40.7 miles , pop. 2,465,326).
Nearest cities:
), ), ), ), ), ), ), Latitude: 40.10 N, Longitude: 74.22 W
Daytime population change due to commuting: +1,610 (+2.2%)
Workers who live and work in this place: 6,549 (35.6%)
Area codes: 732, 848, 908

Lakewood, New Jersey accommodation & food services, waste management - Economy and Business Data
| Here: | 4.3% |
| New Jersey: | 4.5% |
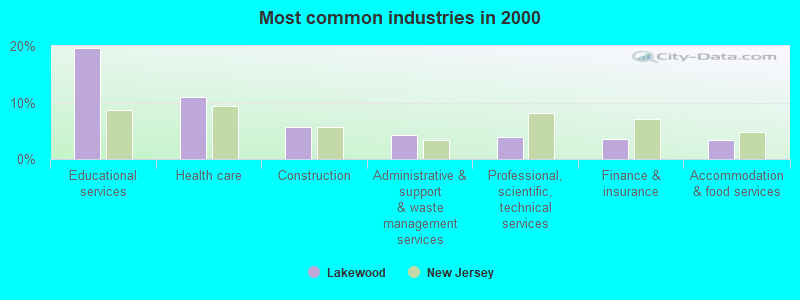
- Educational services (19.7%)
- Health care (11.0%)
- Construction (5.6%)
- Administrative & support & waste management services (4.2%)
- Professional, scientific, technical services (3.9%)
- Finance & insurance (3.5%)
- Accommodation & food services (3.4%)
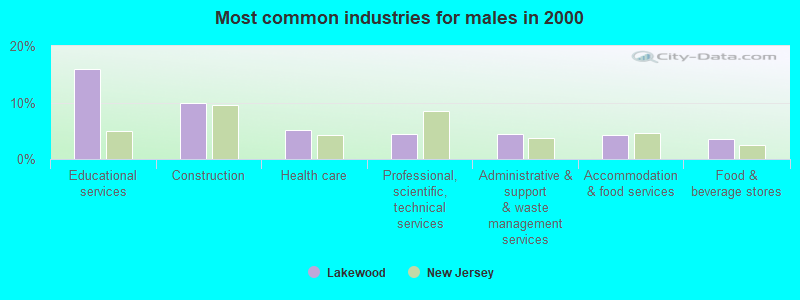
- Educational services (15.9%)
- Construction (9.9%)
- Health care (5.2%)
- Professional, scientific, technical services (4.5%)
- Administrative & support & waste management services (4.5%)
- Accommodation & food services (4.2%)
- Food & beverage stores (3.6%)
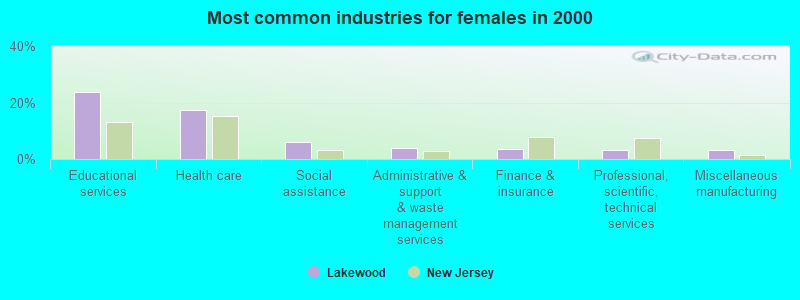
- Educational services (23.9%)
- Health care (17.2%)
- Social assistance (6.1%)
- Administrative & support & waste management services (3.9%)
- Finance & insurance (3.6%)
- Professional, scientific, technical services (3.3%)
- Miscellaneous manufacturing (3.1%)
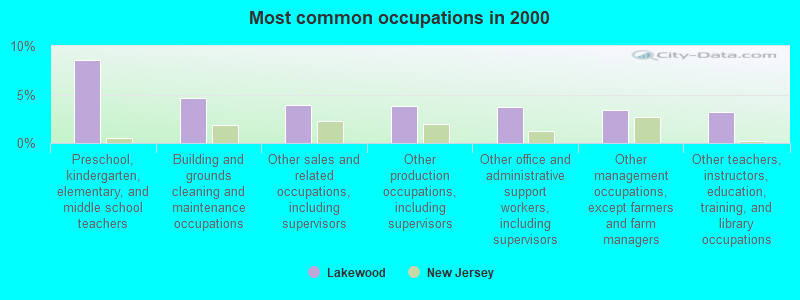
- Preschool, kindergarten, elementary, and middle school teachers (8.5%)
- Building and grounds cleaning and maintenance occupations (4.6%)
- Other sales and related occupations, including supervisors (4.0%)
- Other production occupations, including supervisors (3.8%)
- Other office and administrative support workers, including supervisors (3.7%)
- Other management occupations, except farmers and farm managers (3.4%)
- Other teachers, instructors, education, training, and library occupations (3.2%)
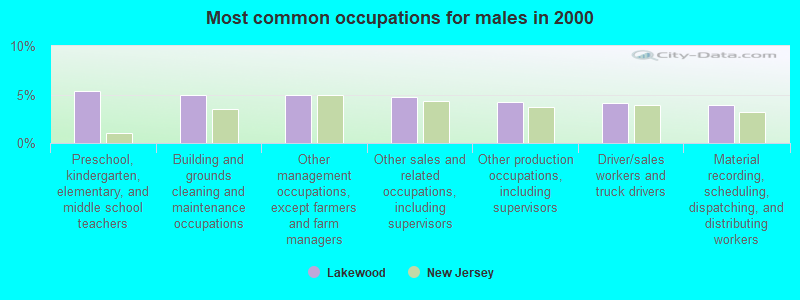
- Preschool, kindergarten, elementary, and middle school teachers (5.4%)
- Building and grounds cleaning and maintenance occupations (4.9%)
- Other management occupations, except farmers and farm managers (4.9%)
- Other sales and related occupations, including supervisors (4.7%)
- Other production occupations, including supervisors (4.2%)
- Driver/sales workers and truck drivers (4.1%)
- Material recording, scheduling, dispatching, and distributing workers (3.9%)
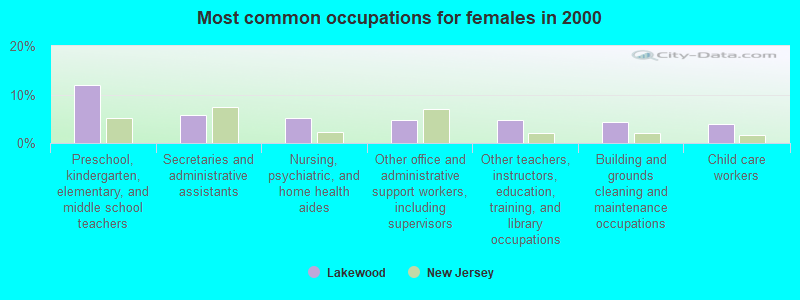
- Preschool, kindergarten, elementary, and middle school teachers (11.9%)
- Secretaries and administrative assistants (5.7%)
- Nursing, psychiatric, and home health aides (5.2%)
- Other office and administrative support workers, including supervisors (4.8%)
- Other teachers, instructors, education, training, and library occupations (4.7%)
- Building and grounds cleaning and maintenance occupations (4.3%)
- Child care workers (3.9%)
Average climate in Lakewood, New Jersey
Based on data reported by over 4,000 weather stations


|
|


(lower is better)
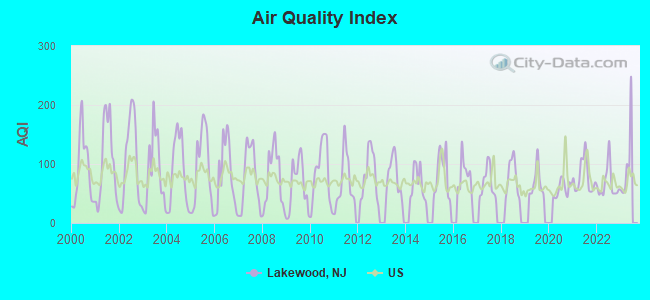
Air Quality Index (AQI) level in 2022 was 66.2. This is about average.
| City: | 66.2 |
| U.S.: | 72.6 |
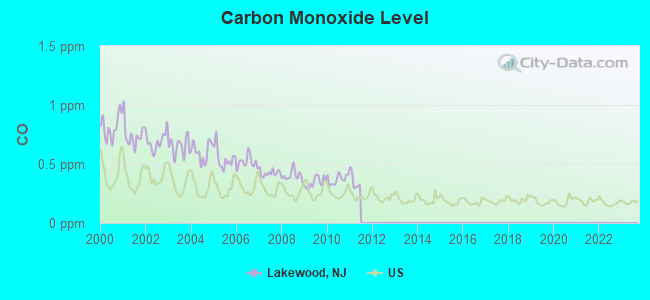
Carbon Monoxide (CO) [ppm] level in 2010 was 0.371. This is significantly worse than average. Closest monitor was 9.9 miles away from the city center.
| City: | 0.371 |
| U.S.: | 0.251 |
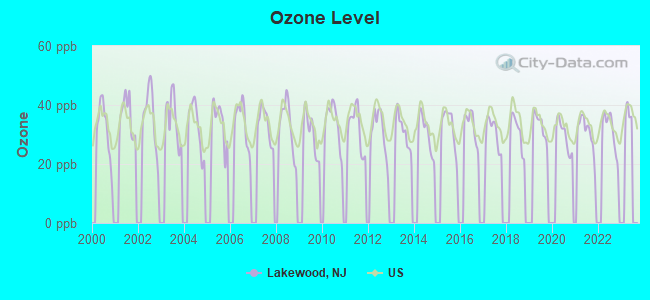
Ozone [ppb] level in 2022 was 31.1. This is about average. Closest monitor was 4.9 miles away from the city center.
| City: | 31.1 |
| U.S.: | 33.3 |
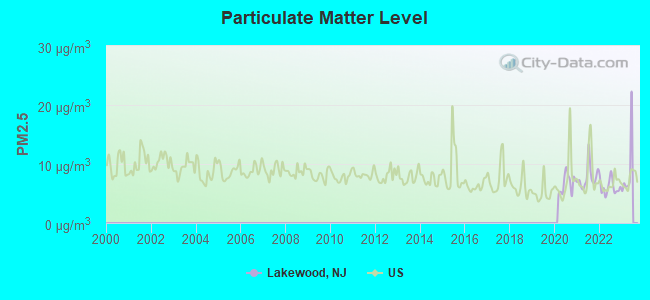
Particulate Matter (PM2.5) [µg/m3] level in 2022 was 6.10. This is better than average. Closest monitor was 7.4 miles away from the city center.
| City: | 6.10 |
| U.S.: | 8.11 |
Tornado activity:
Lakewood-area historical tornado activity is slightly below New Jersey state average. It is 45% smaller than the overall U.S. average.
On 7/21/1983, a category F3 (max. wind speeds 158-206 mph) tornado 29.7 miles away from the Lakewood place center caused between $500,000 and $5,000,000 in damages.
On 10/18/1990, a category F3 tornado 39.5 miles away from the place center injured 8 people and caused between $500,000 and $5,000,000 in damages.
Earthquake activity:
Lakewood-area historical earthquake activity is significantly above New Jersey state average. It is 69% smaller than the overall U.S. average.On 8/23/2011 at 17:51:04, a magnitude 5.8 (5.8 MW, Depth: 3.7 mi, Class: Moderate, Intensity: VI - VII) earthquake occurred 250.7 miles away from the city center
On 1/16/1994 at 01:49:16, a magnitude 4.6 (4.6 MB, 4.6 LG, Depth: 3.1 mi, Class: Light, Intensity: IV - V) earthquake occurred 97.5 miles away from Lakewood center
On 10/7/1983 at 10:18:46, a magnitude 5.3 (5.1 MB, 5.3 LG, 5.1 ML) earthquake occurred 266.8 miles away from the city center
On 4/20/2002 at 10:50:47, a magnitude 5.3 (5.3 ML, Depth: 3.0 mi) earthquake occurred 306.6 miles away from Lakewood center
On 1/16/1994 at 00:42:43, a magnitude 4.2 (4.2 MB, 4.0 LG, Depth: 3.1 mi) earthquake occurred 95.9 miles away from Lakewood center
On 8/22/1992 at 12:20:32, a magnitude 4.8 (4.8 MB, 3.8 MS, 4.7 LG, Depth: 6.2 mi) earthquake occurred 218.7 miles away from the city center
Magnitude types: regional Lg-wave magnitude (LG), body-wave magnitude (MB), local magnitude (ML), surface-wave magnitude (MS), moment magnitude (MW)
Natural disasters:
The number of natural disasters in Ocean County (27) is a lot greater than the US average (15).Major Disasters (Presidential) Declared: 16
Emergencies Declared: 9
Causes of natural disasters: Storms: 7, Floods: 6, Hurricanes: 6, Snowstorms: 4, Blizzards: 2, Fires: 2, Heavy Rains: 2, Water Shortages: 2, Winter Storms: 2, Tropical Depression: 1, Wind: 1, Other: 3 (Note: some incidents may be assigned to more than one category).

Hospitals in Lakewood:
Nursing Homes in Lakewood:
- ATLANTIC COAST REHAB AND HEALTH (485 RIVER AVE)
- CONCORD HEALTHCARE AND REHABILITATION CENTER (963 OCEAN AVE)
- FOUNTAIN VIEW CARE CENTER (527 RIVER AVE)
- HARROGATE (400 LOCUST STREET)
- HILLCREST MANOR INC (485 RIVER AVE)
- LEISURE PARK HEALTH CENTER (1400 ROUTE 70)
- MEDICENTER OF LAKEWOOD (685 RIVER AVE)
- NEWMANS LAKEWOOD NH (700 MONMOUTH AVE BOX D)
- OCEAN CONVALESCENT CENTER (901 MONMOUTH AVE)
- PINELAND NH (555 SQUANKUM ROAD)
- VICTORIAN GARDENS HCC (285 RIVER AVE)
Dialysis Facilities in Lakewood:
Airports located in Lakewood:
- Lakewood Airport (N12) (Runways: 1, Itinerant Ops: 3,750, Local Ops: 12,290)
Operable nuclear power plant near Lakewood:
- 19 miles: Oyster Creek in Forked River, NJ.
Colleges/Universities in Lakewood:
- Beth Medrash Govoha (Full-time enrollment: 6,700; Location: 617 6th St; Private, not-for-profit; Offers Master's degree)
- Georgian Court University (Full-time enrollment: 1,832; Location: 900 Lakewood Ave; Private, not-for-profit; Website: www.georgian.edu; Offers Master's degree)
- Bais Medrash Toras Chesed (Full-time enrollment: 120; Location: 901 Monmouth Ave; Private, not-for-profit)
- Yeshiva Toras Chaim (Full-time enrollment: 105; Location: 999 Ridge Ave; Private, not-for-profit)
- Yeshiva Yesodei Hatorah (Full-time enrollment: 72; Location: 2 Yesodei Court; Private, not-for-profit)
Other colleges/universities with over 2000 students near Lakewood:
- Ocean County College (about 7 miles; Toms River, NJ; Full-time enrollment: 7,471)
- Brookdale Community College (about 17 miles; Lincroft, NJ; FT enrollment: 10,879)
- Monmouth University (about 17 miles; West Long Branch, NJ; FT enrollment: 5,986)
- Burlington County College (about 25 miles; Pemberton, NJ; FT enrollment: 7,928)
- Mercer County Community College (about 26 miles; West Windsor, NJ; FT enrollment: 5,728)
- Princeton University (about 30 miles; Princeton, NJ; FT enrollment: 6,897)
- Middlesex County College (about 30 miles; Edison, NJ; FT enrollment: 9,849)
Public high school in Lakewood:
- LAKEWOOD HIGH SCHOOL (Students: 1,300, Location: 855 SOMERSET AVENUE, Grades: 9-12)
Biggest private high schools in Lakewood:
- YESHIVA K'TANA OF LAKEWOOD (Students: 849, Location: 120 2ND ST, Grades: KG-12, Boys only)
- BAIS SHAINDEL HIGH SCHOOL FOR GIRLS (Students: 512, Location: 685 RIVER AVE, Grades: 9-12, Girls only)
- BAIS YAAKOV HIGH SCHOOL OF LAKEWOOD (Students: 439, Location: 277 JAMES ST, Grades: 9-12, Girls only)
- MESIVTA OF LAKEWOOD (Students: 350, Location: 801 W KENNEDY BLVD, Grades: 8-12, Boys only)
- BAIS KAILA TORAH PREPARATORY HIGH SCHOOL FOR GIRLS (Students: 296, Location: 100 BAIS KAILA LN, Grades: 9-12, Girls only)
- CALVARY ACADEMY (Students: 263, Location: 1133 E COUNTY LINE RD, Grades: PK-12)
- YESHIVA TORAS CHAIM (Students: 171, Location: 999 RIDGE AVE, Grades: 9-12, Boys only)
- OROS BAIS YAKOV (Students: 170, Location: 613 OAK ST, Grades: 9-12, Girls only)
- YESHIVA KEREN HATORAH (Students: 130, Location: 1083 BROOK RD, Grades: 9-12, Boys only)
- MESIVTA NACHLAS YISROEL (Students: 96, Location: 1395 CENTRAL AVE, Grades: 9-12)
Public elementary/middle schools in Lakewood:
- OAK STREET ELEM SCHOOL (Students: 1,016, Location: 75 OAK STREET, Grades: 1-5)
- ELLA G CLARKE ELEMENTARY SCHOOL (Students: 939, Location: 455 MANETTA AVENUE, Grades: 1-5)
- LAKEWOOD MIDDLE SCHOOL (Students: 762, Location: 755 SOMERSET AVENUE, Grades: 6-8)
- CLIFTON AVE GRADE SCHOOL (Students: 749, Location: 625 CLIFTON AVENUE, Grades: 1-5)
- SPRUCE STREET ELEMENTARY SCHOOL (Students: 686, Location: 90 SPRUCE STREET, Grades: KG-1)
Biggest private elementary/middle schools in Lakewood:
- BAIS FAIGA SCHOOL FOR GIRLS (Students: 1,880, Location: 350 COURTNEY RD, Grades: KG-8, Girls only)
- BAIS RIVKA ROCHEL SCHOOL (Students: 971, Location: 285 RIVER AVE, Grades: KG-8)
- YESHIVA ORCHOS CHAIM (Students: 835, Location: 410 OBERLIN AVE S, Grades: KG-8, Boys only)
- YESHIVA TORAS ARON (Students: 686, Location: 285 RIVER AVE, Grades: KG-6, Boys only)
- BNOS YAAKON ELEMENTARY SCHOOL (Students: 628, Location: 2 KENT RD, Grades: KG-8, Girls only)
- TIFERES BAIS YAAKOV (Students: 592, Location: 613 OAK ST, Grades: KG-8, Girls only)
- BAIS ROCHEL (Students: 574, Location: 115 CAREY ST, Grades: PK-8, Girls only)
- TALMUD TORAH BAIS AVROHOM (Students: 538, Location: 915 NEW HAMPSHIRE AVE, Grades: KG-8, Boys only)
- BNOS MELECH (Students: 453, Location: 685 RIVER AVE, Grades: KG-7, Girls only)
- BNOS BROCHA (Students: 404, Location: 763 RIVER AVE STE 1, Grades: PK-7, Girls only)
Points of interest:
Notable locations in Lakewood: Lake House (A), Seventh Street Gate House (B), Lakewood Township Municipal Building (C), Music Center (D), Hamilton Hall (E), Kingscote Administration Building (F), Farley Center (G), Mercedes Hall (H), Catherine McAuley Chapel (I), Raymond Hall Complex (J), Gould Mansion (K), Maria Hall (L), Saint Joseph's Hall (M), Casino (N), Sister Mary Joseph Cunningham Library (O), Mercy Center (P), Little Theater (Q), Arts and Sciences Center (R), Lakewood Branch Ocean County Library (S), Hatzalah Emergency Medical Services (T). Display/hide their locations on the map
Shopping Center: Lakewood Shopping Center (1). Display/hide its location on the map
Churches in Lakewood include: Bethel African Methodist Episcopal Church (A), Bethel Church of God (B), Christ United Methodist Church (C), Christian Missionary Church (D), Emanuel Pentecostal Church (E), First Presbyterian Church (F), Immanuel Lutheran Church (G), Intercessary Tabernacle (H), Lakewood Church of God (I). Display/hide their locations on the map
Cemeteries: Greenwood Cemetery (1), Woodlawn Cemetery (2), Mount Sinai Cemetery (3). Display/hide their locations on the map
Reservoirs: Lake Manetta (A), Lake Shenandoah (B), Lake Carasaljo (C). Display/hide their locations on the map
Streams, rivers, and creeks: Watering Place Brook (A). Display/hide its location on the map
Parks in Lakewood include: Japanese Garden (1), Italian Garden (2), Sunken Garden (3), Formal Garden (4), Carasaljo Park (5), Lake Shenandoah County Park (6), Ocean County Park (7). Display/hide their locations on the map
Tourist attractions: Ocean County Offices & Institutions - Libraries- Branches- Jackson (Cultural Attractions- Events- & Facilities; 2 Jackson Drive), American International Tours (Ski & Helicopter Tours; 997 Brook Ave), Netline (1525 Prospect Street), AAA Travel (Tours & Charters; 1900 Highway 70).
Hotels: Consuelo's Travel Agency (220 3rd Street), Best Western Leisure Inn (1600 Route 70), Lakewood Manor Motel Inc (1275 River Avenue), Econo Lodge Lakewood (450 Madison Avenue), American Hotel Register CO (600 James Street), Four Seasons Clubhouse (1600 Spring Meadow Drive), Hotel Company (1191 Squankum Rd), Capri Motel (6530 U S Hwy No 9).
Birthplace of: Mylo Carbia - born (1971), screenwriter, Braden Scott - College football player (Lehigh Mountain Hawks), Natalie Hays Hammond - Artist.
Drinking water stations with addresses in Lakewood and their reported violations in the past:
LAKEWOOD TWP MUA (Population served: 17,400, Purch surface water):Past monitoring violations:SHORE ACRES MOBILE HOME (Population served: 400, Groundwater):
- One regular monitoring violation
Past monitoring violations:OORAH (CATSKILL RETREAT) ZONE1 (Address: 1805 SWARTHMORE AVENUE , Serves NY, Population served: 347, Groundwater):
- 2 routine major monitoring violations
Past monitoring violations:CEDAR GROVE APARTMENTS (Population served: 96, Groundwater):
- 2 regular monitoring violations
Past health violations:HANOVER EAST APARTMENTS (Population served: 96, Groundwater):Past monitoring violations:
- MCL, Monthly (TCR) - In SEP-2013, Contaminant: Coliform. Follow-up actions: St Public Notif requested (OCT-02-2013), St Formal NOV issued (OCT-02-2013), St Public Notif received (OCT-17-2013), St Compliance achieved (OCT-31-2013)
- MCL, Monthly (TCR) - In AUG-2011, Contaminant: Coliform. Follow-up actions: St Public Notif received (AUG-11-2011), St Public Notif requested (AUG-16-2011), St Formal NOV issued (AUG-16-2011), St Compliance achieved (SEP-30-2011)
- 2 minor monitoring violations
Past health violations:OXFORD HERITAGE MANOR (Address: 1460 WALDEN AVE , Population served: 60, Groundwater):Past monitoring violations:
- MCL, Monthly (TCR) - In MAY-2014, Contaminant: Coliform
- MCL, Acute (TCR) - In MAY-2014, Contaminant: Coliform. Follow-up actions: St Public Notif requested (MAY-27-2014), St Formal NOV issued (MAY-27-2014), St Public Notif received (JUN-02-2014)
- MCL, Monthly (TCR) - In FEB-2014, Contaminant: Coliform. Follow-up actions: St Public Notif requested (MAR-04-2014), St Formal NOV issued (MAR-04-2014), St Compliance achieved (MAR-24-2014), St Public Notif received (APR-11-2014)
- MCL, Monthly (TCR) - In JUN-2012, Contaminant: Coliform. Follow-up actions: St Public Notif requested (JUN-28-2012), St Formal NOV issued (JUN-28-2012), St Compliance achieved (JUL-18-2012), St Public Notif received (JUL-26-2012)
- MCL, Monthly (TCR) - In JAN-2012, Contaminant: Coliform. Follow-up actions: St Public Notif requested (FEB-13-2012), St Formal NOV issued (FEB-13-2012), St Compliance achieved (FEB-13-2012), St Public Notif received (FEB-18-2012)
- MCL, Monthly (TCR) - In SEP-2011, Contaminant: Coliform. Follow-up actions: St Public Notif requested (SEP-28-2011), St Formal NOV issued (SEP-28-2011), St Public Notif received (OCT-28-2011), St Compliance achieved (NOV-18-2011)
- 7 other older health violations
- Follow-up Or Routine LCR Tap M/R - In OCT-01-2010, Contaminant: Lead and Copper Rule. Follow-up actions: St Formal NOV issued (MAR-30-2011), St Compliance achieved (JUN-03-2011)
- Monitoring, Source Water (GWR) - In AUG-2010, Contaminant: E. COLI. Follow-up actions: St Public Notif requested (JAN-13-2011), St Formal NOV issued (JAN-13-2011), St Compliance achieved (AUG-05-2011)
- One regular monitoring violation
Past monitoring violations:OORAH RESORT, THE VENETIAN (Address: 1805 SWARTHMORE AVENUE , Serves NY, Population served: 50, Groundwater):
- Monitoring and Reporting (DBP) - Between APR-2014 and JUN-2014, Contaminant: Chlorine
- Monitoring and Reporting (DBP) - Between APR-2014 and JUN-2014, Contaminant: Chlorine
- Monitoring and Reporting (DBP) - Between APR-2014 and JUN-2014, Contaminant: Chlorine
- One regular monitoring violation
Past monitoring violations:OAKWOOD COTTAGES (Address: 27 GENESEE PLACE , Serves NY, Population served: 50, Groundwater):
- 4 routine major monitoring violations
- One regular monitoring violation
Past monitoring violations:
- 3 routine major monitoring violations
- 2 regular monitoring violations
| This place: | 4.9 people |
| New Jersey: | 2.7 people |
| This place: | 84.2% |
| Whole state: | 69.3% |
| This place: | 4.5% |
| Whole state: | 5.9% |
Likely homosexual households (counted as self-reported same-sex unmarried-partner households)
- Lesbian couples: 0.3% of all households
- Gay men: 0.3% of all households
People in group quarters in Lakewood in 2010:
- 1,261 people in college/university student housing
- 404 people in nursing facilities/skilled-nursing facilities
- 238 people in group homes intended for adults
- 155 people in other noninstitutional facilities
People in group quarters in Lakewood in 2000:
- 796 people in college dormitories (includes college quarters off campus)
- 584 people in nursing homes
- 210 people in schools, hospitals, or wards for the intellectually disabled
- 31 people in hospitals/wards and hospices for chronically ill
- 31 people in hospices or homes for chronically ill
- 20 people in other nonhousehold living situations
- 17 people in homes for the mentally retarded
- 4 people in other noninstitutional group quarters
Banks with most branches in Lakewood (2011 data):
- Sovereign Bank, National Association: Lakewood Branch, Leisure Village East Branch, Lakewood Branch, Route 70 Branch. Info updated 2012/01/31: Bank assets: $78,146.9 mil, Deposits: $48,042.9 mil, headquarters in Wilmington, DE, positive income, Commercial Lending Specialization, 718 total offices, Holding Company: Banco Santander, S.A.
- Hudson City Savings Bank: Seagull Square Plaza Branch, Lakewood Branch, Lakewood Branch. Info updated 2012/01/09: Bank assets: $45,373.6 mil, Deposits: $25,645.6 mil, headquarters in Paramus, NJ, negative income in the last year, Mortgage Lending Specialization, 135 total offices
- Wells Fargo Bank, National Association: Lakewood Main at 317 Main Street, branch established on 1934/06/11; Lakewood County Line at 425 West Kennedy Boulevard, branch established on 1961/06/24. Info updated 2011/04/05: Bank assets: $1,161,490.0 mil, Deposits: $905,653.0 mil, headquarters in Sioux Falls, SD, positive income, 6395 total offices, Holding Company: Wells Fargo & Company
- Bank of America, National Association: Lakewood Branch at 395 Route 70, branch established on 1984/07/20; Ocean County Branch at 315 Madison Avenue, branch established on 1972/10/28. Info updated 2009/11/18: Bank assets: $1,451,969.3 mil, Deposits: $1,077,176.8 mil, headquarters in Charlotte, NC, positive income, 5782 total offices, Holding Company: Bank Of America Corporation
- JPMorgan Chase Bank, National Association: Lakewood Branch at 175 East Kennedy Boulevard, branch established on 1987/06/15; Lakewood - Lakewood Plaza Branch at 1700 Madison Avenue, branch established on 2005/09/19. Info updated 2011/11/10: Bank assets: $1,811,678.0 mil, Deposits: $1,190,738.0 mil, headquarters in Columbus, OH, positive income, International Specialization, 5577 total offices, Holding Company: Jpmorgan Chase & Co.
- Investors Bank: Lakewood Branch at 425 Route 70, branch established on 2001/02/10; Clifton Avenue Branch at 101 Clifton Avenue, branch established on 2009/11/15. Info updated 2012/02/27: Bank assets: $10,674.9 mil, Deposits: $7,419.7 mil, headquarters in Short Hills, NJ, positive income, Commercial Lending Specialization, 86 total offices, Holding Company: Investors Bancorp, Mhc
- First Commerce Bank: at 105 River Avenue, branch established on 2006/01/30. Info updated 2011/07/26: Bank assets: $154.7 mil, Deposits: $131.4 mil, local headquarters, positive income, Commercial Lending Specialization, 2 total offices
- Capital One, National Association: Lakewood Branch at 1255 Route 70/Airport Road, branch established on 2009/01/12. Info updated 2011/07/01: Bank assets: $133,477.8 mil, Deposits: $97,063.7 mil, headquarters in Mclean, VA, positive income, 984 total offices, Holding Company: Capital One Financial Corporation
- TD Bank, National Association: Lakewood Branch at 1601 Madison Ave, branch established on 2007/04/15. Info updated 2010/10/04: Bank assets: $188,912.6 mil, Deposits: $153,149.8 mil, headquarters in Wilmington, DE, positive income, 1314 total offices, Holding Company: Toronto-Dominion Bank, The
- 3 other banks with 3 local branches
For population 15 years and over in Lakewood:
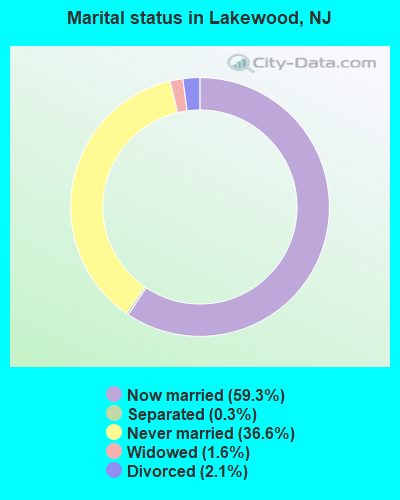
- Never married: 36.6%
- Now married: 59.3%
- Separated: 0.3%
- Widowed: 1.6%
- Divorced: 2.1%
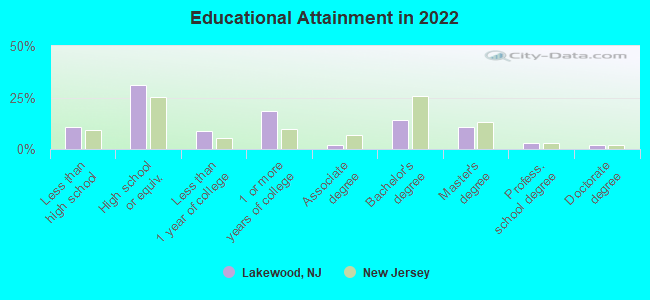
For population 25 years and over in Lakewood:
- High school or higher: 89.4%
- Bachelor's degree or higher: 29.3%
- Graduate or professional degree: 15.3%
- Unemployed: 8.9%
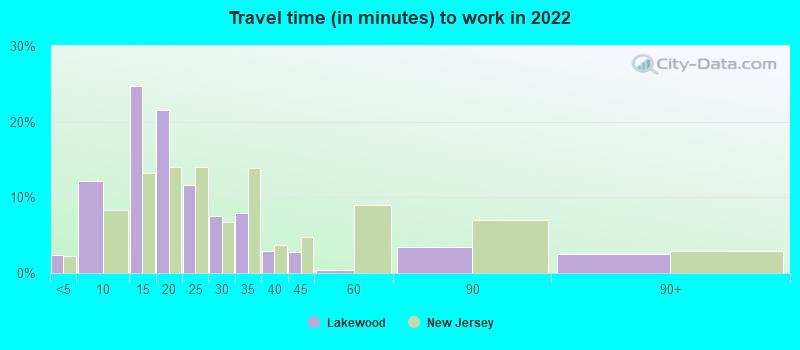
- Mean travel time to work (commute): 20.0 minutes
| Here: | 12.5 |
| New Jersey average: | 12.8 |
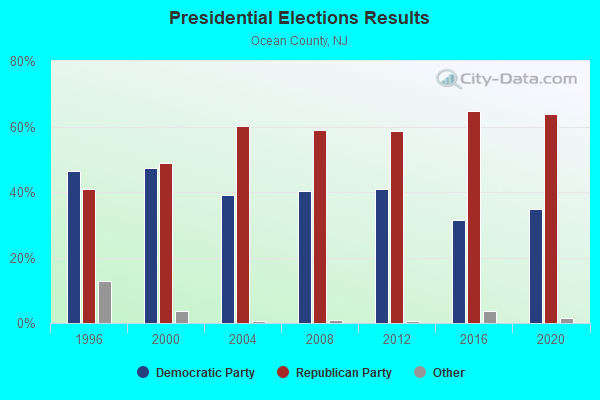
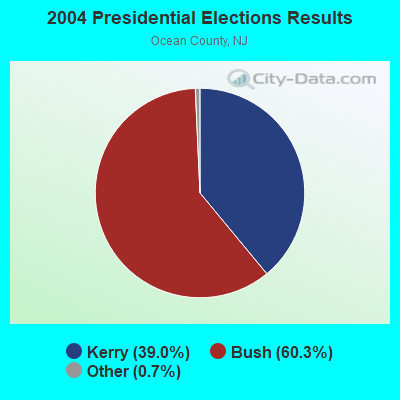
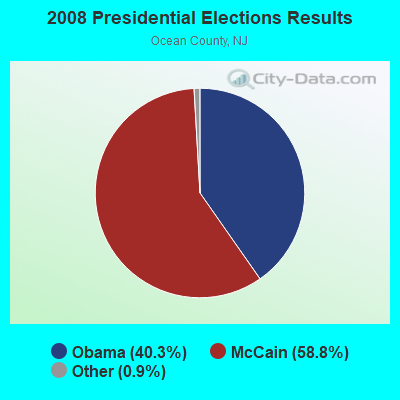
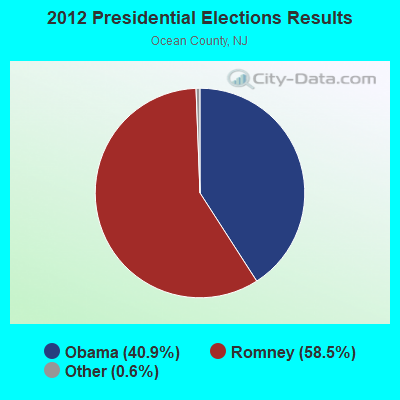
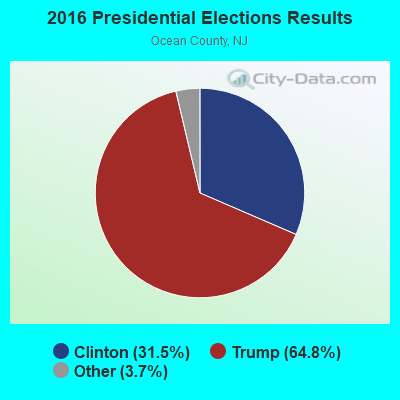
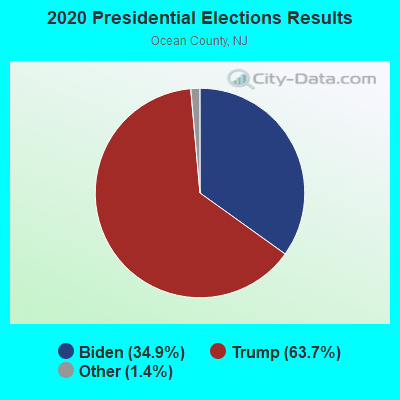
Graphs represent county-level data. Detailed 2008 Election Results
Religion statistics for Lakewood, NJ (based on Ocean County data)
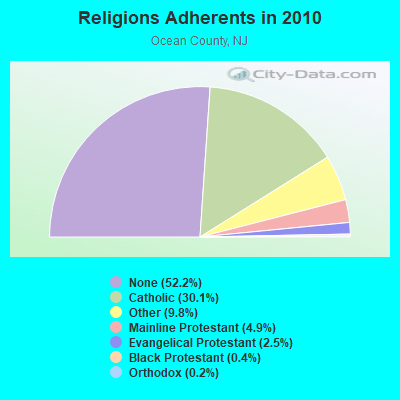
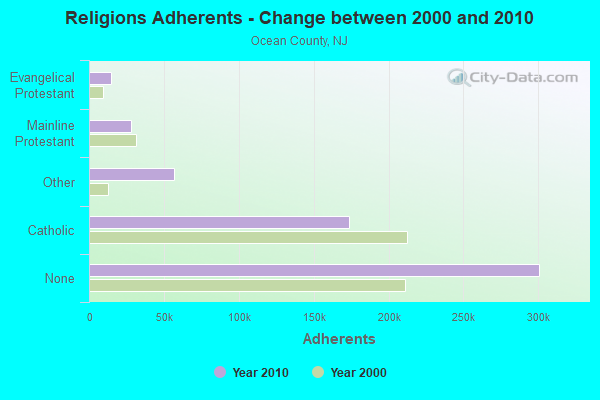
| Religion | Adherents | Congregations |
|---|---|---|
| Catholic | 173,318 | 26 |
| Other | 56,416 | 108 |
| Mainline Protestant | 28,029 | 74 |
| Evangelical Protestant | 14,510 | 79 |
| Black Protestant | 2,303 | 11 |
| Orthodox | 1,280 | 4 |
| None | 300,711 | - |
Food Environment Statistics:
| Ocean County: | 1.59 / 10,000 pop. |
| State: | 2.90 / 10,000 pop. |
| Ocean County: | 0.04 / 10,000 pop. |
| State: | 0.06 / 10,000 pop. |
| Here: | 1.95 / 10,000 pop. |
| New Jersey: | 1.76 / 10,000 pop. |
| Ocean County: | 0.87 / 10,000 pop. |
| State: | 0.81 / 10,000 pop. |
| Ocean County: | 6.36 / 10,000 pop. |
| New Jersey: | 7.15 / 10,000 pop. |
| Here: | 9.2% |
| New Jersey: | 8.3% |
| Ocean County: | 26.4% |
| New Jersey: | 23.3% |
| Here: | 13.2% |
| New Jersey: | 18.0% |
Health and Nutrition:
| Lakewood: | 46.5% |
| New Jersey: | 50.6% |
| This city: | 43.7% |
| New Jersey: | 48.5% |
| Lakewood: | 28.3 |
| New Jersey: | 28.5 |
| Lakewood: | 21.0% |
| New Jersey: | 20.0% |
| This city: | 11.4% |
| New Jersey: | 11.1% |
| Here: | 6.8 |
| New Jersey: | 6.8 |
| Here: | 29.0% |
| New Jersey: | 33.6% |
| Lakewood: | 55.1% |
| New Jersey: | 56.9% |
| Lakewood: | 80.6% |
| New Jersey: | 80.0% |
More about Health and Nutrition of Lakewood, NJ Residents
6.12% of this county's 2021 resident taxpayers lived in other counties in 2020 ($95,565 average adjusted gross income)
| Here: | 6.12% |
| New Jersey average: | 6.70% |
0.01% of residents moved from foreign countries ($88 average AGI)
Ocean County: 0.01% New Jersey average: 0.01%
Top counties from which taxpayers relocated into this county between 2020 and 2021:
| from Monmouth County, NJ | |
| from Middlesex County, NJ | |
| from Bergen County, NJ |
5.03% of this county's 2020 resident taxpayers moved to other counties in 2021 ($85,282 average adjusted gross income)
| Here: | 5.03% |
| New Jersey average: | 7.02% |
0.01% of residents moved to foreign countries ($90 average AGI)
Ocean County: 0.01% New Jersey average: 0.02%
Top counties to which taxpayers relocated from this county between 2020 and 2021:
| to Monmouth County, NJ | |
| to Burlington County, NJ | |
| to Middlesex County, NJ |
| Businesses in Lakewood, NJ | ||||
| Name | Count | Name | Count | |
|---|---|---|---|---|
| AT&T | 1 | MasterBrand Cabinets | 26 | |
| Advance Auto Parts | 1 | McDonald's | 1 | |
| AutoZone | 1 | Nike | 1 | |
| Baskin-Robbins | 2 | Payless | 1 | |
| Best Western | 1 | Penske | 1 | |
| Brunswick Bowling & Billiards | 1 | RadioShack | 1 | |
| Burger King | 1 | Rite Aid | 1 | |
| CVS | 1 | Ruby Tuesday | 1 | |
| Circle K | 1 | SAS Shoes | 2 | |
| Curves | 1 | Sears | 2 | |
| Decora Cabinetry | 10 | Starbucks | 1 | |
| Dunkin Donuts | 5 | Subaru | 1 | |
| FedEx | 5 | T-Mobile | 1 | |
| Ford | 1 | Toyota | 1 | |
| H&R Block | 2 | U-Haul | 2 | |
| Hilton | 1 | UPS | 13 | |
| Home Depot | 1 | Verizon Wireless | 1 | |
| KFC | 1 | |||
Strongest AM radio stations in Lakewood:
- WOBM (1160 AM; 9 kW; LAKEWOOD TOWNSHIP, NJ; Owner: NORTH SHORE BROADCASTING CORP.)
- WMCA (570 AM; 50 kW; NEW YORK, NY; Owner: SALEM MEDIA OF NEW YORK, LLC)
- WOR (710 AM; 50 kW; NEW YORK, NY; Owner: BUCKLEY BROADCASTING CORPORATION)
- WPHT (1210 AM; 50 kW; PHILADELPHIA, PA; Owner: INFINITY BROADCASTING OPERATIONS, INC.)
- WWJZ (640 AM; 50 kW; MOUNT HOLLY, NJ; Owner: ABC, INC.)
- WFAN (660 AM; 50 kW; NEW YORK, NY; Owner: INFINITY BROADCASTING OPERATIONS, INC.)
- WABC (770 AM; 50 kW; NEW YORK, NY; Owner: WABC-AM RADIO, INC.)
- WINS (1010 AM; 50 kW; NEW YORK, NY; Owner: INFINITY BROADCASTING OPERATIONS, INC.)
- WEPN (1050 AM; 50 kW; NEW YORK, NY; Owner: NEW YORK AM RADIO, LLC)
- WBBR (1130 AM; 50 kW; NEW YORK, NY; Owner: BLOOMBERG COMMUNICATIONS INC.)
- WCBS (880 AM; 50 kW; NEW YORK, NY; Owner: INFINITY BROADCASTING OPERATIONS, INC.)
- WPEN (950 AM; 50 kW; PHILADELPHIA, PA; Owner: GREATER PHILADELPHIA RADIO, INC.)
- WZZD (990 AM; 50 kW; PHILADELPHIA, PA; Owner: PENNSYLVANIA MEDIA ASSOCIATES, INC.)
Strongest FM radio stations in Lakewood:
- WJLK-FM (94.3 FM; ASBURY PARK, NJ; Owner: MILLENNIUM SHORE LICENSE HOLDCO, LLC)
- WHTG-FM (106.3 FM; EATONTOWN, NJ; Owner: PRESS COMMUNICATIONS, LLC)
- WRAT (95.9 FM; POINT PLEASANT, NJ; Owner: THE SENTINEL PUBLISHING CO.)
- WOBM-FM (92.7 FM; TOMS RIVER, NJ; Owner: SEASHORE BROADCASTING CORP.)
- WKXW-FM (101.5 FM; TRENTON, NJ; Owner: MILLENNIUM CENTRAL NEW JERSEY LICENSE HOLDCO, LLC)
- WNYC-FM (93.9 FM; NEW YORK, NY; Owner: WNYC RADIO)
- WNJT-FM (88.1 FM; TRENTON, NJ; Owner: NEW JERSEY PUBLIC BRD/CST AUTHORITY)
- WPAT-FM (93.1 FM; PATERSON, NJ; Owner: WPAT LICENSING, INC.)
- WBJB-FM (90.5 FM; LINCROFT, NJ; Owner: BROOKDALE COMMUNITY COLLEGE)
- WPRB (103.3 FM; PRINCETON, NJ; Owner: PRINCETON BROADCASTING SERVICE, INC.)
- WQCD (101.9 FM; NEW YORK, NY; Owner: EMMIS RADIO LICENSE CORPORATION)
- WWZY (107.1 FM; LONG BRANCH, NJ; Owner: PRESS COMMUNICATIONS, LLC)
- W264AM (100.7 FM; TOMS RIVER, NJ; Owner: JERSEY SHORE BROADCASTING CORPORATION)
- WKTU (103.5 FM; LAKE SUCCESS, NY; Owner: AMFM RADIO LICENSES, LLC)
- WCAA (105.9 FM; NEWARK, NJ; Owner: WADO-AM LICENSE CORP. ("WADO"))
- WBAI (99.5 FM; NEW YORK, NY; Owner: PACIFICA FOUNDATION, INC.)
- WBLS (107.5 FM; NEW YORK, NY; Owner: ICBC BROADCAST HOLDINGS-NY, INC.)
- WLTW (106.7 FM; NEW YORK, NY; Owner: AMFM NEW YORK LICENSES, LLC)
- WQXR-FM (96.3 FM; NEW YORK, NY; Owner: THE NEW YORK TIMES ELECTRONIC MEDIA COMPANY)
- WSKQ-FM (97.9 FM; NEW YORK, NY; Owner: WSKQ LICENSING, INC.)
TV broadcast stations around Lakewood:
- WCBS-TV (Channel 2; NEW YORK, NY; Owner: CBS BROADCASTING INC.)
- WNYW (Channel 5; NEW YORK, NY; Owner: FOX TELEVISION STATIONS, INC.)
- WABC-TV (Channel 7; NEW YORK, NY; Owner: AMERICAN BROADCASTING COMPANIES, INC)
- WPIX (Channel 11; NEW YORK, NY; Owner: WPIX, INC.)
- WWOR-TV (Channel 9; SECAUCUS, NJ; Owner: FOX TELEVISION STATIONS, INC.)
- WNJT (Channel 52; TRENTON, NJ; Owner: NEW JERSEY PUBLIC BROADCASTING AUTHORITY)
- WPXN-TV (Channel 31; NEW YORK, NY; Owner: PAXSON COMMUNICATIONS LICENSE COMPANY, LLC)
- WNBC (Channel 4; NEW YORK, NY; Owner: NATIONAL BROADCASTING COMPANY, INC.)
- WNET (Channel 13; NEWARK, NJ; Owner: EDUCATIONAL BROADCASTING CORPORATION)
- WXTV (Channel 41; PATERSON, NJ; Owner: WXTV LICENSE PARTNERSHIP, G.P.)
- WNJU (Channel 47; LINDEN, NJ; Owner: WNJU LICENSE CORPORATION)
- WUVP (Channel 65; VINELAND, NJ; Owner: UNIVISION PHILADELPHIA LLC)
- WFUT (Channel 68; NEWARK, NJ; Owner: UNIVISION NEW YORK LLC)
- WWSI (Channel 62; ATLANTIC CITY, NJ; Owner: HISPANIC BROADCASTERS OF PHILADELPHIA, L.L.C.)
- WXNY-LP (Channel 32; NEW YORK, NY; Owner: ISLAND BROADCASTING COMPANY)
- WNYE-TV (Channel 25; NEW YORK, NY; Owner: NEW YORK CITY BOARD OF EDUCATION)
- WNJN (Channel 50; MONTCLAIR, NJ; Owner: NEW JERSEY PUBLIC B/CNG AUTHORITY)
- WKOB-LP (Channel 53; NEW YORK, NY; Owner: WKOB COMMUNICATIONS, INC.)
- WEBR-CA (Channel 17; MANHATTAN, NY; Owner: K LICENSEE INC.)
- WRNN-LP (Channel 57; NYACK, NY; Owner: LP NYACK LIMITED PARTNERSHIP)
- WNJB1 (Channel 58; LONG BRANCH, NJ; Owner: NJ PUBLIC BROADCASTING AUTHORITY)
- National Bridge Inventory (NBI) Statistics
- 46Number of bridges
- 312ft / 95.2mTotal length
- $7,394,000Total costs
- 1,323,857Total average daily traffic
- 53,997Total average daily truck traffic
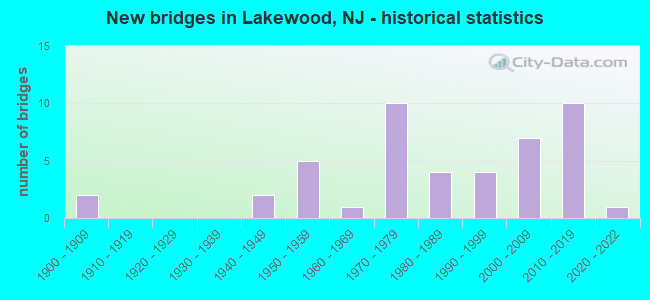
- New bridges - historical statistics
- 21900-1909
- 21940-1949
- 51950-1959
- 11960-1969
- 101970-1979
- 41980-1989
- 41990-1999
- 72000-2009
- 102010-2019
- 12020-2022
FCC Registered Private Land Mobile Towers: 6 (See the full list of FCC Registered Private Land Mobile Towers in Lakewood, NJ)
FCC Registered Broadcast Land Mobile Towers: 32 (See the full list of FCC Registered Broadcast Land Mobile Towers)
FCC Registered Microwave Towers: 31 (See the full list of FCC Registered Microwave Towers in this town)
FCC Registered Paging Towers: 4 (See the full list of FCC Registered Paging Towers)
FCC Registered Maritime Coast & Aviation Ground Towers: 3 (See the full list of FCC Registered Maritime Coast & Aviation Ground Towers)
FCC Registered Amateur Radio Licenses: 171 (See the full list of FCC Registered Amateur Radio Licenses in Lakewood)
FAA Registered Aircraft: 20 (See the full list of FAA Registered Aircraft in Lakewood)
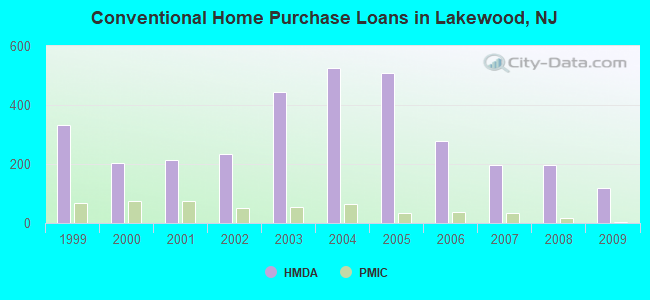
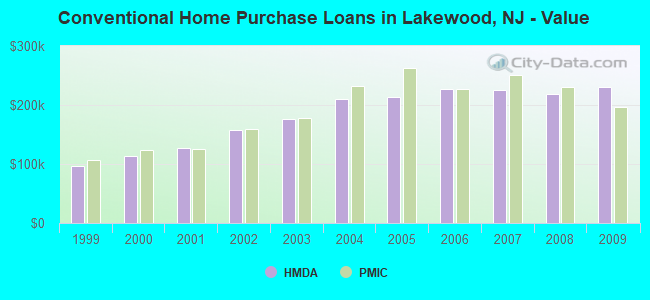
| Home Mortgage Disclosure Act Aggregated Statistics For Year 2009 (Based on 5 full and 3 partial tracts) | ||||||||||||
| A) FHA, FSA/RHS & VA Home Purchase Loans | B) Conventional Home Purchase Loans | C) Refinancings | D) Home Improvement Loans | E) Loans on Dwellings For 5+ Families | F) Non-occupant Loans on < 5 Family Dwellings (A B C & D) | |||||||
|---|---|---|---|---|---|---|---|---|---|---|---|---|
| Number | Average Value | Number | Average Value | Number | Average Value | Number | Average Value | Number | Average Value | Number | Average Value | |
| LOANS ORIGINATED | 7 | $200,186 | 117 | $230,996 | 213 | $243,165 | 11 | $228,645 | 3 | $1,580,000 | 79 | $216,256 |
| APPLICATIONS APPROVED, NOT ACCEPTED | 1 | $66,230 | 19 | $294,665 | 22 | $245,667 | 0 | $0 | 0 | $0 | 6 | $262,500 |
| APPLICATIONS DENIED | 2 | $190,555 | 31 | $216,010 | 104 | $233,889 | 9 | $87,187 | 2 | $2,275,000 | 34 | $220,141 |
| APPLICATIONS WITHDRAWN | 1 | $150,270 | 18 | $223,358 | 55 | $254,579 | 0 | $0 | 0 | $0 | 17 | $203,551 |
| FILES CLOSED FOR INCOMPLETENESS | 1 | $386,810 | 8 | $234,721 | 21 | $244,589 | 1 | $160,000 | 0 | $0 | 5 | $204,640 |
Detailed HMDA statistics for the following Tracts: 7150.00 , 7152.00, 7153.01, 7153.02, 7154.01, 7154.02, 7155.00, 7156.00
| Private Mortgage Insurance Companies Aggregated Statistics For Year 2009 (Based on 2 full and 3 partial tracts) | ||||
| A) Conventional Home Purchase Loans | B) Refinancings | |||
|---|---|---|---|---|
| Number | Average Value | Number | Average Value | |
| LOANS ORIGINATED | 5 | $196,898 | 2 | $281,580 |
| APPLICATIONS APPROVED, NOT ACCEPTED | 3 | $262,563 | 1 | $335,810 |
| APPLICATIONS DENIED | 5 | $237,066 | 0 | $0 |
| APPLICATIONS WITHDRAWN | 1 | $163,000 | 0 | $0 |
| FILES CLOSED FOR INCOMPLETENESS | 1 | $109,000 | 0 | $0 |
Detailed PMIC statistics for the following Tracts: 7150.00 , 7152.00, 7153.01, 7153.02, 7154.01, 7154.02, 7155.00, 7156.00
2005 - 2018 National Fire Incident Reporting System (NFIRS) incidents
- Fire incident types reported to NFIRS in Lakewood, NJ
- 48458.0%Structure Fires
- 21625.9%Outside Fires
- 12915.5%Mobile Property/Vehicle Fires
- 50.6%Other
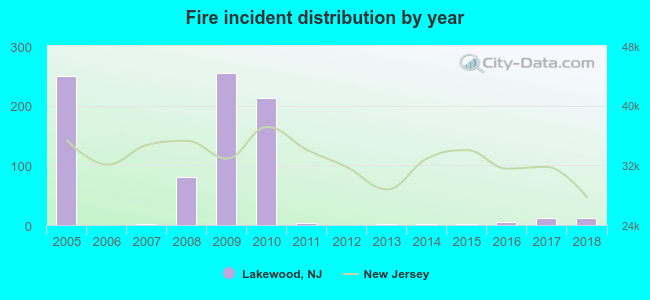 Based on the data from the years 2005 - 2018 the average number of fires per year is 60. The highest number of reported fire incidents - 254 took place in 2009, and the least - 0 in 2006. The data has a decreasing trend.
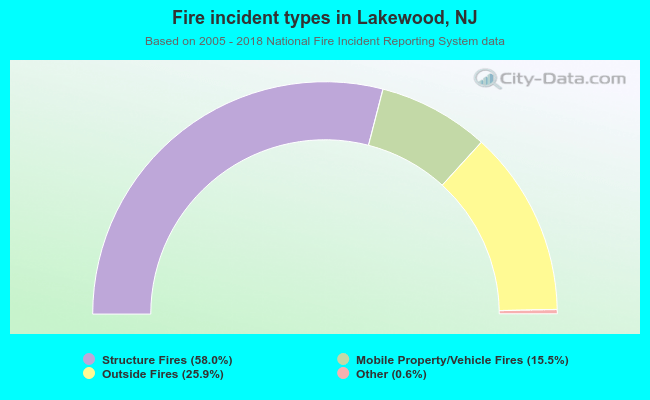 When looking into fire subcategories, the most reports belonged to: Structure Fires (58.0%), and Outside Fires (25.9%).
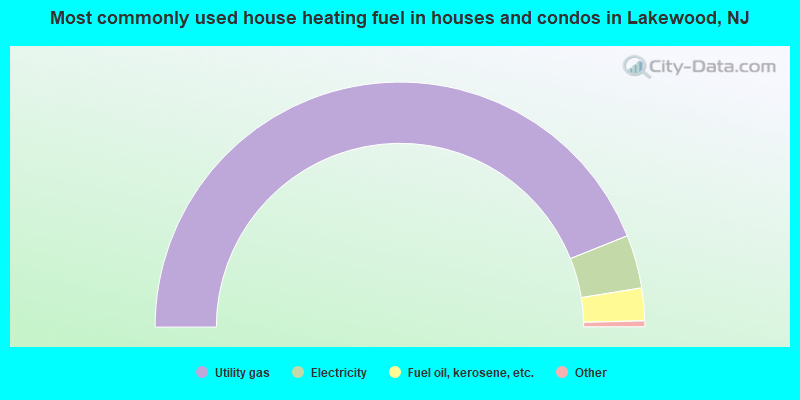
- 87.8%Utility gas
- 7.0%Electricity
- 4.3%Fuel oil, kerosene, etc.
- 0.6%Bottled, tank, or LP gas
- 0.2%Wood
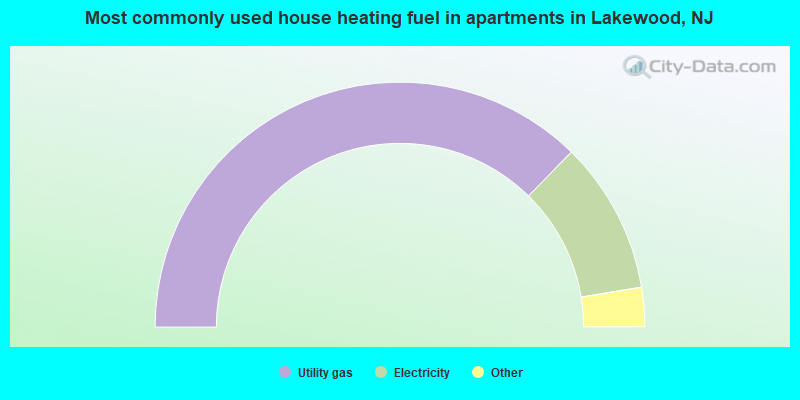
- 74.7%Utility gas
- 20.1%Electricity
- 3.4%Bottled, tank, or LP gas
- 1.6%Fuel oil, kerosene, etc.
- 0.2%No fuel used
Lakewood compared to New Jersey state average:
- Median household income below state average.
- Median house value above state average.
- Unemployed percentage below state average.
- Black race population percentage significantly below state average.
- Median age significantly below state average.
- Renting percentage above state average.
- Length of stay since moving in below state average.
- Number of rooms per house above state average.
- House age significantly below state average.
- Number of college students above state average.
Lakewood on our top lists:
- #1 on the list of "Top 101 cities with largest percentage of females in occupations: education, training, and library occupations (population 50,000+)"
- #1 on the list of "Top 101 cities with the largest percentage of elementary and middle school students in private schools (5,000+ students)"
- #2 on the list of "Top 101 larger cities with the highest increase in house/condo value from 2000 (population 50,000+)"
- #7 on the list of "Top 101 cities with largest percentage of males in industries: construction (population 50,000+)"
- #8 on the list of "Top 101 cities with largest percentage of males in occupations: education, training, and library occupations (population 50,000+)"
- #8 on the list of "Top 101 cities with the largest percentage of elementary and middle school students in private schools (1,000+ students)"
- #9 on the list of "Top 100 cities with highest ratio of median house value to median household income (pop. 50,000+)"
- #10 on the list of "Top 101 cities with largest percentage of males in occupations: community and social service occupations (population 50,000+)"
- #11 on the list of "Top 101 cities with largest percentage of males in occupations: construction and extraction occupations (population 50,000+)"
- #11 on the list of "Top 101 cities with the lowest percentage of single-parent households, population 50,000+"
- #12 on the list of "Top 101 cities with largest percentage of females in occupations: building and grounds cleaning and maintenance occupations (population 50,000+)"
- #16 on the list of "Top 101 cities with largest percentage of females in industries: educational services (population 50,000+)"
- #18 on the list of "Top 100 cities with the largest percentage of males (pop. 50,000+)"
- #23 on the list of "Top 100 cities with youngest residents"
- #23 on the list of "Top 101 cities with largest percentage of males in industries: educational services (population 50,000+)"
- #24 on the list of "Top 101 cities with largest percentage of females in industries: administrative and support and waste management services (population 50,000+)"
- #26 on the list of "Top 101 cities with the highest percentage of workers working at home, population 50,000+"
- #32 on the list of "Top 101 cities with the largest percentage of high school students in private schools (500+ students)"
- #34 on the list of "Top 100 cities with highest percentage of renters (pop. 50,000+)"
- #44 on the list of "Top 101 cities with largest percentage of workers with very short commute times (9 minutes or less) (population 50,000+)"
- #18 (08701) on the list of "Top 101 zip codes with the largest charity contributions deductions as a percentage of AGI in 2012 (pop 5,000+)"
- #22 (08701) on the list of "Top 101 zip codes with the largest percentage of Hungarian first ancestries (pop 5,000+)"
- #10 on the list of "Top 101 counties with the highest percentage of residents that smoked 100+ cigarettes in their lives"
- #12 on the list of "Top 101 counties with the lowest number of infant deaths per 1000 residents 2007-2013 (pop. 50,000+)"
- #16 on the list of "Top 101 counties with the largest increase in the number of births per 1000 residents 2000-2006 to 2007-2013 (pop 50,000+)"
- #21 on the list of "Top 101 counties with the largest number of people without health insurance coverage in 2000 (pop. 50,000+)"
- #23 on the list of "Top 101 counties with the lowest percentage of residents that keep firearms around their homes"

|
|
Total of 126 patent applications in 2008-2024.