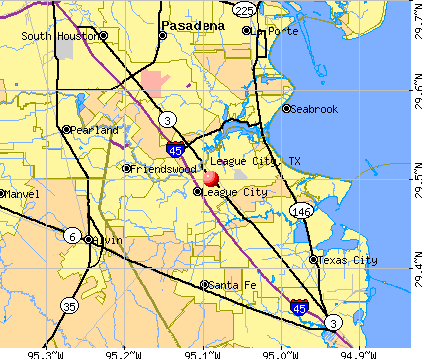
League City, Texas
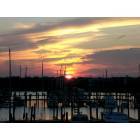
League City: Sunset at the Wharf Marina League City TX
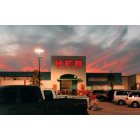
League City: league city, tx: the sun is going down at H E B, shot at bay colony.
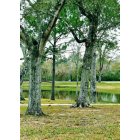
League City: league city, tx: walter hall park
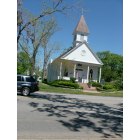
League City: Saint Mary's Church on FM 518

League City: league city, tx: the sun is going down at H E B, shot at bay colony.
League City: pink bird on water
League City: League City from Kemah Bridge 2009
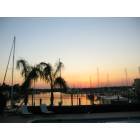
League City: Wharf Marina, Davis Rd., League City
- add
your
Submit your own pictures of this city and show them to the world
- OSM Map
- General Map
- Google Map
- MSN Map
Population change since 2000: +154.0%
| Males: 57,383 | |
| Females: 58,035 |
| Median resident age: | 36.6 years |
| Texas median age: | 35.6 years |
Zip codes: 77573.
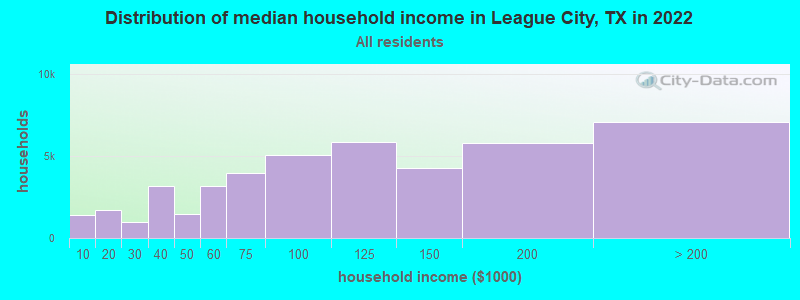
| League City: | $104,867 |
| TX: | $72,284 |
Estimated per capita income in 2022: $46,688 (it was $27,170 in 2000)
League City city income, earnings, and wages data
Estimated median house or condo value in 2022: $350,300 (it was $109,200 in 2000)
| League City: | $350,300 |
| TX: | $275,400 |
Median gross rent in 2022: $1,515.
(3.7% for White Non-Hispanic residents, 9.5% for Black residents, 5.9% for Hispanic or Latino residents, 0.5% for American Indian residents, 12.4% for other race residents, 4.2% for two or more races residents)
Detailed information about poverty and poor residents in League City, TX


Compare current foreclosures in League City, TX:
| Photo | Address | Area | Beds / Baths | Price | Details |
|---|---|---|---|---|---|

|
#1
Andover Hills Ct
League City, TX 77573
|
3,405 sq. feet
|
3 baths - beds |
show details | |

|
#2
Coburn St
League City, TX 77573
|
1,590 sq. feet
|
2 baths - beds |
show details | |

|
#3
Cecina St
League City, TX 77573
|
1,591 sq. feet
|
2 baths 2 beds |
show details | |

|
#4
Crater Lake Drive
League City, TX 77573
|
- sq. feet
|
3 baths 4 beds |
show details | |

|
#5
Lake Landing Dr
League City, TX 77573
|
7,957 sq. feet
|
5 baths 7 beds |
show details | |

|
#6
Knoxville Dr
League City, TX 77573
|
1,000 sq. feet
|
1 baths - beds |
show details | |

|
#7
Pointe Drive
League City, TX 77573
|
1,553 sq. feet
|
2 baths - beds |
show details | |

|
#8
Glen Haven Dr
League City, TX 77573
|
1,358 sq. feet
|
2 baths - beds |
show details | |

|
#9
Meadow Brook Ct
League City, TX 77573
|
1,599 sq. feet
|
2 baths - beds |
show details | |

|
#10
Fir Tree Dr
League City, TX 77573
|
2,426 sq. feet
|
2 baths - beds |
show details |
| Photo | Address | Area | Beds / Baths | Price | Details |
|---|---|---|---|---|---|

|
#11
Crater Lake Dr
League City, TX 77573
|
2,868 sq. feet
|
3 baths - beds |
show details | |

|
#12
Saturnia Ln
League City, TX 77573
|
1,771 sq. feet
|
2 baths - beds |
show details | |

|
#13
2nd St
League City, TX 77573
|
1,244 sq. feet
|
2 baths - beds |
show details | |

|
#14
Lake Point Dr
League City, TX 77573
|
2,150 sq. feet
|
2 baths - beds |
show details | |

|
#15
S Illinois Ave
League City, TX 77573
|
1,372 sq. feet
|
2 baths - beds |
show details | |

|
#16
Misty Shore Dr
League City, TX 77573
|
2,410 sq. feet
|
2 baths - beds |
show details | |

|
#17
Porta Rosa Ln
League City, TX 77573
|
4,029 sq. feet
|
3 baths - beds |
show details | |

|
#18
Brookdale Dr
League City, TX 77573
|
1,664 sq. feet
|
2 baths - beds |
show details | |

|
#19
Concordia Ct
League City, TX 77573
|
3,731 sq. feet
|
4 baths - beds |
show details | |

|
#20
Winecup Ln
League City, TX 77573
|
3,088 sq. feet
|
2 baths - beds |
show details |
| Photo | Address | Area | Beds / Baths | Price | Details |
|---|---|---|---|---|---|

|
#21
Jackson Ln
League City, TX 77573
|
2,372 sq. feet
|
2 baths - beds |
show details | |

|
#22
Grand Creek Dr
League City, TX 77573
|
2,978 sq. feet
|
2 baths - beds |
show details | |

|
#23
Knoxville Dr
League City, TX 77573
|
1,496 sq. feet
|
2 baths - beds |
show details | |

|
#24
W Wilkins St
League City, TX 77573
|
1,170 sq. feet
|
1 baths - beds |
show details | |

|
#25
Cambria Ct
League City, TX 77573
|
3,251 sq. feet
|
3 baths - beds |
show details | |

|
#26
Catamaran Dr
League City, TX 77573
|
2,657 sq. feet
|
2 baths - beds |
show details | |

|
#27
Whitehall Cir
League City, TX 77573
|
3,606 sq. feet
|
3 baths - beds |
show details | |

|
#28
Royal Oaks Dr
League City, TX 77573
|
2,296 sq. feet
|
2 baths - beds |
show details | |

|
#29
Mango Ct
League City, TX 77573
|
3,301 sq. feet
|
2 baths - beds |
show details | |

|
#30
Lazy Hollow Dr
League City, TX 77573
|
1,032 sq. feet
|
2 baths - beds |
show details |
| Photo | Address | Area | Beds / Baths | Price | Details |
|---|---|---|---|---|---|

|
#31
Lomelina Ln
League City, TX 77573
|
2,002 sq. feet
|
2 baths - beds |
show details | |

|
#32
Golden Sails Dr
League City, TX 77573
|
2,383 sq. feet
|
2 baths - beds |
show details | |

|
#33
Afton Ct
League City, TX 77573
|
1,106 sq. feet
|
1 baths - beds |
show details | |

|
#34
Rock Brook Falls Ln
League City, TX 77573
|
2,029 sq. feet
|
2 baths - beds |
show details | |

|
#35
E Walker St
League City, TX 77573
|
1,574 sq. feet
|
1 baths - beds |
show details | |

|
#36
White Oak Pointe
League City, TX 77573
|
3,125 sq. feet
|
2 baths - beds |
show details | |

|
#37
Royal Oaks Dr
League City, TX 77573
|
2,188 sq. feet
|
2 baths - beds |
show details | |

|
#38
Meadow Bend St
League City, TX 77573
|
1,210 sq. feet
|
2 baths - beds |
show details | |

|
#39
Ceole Ln
League City, TX 77573
|
2,193 sq. feet
|
2 baths - beds |
show details | |

|
#40
Bella Luna Ln
League City, TX 77573
|
4,572 sq. feet
|
4 baths - beds |
show details |
| Photo | Address | Area | Beds / Baths | Price | Details |
|---|---|---|---|---|---|

|
#41
Cedar Branch Dr
League City, TX 77573
|
1,780 sq. feet
|
2 baths - beds |
show details | |

|
#42
Leisure Ln
League City, TX 77573
|
2,025 sq. feet
|
2 baths - beds |
show details | |

|
#43
Kingsway Dr
League City, TX 77573
|
1,350 sq. feet
|
2 baths - beds |
show details | |

|
#44
Old Oaks St
League City, TX 77573
|
1,765 sq. feet
|
2 baths - beds |
show details | |

|
#45
Coburn St
League City, TX 77573
|
1,406 sq. feet
|
2 baths - beds |
show details | |

|
#46
W Saunders St
League City, TX 77573
|
- sq. feet
|
- baths - beds |
show details | |

|
#47
Carlisle Ln
League City, TX 77573
|
- sq. feet
|
- baths - beds |
show details | |

|
#48
Elmore St
League City, TX 77573
|
- sq. feet
|
- baths - beds |
show details | |

|
#49
Trocadero Ln
League City, TX 77573
|
- sq. feet
|
- baths - beds |
show details | |

|
Check over 1 million property listings on Foreclosure.com!
|
browse all offers | |||


- 70,43459.4%White alone
- 26,47822.3%Hispanic
- 9,0437.6%Asian alone
- 7,7076.5%Black alone
- 3,5913.0%Two or more races
- 1,1751.0%Other race alone
- 1220.1%American Indian alone
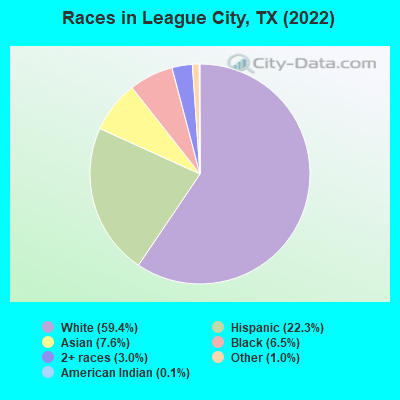
Races in League City detailed stats: ancestries, foreign born residents, place of birth
According to our research of Texas and other state lists, there were 40 registered sex offenders living in League City, Texas as of June 16, 2024.
The ratio of all residents to sex offenders in League City is 2,487 to 1.
The ratio of registered sex offenders to all residents in this city is much lower than the state average.
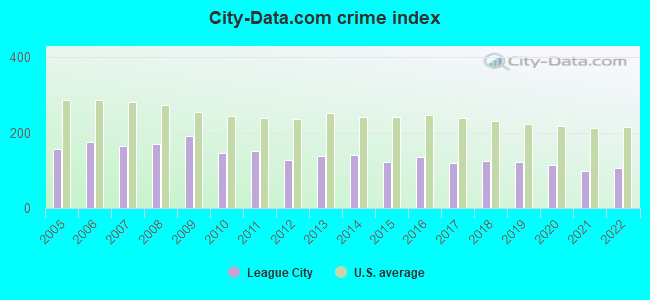
The City-Data.com crime index weighs serious crimes and violent crimes more heavily. Higher means more crime, U.S. average is 246.1. It adjusts for the number of visitors and daily workers commuting into cities.
- means the value is smaller than the state average.- means the value is about the same as the state average.
- means the value is bigger than the state average.
Crime rate in League City detailed stats: murders, rapes, robberies, assaults, burglaries, thefts, arson
Full-time law enforcement employees in 2021, including police officers: 170 (125 officers - 109 male; 16 female).
| Officers per 1,000 residents here: | 1.12 |
| Texas average: | 2.07 |
 Recent articles from our blog. Our writers, many of them Ph.D. graduates or candidates, create easy-to-read articles on a wide variety of topics.

 | Home buying - Friendswood or Clear lake? (32 replies) |
| Californian Needs Help League City Magnolia Creek (21 replies) |
| AAU Boys Team for 14U in League City o near to League City, Tx (1 reply) |
| League City — The Meadows Flooding? (6 replies) |
| Magnolia Creek/League City (9 replies) |
| League City TX (6 replies) |
Latest news from League City, TX collected exclusively by city-data.com from local newspapers, TV, and radio stations
Ancestries: German (10.8%), American (8.7%), English (8.4%), European (5.1%), Irish (3.9%), Italian (3.0%).
Current Local Time: CST time zone
Elevation: 23 feet
Land area: 51.2 square miles.
Population density: 2,252 people per square mile (low).
13,998 residents are foreign born (4.8% Latin America, 4.4% Asia).
| This city: | 12.1% |
| Texas: | 17.1% |
Median real estate property taxes paid for housing units with mortgages in 2022: $6,513 (1.8%)
Median real estate property taxes paid for housing units with no mortgage in 2022: $4,840 (1.7%)
Nearest city with pop. 50,000+: Southeast Harris, TX (10.8 miles  , pop. 82,015).
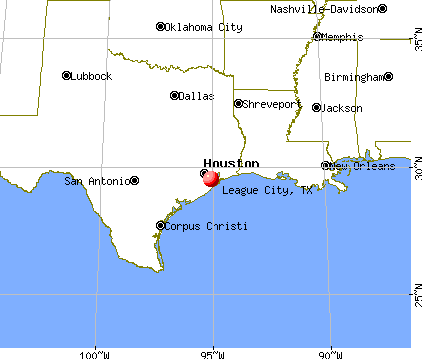
Nearest city with pop. 200,000+: Houston, TX (25.3 miles , pop. 1,953,631).
Nearest cities:
), Latitude: 29.50 N, Longitude: 95.09 W
Daytime population change due to commuting: -27,009 (-22.8%)
Workers who live and work in this city: 17,918 (30.1%)
Area codes: 281, 832, 713
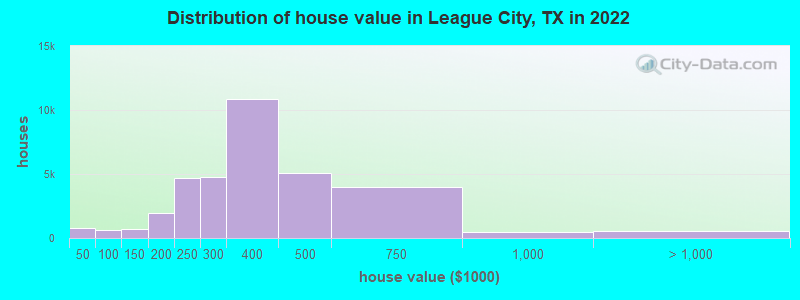
Property values in League City, TX

League City, Texas accommodation & food services, waste management - Economy and Business Data
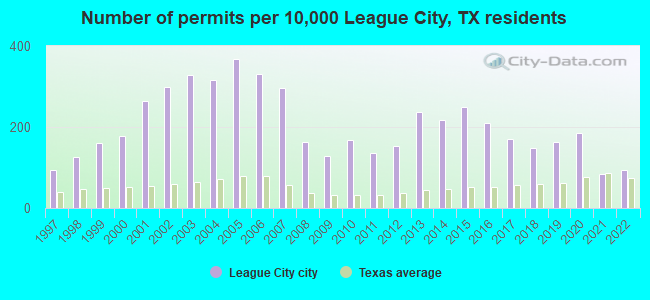
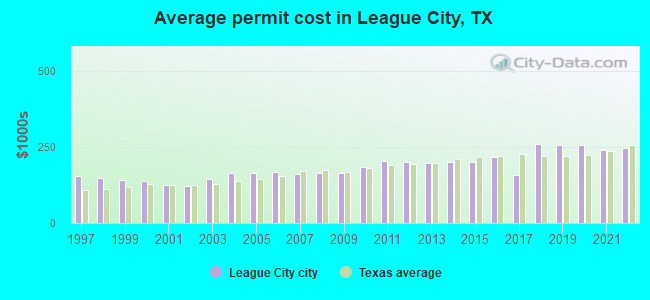
Single-family new house construction building permits:
- 2022: 427 buildings, average cost: $246,300
- 2021: 388 buildings, average cost: $239,200
- 2020: 847 buildings, average cost: $256,600
- 2019: 742 buildings, average cost: $256,100
- 2018: 679 buildings, average cost: $258,400
- 2017: 776 buildings, average cost: $156,400
- 2016: 955 buildings, average cost: $216,900
- 2015: 1135 buildings, average cost: $201,200
- 2014: 990 buildings, average cost: $199,900
- 2013: 1080 buildings, average cost: $198,100
- 2012: 696 buildings, average cost: $199,000
- 2011: 613 buildings, average cost: $204,100
- 2010: 770 buildings, average cost: $185,300
- 2009: 584 buildings, average cost: $162,900
- 2008: 735 buildings, average cost: $163,200
- 2007: 1345 buildings, average cost: $161,700
- 2006: 1510 buildings, average cost: $167,800
- 2005: 1676 buildings, average cost: $162,800
- 2004: 1437 buildings, average cost: $164,300
- 2003: 1494 buildings, average cost: $144,000
- 2002: 1356 buildings, average cost: $120,200
- 2001: 1201 buildings, average cost: $122,600
- 2000: 813 buildings, average cost: $137,600
- 1999: 728 buildings, average cost: $140,900
- 1998: 574 buildings, average cost: $146,700
- 1997: 425 buildings, average cost: $154,100
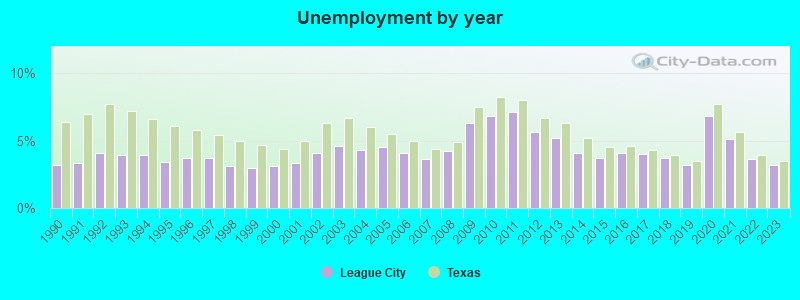
| Here: | 3.2% |
| Texas: | 3.5% |
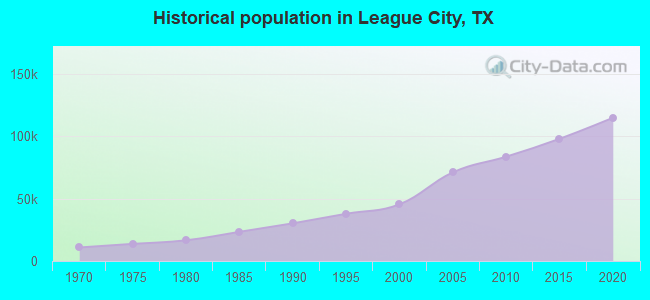
Population change in the 1990s: +15,409 (+51.3%).
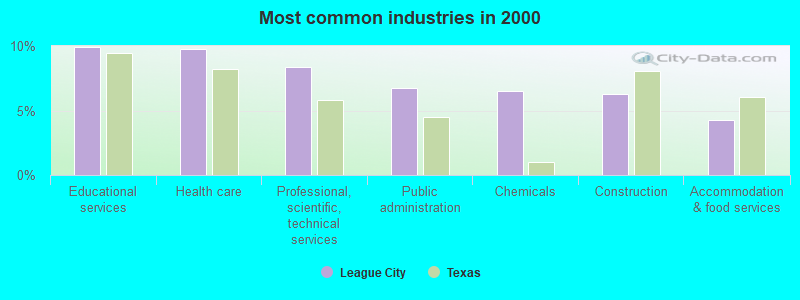
- Educational services (10.0%)
- Health care (9.8%)
- Professional, scientific, technical services (8.4%)
- Public administration (6.7%)
- Chemicals (6.5%)
- Construction (6.3%)
- Accommodation & food services (4.3%)
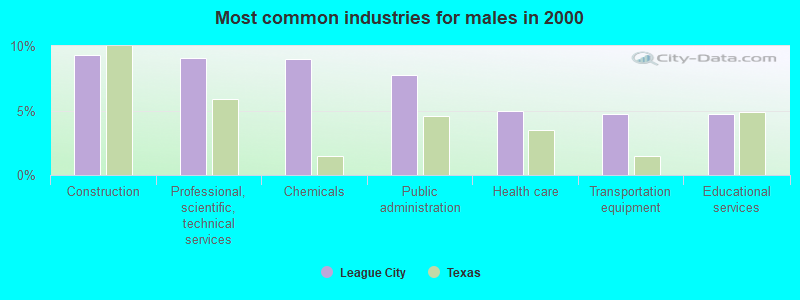
- Construction (9.3%)
- Professional, scientific, technical services (9.0%)
- Chemicals (9.0%)
- Public administration (7.8%)
- Health care (4.9%)
- Transportation equipment (4.7%)
- Educational services (4.7%)
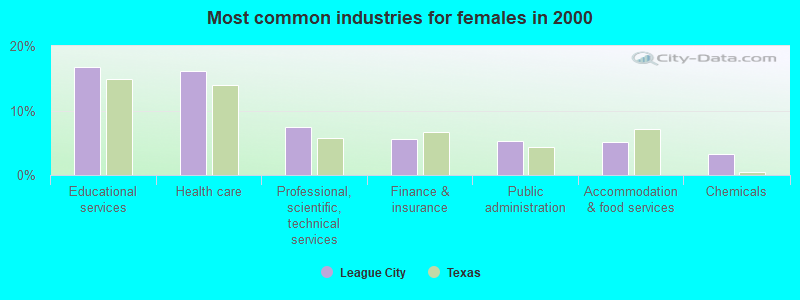
- Educational services (16.8%)
- Health care (16.1%)
- Professional, scientific, technical services (7.5%)
- Finance & insurance (5.5%)
- Public administration (5.3%)
- Accommodation & food services (5.2%)
- Chemicals (3.2%)
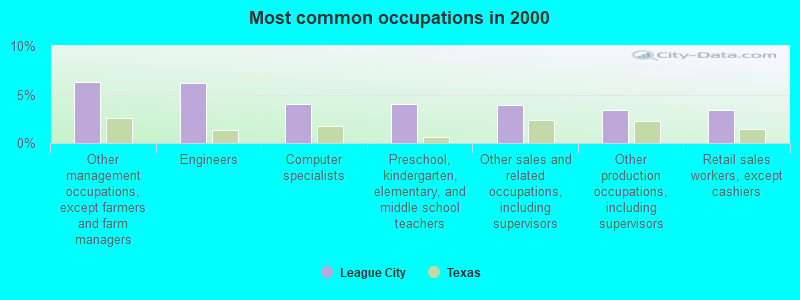
- Other management occupations, except farmers and farm managers (6.3%)
- Engineers (6.2%)
- Computer specialists (4.0%)
- Preschool, kindergarten, elementary, and middle school teachers (4.0%)
- Other sales and related occupations, including supervisors (3.9%)
- Other production occupations, including supervisors (3.4%)
- Retail sales workers, except cashiers (3.4%)
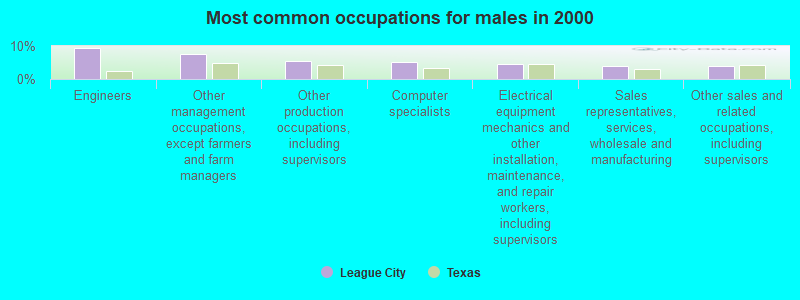
- Engineers (9.2%)
- Other management occupations, except farmers and farm managers (7.5%)
- Other production occupations, including supervisors (5.4%)
- Computer specialists (5.2%)
- Electrical equipment mechanics and other installation, maintenance, and repair workers, including supervisors (4.6%)
- Sales representatives, services, wholesale and manufacturing (3.9%)
- Other sales and related occupations, including supervisors (3.8%)
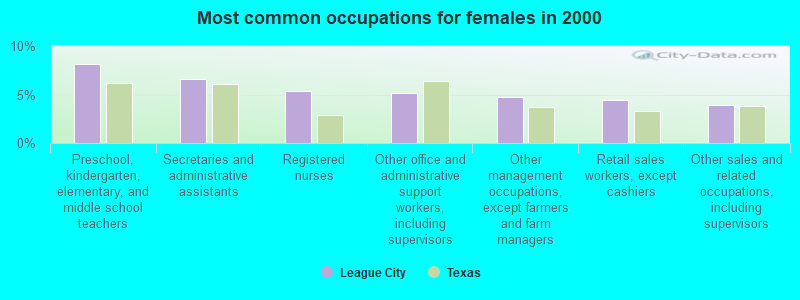
- Preschool, kindergarten, elementary, and middle school teachers (8.2%)
- Secretaries and administrative assistants (6.6%)
- Registered nurses (5.4%)
- Other office and administrative support workers, including supervisors (5.2%)
- Other management occupations, except farmers and farm managers (4.8%)
- Retail sales workers, except cashiers (4.4%)
- Other sales and related occupations, including supervisors (3.9%)
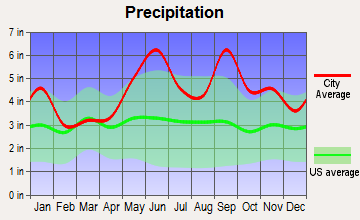
Average climate in League City, Texas
Based on data reported by over 4,000 weather stations


|
|

(lower is better)
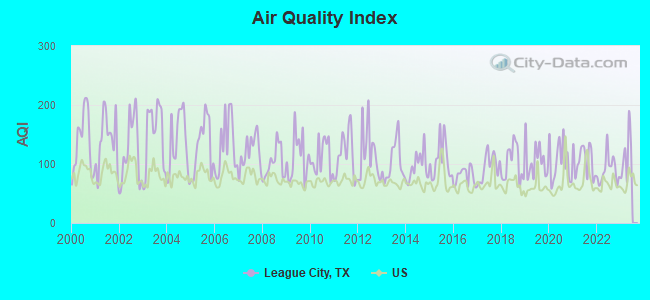
Air Quality Index (AQI) level in 2022 was 90.0. This is worse than average.
| City: | 90.0 |
| U.S.: | 72.6 |
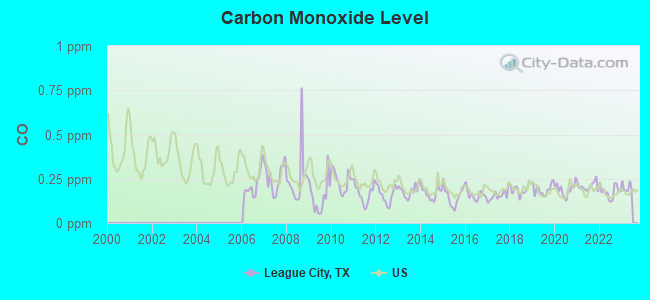
Carbon Monoxide (CO) [ppm] level in 2022 was 0.177. This is significantly better than average. Closest monitor was 6.7 miles away from the city center.
| City: | 0.177 |
| U.S.: | 0.251 |
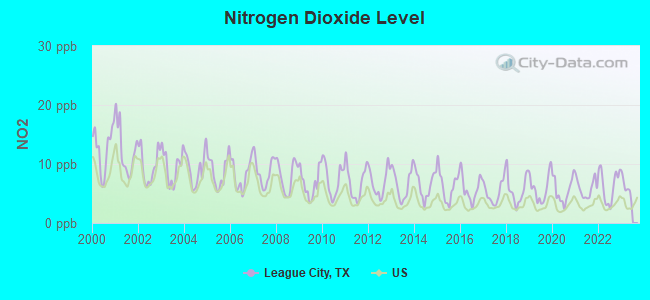
Nitrogen Dioxide (NO2) [ppb] level in 2022 was 6.31. This is worse than average. Closest monitor was 2.1 miles away from the city center.
| City: | 6.31 |
| U.S.: | 5.11 |
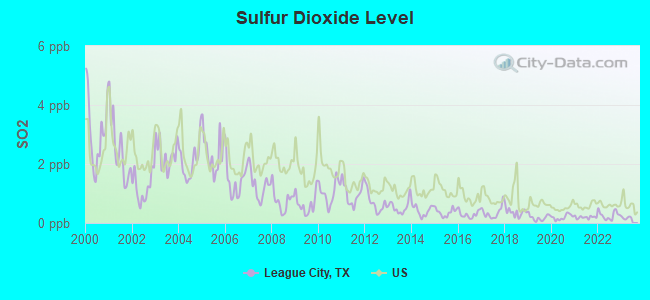
Sulfur Dioxide (SO2) [ppb] level in 2022 was 0.262. This is significantly better than average. Closest monitor was 2.1 miles away from the city center.
| City: | 0.262 |
| U.S.: | 1.515 |
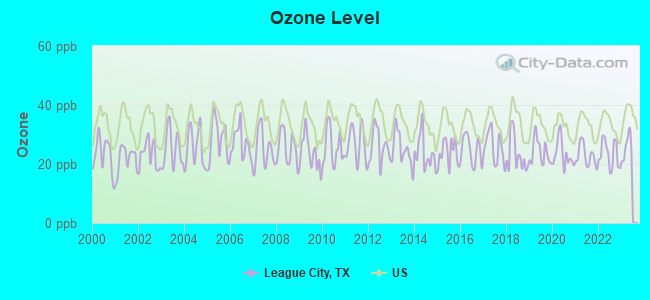
Ozone [ppb] level in 2022 was 23.4. This is significantly better than average. Closest monitor was 6.7 miles away from the city center.
| City: | 23.4 |
| U.S.: | 33.3 |
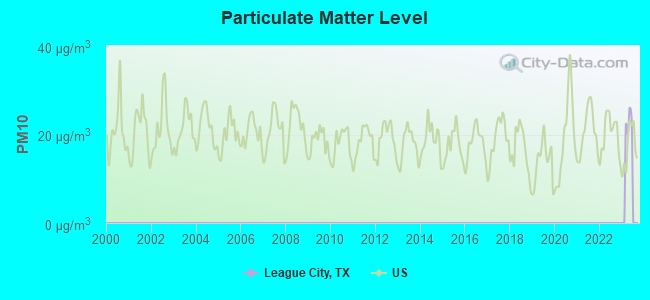
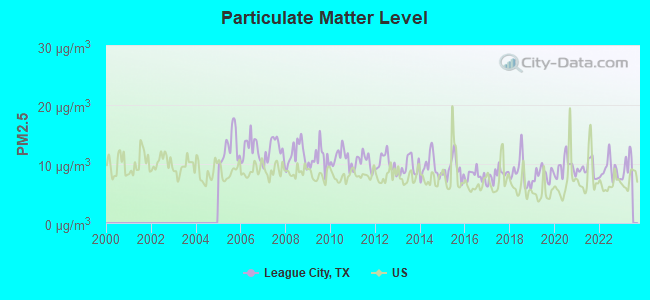
Particulate Matter (PM2.5) [µg/m3] level in 2022 was 8.95. This is about average. Closest monitor was 0.9 miles away from the city center.
| City: | 8.95 |
| U.S.: | 8.11 |
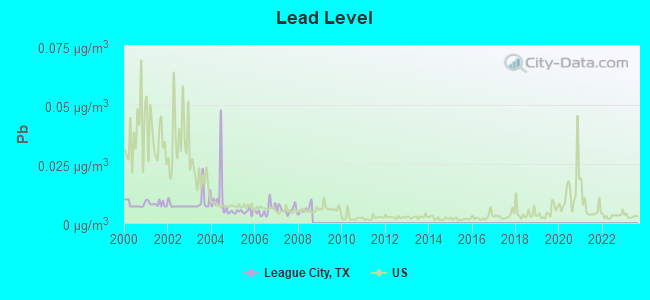
Lead (Pb) [µg/m3] level in 2008 was 0.00590. This is significantly better than average. Closest monitor was 0.9 miles away from the city center.
| City: | 0.00590 |
| U.S.: | 0.00931 |
Tornado activity:
League City-area historical tornado activity is slightly above Texas state average. It is 72% greater than the overall U.S. average.
On 11/21/1992, a category F4 (max. wind speeds 207-260 mph) tornado 19.6 miles away from the League City city center injured 16 people and caused between $50,000,000 and $500,000,000 in damages.
On 9/12/1961, a category F4 tornado 22.4 miles away from the city center killed 8 people and injured 200 people.
Earthquake activity:
League City-area historical earthquake activity is significantly above Texas state average. It is 41% smaller than the overall U.S. average.On 5/17/2012 at 08:12:00, a magnitude 4.8 (4.8 MW, Depth: 3.1 mi, Class: Light, Intensity: IV - V) earthquake occurred 173.2 miles away from League City center
On 10/20/2011 at 12:24:41, a magnitude 4.8 (4.8 MW, Depth: 3.1 mi) earthquake occurred 185.8 miles away from League City center
On 9/2/2013 at 23:51:15, a magnitude 4.3 (4.3 MW, Depth: 2.9 mi) earthquake occurred 171.3 miles away from the city center
On 4/9/1993 at 12:29:19, a magnitude 4.3 (4.1 MB, 4.3 LG, Depth: 3.1 mi) earthquake occurred 189.4 miles away from League City center
On 9/2/2013 at 21:52:38, a magnitude 4.2 (4.2 MW, Depth: 3.0 mi) earthquake occurred 173.8 miles away from the city center
On 1/25/2013 at 07:01:19, a magnitude 4.1 (4.1 MB, Depth: 3.1 mi) earthquake occurred 168.8 miles away from the city center
Magnitude types: regional Lg-wave magnitude (LG), body-wave magnitude (MB), moment magnitude (MW)
Natural disasters:
The number of natural disasters in Galveston County (23) is greater than the US average (15).Major Disasters (Presidential) Declared: 14
Emergencies Declared: 7
Causes of natural disasters: Hurricanes: 11, Storms: 7, Floods: 6, Fires: 2, Tornadoes: 2, Tropical Storms: 2, Flash Flood: 1, Wind: 1, Other: 1 (Note: some incidents may be assigned to more than one category).

Main business address for: EAGLE BROADBAND INC (WATER, SEWER, PIPELINE, COMM AND POWER LINE CONSTRUCTION), AMERICAN HOMESTAR CORP (PREFABRICATED WOOD BLDGS & COMPONENTS).
Hospitals in League City:
- DEVEREUX TEXAS TREATMENT NETWORK (1150 DEVEREUX DR)
- HEALTH TOUCH HOSPICE (2525 SOUTH SHORE HARBOR BLVD #102)
- REGENCY HOSPICE (1100 GULF FREEWAY SUITE 122)
Nursing Homes in League City:
- BAYWIND VILLAGE CONVALESCENT CENTER (411 ALABAMA AVE)
- BAYWIND VILLAGE CONVALESCENT CTR (411 ALABAMA)
- HARBOURVIEW CARE CENTER (300 ENTERPRISE AVE)
- REGENT CARE CENTER OF LEAGUE CITY (2620 W WALKER)
Dialysis Facilities in League City:
Home Health Centers in League City:
Heliports located in League City:
Colleges/universities with over 2000 students nearest to League City:
- University of Houston-Clear Lake (about 6 miles; Houston, TX; Full-time enrollment: 5,833)
- College of the Mainland (about 10 miles; Texas City, TX; FT enrollment: 2,739)
- San Jacinto Community College (about 12 miles; Pasadena, TX; FT enrollment: 13,517)
- Alvin Community College (about 12 miles; Alvin, TX; FT enrollment: 3,953)
- Lee College (about 18 miles; Baytown, TX; FT enrollment: 4,278)
- University of Houston (about 22 miles; Houston, TX; FT enrollment: 31,888)
- Texas Southern University (about 23 miles; Houston, TX; FT enrollment: 7,053)
Public high schools in League City:
- CLEAR CREEK H S (Students: 2,460, Location: 2305 E MAIN ST, Grades: 9-12)
- CLEAR SPRINGS H S (Students: 2,452, Location: 501 PALAMINO LN, Grades: 9-12)
- ED WHITE MEMORIAL H S (Students: 84, Location: 218 E MAIN ST, Grades: 9-12, Charter school)
- CLEAR PATH ALTERNATIVE SCHOOL (Students: 47, Location: 400 S KANSAS, Grades: 6-12)
- CLEAR FALLS H S (Location: 4380 VILLAGE WAY, Grades: 9-12)
Private high schools in League City:
Biggest public elementary/middle schools in League City:
- VICTORY LAKES INT (Students: 1,019, Location: 2880 W WALKER, Grades: 6-8)
- DARWIN L GILMORE EL (Students: 888, Location: 3552 BRITTANY BAY BLVD, Grades: PK-5)
- CREEKSIDE INT (Students: 809, Location: 4320 W MAIN ST, Grades: 6-8)
- CLEAR CREEK INT (Students: 776, Location: 2451 E MAIN ST, Grades: 6-8)
- LEAGUE CITY INT (Students: 735, Location: 2588 WEBSTER, Grades: 6-8)
- LLOYD R FERGUSON EL (Students: 729, Location: 1910 COMPASS ROSE BLVD, Grades: PK-5)
- HENRY BAUERSCHLAG EL (Students: 702, Location: 2051 BRITTANY BAY BLVD, Grades: PK-5)
- SANDRA MOSSMAN EL (Students: 697, Location: 4050 VILLAGE WAY, Grades: PK-5)
- RALPH PARR EL (Students: 694, Location: 1315 HWY 3 S, Grades: PK-5)
- JAMES H ROSS EL (Students: 677, Location: 2401 W MAIN ST, Grades: PK-5)
Private elementary/middle schools in League City:
Library in League City:
User-submitted facts and corrections:
- Thanks in advance for updating the information/link to Christus Victor Lutheran Church & Childrens School; our URL is http://www.christusvictor.us
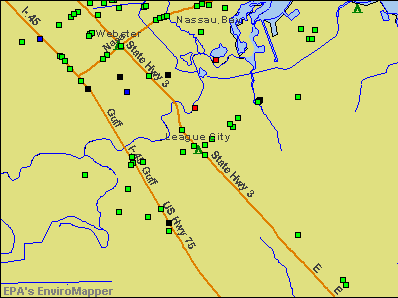
Points of interest:
Notable locations in League City: Waterford Harbor Yacht Club Marina (A), South Shore Harbour Marina (B), The Wharf Marina (C), Marina del Sol (D), Shell (E), League City Volunteer Fire Department Central Station 1 (F), League City Volunteer Fire Department Station 3 (G), League City Police Department (H), Helen Hall Library (I), League City Civic Center (J), League City Hall (K), League City Volunteer Fire Department Station 4 (L), League City Volunteer Fire Department Station 2 (M), League City Volunteer Fire Department Station 5 (N). Display/hide their locations on the map
Shopping Center: League City Plaza Shopping Center (1). Display/hide its location on the map
Main business address in League City include: EAGLE BROADBAND INC (A), AMERICAN HOMESTAR CORP (B). Display/hide their locations on the map
Churches in League City include: Grace Independent Baptist Church (A), Concord Missionary Baptist Church (B), Faith Temple Assembly of God Church (C), League City United Methodist Church (D), Christus Victor Lutheran Church (E), League City Church of Christ (F), Faith Fellowship Church (G), Clear Creek Community Church (H). Display/hide their locations on the map
Cemeteries: Fairview Cemetery (1), Magnolia Cemetery (2). Display/hide their locations on the map
Lake: Willow Pond (A). Display/hide its location on the map
Streams, rivers, and creeks: Robinson Bayou (A), Magnolia Creek (B). Display/hide their locations on the map
Parks in League City include: Galveston County Park (1), Creekside Intermediate School Football Field (2), Clear Creek District Stadium (3), Bay Area Christian School Football Field (4), Bay Area Christian School Baseball Field (5), Challenger 7 Memorial Park (6). Display/hide their locations on the map
Tourist attraction: Bates Motor Home Rental Network of Houston (Recreational Trips & Guides; 2500 West Main Suite G-18) (1). Display/hide its approximate location on the map
Hotel: Best Western NASA Inn (889 Bay Area Boulevard) (1). Display/hide its approximate location on the map
Birthplace of: Chase Ortiz - Player of and football, Chris Hairfield - College basketball player (Texas Arlington Mavericks), Jarred Cosart - Baseball player.
Drinking water stations with addresses in League City and their reported violations in the past:
MINI EXPRESS (Population served: 299, Groundwater):Past health violations:Past monitoring violations:
- MCL, Monthly (TCR) - In SEP-2013, Contaminant: Coliform. Follow-up actions: St Public Notif requested (OCT-02-2013), St Violation/Reminder Notice (OCT-02-2013), St Public Notif received (OCT-28-2013)
- Monitoring, Repeat Major (TCR) - In SEP-2012, Contaminant: Coliform (TCR). Follow-up actions: St Public Notif requested (NOV-27-2012), St Violation/Reminder Notice (NOV-27-2012), St Formal NOV issued (JAN-03-2013), St AO (w/penalty) issued (AUG-08-2013)
- Monitoring, Source Water (GWR) - In SEP-01-2012, Contaminant: E. COLI. Follow-up actions: St Public Notif requested (DEC-04-2012), St Violation/Reminder Notice (DEC-04-2012), St Compliance achieved (JAN-09-2013)
- Monitoring, Source Water (GWR) - In AUG-01-2012, Contaminant: E. COLI. Follow-up actions: St Public Notif requested (OCT-31-2012), St Violation/Reminder Notice (OCT-31-2012), St Compliance achieved (DEC-18-2012)
- Monitoring, Repeat Major (TCR) - In AUG-2012, Contaminant: Coliform (TCR). Follow-up actions: St Public Notif requested (OCT-23-2012), St Violation/Reminder Notice (OCT-23-2012), St Formal NOV issued (JAN-03-2013), St AO (w/penalty) issued (AUG-08-2013)
- 5 routine major monitoring violations
- One minor monitoring violation
Drinking water stations with addresses in League City that have no violations reported:
- NEW BEGINNING MINISTRIES (Population served: 50, Primary Water Source Type: Groundwater)
| This city: | 2.8 people |
| Texas: | 2.8 people |
| This city: | 74.7% |
| Whole state: | 69.9% |
| This city: | 5.4% |
| Whole state: | 6.0% |
Likely homosexual households (counted as self-reported same-sex unmarried-partner households)
- Lesbian couples: 0.4% of all households
- Gay men: 0.3% of all households
103 people in residential treatment centers for juveniles (non-correctional) in 2010
People in group quarters in League City in 2000:
- 261 people in nursing homes
- 84 people in training schools for juvenile delinquents
- 16 people in other noninstitutional group quarters
- 12 people in hospitals/wards and hospices for chronically ill
- 12 people in hospices or homes for chronically ill
- 11 people in homes for the mentally retarded
- 5 people in other group homes
Banks with most branches in League City (2011 data):
- Amegy Bank National Association: South Shore Branch, League City West Branch, League City Historic Dist. Drive In, League City Historic District Branch. Info updated 2007/09/24: Bank assets: $12,197.6 mil, Deposits: $9,733.2 mil, headquarters in Houston, TX, positive income, Commercial Lending Specialization, 97 total offices, Holding Company: Zions Bancorporation
- Wells Fargo Bank, National Association: South Shore Harbor Branch, Bay Colony Branch, Victory Lakes Branch, League City Branch. Info updated 2011/04/05: Bank assets: $1,161,490.0 mil, Deposits: $905,653.0 mil, headquarters in Sioux Falls, SD, positive income, 6395 total offices, Holding Company: Wells Fargo & Company
- JPMorgan Chase Bank, National Association: South Shore Harbor Banking Center, League City Branch, Bay Colony Banking Center Branch. Info updated 2011/11/10: Bank assets: $1,811,678.0 mil, Deposits: $1,190,738.0 mil, headquarters in Columbus, OH, positive income, International Specialization, 5577 total offices, Holding Company: Jpmorgan Chase & Co.
- The Moody National Bank: West League City Banking Center at 2670 West Main, branch established on 1994/10/17; South Shore Banking Center at 2901 South Shore Boulevard, branch established on 1985/10/08. Info updated 2006/11/03: Bank assets: $856.2 mil, Deposits: $712.3 mil, headquarters in Galveston, TX, positive income, Commercial Lending Specialization, 21 total offices, Holding Company: Moody Bancshares, Inc.
- Woodforest National Bank: League City Wal-Mart Branch at 1701 West Fm 646, branch established on 2006/07/10. Info updated 2011/05/10: Bank assets: $3,488.9 mil, Deposits: $3,097.6 mil, headquarters in Houston, TX, positive income, Commercial Lending Specialization, 766 total offices, Holding Company: Woodforest Financial Group Employee Stock Ownership Plan (With 401(K) Provisions)
- Capital One, National Association: League City Banking Office Branch at 231 S. Fm 270, branch established on 2004/06/28. Info updated 2011/07/01: Bank assets: $133,477.8 mil, Deposits: $97,063.7 mil, headquarters in Mclean, VA, positive income, 984 total offices, Holding Company: Capital One Financial Corporation
- Regions Bank: League City Branch at 2051 West Main, branch established on 1979/07/02. Info updated 2011/02/24: Bank assets: $123,368.2 mil, Deposits: $98,301.3 mil, headquarters in Birmingham, AL, positive income, Commercial Lending Specialization, 1778 total offices, Holding Company: Regions Financial Corporation
- International Bank of Commerce: Dickenson Branch at 2304 West Fm 646, branch established on 2005/09/06. Info updated 2007/03/28: Bank assets: $9,621.9 mil, Deposits: $6,548.8 mil, headquarters in Laredo, TX, positive income, Commercial Lending Specialization, 197 total offices, Holding Company: International Bancshares Corporation
- Texas First Bank: League City Branch at 111 South Hwy 3, branch established on 1998/02/20. Info updated 2011/05/16: Bank assets: $692.5 mil, Deposits: $616.8 mil, headquarters in Texas City, TX, positive income, Commercial Lending Specialization, 20 total offices, Holding Company: Texas Independent Bancshares, Inc.
- 3 other banks with 3 local branches
For population 15 years and over in League City:
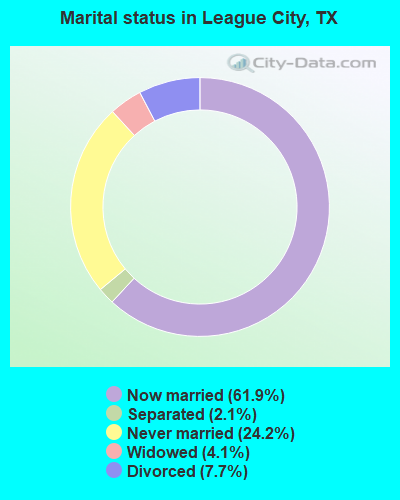
- Never married: 24.2%
- Now married: 61.9%
- Separated: 2.1%
- Widowed: 4.1%
- Divorced: 7.7%
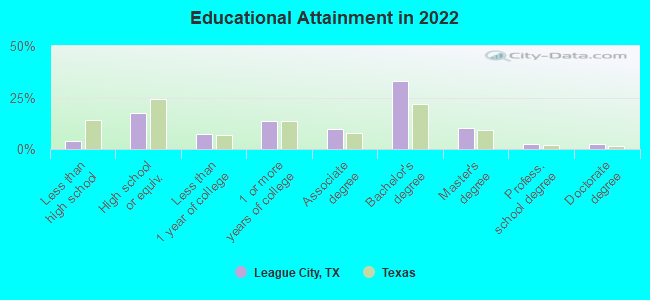
For population 25 years and over in League City:
- High school or higher: 96.1%
- Bachelor's degree or higher: 47.7%
- Graduate or professional degree: 14.7%
- Unemployed: 3.6%
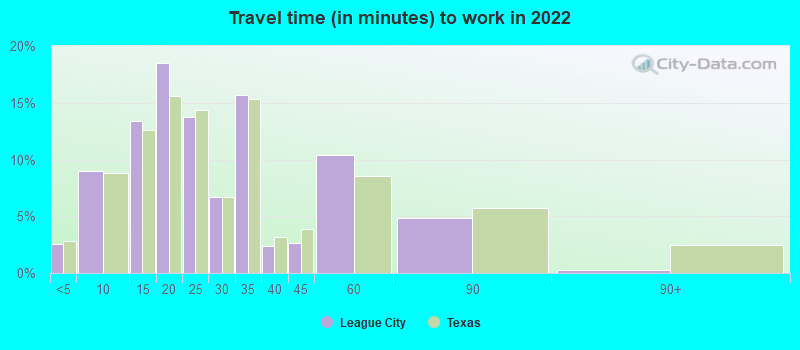
- Mean travel time to work (commute): 25.0 minutes
| Here: | 10.5 |
| Texas average: | 14.0 |
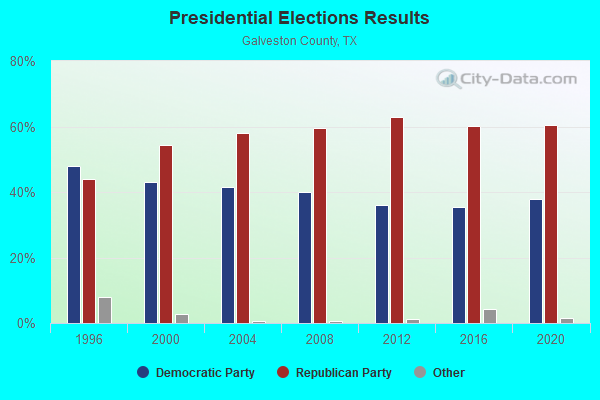
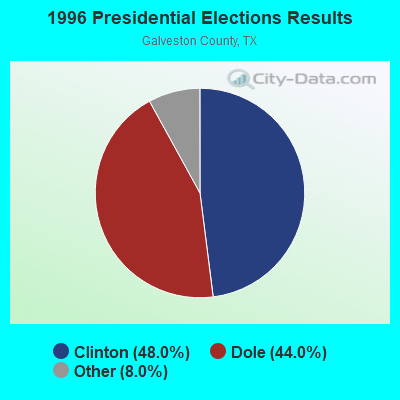
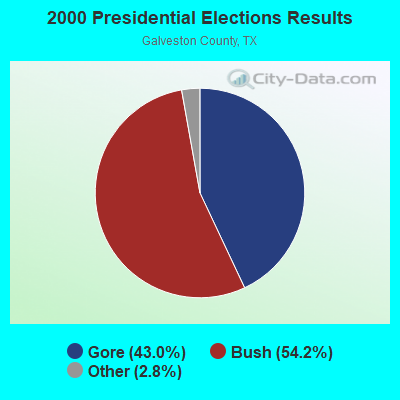
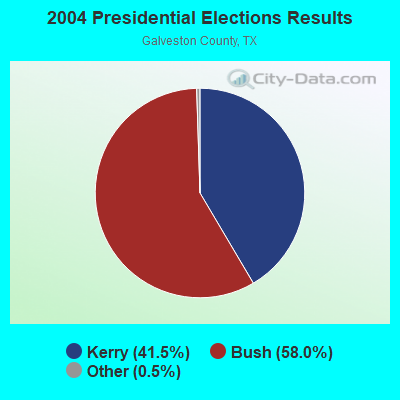
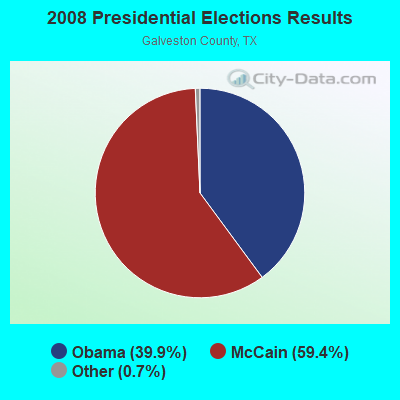
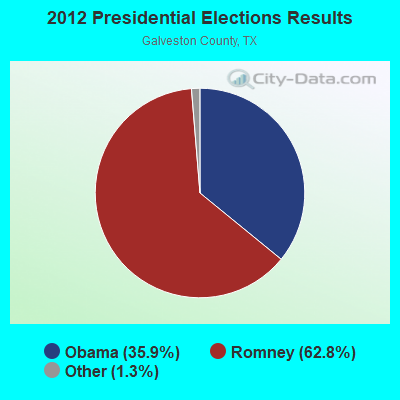
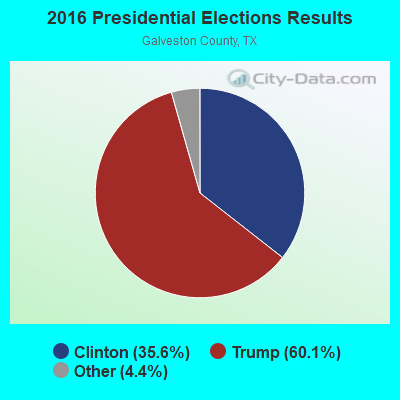
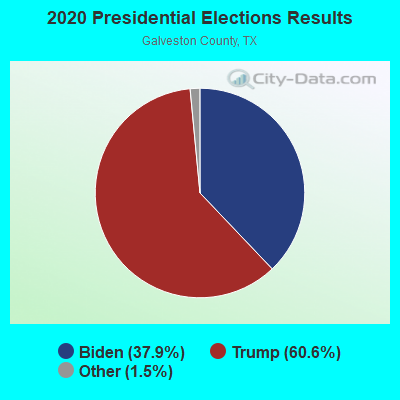
Graphs represent county-level data. Detailed 2008 Election Results
Religion statistics for League City, TX (based on Galveston County data)
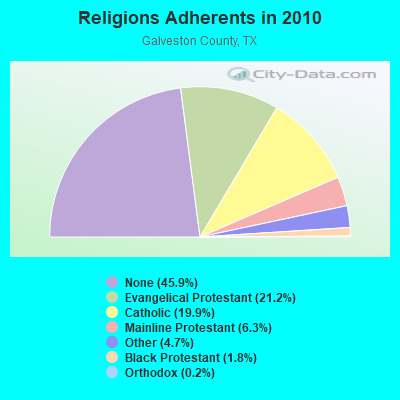
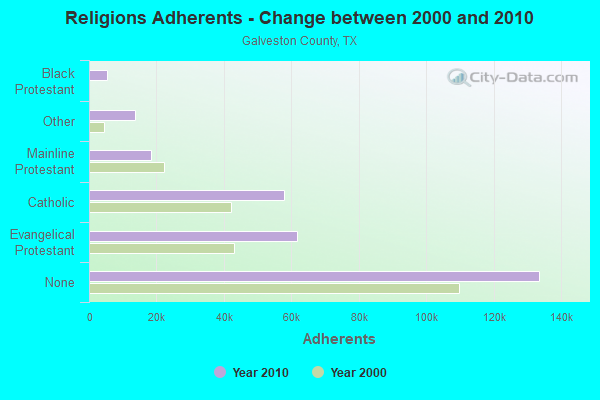
| Religion | Adherents | Congregations |
|---|---|---|
| Evangelical Protestant | 61,765 | 195 |
| Catholic | 57,907 | 8 |
| Mainline Protestant | 18,373 | 50 |
| Other | 13,728 | 26 |
| Black Protestant | 5,373 | 17 |
| Orthodox | 559 | 3 |
| None | 133,604 | - |
Food Environment Statistics:
| This county: | 1.70 / 10,000 pop. |
| State: | 1.47 / 10,000 pop. |
| Here: | 0.18 / 10,000 pop. |
| Texas: | 0.14 / 10,000 pop. |
| Galveston County: | 1.41 / 10,000 pop. |
| State: | 1.11 / 10,000 pop. |
| Galveston County: | 4.45 / 10,000 pop. |
| Texas: | 3.95 / 10,000 pop. |
| Galveston County: | 6.89 / 10,000 pop. |
| Texas: | 6.13 / 10,000 pop. |
| Galveston County: | 10.1% |
| State: | 8.9% |
| Galveston County: | 28.4% |
| Texas: | 26.6% |
| Galveston County: | 16.7% |
| Texas: | 15.7% |
Health and Nutrition:
| This city: | 50.3% |
| Texas: | 48.6% |
| This city: | 49.3% |
| State: | 47.4% |
| Here: | 28.5 |
| Texas: | 28.5 |
| League City: | 21.0% |
| State: | 20.6% |
| This city: | 9.2% |
| Texas: | 10.3% |
| League City: | 6.8 |
| Texas: | 6.8 |
| This city: | 34.2% |
| State: | 33.1% |
| League City: | 58.4% |
| Texas: | 56.2% |
| Here: | 81.3% |
| Texas: | 80.7% |
More about Health and Nutrition of League City, TX Residents
| Local government employment and payroll (March 2022) | |||||
| Function | Full-time employees | Monthly full-time payroll | Average yearly full-time wage | Part-time employees | Monthly part-time payroll |
|---|---|---|---|---|---|
| Police Protection - Officers | 172 | $1,079,028 | $75,281 | 1 | $1,122 |
| Streets and Highways | 61 | $304,360 | $59,874 | 0 | $0 |
| Sewerage | 51 | $222,008 | $52,237 | 0 | $0 |
| Financial Administration | 49 | $264,153 | $64,691 | 2 | $1,488 |
| Other and Unallocable | 44 | $207,937 | $56,710 | 2 | $4,774 |
| Health | 44 | $198,208 | $54,057 | 16 | $29,557 |
| Parks and Recreation | 43 | $171,531 | $47,869 | 10 | $11,155 |
| Other Government Administration | 36 | $205,156 | $68,385 | 0 | $0 |
| Local Libraries | 24 | $100,111 | $50,056 | 16 | $20,844 |
| Water Supply | 18 | $83,637 | $55,758 | 0 | $0 |
| Judicial and Legal | 12 | $78,927 | $78,927 | 1 | $465 |
| Firefighters | 9 | $63,210 | $84,280 | 57 | $30,243 |
| Housing and Community Development (Local) | 7 | $30,156 | $51,696 | 0 | $0 |
| Totals for Government | 570 | $3,008,421 | $63,335 | 105 | $99,647 |
League City government finances - Expenditure in 2021 (per resident):
- Construction - Water Utilities: $23,221,000 ($201.19)
Regular Highways: $18,911,000 ($163.85)
General Public Buildings: $9,914,000 ($85.90)
General - Other: $1,384,000 ($11.99)
- Current Operations - Water Utilities: $24,963,000 ($216.28)
Police Protection: $22,752,000 ($197.13)
Regular Highways: $18,494,000 ($160.23)
General - Other: $9,910,000 ($85.86)
Parks and Recreation: $7,433,000 ($64.40)
Central Staff Services: $6,273,000 ($54.35)
Health - Other: $5,392,000 ($46.72)
General Public Buildings: $3,591,000 ($31.11)
Local Fire Protection: $3,550,000 ($30.76)
Libraries: $2,184,000 ($18.92)
Financial Administration: $1,776,000 ($15.39)
Judicial and Legal Services: $1,448,000 ($12.55)
Housing and Community Development: $1,109,000 ($9.61)
- General - Interest on Debt: $5,252,000 ($45.50)
- Intergovernmental to Local - Other - Central Staff Services: $522,000 ($4.52)
- Intergovernmental to State - Central Staff Services: $1,606,000 ($13.91)
- Other Capital Outlay - Regular Highways: $4,219,000 ($36.55)
Housing and Community Development: $1,012,000 ($8.77)
Central Staff Services: $359,000 ($3.11)
Police Protection: $310,000 ($2.69)
Water Utilities: $304,000 ($2.63)
Local Fire Protection: $22,000 ($0.19)
- Total Salaries and Wages: $54,703,000 ($473.96)
- Water Utilities - Interest on Debt: $5,129,000 ($44.44)
League City government finances - Revenue in 2021 (per resident):
- Charges - Other: $16,717,000 ($144.84)
- Federal Intergovernmental - Public Welfare: $6,382,000 ($55.29)
Housing and Community Development: $501,000 ($4.34)
Health and Hospitals: $41,000 ($0.36)
- Local Intergovernmental - Water Utilities: $42,000 ($0.36)
Public Welfare: $5,000 ($0.04)
- Miscellaneous - Interest Earnings: $2,143,000 ($18.57)
Fines and Forfeits: $1,110,000 ($9.62)
Sale of Property: $16,000 ($0.14)
Donations From Private Sources: $15,000 ($0.13)
- Revenue - Water Utilities: $42,139,000 ($365.10)
- State Intergovernmental - General Local Government Support: $5,755,000 ($49.86)
Public Welfare: $42,000 ($0.36)
Highways: $8,000 ($0.07)
- Tax - Property: $47,132,000 ($408.36)
General Sales and Gross Receipts: $25,147,000 ($217.88)
Other License: $3,162,000 ($27.40)
Other Selective Sales: $719,000 ($6.23)
League City government finances - Debt in 2021 (per resident):
- Long Term Debt - Outstanding Unspecified Public Purpose: $289,006,000 ($2503.99)
Beginning Outstanding - Unspecified Public Purpose: $272,723,000 ($2362.92)
Issue, Unspecified Public Purpose: $67,631,000 ($585.97)
Retired Unspecified Public Purpose: $51,348,000 ($444.89)
- Short Term Debt Outstanding - End of Fiscal Year: $20,788,000 ($180.11)
Beginning: $16,440,000 ($142.44)
League City government finances - Cash and Securities in 2021 (per resident):
- Bond Funds - Cash and Securities: $87,949,000 ($762.00)
- Other Funds - Cash and Securities: $105,741,000 ($916.16)
- Sinking Funds - Cash and Securities: $4,179,000 ($36.21)
8.54% of this county's 2021 resident taxpayers lived in other counties in 2020 ($73,500 average adjusted gross income)
| Here: | 8.54% |
| Texas average: | 8.12% |
0.02% of residents moved from foreign countries ($187 average AGI)
Galveston County: 0.02% Texas average: 0.04%
Top counties from which taxpayers relocated into this county between 2020 and 2021:
| from Harris County, TX | |
| from Brazoria County, TX | |
| from Fort Bend County, TX |
7.72% of this county's 2020 resident taxpayers moved to other counties in 2021 ($74,429 average adjusted gross income)
| Here: | 7.72% |
| Texas average: | 7.40% |
0.02% of residents moved to foreign countries ($137 average AGI)
Galveston County: 0.02% Texas average: 0.03%
Top counties to which taxpayers relocated from this county between 2020 and 2021:
| to Harris County, TX | |
| to Brazoria County, TX | |
| to Montgomery County, TX |
| Businesses in League City, TX | ||||
| Name | Count | Name | Count | |
|---|---|---|---|---|
| 24 Hour Fitness | 1 | McDonald's | 5 | |
| AT&T | 2 | Nike | 2 | |
| Ace Hardware | 1 | Nissan | 1 | |
| Advance Auto Parts | 1 | Panda Express | 2 | |
| AutoZone | 2 | Papa John's Pizza | 1 | |
| BMW | 1 | Payless | 1 | |
| Blockbuster | 1 | Penske | 1 | |
| Burger King | 2 | Pizza Hut | 2 | |
| CVS | 6 | Popeyes | 1 | |
| Cinnabon | 1 | Quiznos | 1 | |
| Cracker Barrel | 1 | RadioShack | 1 | |
| Cricket Wireless | 3 | Rue21 | 1 | |
| Curves | 1 | SAS Shoes | 1 | |
| DHL | 4 | SONIC Drive-In | 2 | |
| Dairy Queen | 1 | Safeway | 1 | |
| Dennys | 1 | Sears | 1 | |
| Discount Tire | 1 | Sephora | 1 | |
| Domino's Pizza | 2 | Shoe Carnival | 1 | |
| FedEx | 9 | Sprint Nextel | 1 | |
| Firestone Complete Auto Care | 1 | Starbucks | 6 | |
| GNC | 1 | Subway | 5 | |
| GameStop | 1 | Super 8 | 1 | |
| H&R Block | 2 | T-Mobile | 2 | |
| Hobby Lobby | 1 | T.J.Maxx | 1 | |
| Holiday Inn | 1 | Taco Bell | 2 | |
| Home Depot | 1 | Toyota | 1 | |
| JCPenney | 1 | U-Haul | 4 | |
| Jones New York | 1 | UPS | 10 | |
| KFC | 2 | Vans | 1 | |
| Kohl's | 1 | Verizon Wireless | 2 | |
| Kroger | 3 | Vons | 1 | |
| LA Fitness | 1 | Waffle House | 1 | |
| Little Caesars Pizza | 1 | Walgreens | 2 | |
| Long John Silver's | 1 | Walmart | 1 | |
| Lowe's | 1 | Wendy's | 1 | |
| Maurices | 1 | YMCA | 1 | |
Strongest AM radio stations in League City:
- KTRH (740 AM; 50 kW; HOUSTON, TX; Owner: AMFM TEXAS LICENSES LIMITED PARTNERSHIP)
- KYST (920 AM; 5 kW; TEXAS CITY, TX; Owner: HISPANIC BROADCASTING, INC.)
- KILE (1560 AM; 50 kW; BELLAIRE, TX; Owner: THE RAFTT CORPORATION)
- KHCB (1400 AM; 1 kW; GALVESTON, TX; Owner: HOUSTON CHRISTIAN BROADCASTERS, INC.)
- KGOL (1180 AM; 50 kW; HUMBLE, TX; Owner: ENTRAVISION HOLDINGS, LLC)
- KXYZ (1320 AM; 5 kW; HOUSTON, TX; Owner: BLAYA INC.)
- KTEK (1110 AM; daytime; 2 kW; ALVIN, TX; Owner: SOUTH TEXAS BROADCASTING, INC.)
- KLAT (1010 AM; 10 kW; HOUSTON, TX; Owner: TICHENOR LICENSE CORPORATION ("TLC"))
- KLVL (1480 AM; 3 kW; PASADENA, TX; Owner: SIGA BROADCASTING CORP.)
- KWWJ (1360 AM; 5 kW; BAYTOWN, TX; Owner: SALT OF THE EARTH BROADCASTING, INC.)
- KPRC (950 AM; 5 kW; HOUSTON, TX; Owner: CCB TEXAS LICENSES, L.P.)
- KEYH (850 AM; 10 kW; HOUSTON, TX; Owner: LIBERMAN BROADCASTING OF HOUSTON LICENSE CORP.)
- KCOH (1430 AM; 5 kW; HOUSTON, TX; Owner: KCOH, INC.)
Strongest FM radio stations in League City:
- KLDE (107.5 FM; LAKE JACKSON, TX; Owner: CXR HOLDINGS, INC.)
- KOVE-FM (106.5 FM; GALVESTON, TX; Owner: HBC LICENSE CORPORATION)
- KJIC (90.5 FM; SANTA FE, TX; Owner: COMMUNITY RADIO, INC.)
- KRBE (104.1 FM; HOUSTON, TX; Owner: KRBE LICO, INC.)
- KUHF (88.7 FM; HOUSTON, TX; Owner: UNIVERSITY OF HOUSTON SYSTEM)
- KBXX (97.9 FM; HOUSTON, TX; Owner: RADIO ONE LICENSES, LLC)
- KHJZ-FM (95.7 FM; HOUSTON, TX; Owner: TEXAS INFINITY BROADCASTING L.P.)
- KHMX (96.5 FM; HOUSTON, TX; Owner: CITICASTERS LICENSES, L.P.)
- KILT-FM (100.3 FM; HOUSTON, TX; Owner: TEXAS INFINITY BROADCASTING L.P.)
- KKBQ-FM (92.9 FM; PASADENA, TX; Owner: CXR HOLDINGS, INC.)
- KLOL (101.1 FM; HOUSTON, TX; Owner: AMFM TEXAS LICENSES LIMITED PARTNERSHIP)
- KODA (99.1 FM; HOUSTON, TX; Owner: AMFM TEXAS LICENSES LIMITED PARTNERSHIP)
- KTBZ-FM (94.5 FM; HOUSTON, TX; Owner: AMFM TEXAS LICENSES LIMITED PARTNERSHIP)
- KKRW (93.7 FM; HOUSTON, TX; Owner: CAPSTAR TX LIMITED PARTNERSHIP)
- KMJQ (102.1 FM; HOUSTON, TX; Owner: RADIO ONE LICENSES, LLC)
- KHCB-FM (105.7 FM; HOUSTON, TX; Owner: HOUSTON CHRISTIAN BROADCASTERS, INC.)
- K217DJ (91.3 FM; KEMAH, TX; Owner: BEST MEDIA INC.)
- KPTY (104.9 FM; MISSOURI CITY, TX; Owner: TICHENOR LICENSE CORPORATION ("TLC"))
- KACC (89.7 FM; ALVIN, TX; Owner: ALVIN COMMUNITY COLLEGE)
- KLTN (102.9 FM; HOUSTON, TX; Owner: HBC HOUSTON LICENSE CORPORATION)
TV broadcast stations around League City:
- KJIB-LP (Channel 5; CLEAR LAKE CITY, TX; Owner: FAR EASTERN TELECASTERS)
- KTMD (Channel 48; GALVESTON, TX; Owner: TELEMUNDO OF TEXAS PARTNERSHIP, LP)
- KLTJ (Channel 22; GALVESTON, TX; Owner: WORD OF GOD FELLOWSHIP, INC.)
- KAZH (Channel 57; BAYTOWN, TX; Owner: KAZH LICENSE, LLC)
- KHOU-TV (Channel 11; HOUSTON, TX; Owner: KHOU-TV, L.P.)
- KPRC-TV (Channel 2; HOUSTON, TX; Owner: POST-NEWSWEEK STATIONS, HOUSTON, LP)
- KRIV (Channel 26; HOUSTON, TX; Owner: FOX TELEVISION STATIONS, INC.)
- KNWS-TV (Channel 51; KATY, TX; Owner: JOHNSON BROADCASTING, INC.)
- KHWB (Channel 39; HOUSTON, TX; Owner: KHWB, INC.)
- KTRK-TV (Channel 13; HOUSTON, TX; Owner: KTRK TELEVISION, INC.)
- KXLN-TV (Channel 45; ROSENBERG, TX; Owner: KXLN LICENSE PARTNERSHIP, L.P.)
- KTBU (Channel 55; CONROE, TX; Owner: HUMANITY INTERESTED MEDIA, INC.)
- KZJL (Channel 61; HOUSTON, TX; Owner: KZJL LICENSE CORP.)
- KTXH (Channel 20; HOUSTON, TX; Owner: FOX TELEVISION STATIONS, INC.)
- KPXB (Channel 49; CONROE, TX; Owner: PAXSON HOUSTON LICENSE, INC.)
- KETH (Channel 14; HOUSTON, TX; Owner: COMMUNITY EDUCATIONAL TV, INC.)
- KFTH (Channel 67; ALVIN, TX; Owner: TELEFUTURA HOUSTON LLC)
- KUHT (Channel 8; HOUSTON, TX; Owner: UNIVERSITY OF HOUSTON SYSTEM)
- KVDO-LP (Channel 69; CLEAR LAKE, TX; Owner: FAR EASTERN TELECASTERS)
- KBPX-LP (Channel 33; HOUSTON, TX; Owner: PAXSON COMMUNICATIONS LPTV, INC.)
- KHMV-LP (Channel 28; HOUSTON, TX; Owner: PAPPAS TELECASTING OF THE GULF COAST, A CALIFORNIA LP)
- KVIT-LP (Channel 28; VICTORIA, TX; Owner: CLUB COMMUNICATIONS)
- KVQT-LP (Channel 24; HOUSTON, TX; Owner: C. DOWEN JOHNSON)
- KVVV-LP (Channel 53; HOUSTON, TX; Owner: KAZH LICENSE, LLC)
- K30CV (Channel 30; HOUSTON, TX; Owner: BROADCASTING SYSTEMS, INC.)
- National Bridge Inventory (NBI) Statistics
- 92Number of bridges
- 997ft / 304mTotal length
- $152,000Total costs
- 1,874,283Total average daily traffic
- 72,663Total average daily truck traffic
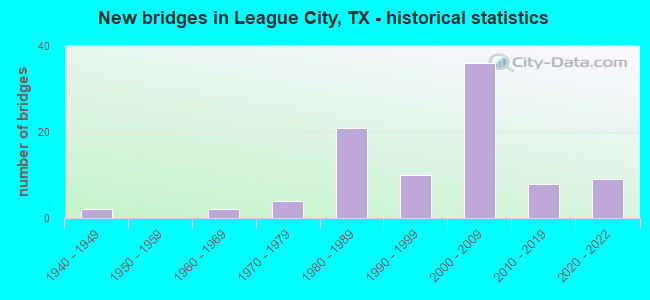
- New bridges - historical statistics
- 21940-1949
- 21960-1969
- 41970-1979
- 211980-1989
- 101990-1999
- 362000-2009
- 82010-2019
- 92020-2022
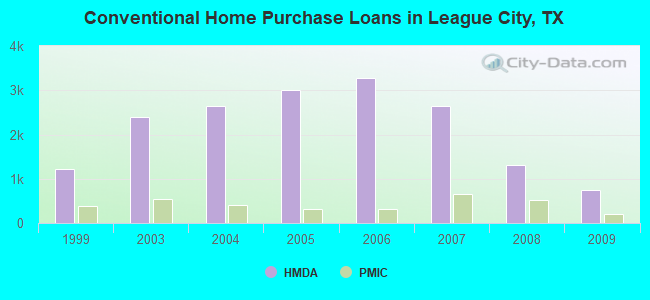
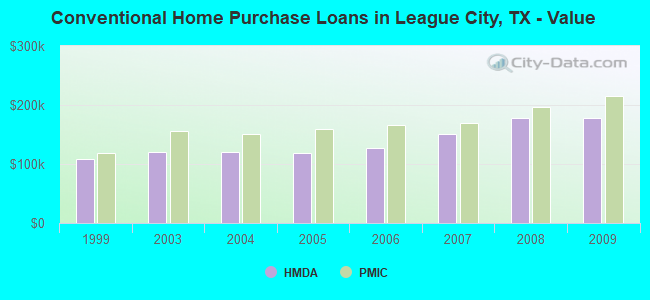
| Home Mortgage Disclosure Act Aggregated Statistics For Year 2009 (Based on 3 full and 7 partial tracts) | ||||||||||||||
| A) FHA, FSA/RHS & VA Home Purchase Loans | B) Conventional Home Purchase Loans | C) Refinancings | D) Home Improvement Loans | E) Loans on Dwellings For 5+ Families | F) Non-occupant Loans on < 5 Family Dwellings (A B C & D) | G) Loans On Manufactured Home Dwelling (A B C & D) | ||||||||
|---|---|---|---|---|---|---|---|---|---|---|---|---|---|---|
| Number | Average Value | Number | Average Value | Number | Average Value | Number | Average Value | Number | Average Value | Number | Average Value | Number | Average Value | |
| LOANS ORIGINATED | 795 | $174,678 | 743 | $178,654 | 1,485 | $176,348 | 98 | $39,304 | 1 | $6,511,660 | 74 | $127,998 | 1 | $27,910 |
| APPLICATIONS APPROVED, NOT ACCEPTED | 37 | $161,779 | 55 | $163,189 | 137 | $157,774 | 23 | $49,992 | 0 | $0 | 9 | $123,211 | 2 | $95,110 |
| APPLICATIONS DENIED | 96 | $182,585 | 124 | $181,333 | 531 | $179,631 | 126 | $42,938 | 0 | $0 | 39 | $107,729 | 2 | $46,480 |
| APPLICATIONS WITHDRAWN | 75 | $192,580 | 106 | $206,741 | 339 | $178,500 | 18 | $85,500 | 0 | $0 | 21 | $95,319 | 5 | $87,628 |
| FILES CLOSED FOR INCOMPLETENESS | 12 | $192,904 | 18 | $223,380 | 100 | $147,627 | 15 | $62,109 | 0 | $0 | 6 | $80,188 | 0 | $0 |
Detailed mortgage data for all 10 tracts in League City, TX
| Private Mortgage Insurance Companies Aggregated Statistics For Year 2009 (Based on 3 full and 7 partial tracts) | ||||||
| A) Conventional Home Purchase Loans | B) Refinancings | C) Non-occupant Loans on < 5 Family Dwellings (A & B) | ||||
|---|---|---|---|---|---|---|
| Number | Average Value | Number | Average Value | Number | Average Value | |
| LOANS ORIGINATED | 194 | $215,460 | 94 | $194,384 | 1 | $136,580 |
| APPLICATIONS APPROVED, NOT ACCEPTED | 44 | $225,298 | 34 | $211,793 | 3 | $159,157 |
| APPLICATIONS DENIED | 20 | $270,136 | 13 | $190,766 | 0 | $0 |
| APPLICATIONS WITHDRAWN | 7 | $214,249 | 5 | $178,632 | 0 | $0 |
| FILES CLOSED FOR INCOMPLETENESS | 5 | $213,284 | 1 | $159,500 | 0 | $0 |
2002 - 2018 National Fire Incident Reporting System (NFIRS) incidents
- Fire incident types reported to NFIRS in League City, TX
- 71642.4%Outside Fires
- 65438.8%Structure Fires
- 28917.1%Mobile Property/Vehicle Fires
- 281.7%Other
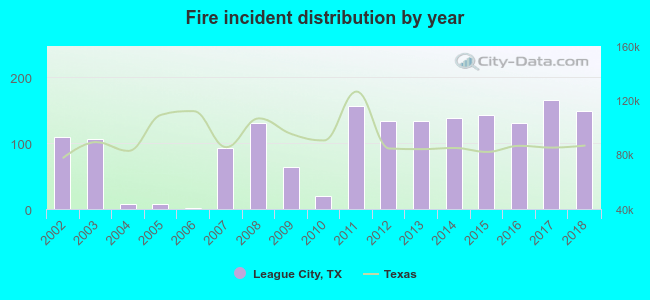 According to the data from the years 2002 - 2018 the average number of fire incidents per year is 99. The highest number of reported fires - 165 took place in 2017, and the least - 1 in 2006. The data has a growing trend.
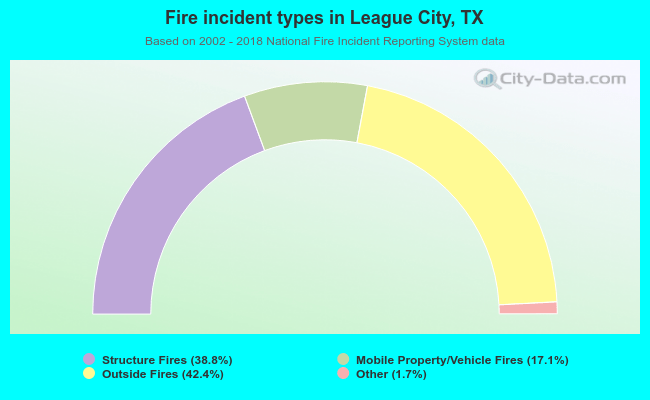 When looking into fire subcategories, the most reports belonged to: Outside Fires (42.4%), and Structure Fires (38.8%).
Fire-safe hotels and motels in League City, Texas:
- Candlewood Suites, 2350 S Gulf Fwy, League City, Texas 77573 , Phone: (281) 534-9848, Fax: (281) 534-9849
- Hampton Inn And Suites, 2320 Gulf Freeway S, League City, Texas 77573 , Phone: (281) 614-5437
| Most common first names in League City, TX among deceased individuals | ||
| Name | Count | Lived (average) |
|---|---|---|
| John | 93 | 71.4 years |
| Mary | 88 | 77.0 years |
| James | 83 | 69.2 years |
| William | 82 | 71.4 years |
| Robert | 74 | 66.7 years |
| Charles | 51 | 72.6 years |
| George | 34 | 73.3 years |
| Margaret | 33 | 78.8 years |
| Thomas | 29 | 72.5 years |
| Donald | 29 | 66.6 years |
| Most common last names in League City, TX among deceased individuals | ||
| Last name | Count | Lived (average) |
|---|---|---|
| Smith | 43 | 73.3 years |
| Williams | 35 | 70.0 years |
| Davis | 24 | 78.1 years |
| Jones | 21 | 79.6 years |
| Johnson | 19 | 68.6 years |
| Clark | 17 | 76.0 years |
| Brown | 16 | 67.4 years |
| Walker | 16 | 75.9 years |
| White | 15 | 76.1 years |
| Wilson | 15 | 70.1 years |
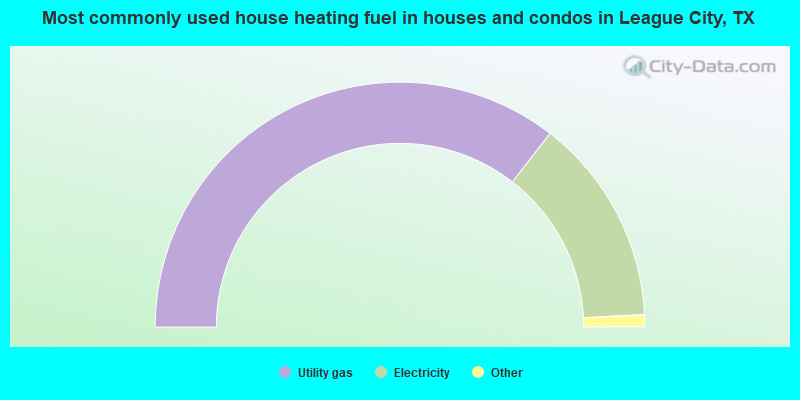
- 71.0%Utility gas
- 27.4%Electricity
- 1.0%Bottled, tank, or LP gas
- 0.3%No fuel used
- 0.2%Other fuel
- 0.1%Solar energy
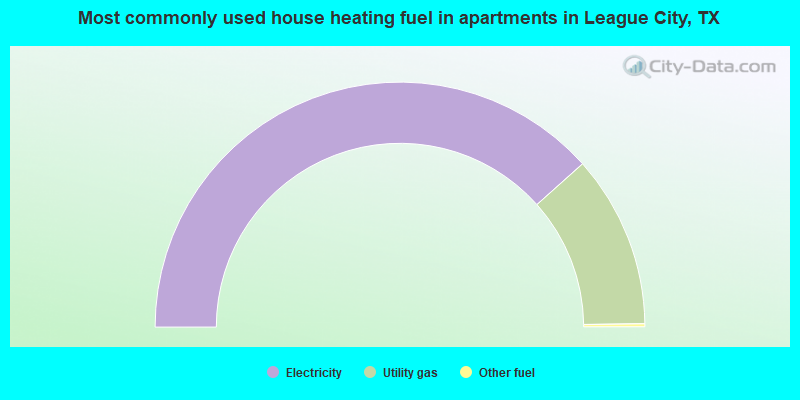
- 76.8%Electricity
- 22.8%Utility gas
- 0.4%Other fuel
League City compared to Texas state average:
- Unemployed percentage significantly below state average.
- Foreign-born population percentage above state average.
- Length of stay since moving in below state average.
- Number of rooms per house above state average.
- House age below state average.
- Number of college students above state average.
- Percentage of population with a bachelor's degree or higher above state average.
League City on our top lists:
- #1 on the list of "Top 101 cities with largest percentage of females in occupations: installation, maintenance, and repair occupations (population 50,000+)"
- #2 on the list of "Top 101 cities with the smallest differences between morning and afternoon humidity (population 50,000+)"
- #2 on the list of "Top 101 cities with the smallest humidity differences during a year (population 50,000+)"
- #3 on the list of "Top 101 cities with largest percentage of females in industries: mining, quarrying, and oil and gas extraction (population 50,000+)"
- #12 on the list of "Top 101 cities with the highest average humidity (population 50,000+)"
- #13 on the list of "Top 101 cities with largest percentage of males in occupations: health diagnosing and treating practitioners and other technical occupations (population 50,000+)"
- #14 on the list of "Top 101 cities with largest percentage of males in occupations: law enforcement workers including supervisors (population 50,000+)"
- #17 on the list of "Top 101 cities with largest percentage of females in occupations: legal occupations (population 50,000+)"
- #18 on the list of "Top 100 cities with highest median household income and median resident age less than 35 (pop. 50,000+)"
- #18 on the list of "Top 101 cities with most building permits per 10,000 residents (population 50,000+)"
- #20 on the list of "Top 100 cities with newest houses (pop. 50,000+)"
- #24 on the list of "Top 101 cities with the largest percentage population increase from 2000 (population 50,000+)"
- #25 on the list of "Top 101 cities with largest percentage of females in occupations: health diagnosing and treating practitioners and other technical occupations (population 50,000+)"
- #26 on the list of "Top 101 cities with the largest city-data.com crime index increase from 2002 to 2012 (population 50,000+)"
- #35 on the list of "Top 100 fastest growing cities from 2000 to 2014 (pop. 50,000+)"
- #36 on the list of "Top 101 cities with largest percentage of males in occupations: fire fighting and prevention workers including supervisors (population 50,000+)"
- #39 on the list of "Top 101 cities with the lowest number of murders per 100,000 residents (population 50,000+)"
- #40 on the list of "Top 101 cities with the least people below the poverty level (population 50,000+)"
- #45 on the list of "Top 101 cities that people commute from (largest negative percentage daily daytime population change due to commuting) (population 50,000+)"
- #46 on the list of "Top 100 cities with lowest ratio of median house value to median household income (pop. 50,000+)"
- #14 on the list of "Top 101 counties with the largest decrease in the number of infant deaths per 1000 residents 2000-2006 to 2007-2013 (pop. 50,000+)"
- #30 on the list of "Top 101 counties with the lowest number of infant deaths per 1000 residents 2007-2013 (pop. 50,000+)"
- #35 on the list of "Top 101 counties with the lowest Nitrogen Dioxide air pollution readings in 2012 (ppm)"
- #48 on the list of "Top 101 counties with the lowest surface withdrawal of fresh water for public supply"
- #72 on the list of "Top 101 counties with the largest decrease in the number of deaths per 1000 residents 2000-2006 to 2007-2013 (pop. 50,000+)"

|
|
Total of 1202 patent applications in 2008-2024.