Live Oak, California Submit your own pictures of this place and show them to the world
OSM Map
General Map
Google Map
MSN Map
OSM Map
General Map
Google Map
MSN Map
OSM Map
General Map
Google Map
MSN Map
OSM Map
General Map
Google Map
MSN Map
Please wait while loading the map...
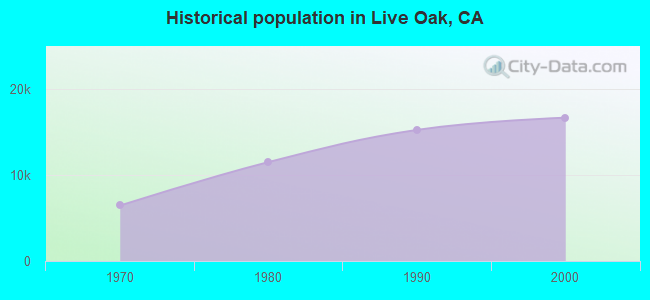
Population in 2010: 17,158. Population change since 2000: +3.2%Males: 8,366 Females: 8,792
March 2022 cost of living index in Live Oak: 134.7 (high, U.S. average is 100) Percentage of residents living in poverty in 2022: 12.1%for White Non-Hispanic residents , 32.2% for Black residents , 16.0% for Hispanic or Latino residents , 37.0% for American Indian residents , 12.5% for other race residents , 18.9% for two or more races residents )
Profiles of local businesses
Business Search - 14 Million verified businesses
Data:
Median household income ($)
Median household income (% change since 2000)
Household income diversity
Ratio of average income to average house value (%)
Ratio of average income to average rent
Median household income ($) - White
Median household income ($) - Black or African American
Median household income ($) - Asian
Median household income ($) - Hispanic or Latino
Median household income ($) - American Indian and Alaska Native
Median household income ($) - Multirace
Median household income ($) - Other Race
Median household income for houses/condos with a mortgage ($)
Median household income for apartments without a mortgage ($)
Races - White alone (%)
Races - White alone (% change since 2000)
Races - Black alone (%)
Races - Black alone (% change since 2000)
Races - American Indian alone (%)
Races - American Indian alone (% change since 2000)
Races - Asian alone (%)
Races - Asian alone (% change since 2000)
Races - Hispanic (%)
Races - Hispanic (% change since 2000)
Races - Native Hawaiian and Other Pacific Islander alone (%)
Races - Native Hawaiian and Other Pacific Islander alone (% change since 2000)
Races - Two or more races (%)
Races - Two or more races (% change since 2000)
Races - Other race alone (%)
Races - Other race alone (% change since 2000)
Racial diversity
Unemployment (%)
Unemployment (% change since 2000)
Unemployment (%) - White
Unemployment (%) - Black or African American
Unemployment (%) - Asian
Unemployment (%) - Hispanic or Latino
Unemployment (%) - American Indian and Alaska Native
Unemployment (%) - Multirace
Unemployment (%) - Other Race
Population density (people per square mile)
Population - Males (%)
Population - Females (%)
Population - Males (%) - White
Population - Males (%) - Black or African American
Population - Males (%) - Asian
Population - Males (%) - Hispanic or Latino
Population - Males (%) - American Indian and Alaska Native
Population - Males (%) - Multirace
Population - Males (%) - Other Race
Population - Females (%) - White
Population - Females (%) - Black or African American
Population - Females (%) - Asian
Population - Females (%) - Hispanic or Latino
Population - Females (%) - American Indian and Alaska Native
Population - Females (%) - Multirace
Population - Females (%) - Other Race
Coronavirus confirmed cases (Jun 16, 2024)
Deaths caused by coronavirus (Jun 16, 2024)
Coronavirus confirmed cases (per 100k population) (Jun 16, 2024)
Deaths caused by coronavirus (per 100k population) (Jun 16, 2024)
Daily increase in number of cases (Jun 16, 2024)
Weekly increase in number of cases (Jun 16, 2024)
Cases doubled (in days) (Jun 16, 2024)
Hospitalized patients (Apr 18, 2022)
Negative test results (Apr 18, 2022)
Total test results (Apr 18, 2022)
COVID Vaccine doses distributed (per 100k population) (Sep 19, 2023)
COVID Vaccine doses administered (per 100k population) (Sep 19, 2023)
COVID Vaccine doses distributed (Sep 19, 2023)
COVID Vaccine doses administered (Sep 19, 2023)
Likely homosexual households (%)
Likely homosexual households (% change since 2000)
Likely homosexual households - Lesbian couples (%)
Likely homosexual households - Lesbian couples (% change since 2000)
Likely homosexual households - Gay men (%)
Likely homosexual households - Gay men (% change since 2000)
Cost of living index
Median gross rent ($)
Median contract rent ($)
Median monthly housing costs ($)
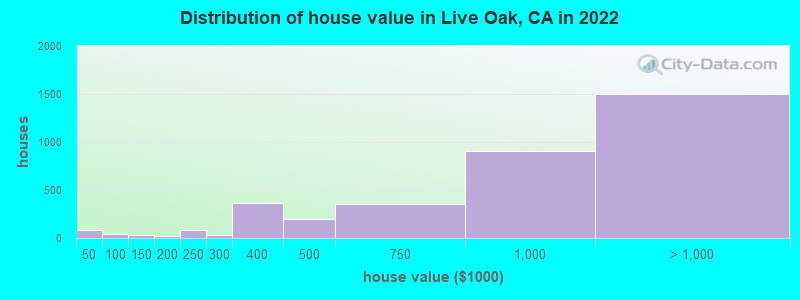
Median house or condo value ($)
Median house or condo value ($ change since 2000)
Mean house or condo value by units in structure - 1, detached ($)
Mean house or condo value by units in structure - 1, attached ($)
Mean house or condo value by units in structure - 2 ($)
Mean house or condo value by units in structure by units in structure - 3 or 4 ($)
Mean house or condo value by units in structure - 5 or more ($)
Mean house or condo value by units in structure - Boat, RV, van, etc. ($)
Mean house or condo value by units in structure - Mobile home ($)
Median house or condo value ($) - White
Median house or condo value ($) - Black or African American
Median house or condo value ($) - Asian
Median house or condo value ($) - Hispanic or Latino
Median house or condo value ($) - American Indian and Alaska Native
Median house or condo value ($) - Multirace
Median house or condo value ($) - Other Race
Median resident age
Resident age diversity
Median resident age - Males
Median resident age - Females
Median resident age - White
Median resident age - Black or African American
Median resident age - Asian
Median resident age - Hispanic or Latino
Median resident age - American Indian and Alaska Native
Median resident age - Multirace
Median resident age - Other Race
Median resident age - Males - White
Median resident age - Males - Black or African American
Median resident age - Males - Asian
Median resident age - Males - Hispanic or Latino
Median resident age - Males - American Indian and Alaska Native
Median resident age - Males - Multirace
Median resident age - Males - Other Race
Median resident age - Females - White
Median resident age - Females - Black or African American
Median resident age - Females - Asian
Median resident age - Females - Hispanic or Latino
Median resident age - Females - American Indian and Alaska Native
Median resident age - Females - Multirace
Median resident age - Females - Other Race
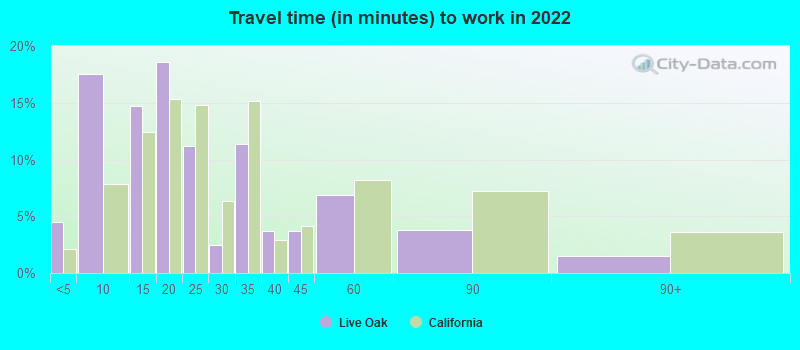
Commute - mean travel time to work (minutes)
Travel time to work - Less than 5 minutes (%)
Travel time to work - Less than 5 minutes (% change since 2000)
Travel time to work - 5 to 9 minutes (%)
Travel time to work - 5 to 9 minutes (% change since 2000)
Travel time to work - 10 to 19 minutes (%)
Travel time to work - 10 to 19 minutes (% change since 2000)
Travel time to work - 20 to 29 minutes (%)
Travel time to work - 20 to 29 minutes (% change since 2000)
Travel time to work - 30 to 39 minutes (%)
Travel time to work - 30 to 39 minutes (% change since 2000)
Travel time to work - 40 to 59 minutes (%)
Travel time to work - 40 to 59 minutes (% change since 2000)
Travel time to work - 60 to 89 minutes (%)
Travel time to work - 60 to 89 minutes (% change since 2000)
Travel time to work - 90 or more minutes (%)
Travel time to work - 90 or more minutes (% change since 2000)
Marital status - Never married (%)
Marital status - Now married (%)
Marital status - Separated (%)
Marital status - Widowed (%)
Marital status - Divorced (%)
Median family income ($)
Median family income (% change since 2000)
Median non-family income ($)
Median non-family income (% change since 2000)
Median per capita income ($)
Median per capita income (% change since 2000)
Median family income ($) - White
Median family income ($) - Black or African American
Median family income ($) - Asian
Median family income ($) - Hispanic or Latino
Median family income ($) - American Indian and Alaska Native
Median family income ($) - Multirace
Median family income ($) - Other Race
Median year house/condo built
Median year apartment built
Year house built - Built 2005 or later (%)
Year house built - Built 2000 to 2004 (%)
Year house built - Built 1990 to 1999 (%)
Year house built - Built 1980 to 1989 (%)
Year house built - Built 1970 to 1979 (%)
Year house built - Built 1960 to 1969 (%)
Year house built - Built 1950 to 1959 (%)
Year house built - Built 1940 to 1949 (%)
Year house built - Built 1939 or earlier (%)
Average household size
Household density (households per square mile)
Average household size - White
Average household size - Black or African American
Average household size - Asian
Average household size - Hispanic or Latino
Average household size - American Indian and Alaska Native
Average household size - Multirace
Average household size - Other Race
Occupied housing units (%)
Vacant housing units (%)
Owner occupied housing units (%)
Renter occupied housing units (%)
Vacancy status - For rent (%)
Vacancy status - For sale only (%)
Vacancy status - Rented or sold, not occupied (%)
Vacancy status - For seasonal, recreational, or occasional use (%)
Vacancy status - For migrant workers (%)
Vacancy status - Other vacant (%)
Residents with income below the poverty level (%)
Residents with income below 50% of the poverty level (%)
Children below poverty level (%)
Poor families by family type - Married-couple family (%)
Poor families by family type - Male, no wife present (%)
Poor families by family type - Female, no husband present (%)
Poverty status for native-born residents (%)
Poverty status for foreign-born residents (%)
Poverty among high school graduates not in families (%)
Poverty among people who did not graduate high school not in families (%)
Residents with income below the poverty level (%) - White
Residents with income below the poverty level (%) - Black or African American
Residents with income below the poverty level (%) - Asian
Residents with income below the poverty level (%) - Hispanic or Latino
Residents with income below the poverty level (%) - American Indian and Alaska Native
Residents with income below the poverty level (%) - Multirace
Residents with income below the poverty level (%) - Other Race
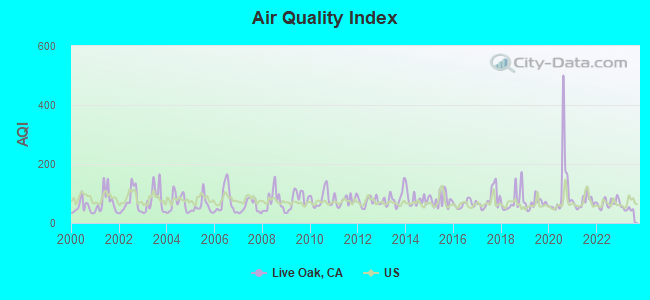
Air pollution - Air Quality Index (AQI)
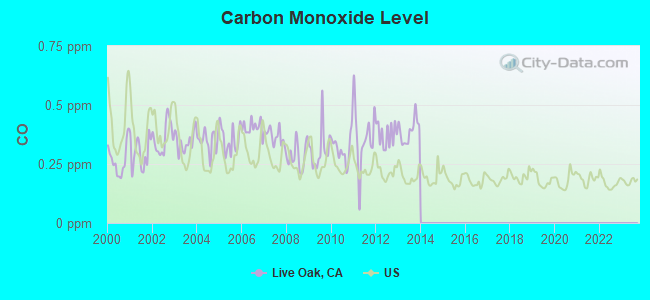
Air pollution - CO
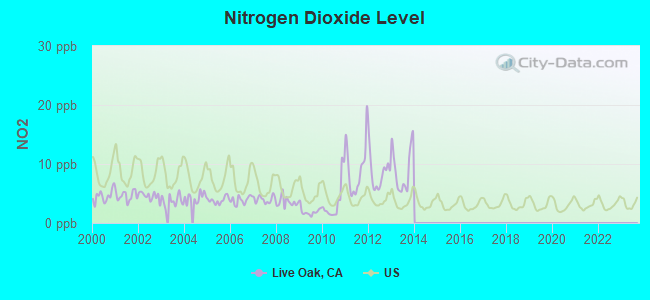
Air pollution - NO2
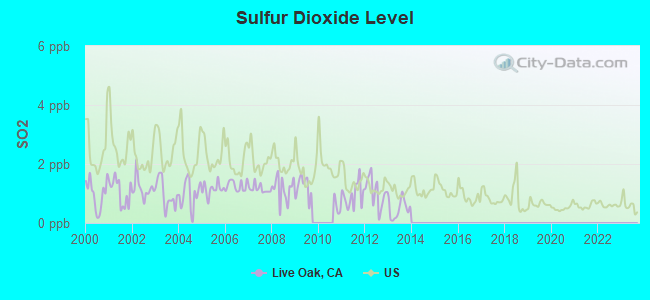
Air pollution - SO2
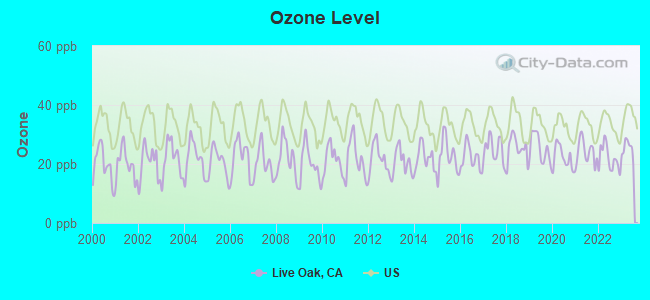
Air pollution - Ozone
Air pollution - PM10
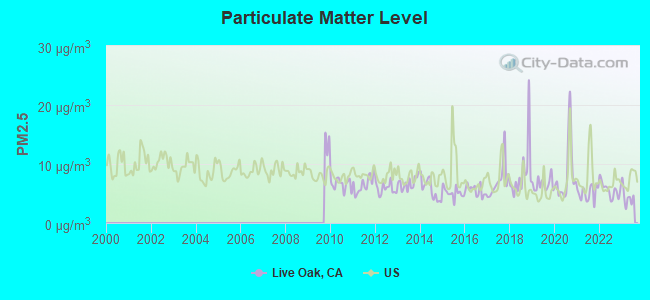
Air pollution - PM25
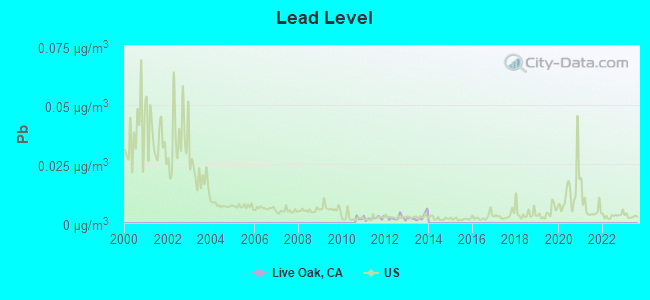
Air pollution - Pb
Crime - Murders per 100,000 population
Crime - Rapes per 100,000 population
Crime - Robberies per 100,000 population
Crime - Assaults per 100,000 population
Crime - Burglaries per 100,000 population
Crime - Thefts per 100,000 population
Crime - Auto thefts per 100,000 population
Crime - Arson per 100,000 population
Crime - City-data.com crime index
Crime - Violent crime index
Crime - Property crime index
Crime - Murders per 100,000 population (5 year average)
Crime - Rapes per 100,000 population (5 year average)
Crime - Robberies per 100,000 population (5 year average)
Crime - Assaults per 100,000 population (5 year average)
Crime - Burglaries per 100,000 population (5 year average)
Crime - Thefts per 100,000 population (5 year average)
Crime - Auto thefts per 100,000 population (5 year average)
Crime - Arson per 100,000 population (5 year average)
Crime - City-data.com crime index (5 year average)
Crime - Violent crime index (5 year average)
Crime - Property crime index (5 year average)
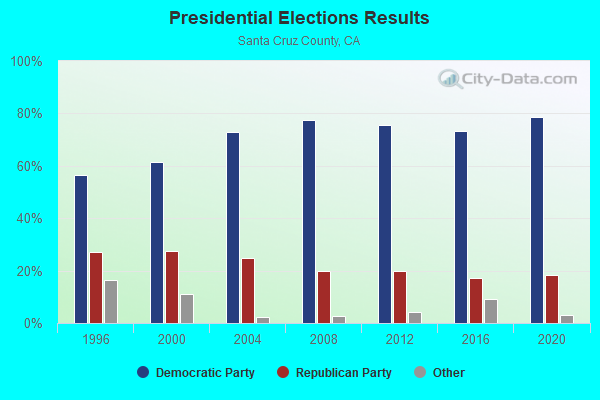
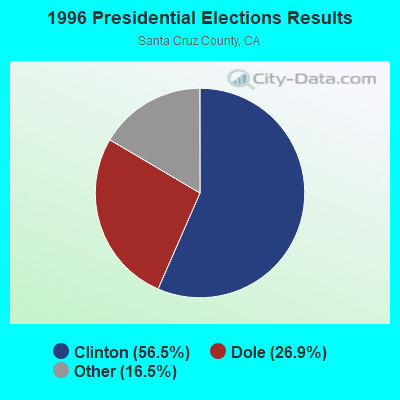
1996 Presidential Elections Results (%) - Democratic Party (Clinton)
1996 Presidential Elections Results (%) - Republican Party (Dole)
1996 Presidential Elections Results (%) - Other
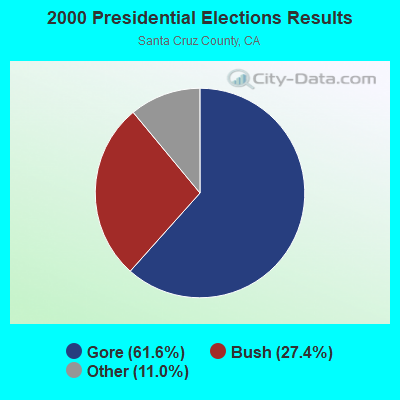
2000 Presidential Elections Results (%) - Democratic Party (Gore)
2000 Presidential Elections Results (%) - Republican Party (Bush)
2000 Presidential Elections Results (%) - Other
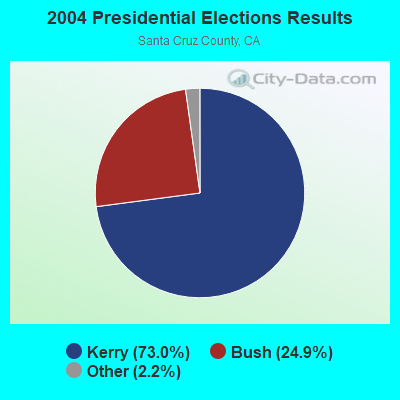
2004 Presidential Elections Results (%) - Democratic Party (Kerry)
2004 Presidential Elections Results (%) - Republican Party (Bush)
2004 Presidential Elections Results (%) - Other
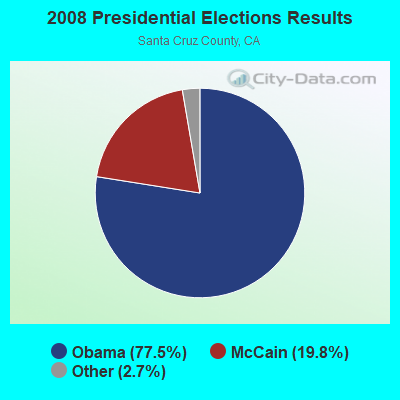
2008 Presidential Elections Results (%) - Democratic Party (Obama)
2008 Presidential Elections Results (%) - Republican Party (McCain)
2008 Presidential Elections Results (%) - Other
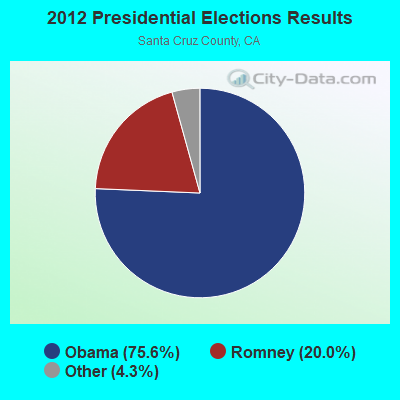
2012 Presidential Elections Results (%) - Democratic Party (Obama)
2012 Presidential Elections Results (%) - Republican Party (Romney)
2012 Presidential Elections Results (%) - Other
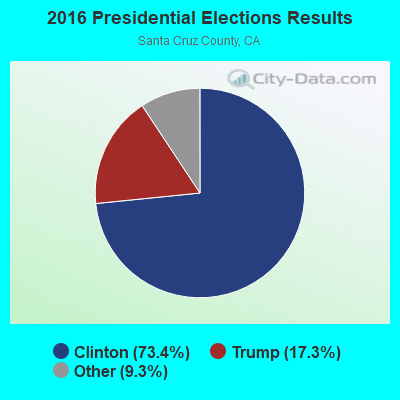
2016 Presidential Elections Results (%) - Democratic Party (Clinton)
2016 Presidential Elections Results (%) - Republican Party (Trump)
2016 Presidential Elections Results (%) - Other
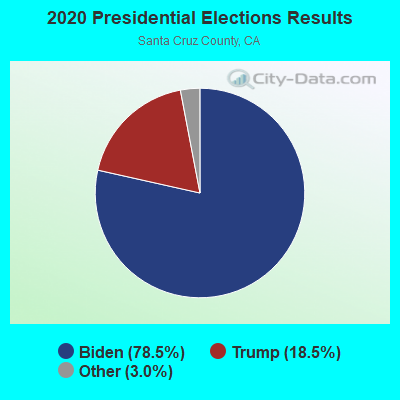
2020 Presidential Elections Results (%) - Democratic Party (Biden)
2020 Presidential Elections Results (%) - Republican Party (Trump)
2020 Presidential Elections Results (%) - Other
Ancestries Reported - Arab (%)
Ancestries Reported - Czech (%)
Ancestries Reported - Danish (%)
Ancestries Reported - Dutch (%)
Ancestries Reported - English (%)
Ancestries Reported - French (%)
Ancestries Reported - French Canadian (%)
Ancestries Reported - German (%)
Ancestries Reported - Greek (%)
Ancestries Reported - Hungarian (%)
Ancestries Reported - Irish (%)
Ancestries Reported - Italian (%)
Ancestries Reported - Lithuanian (%)
Ancestries Reported - Norwegian (%)
Ancestries Reported - Polish (%)
Ancestries Reported - Portuguese (%)
Ancestries Reported - Russian (%)
Ancestries Reported - Scotch-Irish (%)
Ancestries Reported - Scottish (%)
Ancestries Reported - Slovak (%)
Ancestries Reported - Subsaharan African (%)
Ancestries Reported - Swedish (%)
Ancestries Reported - Swiss (%)
Ancestries Reported - Ukrainian (%)
Ancestries Reported - United States (%)
Ancestries Reported - Welsh (%)
Ancestries Reported - West Indian (%)
Ancestries Reported - Other (%)
Educational Attainment - No schooling completed (%)
Educational Attainment - Less than high school (%)
Educational Attainment - High school or equivalent (%)
Educational Attainment - Less than 1 year of college (%)
Educational Attainment - 1 or more years of college (%)
Educational Attainment - Associate degree (%)
Educational Attainment - Bachelor's degree (%)
Educational Attainment - Master's degree (%)
Educational Attainment - Professional school degree (%)
Educational Attainment - Doctorate degree (%)
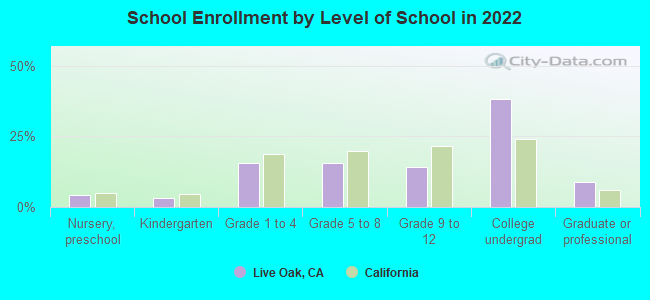
School Enrollment - Nursery, preschool (%)
School Enrollment - Kindergarten (%)
School Enrollment - Grade 1 to 4 (%)
School Enrollment - Grade 5 to 8 (%)
School Enrollment - Grade 9 to 12 (%)
School Enrollment - College undergrad (%)
School Enrollment - Graduate or professional (%)
School Enrollment - Not enrolled in school (%)
School enrollment - Public schools (%)
School enrollment - Private schools (%)
School enrollment - Not enrolled (%)
Median number of rooms in houses and condos
Median number of rooms in apartments
Housing units lacking complete plumbing facilities (%)
Housing units lacking complete kitchen facilities (%)
Density of houses
Urban houses (%)
Rural houses (%)
Households with people 60 years and over (%)
Households with people 65 years and over (%)
Households with people 75 years and over (%)
Households with one or more nonrelatives (%)
Households with no nonrelatives (%)
Population in households (%)
Family households (%)
Nonfamily households (%)
Population in families (%)
Family households with own children (%)
Median number of bedrooms in owner occupied houses
Mean number of bedrooms in owner occupied houses
Median number of bedrooms in renter occupied houses
Mean number of bedrooms in renter occupied houses
Median number of vehichles in owner occupied houses
Mean number of vehichles in owner occupied houses
Median number of vehichles in renter occupied houses
Mean number of vehichles in renter occupied houses
Mortgage status - with mortgage (%)
Mortgage status - with second mortgage (%)
Mortgage status - with home equity loan (%)
Mortgage status - with both second mortgage and home equity loan (%)
Mortgage status - without a mortgage (%)
Average family size
Average family size - White
Average family size - Black or African American
Average family size - Asian
Average family size - Hispanic or Latino
Average family size - American Indian and Alaska Native
Average family size - Multirace
Average family size - Other Race
Geographical mobility - Same house 1 year ago (%)
Geographical mobility - Moved within same county (%)
Geographical mobility - Moved from different county within same state (%)
Geographical mobility - Moved from different state (%)
Geographical mobility - Moved from abroad (%)
Place of birth - Born in state of residence (%)
Place of birth - Born in other state (%)
Place of birth - Native, outside of US (%)
Place of birth - Foreign born (%)
Housing units in structures - 1, detached (%)
Housing units in structures - 1, attached (%)
Housing units in structures - 2 (%)
Housing units in structures - 3 or 4 (%)
Housing units in structures - 5 to 9 (%)
Housing units in structures - 10 to 19 (%)
Housing units in structures - 20 to 49 (%)
Housing units in structures - 50 or more (%)
Housing units in structures - Mobile home (%)
Housing units in structures - Boat, RV, van, etc. (%)
House/condo owner moved in on average (years ago)
Renter moved in on average (years ago)
Year householder moved into unit - Moved in 1999 to March 2000 (%)
Year householder moved into unit - Moved in 1995 to 1998 (%)
Year householder moved into unit - Moved in 1990 to 1994 (%)
Year householder moved into unit - Moved in 1980 to 1989 (%)
Year householder moved into unit - Moved in 1970 to 1979 (%)
Year householder moved into unit - Moved in 1969 or earlier (%)
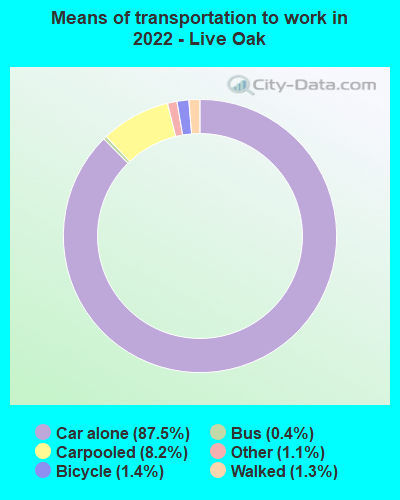
Means of transportation to work - Drove car alone (%)
Means of transportation to work - Carpooled (%)
Means of transportation to work - Public transportation (%)
Means of transportation to work - Bus or trolley bus (%)
Means of transportation to work - Streetcar or trolley car (%)
Means of transportation to work - Subway or elevated (%)
Means of transportation to work - Railroad (%)
Means of transportation to work - Ferryboat (%)
Means of transportation to work - Taxicab (%)
Means of transportation to work - Motorcycle (%)
Means of transportation to work - Bicycle (%)
Means of transportation to work - Walked (%)
Means of transportation to work - Other means (%)
Working at home (%)
Industry diversity
Most Common Industries - Agriculture, forestry, fishing and hunting, and mining (%)
Most Common Industries - Agriculture, forestry, fishing and hunting (%)
Most Common Industries - Mining, quarrying, and oil and gas extraction (%)
Most Common Industries - Construction (%)
Most Common Industries - Manufacturing (%)
Most Common Industries - Wholesale trade (%)
Most Common Industries - Retail trade (%)
Most Common Industries - Transportation and warehousing, and utilities (%)
Most Common Industries - Transportation and warehousing (%)
Most Common Industries - Utilities (%)
Most Common Industries - Information (%)
Most Common Industries - Finance and insurance, and real estate and rental and leasing (%)
Most Common Industries - Finance and insurance (%)
Most Common Industries - Real estate and rental and leasing (%)
Most Common Industries - Professional, scientific, and management, and administrative and waste management services (%)
Most Common Industries - Professional, scientific, and technical services (%)
Most Common Industries - Management of companies and enterprises (%)
Most Common Industries - Administrative and support and waste management services (%)
Most Common Industries - Educational services, and health care and social assistance (%)
Most Common Industries - Educational services (%)
Most Common Industries - Health care and social assistance (%)
Most Common Industries - Arts, entertainment, and recreation, and accommodation and food services (%)
Most Common Industries - Arts, entertainment, and recreation (%)
Most Common Industries - Accommodation and food services (%)
Most Common Industries - Other services, except public administration (%)
Most Common Industries - Public administration (%)
Occupation diversity
Most Common Occupations - Management, business, science, and arts occupations (%)
Most Common Occupations - Management, business, and financial occupations (%)
Most Common Occupations - Management occupations (%)
Most Common Occupations - Business and financial operations occupations (%)
Most Common Occupations - Computer, engineering, and science occupations (%)
Most Common Occupations - Computer and mathematical occupations (%)
Most Common Occupations - Architecture and engineering occupations (%)
Most Common Occupations - Life, physical, and social science occupations (%)
Most Common Occupations - Education, legal, community service, arts, and media occupations (%)
Most Common Occupations - Community and social service occupations (%)
Most Common Occupations - Legal occupations (%)
Most Common Occupations - Education, training, and library occupations (%)
Most Common Occupations - Arts, design, entertainment, sports, and media occupations (%)
Most Common Occupations - Healthcare practitioners and technical occupations (%)
Most Common Occupations - Health diagnosing and treating practitioners and other technical occupations (%)
Most Common Occupations - Health technologists and technicians (%)
Most Common Occupations - Service occupations (%)
Most Common Occupations - Healthcare support occupations (%)
Most Common Occupations - Protective service occupations (%)
Most Common Occupations - Fire fighting and prevention, and other protective service workers including supervisors (%)
Most Common Occupations - Law enforcement workers including supervisors (%)
Most Common Occupations - Food preparation and serving related occupations (%)
Most Common Occupations - Building and grounds cleaning and maintenance occupations (%)
Most Common Occupations - Personal care and service occupations (%)
Most Common Occupations - Sales and office occupations (%)
Most Common Occupations - Sales and related occupations (%)
Most Common Occupations - Office and administrative support occupations (%)
Most Common Occupations - Natural resources, construction, and maintenance occupations (%)
Most Common Occupations - Farming, fishing, and forestry occupations (%)
Most Common Occupations - Construction and extraction occupations (%)
Most Common Occupations - Installation, maintenance, and repair occupations (%)
Most Common Occupations - Production, transportation, and material moving occupations (%)
Most Common Occupations - Production occupations (%)
Most Common Occupations - Transportation occupations (%)
Most Common Occupations - Material moving occupations (%)
People in Group quarters - Institutionalized population (%)
People in Group quarters - Correctional institutions (%)
People in Group quarters - Federal prisons and detention centers (%)
People in Group quarters - Halfway houses (%)
People in Group quarters - Local jails and other confinement facilities (including police lockups) (%)
People in Group quarters - Military disciplinary barracks (%)
People in Group quarters - State prisons (%)
People in Group quarters - Other types of correctional institutions (%)
People in Group quarters - Nursing homes (%)
People in Group quarters - Hospitals/wards, hospices, and schools for the handicapped (%)
People in Group quarters - Hospitals/wards and hospices for chronically ill (%)
People in Group quarters - Hospices or homes for chronically ill (%)
People in Group quarters - Military hospitals or wards for chronically ill (%)
People in Group quarters - Other hospitals or wards for chronically ill (%)
People in Group quarters - Hospitals or wards for drug/alcohol abuse (%)
People in Group quarters - Mental (Psychiatric) hospitals or wards (%)
People in Group quarters - Schools, hospitals, or wards for the mentally retarded (%)
People in Group quarters - Schools, hospitals, or wards for the physically handicapped (%)
People in Group quarters - Institutions for the deaf (%)
People in Group quarters - Institutions for the blind (%)
People in Group quarters - Orthopedic wards and institutions for the physically handicapped (%)
People in Group quarters - Wards in general hospitals for patients who have no usual home elsewhere (%)
People in Group quarters - Wards in military hospitals for patients who have no usual home elsewhere (%)
People in Group quarters - Juvenile institutions (%)
People in Group quarters - Long-term care (%)
People in Group quarters - Homes for abused, dependent, and neglected children (%)
People in Group quarters - Residential treatment centers for emotionally disturbed children (%)
People in Group quarters - Training schools for juvenile delinquents (%)
People in Group quarters - Short-term care, detention or diagnostic centers for delinquent children (%)
People in Group quarters - Type of juvenile institution unknown (%)
People in Group quarters - Noninstitutionalized population (%)
People in Group quarters - College dormitories (includes college quarters off campus) (%)
People in Group quarters - Military quarters (%)
People in Group quarters - On base (%)
People in Group quarters - Barracks, unaccompanied personnel housing (UPH), (Enlisted/Officer), ;and similar group living quarters for military personnel (%)
People in Group quarters - Transient quarters for temporary residents (%)
People in Group quarters - Military ships (%)
People in Group quarters - Group homes (%)
People in Group quarters - Homes or halfway houses for drug/alcohol abuse (%)
People in Group quarters - Homes for the mentally ill (%)
People in Group quarters - Homes for the mentally retarded (%)
People in Group quarters - Homes for the physically handicapped (%)
People in Group quarters - Other group homes (%)
People in Group quarters - Religious group quarters (%)
People in Group quarters - Dormitories (%)
People in Group quarters - Agriculture workers' dormitories on farms (%)
People in Group quarters - Job Corps and vocational training facilities (%)
People in Group quarters - Other workers' dormitories (%)
People in Group quarters - Crews of maritime vessels (%)
People in Group quarters - Other nonhousehold living situations (%)
People in Group quarters - Other noninstitutional group quarters (%)
Residents speaking English at home (%)
Residents speaking English at home - Born in the United States (%)
Residents speaking English at home - Native, born elsewhere (%)
Residents speaking English at home - Foreign born (%)
Residents speaking Spanish at home (%)
Residents speaking Spanish at home - Born in the United States (%)
Residents speaking Spanish at home - Native, born elsewhere (%)
Residents speaking Spanish at home - Foreign born (%)
Residents speaking other language at home (%)
Residents speaking other language at home - Born in the United States (%)
Residents speaking other language at home - Native, born elsewhere (%)
Residents speaking other language at home - Foreign born (%)
Class of Workers - Employee of private company (%)
Class of Workers - Self-employed in own incorporated business (%)
Class of Workers - Private not-for-profit wage and salary workers (%)
Class of Workers - Local government workers (%)
Class of Workers - State government workers (%)
Class of Workers - Federal government workers (%)
Class of Workers - Self-employed workers in own not incorporated business and Unpaid family workers (%)
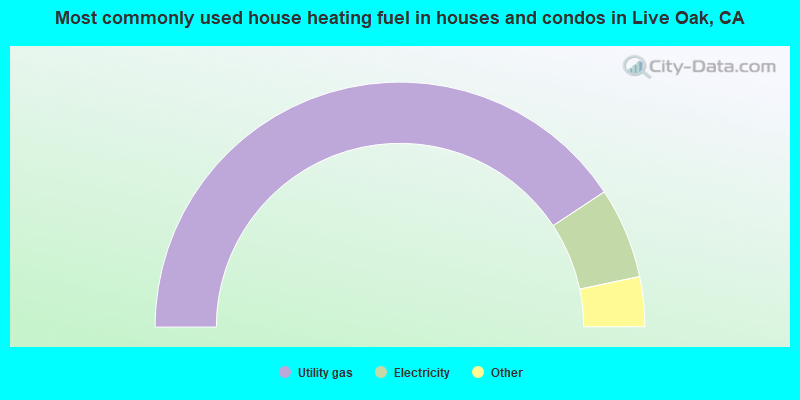
House heating fuel used in houses and condos - Utility gas (%)
House heating fuel used in houses and condos - Bottled, tank, or LP gas (%)
House heating fuel used in houses and condos - Electricity (%)
House heating fuel used in houses and condos - Fuel oil, kerosene, etc. (%)
House heating fuel used in houses and condos - Coal or coke (%)
House heating fuel used in houses and condos - Wood (%)
House heating fuel used in houses and condos - Solar energy (%)
House heating fuel used in houses and condos - Other fuel (%)
House heating fuel used in houses and condos - No fuel used (%)
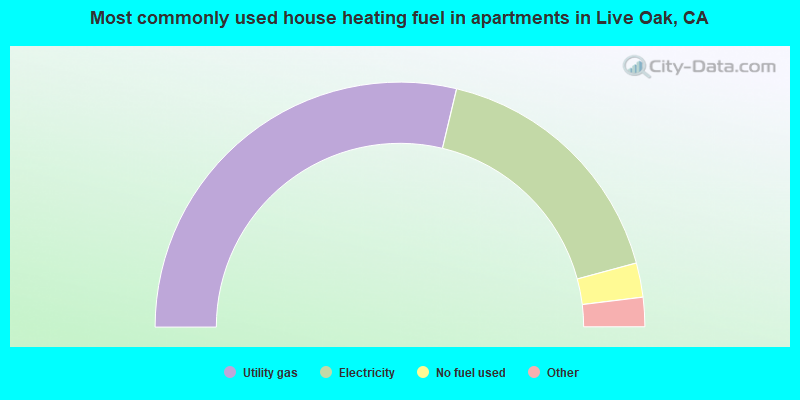
House heating fuel used in apartments - Utility gas (%)
House heating fuel used in apartments - Bottled, tank, or LP gas (%)
House heating fuel used in apartments - Electricity (%)
House heating fuel used in apartments - Fuel oil, kerosene, etc. (%)
House heating fuel used in apartments - Coal or coke (%)
House heating fuel used in apartments - Wood (%)
House heating fuel used in apartments - Solar energy (%)
House heating fuel used in apartments - Other fuel (%)
House heating fuel used in apartments - No fuel used (%)
Armed forces status - In Armed Forces (%)
Armed forces status - Civilian (%)
Armed forces status - Civilian - Veteran (%)
Armed forces status - Civilian - Nonveteran (%)
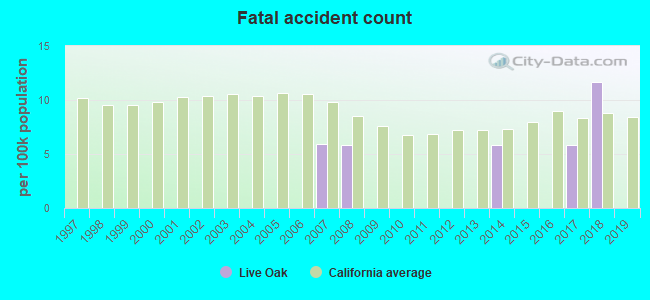
Fatal accidents locations in years 2005-2021
Fatal accidents locations in 2005
Fatal accidents locations in 2006
Fatal accidents locations in 2007
Fatal accidents locations in 2008
Fatal accidents locations in 2009
Fatal accidents locations in 2010
Fatal accidents locations in 2011
Fatal accidents locations in 2012
Fatal accidents locations in 2013
Fatal accidents locations in 2014
Fatal accidents locations in 2015
Fatal accidents locations in 2016
Fatal accidents locations in 2017
Fatal accidents locations in 2018
Fatal accidents locations in 2019
Fatal accidents locations in 2020
Fatal accidents locations in 2021
Alcohol use - People drinking some alcohol every month (%)
Alcohol use - People not drinking at all (%)
Alcohol use - Average days/month drinking alcohol
Alcohol use - Average drinks/week
Alcohol use - Average days/year people drink much
Audiometry - Average condition of hearing (%)
Audiometry - People that can hear a whisper from across a quiet room (%)
Audiometry - People that can hear normal voice from across a quiet room (%)
Audiometry - Ears ringing, roaring, buzzing (%)
Audiometry - Had a job exposure to loud noise (%)
Audiometry - Had off-work exposure to loud noise (%)
Blood Pressure & Cholesterol - Has high blood pressure (%)
Blood Pressure & Cholesterol - Checking blood pressure at home (%)
Blood Pressure & Cholesterol - Frequently checking blood cholesterol (%)
Blood Pressure & Cholesterol - Has high cholesterol level (%)
Consumer Behavior - Money monthly spent on food at supermarket/grocery store
Consumer Behavior - Money monthly spent on food at other stores
Consumer Behavior - Money monthly spent on eating out
Consumer Behavior - Money monthly spent on carryout/delivered foods
Consumer Behavior - Income spent on food at supermarket/grocery store (%)
Consumer Behavior - Income spent on food at other stores (%)
Consumer Behavior - Income spent on eating out (%)
Consumer Behavior - Income spent on carryout/delivered foods (%)
Current Health Status - General health condition (%)
Current Health Status - Blood donors (%)
Current Health Status - Has blood ever tested for HIV virus (%)
Current Health Status - Left-handed people (%)
Dermatology - People using sunscreen (%)
Diabetes - Diabetics (%)
Diabetes - Had a blood test for high blood sugar (%)
Diabetes - People taking insulin (%)
Diet Behavior & Nutrition - Diet health (%)
Diet Behavior & Nutrition - Milk product consumption (# of products/month)
Diet Behavior & Nutrition - Meals not home prepared (#/week)
Diet Behavior & Nutrition - Meals from fast food or pizza place (#/week)
Diet Behavior & Nutrition - Ready-to-eat foods (#/month)
Diet Behavior & Nutrition - Frozen meals/pizza (#/month)
Drug Use - People that ever used marijuana or hashish (%)
Drug Use - Ever used hard drugs (%)
Drug Use - Ever used any form of cocaine (%)
Drug Use - Ever used heroin (%)
Drug Use - Ever used methamphetamine (%)
Health Insurance - People covered by health insurance (%)
Kidney Conditions-Urology - Avg. # of times urinating at night
Medical Conditions - People with asthma (%)
Medical Conditions - People with anemia (%)
Medical Conditions - People with psoriasis (%)
Medical Conditions - People with overweight (%)
Medical Conditions - Elderly people having difficulties in thinking or remembering (%)
Medical Conditions - People who ever received blood transfusion (%)
Medical Conditions - People having trouble seeing even with glass/contacts (%)
Medical Conditions - People with arthritis (%)
Medical Conditions - People with gout (%)
Medical Conditions - People with congestive heart failure (%)
Medical Conditions - People with coronary heart disease (%)
Medical Conditions - People with angina pectoris (%)
Medical Conditions - People who ever had heart attack (%)
Medical Conditions - People who ever had stroke (%)
Medical Conditions - People with emphysema (%)
Medical Conditions - People with thyroid problem (%)
Medical Conditions - People with chronic bronchitis (%)
Medical Conditions - People with any liver condition (%)
Medical Conditions - People who ever had cancer or malignancy (%)
Mental Health - People who have little interest in doing things (%)
Mental Health - People feeling down, depressed, or hopeless (%)
Mental Health - People who have trouble sleeping or sleeping too much (%)
Mental Health - People feeling tired or having little energy (%)
Mental Health - People with poor appetite or overeating (%)
Mental Health - People feeling bad about themself (%)
Mental Health - People who have trouble concentrating on things (%)
Mental Health - People moving or speaking slowly or too fast (%)
Mental Health - People having thoughts they would be better off dead (%)
Oral Health - Average years since last visit a dentist
Oral Health - People embarrassed because of mouth (%)
Oral Health - People with gum disease (%)
Oral Health - General health of teeth and gums (%)
Oral Health - Average days a week using dental floss/device
Oral Health - Average days a week using mouthwash for dental problem
Oral Health - Average number of teeth
Pesticide Use - Households using pesticides to control insects (%)
Pesticide Use - Households using pesticides to kill weeds (%)
Physical Activity - People doing vigorous-intensity work activities (%)
Physical Activity - People doing moderate-intensity work activities (%)
Physical Activity - People walking or bicycling (%)
Physical Activity - People doing vigorous-intensity recreational activities (%)
Physical Activity - People doing moderate-intensity recreational activities (%)
Physical Activity - Average hours a day doing sedentary activities
Physical Activity - Average hours a day watching TV or videos
Physical Activity - Average hours a day using computer
Physical Functioning - People having limitations keeping them from working (%)
Physical Functioning - People limited in amount of work they can do (%)
Physical Functioning - People that need special equipment to walk (%)
Physical Functioning - People experiencing confusion/memory problems (%)
Physical Functioning - People requiring special healthcare equipment (%)
Prescription Medications - Average number of prescription medicines taking
Preventive Aspirin Use - Adults 40+ taking low-dose aspirin (%)
Reproductive Health - Vaginal deliveries (%)
Reproductive Health - Cesarean deliveries (%)
Reproductive Health - Deliveries resulted in a live birth (%)
Reproductive Health - Pregnancies resulted in a delivery (%)
Reproductive Health - Women breastfeeding newborns (%)
Reproductive Health - Women that had a hysterectomy (%)
Reproductive Health - Women that had both ovaries removed (%)
Reproductive Health - Women that have ever taken birth control pills (%)
Reproductive Health - Women taking birth control pills (%)
Reproductive Health - Women that have ever used Depo-Provera or injectables (%)
Reproductive Health - Women that have ever used female hormones (%)
Sexual Behavior - People 18+ that ever had sex (vaginal, anal, or oral) (%)
Sexual Behavior - Males 18+ that ever had vaginal sex with a woman (%)
Sexual Behavior - Males 18+ that ever performed oral sex on a woman (%)
Sexual Behavior - Males 18+ that ever had anal sex with a woman (%)
Sexual Behavior - Males 18+ that ever had any sex with a man (%)
Sexual Behavior - Females 18+ that ever had vaginal sex with a man (%)
Sexual Behavior - Females 18+ that ever performed oral sex on a man (%)
Sexual Behavior - Females 18+ that ever had anal sex with a man (%)
Sexual Behavior - Females 18+ that ever had any kind of sex with a woman (%)
Sexual Behavior - Average age people first had sex
Sexual Behavior - Average number of female sex partners in lifetime (males 18+)
Sexual Behavior - Average number of female vaginal sex partners in lifetime (males 18+)
Sexual Behavior - Average age people first performed oral sex on a woman (18+)
Sexual Behavior - Average number of woman performed oral sex on in lifetime (18+)
Sexual Behavior - Average number of male sex partners in lifetime (males 18+)
Sexual Behavior - Average number of male anal sex partners in lifetime (males 18+)
Sexual Behavior - Average age people first performed oral sex on a man (18+)
Sexual Behavior - Average number of male oral sex partners in lifetime (18+)
Sexual Behavior - People using protection when performing oral sex (%)
Sexual Behavior - Average number of times people have vaginal or anal sex a year
Sexual Behavior - People having sex without condom (%)
Sexual Behavior - Average number of male sex partners in lifetime (females 18+)
Sexual Behavior - Average number of male vaginal sex partners in lifetime (females 18+)
Sexual Behavior - Average number of female sex partners in lifetime (females 18+)
Sexual Behavior - Circumcised males 18+ (%)
Sleep Disorders - Average hours sleeping at night
Sleep Disorders - People that has trouble sleeping (%)
Smoking-Cigarette Use - People smoking cigarettes (%)
Taste & Smell - People 40+ having problems with smell (%)
Taste & Smell - People 40+ having problems with taste (%)
Taste & Smell - People 40+ that ever had wisdom teeth removed (%)
Taste & Smell - People 40+ that ever had tonsils teeth removed (%)
Taste & Smell - People 40+ that ever had a loss of consciousness because of a head injury (%)
Taste & Smell - People 40+ that ever had a broken nose or other serious injury to face or skull (%)
Taste & Smell - People 40+ that ever had two or more sinus infections (%)
Weight - Average height (inches)
Weight - Average weight (pounds)
Weight - Average BMI
Weight - People that are obese (%)
Weight - People that ever were obese (%)
Weight - People trying to lose weight (%)
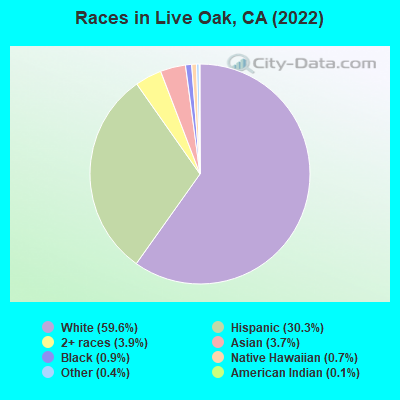
10,387 59.6% White alone 5,284 30.3% Hispanic 682 3.9% Two or more races 651 3.7% Asian alone 151 0.9% Black alone 120 0.7% Native Hawaiian and Other 73 0.4% Other race alone 20 0.1% American Indian alone
According to our research of California and other state lists, there were 29 registered sex offenders living in Live Oak, California as of June 16, 2024 . The ratio of all residents to sex offenders in Live Oak is 620 to 1.The ratio of registered sex offenders to all residents in this city is near the state average.
Latest news from Live Oak, CA collected exclusively by city-data.com from local newspapers, TV, and radio stations
Ancestries: German (6.3%), English (5.7%), Italian (4.8%), American (3.8%), Irish (3.8%), European (3.2%).
Current Local Time:
Land area: 3.23 square miles.
Population density: 5,306 people per square mile (average).
2,514 residents are foreign born (7.7% Latin America , 3.5% Asia , 2.0% Europe ).
This place:
14.4%California:
26.5%
Median real estate property taxes paid for housing units with mortgages in 2022: $7,064 (0.7%)Median real estate property taxes paid for housing units with no mortgage in 2022: $4,472 (0.6%)
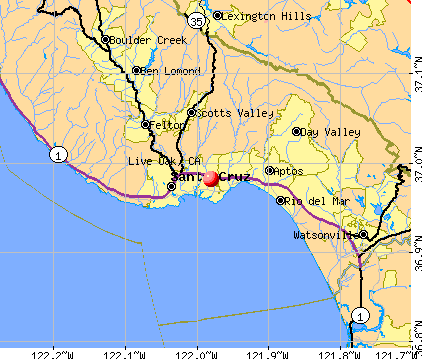
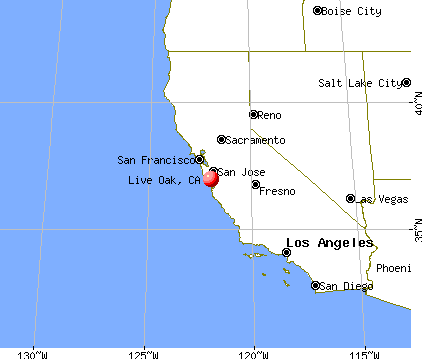
Nearest city with pop. 50,000+: Santa Cruz, CA
Nearest city with pop. 200,000+: San Jose, CA
Nearest city with pop. 1,000,000+: Los Angeles, CA
Nearest cities:
Latitude: 36.98 N, Longitude: 121.98 W
Daytime population change due to commuting: -1,170 (-6.7%)Workers who live and work in this place: 2,432 (27.7%)
Unemployment in December 2023:
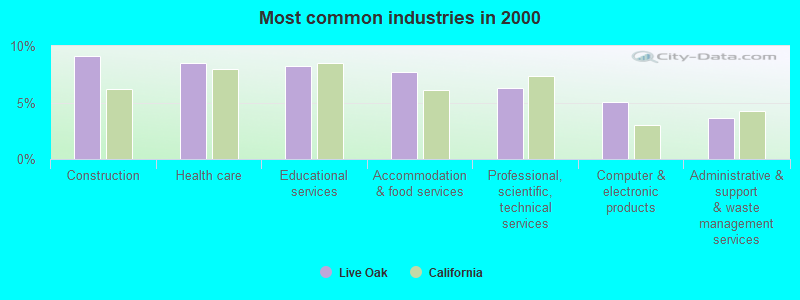
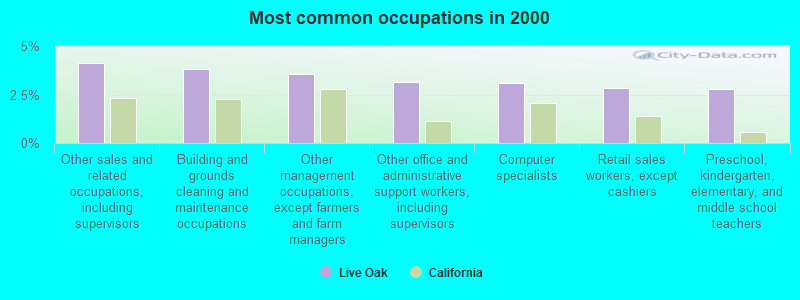
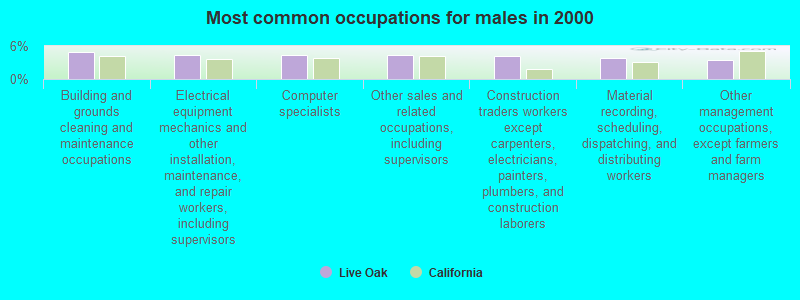
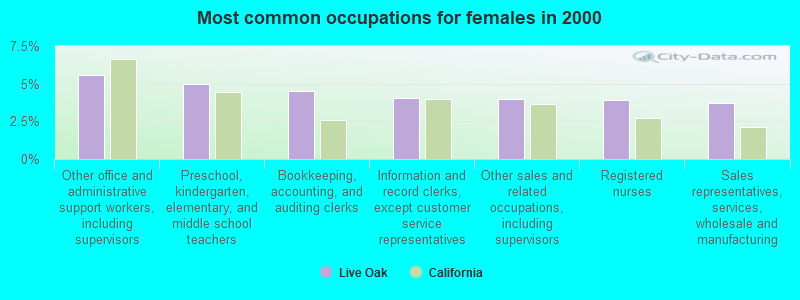
Most common occupations in Live Oak, CA (%)
Both Males Females
Other sales and related occupations, including supervisors (4.1%)
Building and grounds cleaning and maintenance occupations (3.8%)
Other management occupations, except farmers and farm managers (3.6%)
Other office and administrative support workers, including supervisors (3.1%)
Computer specialists (3.1%)
Retail sales workers, except cashiers (2.8%)
Preschool, kindergarten, elementary, and middle school teachers (2.8%)
Building and grounds cleaning and maintenance occupations (5.0%)
Electrical equipment mechanics and other installation, maintenance, and repair workers, including supervisors (4.4%)
Computer specialists (4.4%)
Other sales and related occupations, including supervisors (4.3%)
Construction traders workers except carpenters, electricians, painters, plumbers, and construction laborers (4.1%)
Material recording, scheduling, dispatching, and distributing workers (3.8%)
Other management occupations, except farmers and farm managers (3.5%)
Other office and administrative support workers, including supervisors (5.6%)
Preschool, kindergarten, elementary, and middle school teachers (5.0%)
Bookkeeping, accounting, and auditing clerks (4.5%)
Information and record clerks, except customer service representatives (4.1%)
Other sales and related occupations, including supervisors (4.0%)
Registered nurses (3.9%)
Sales representatives, services, wholesale and manufacturing (3.7%)
Earthquake activity:
Live Oak-area historical earthquake activity is significantly above California state average. It is 7457% greater than the overall U.S. average. On 4/18/1906 at 13:12:21, a magnitude 7.9 (7.9 UK, Class: Major, Intensity: VIII - XII) earthquake occurred 90.0 miles away from the city center, causing $524,000,000 total damage On 10/18/1989 at 00:04:15, a magnitude 7.1 (6.5 MB, 7.1 MS, 6.9 MW, 7.0 ML) earthquake occurred 14.6 miles away from the city center, causing 62 deaths ( 62 shaking deaths) and 3757 injuries, causing $1,305,032,704 total damage On 11/4/1927 at 13:51:53, a magnitude 7.5 (7.5 UK) earthquake occurred 152.5 miles away from Live Oak center On 7/21/1952 at 11:52:14, a magnitude 7.7 (7.7 UK) earthquake occurred 215.9 miles away from Live Oak center, causing $50,000,000 total damage On 5/2/1983 at 23:42:37, a magnitude 6.7 (6.2 MB, 6.5 MS, 6.5 MW, 6.7 ML, Class: Strong, Intensity: VII - IX) earthquake occurred 107.0 miles away from Live Oak center, causing $31,000,000 total damage On 1/31/1922 at 13:17:28, a magnitude 7.6 (7.6 UK) earthquake occurred 321.2 miles away from the city center Magnitude types: body-wave magnitude (MB), local magnitude (ML), surface-wave magnitude (MS), moment magnitude (MW) Natural disasters: The number of natural disasters in Santa Cruz County (27) is a lot greater than the US average (15).Major Disasters (Presidential) Declared: 14Emergencies Declared: 3Floods: 13, Fires: 8, Mudslides: 7, Storms: 7, Winter Storms: 6, Landslides: 4, Drought: 1, Earthquake: 1, Freeze: 1, Hurricane: 1, Tornado: 1, Tsunami Wave: 1, Other: 1 (Note: some incidents may be assigned to more than one category). Hospitals and medical centers in Live Oak: RIVER VALLEY CARE CENTER (9000 LARKIN ROAD)
Other hospitals and medical centers near Live Oak: SANTA CRUZ SKILLED NURSING CENTER (Nursing Home, about 1 miles away; SANTA CRUZ, CA)
SUTTER MATERNITY & SURGERY CENTER OF SANTA CRUZ (about 1 miles away; SANTA CRUZ, CA)
VISITING NURSE ASSOCIATION OF SANTA CRUZ COUNTY (Home Health Center, about 1 miles away; SANTA CRUZ, CA)
KINDRED NURSING AND TRANSITIONAL CARE-SANTA CRUZ (Nursing Home, about 1 miles away; SANTA CRUZ, CA)
SANTA CRUZ SURGERY CENTER (Hospital, about 1 miles away; SANTA CRUZ, CA)
DOMINICAN HOSPITAL (about 1 miles away; SANTA CRUZ, CA)
DOMINICAN HOME HEALTH (Home Health Center, about 1 miles away; SANTA CRUZ, CA)
Airports located in Live Oak: Amtrak stations near Live Oak: 3 miles: SANTA CRUZ (920 PACIFIC AVE.) - Bus Station Services: fully wheelchair accessible, public payphones, snack bar, public transit connection.
14 miles: WATSONVILLE (W. LAKE AVE. & RODRIGUEZ ST.) - Bus Station Services: fully wheelchair accessible, public payphones, snack bar, free short-term parking, taxi stand, public transit connection.
Colleges/universities with over 2000 students nearest to Live Oak:
Cabrillo College (about 3 miles; Aptos, CA ; Full-time enrollment: 7,729)
University of California-Santa Cruz (about 5 miles; Santa Cruz, CA ; FT enrollment: 17,751)
West Valley College (about 20 miles; Saratoga, CA ; FT enrollment: 6,128)
Gavilan College (about 23 miles; Gilroy, CA ; FT enrollment: 3,327)
San Jose City College (about 24 miles; San Jose, CA ; FT enrollment: 5,526)
De Anza College (about 24 miles; Cupertino, CA ; FT enrollment: 16,729)
California State University-Monterey Bay (about 25 miles; Seaside, CA ; FT enrollment: 5,125)
Public high schools in Live Oak:
Public elementary/middle schools in Live Oak: LIVE OAK MIDDLE Students: 522, Location: 2082 PENNINGTON RD., Grades: 5-8)LUTHER ELEMENTARY Students: 351, Location: 10123 CONNECTICUT AVE., Grades: KG-4)NUESTRO ELEMENTARY Students: 100, Location: 3934 BRD.WAY RD., Grades: KG-8)ENCINAL ELEMENTARY Location: 6484 LARKIN RD., Grades: KG-8)
See full list of schools located in Live Oak User-submitted facts and corrections:
Your map is incorrect, it shows the city Live Oak which is nowhere near Santa Cruz.
The Live Oak 3.2 miles from the City of Santa Cruz is an unincorporated part of Santa Cruz County, not a city. We are located near Twin Lakes, for which you do have the correct map listed.
Victory Chapel of Live Oak is located at 10615 Hwy 99 in Live Oak. There web site is "victorychapelpcg.net"
Notable locations in Live Oak: (A) , Leo Chesney Correctional Center (B) , Barber Branch Sutter County Free Library (C) , Capitola Chamber of Commerce (D) , Central Fire Protection District of Santa Cruz County Station 2 (E) , Live Oak Fire Department (F) . Display/hide their locations on the map
Shopping Centers: (1) , Aptos Center Shopping Center (2) . Display/hide their locations on the map
Churches in Live Oak include: (A) , Light and Life Community Free Church (B) , Saint Stephens Lutheran Church (C) , Santa Cruz Assembly of God Church (D) , Harbor Light Gospel Tabernacle (E) , Liberty Baptist Church (F) , Live Oak United Methodist Church (G) , Reorganized Church of Jesus Christ of Latter Day Saints (H) , Victory Faith Center (I) . Display/hide their locations on the map
Cemeteries: (1) , Holy Cross Cemetery (2) . Display/hide their locations on the map
Parks in Live Oak include: (1) , Coffee Lane Park (2) , Live Oak Memorial Park (3) . Display/hide their locations on the map
Santa Cruz County has a predicted average indoor radon screening level between 2 and 4 pCi/L (pico curies per liter) - Moderate Potential Drinking water stations with addresses in Live Oak and their reported violations in the past:
PASQUINI'S (MICHELI) WS (Population served: 150, Groundwater):
Past monitoring violations:
One routine major monitoring violation
Population served: 50, Groundwater):
Past monitoring violations:
One routine major monitoring violation
Average household size: This place:
2.6 peopleCalifornia:
2.9 people
Percentage of family households: This place:
59.9%Whole state:
68.7%
Percentage of households with unmarried partners: This place:
8.9%Whole state:
7.2%
Likely homosexual households (counted as self-reported same-sex unmarried-partner households)
Lesbian couples: 0.9% of all households Gay men: 0.5% of all households
People in group quarters in Live Oak in 2010:
244 people in nursing facilities/skilled-nursing facilities
97 people in residential treatment centers for adults
62 people in workers' group living quarters and job corps centers
34 people in other noninstitutional facilities
7 people in hospitals with patients who have no usual home elsewhere
People in group quarters in Live Oak in 2000:
462 people in nursing homes
94 people in mental (psychiatric) hospitals or wards
28 people in other noninstitutional group quarters
25 people in homes for the mentally ill
4 people in homes or halfway houses for drug/alcohol abuse
Banks with branches in Live Oak (2011 data):
Gold Pacific Bank, National Association: Live Oak Branch at 9960 Live Oak Blvd, branch established on 1989/06/05. Info updated 2012/04/03: Bank assets: $130.9 mil, Deposits: $118.3 mil, headquarters in Marysville, CA, negative income in the last year , Commercial Lending Specialization, 8 total offices , Holding Company: Golden Pacific Bancorp, Inc.
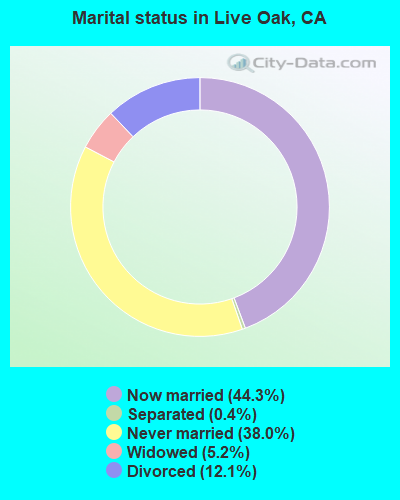
For population 15 years and over in Live Oak:
Never married: 38.0%Now married: 44.3%Separated: 0.4%Widowed: 5.2%Divorced: 12.1% For population 25 years and over in Live Oak:
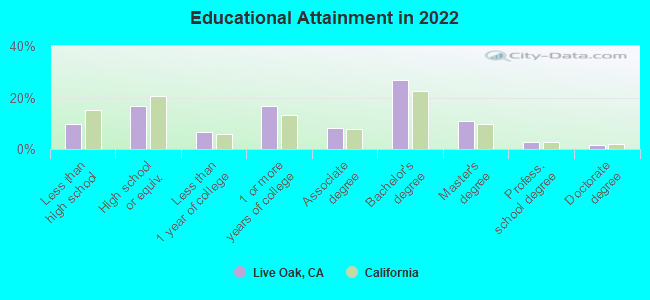
High school or higher: 91.6%Bachelor's degree or higher: 40.9%Graduate or professional degree: 14.6%Unemployed: 4.5%Mean travel time to work (commute): 18.4 minutes
Education Gini index (Inequality in education) Here:
11.9California average:
15.5
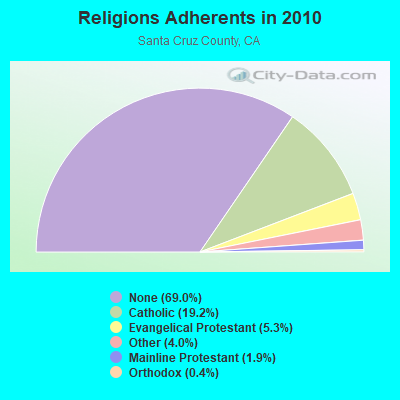
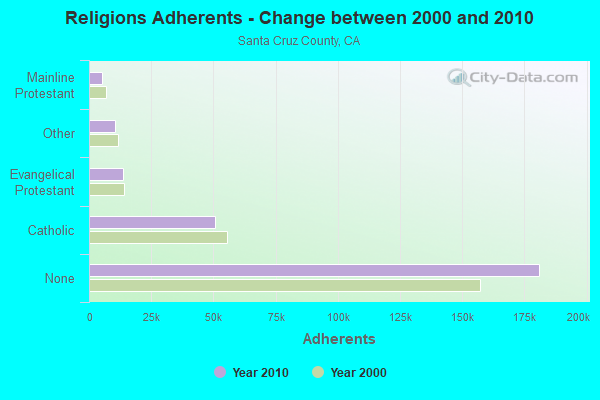
Religion statistics for Live Oak, CA (based on Santa Cruz County data)
Religion Adherents Congregations Catholic 50,500 13 Evangelical Protestant 13,838 84 Other 10,593 52 Mainline Protestant 5,049 28 Orthodox 1,104 4 Black Protestant 238 3 None 181,060 -
Source: Clifford Grammich, Kirk Hadaway, Richard Houseal, Dale E.Jones, Alexei Krindatch, Richie Stanley and Richard H.Taylor. 2012. 2010 U.S.Religion Census: Religious Congregations & Membership Study. Association of Statisticians of American Religious Bodies. Jones, Dale E., et al. 2002. Congregations and Membership in the United States 2000. Nashville, TN: Glenmary Research Center. Graphs represent county-level data
Food Environment Statistics: Number of grocery stores : 64Santa Cruz County :
2.55 / 10,000 pop.State :
2.14 / 10,000 pop.
Number of supercenters and club stores : 1Santa Cruz County :
0.04 / 10,000 pop.California :
0.04 / 10,000 pop.
Number of convenience stores (no gas) : 16This county :
0.64 / 10,000 pop.California :
0.62 / 10,000 pop.
Number of convenience stores (with gas) : 39Santa Cruz County :
1.56 / 10,000 pop.California :
1.49 / 10,000 pop.
Number of full-service restaurants : 246This county :
9.81 / 10,000 pop.State :
7.42 / 10,000 pop.
Adult diabetes rate : This county :
6.1%California :
7.3%
Adult obesity rate : This county :
17.8%California :
21.3%
Low-income preschool obesity rate : This county :
19.2%State :
17.9%
Health and Nutrition: Healthy diet rate : This city:
49.2%California:
49.4%
Average overall health of teeth and gums : This city:
48.1%California:
48.0%
Average BMI : Live Oak:
28.3California:
28.1
People feeling badly about themselves : Live Oak:
20.8%State:
20.2%
People not drinking alcohol at all : Live Oak:
9.4%California:
11.2%
Average hours sleeping at night : Live Oak:
6.8California:
6.8
Overweight people : Here:
33.0%California:
31.5%
General health condition : Average condition of hearing : Live Oak:
80.5%California:
80.9%
More about Health and Nutrition of Live Oak, CA Residents Businesses in Live Oak, CA
Strongest AM radio stations in Live Oak:
KSCO (1080 AM; 10 kW; SANTA CRUZ, CA)
KOMY (1340 AM; 1 kW; LA SELVA BEACH, CA; Owner: ZWERLING BROADCASTING SYSTEM, LTD)
KLOK (1170 AM; 50 kW; SAN JOSE, CA; Owner: ENTRAVISION HOLDINGS, LLC)
KGO (810 AM; 50 kW; SAN FRANCISCO, CA; Owner: KGO-AM RADIO, INC.)
KNBR (680 AM; 50 kW; SAN FRANCISCO, CA; Owner: KNBR LICO, INC.)
KTCT (1050 AM; 50 kW; SAN MATEO, CA; Owner: SUSQUEHANNA RADIO CORP.)
KFAX (1100 AM; 50 kW; SAN FRANCISCO, CA; Owner: GOLDEN GATE BROADCASTING CO, INC.)
KYCY (1550 AM; 50 kW; SAN FRANCISCO, CA; Owner: INFINITY BROADCASTING OPERATIONS, INC.)
KYAA (1200 AM; 25 kW; SOQUEL, CA; Owner: PEOPLE'S RADIO, INC.)
KSRK (540 AM; 10 kW; CARMEL VALLEY, CA; Owner: PEOPLE'S RADIO, INC.)
KTRB (860 AM; 50 kW; MODESTO, CA; Owner: PAPPAS RADIO OF CALIFORNIA, A CALIFORNIA LIMITED PARTNERSHIP)
KDBV (980 AM; 10 kW; SALINAS, CA; Owner: WOLFHOUSE RADIO GROUP, INC.)
KSJX (1500 AM; 10 kW; SAN JOSE, CA; Owner: MULTICULTURAL RADIO BROADCASTING INC)
Strongest FM radio stations in Live Oak:
KFER (89.9 FM; SANTA CRUZ, CA; Owner: SANTA CRUZ EDUC B/CNG FOUNDATION)
KSQL (99.1 FM; SANTA CRUZ, CA; Owner: TMS LICENSE CALIFORNIA, INC)
KKUP (91.5 FM; CUPERTINO, CA; Owner: ASSURANCE SCIENCES FOUNDATION)
KBRG (100.3 FM; SAN JOSE, CA; Owner: ENTRAVISION HOLDINGS, LLC)
KTEE (93.7 FM; FELTON, CA; Owner: MAPLETON COMMUNICATIONS, L.L.C.)
KZSC (88.1 FM; SANTA CRUZ, CA; Owner: THE REGENTS OF THE UNIVERSITY OF CALIFORNIA)
KSRI (90.7 FM; SANTA CRUZ, CA; Owner: EDUCATIONAL MEDIA FOUNDATION)
K216AX (91.1 FM; LAUREL, CA; Owner: CALVARY CHAPEL OF TWIN FALLS, INC.)
KBAA (94.5 FM; GILROY, CA; Owner: INFINITY RADIO OPERATIONS INC.)
K240CD (95.9 FM; SOQUEL, ETC., CA; Owner: CALVARY CHAPEL OF TWIN FALLS, INC.)
KFJC (89.7 FM; LOS ALTOS, CA; Owner: FOOTHILL-DE ANZA COMM. COLLEGE DIST.)
KDON-FM (102.5 FM; SALINAS, CA; Owner: CLEAR CHANNEL BROADCASTING LICENSES, INC.)
K202DU (88.3 FM; SAN JUAN BAUTISTA, CA; Owner: CALVARY CHAPEL OF TWIN FALLS, INC.)
KBTU (93.5 FM; HOLLISTER, CA; Owner: MAPLETON COMMUNICATIONS, L.L.C.)
KUFX (98.5 FM; SAN JOSE, CA; Owner: CITICASTERS LICENSES, L.P.)
KRTY (95.3 FM; LOS GATOS, CA; Owner: KRTY, LTD.)
KLVM (89.7 FM; PRUNEDALE, CA; Owner: PRUNEDALE EDUCATIONAL ASSOCIATION)
KUSP (88.9 FM; SANTA CRUZ, CA; Owner: PATAPHYSICAL B/CING. FOUNDATION,INC.)
K260AA (99.9 FM; CARMEL VALLEY, CA; Owner: ENTRAVISION HOLDINGS, LLC)
KWAV (96.9 FM; MONTEREY, CA; Owner: BUCKLEY BROADCASTING OF MONTEREY)
TV broadcast stations around Live Oak:
KNTV (Channel 11; SAN JOSE, CA; Owner: KNTV LICENSE, INC.)
KKPX (Channel 65; SAN JOSE, CA; Owner: PAXSON SAN JOSE LICENSE, INC.)
KBIT-CA (Channel 28; SAN FRANCISCO, ETC., CA; Owner: POLAR BROADCASTING, INC.)
K21EV (Channel 21; SALINAS, CA; Owner: LIVING FAITH BROADCASTING)
KDJT-CA (Channel 33; SALINAS/MONTEREY,ETC, CA; Owner: ENTRAVISION HOLDINGS, LLC)
KTEH1 (Channel 54; SANTA CRUZ, CA; Owner: KTEH FOUNDATION)
Live Oak fatal accident list:
Jan 31, 2018 09:26 PM, Soquel Avenue, Chanticleer Ave, Lat: 36.984961, Lon: -121.978747, Vehicles: 2, Persons: 2, Fatalities: 1, Drunk persons involved: 1Lat: 36.985994, Lon: -121.981308, Vehicles: 1, Persons: 2, Pedestrians: 1, Fatalities: 1Lat: 36.983567, Lon: -121.971656, Vehicles: 1, Persons: 1, Fatalities: 1, Drunk persons involved: 1Lat: 36.987708, Lon: -121.970075, Vehicles: 1, Persons: 2, Pedestrians: 1, Fatalities: 1Lat: 36.983910, Lon: -121.981930, Vehicles: 3, Persons: 3, Fatalities: 1, Drunk persons involved: 1Lat: 36.991425, Lon: -121.978361, Vehicles: 1, Persons: 2, Pedestrians: 1, Fatalities: 1
National Bridge Inventory (NBI) Statistics 3 Number of bridges46ft / 14.0m Total length144,796 Total average daily traffic6,636 Total average daily truck traffic
FCC Registered Antenna Towers: 74 (
See the full list of FCC Registered Antenna Towers in Live Oak )
FCC Registered Broadcast Land Mobile Towers: 7
2745 Fir St (Lat: 39.274333 Lon: -121.662194), Call Sign: WSW764, Assigned Frequencies: 153.770 MHz, 154.190 MHz, 154.250 MHz, 154.280 MHz, Grant Date: 02/12/2015, Expiration Date: 03/27/2025, Registrant: Sutter Buttes Comm, Inc, 445 Palora Ave, Yuba City, CA 95991, Phone: (530) 673-3475, Fax: (530) 673-1085, Email:
BROMMER YARD, 2700 Brommer Street (Lat: 36.969111 Lon: -121.977194), Type: Bant, Structure height: 8 m, Call Sign: WDH791, Assigned Frequencies: 156.135 MHz, Grant Date: 05/28/2015, Expiration Date: 08/23/2025, Certifier: Nancy Carr Gordon, Registrant: County Of Santa Cruz, 701 Ocean Street, Room 315, Santa Cruz, CA 95060, Phone: (831) 454-2025, Fax: (831) 454-3124, Email:
2700 Brommer St (Lat: 36.969111 Lon: -121.977194), Call Sign: WDH806, Assigned Frequencies: 159.195 MHz, Grant Date: 03/23/2024, Expiration Date: 05/08/2034, Registrant: County Of Santa Cruz, 701 Ocean Street, Room 315, Santa Cruz, CA 95060, Phone: (831) 454-2025, Fax: (831) 454-3124, Email:
10153 Live Oak Blvd (Lat: 39.251000 Lon: -121.685528), Call Sign: WQEJ354, Licensee ID: L00110235, Assigned Frequencies: 467.850 MHz, 467.900 MHz, Grant Date: 02/09/2006, Expiration Date: 02/09/2016, Cancellation Date: 04/16/2016, Certifier: Pat King, Registrant: L. King\'s Markets, Inc, 10153 Live Oak Blvd, Live Oak, CA 95953, Phone: (530) 695-2197, Fax: (530) 695-1816, Email:
2800 Apricot St (Lat: 39.302944 Lon: -121.879694), Call Sign: WQFE959, Assigned Frequencies: 151.685 MHz, 151.805 MHz, Grant Date: 06/29/2006, Expiration Date: 06/29/2016, Cancellation Date: 09/03/2016, Certifier: Aaron Lawson, Registrant: West Palm Wireless, 8841 W Terry St. Suite #6, Bonita Springs, FL 34135, Phone: (561) 536-3430, Email:
BROMMER, 960 Brommer Street (Brommer) (Lat: 36.971889 Lon: -121.993056), Type: Tower, Structure height: 3.6 m, Overall height: 13.1 m, Call Sign: WQZC527, Assigned Frequencies: 461.937 MHz, Grant Date: 04/05/2017, Expiration Date: 04/05/2027, Certifier: Mike Del Fava, Registrant: County Of Santa Cruz, 701 Ocean Street, Room 315, Santa Cruz, CA 95060, Phone: (831) 454-2025, Fax: (831) 454-3124, Email:
EAST CLIFF REMOTE, 2750 Lode Street (Lat: 36.960694 Lon: -121.974972), Type: Building, Structure height: 4.8 m, Call Sign: WQZF652, Assigned Frequencies: 461.937 MHz, Grant Date: 05/02/2017, Expiration Date: 05/02/2027, Certifier: Mike Del Fava, Registrant: County Of Santa Cruz, 701 Ocean Street, Room 315, Santa Cruz, CA 95060, Phone: (831) 454-3091, Email:
FCC Registered Microwave Towers: 14 (
See the full list of FCC Registered Microwave Towers in this town )
FCC Registered Amateur Radio Licenses: 42 (
See the full list of FCC Registered Amateur Radio Licenses in Live Oak )
FAA Registered Aircraft: 16 (
See the full list of FAA Registered Aircraft in Live Oak )
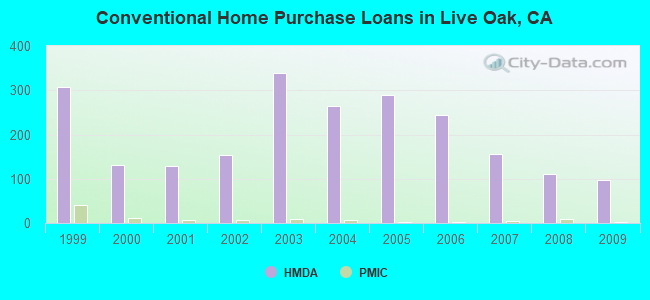
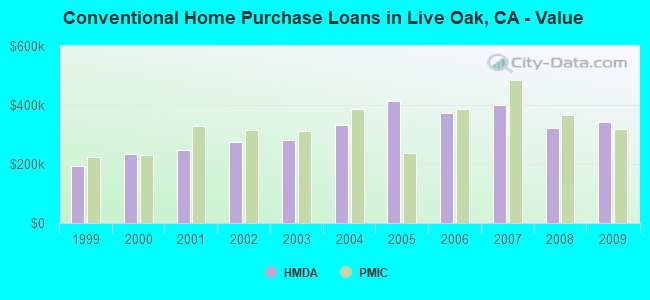
Home Mortgage Disclosure Act Aggregated Statistics For Year 2009(Based on 3 full and 2 partial tracts) A) FHA, FSA/RHS & VA B) Conventional C) Refinancings D) Home Improvement Loans F) Non-occupant Loans on G) Loans On Manufactured Number Average Value Number Average Value Number Average Value Number Average Value Number Average Value Number Average Value
LOANS ORIGINATED 29 $424,991 97 $342,473 414 $321,658 13 $239,575 45 $328,302 7 $127,921 APPLICATIONS APPROVED, NOT ACCEPTED 0 $0 10 $329,901 43 $372,933 0 $0 8 $352,625 0 $0 APPLICATIONS DENIED 4 $424,880 17 $324,261 104 $357,470 4 $185,835 12 $342,660 8 $152,236 APPLICATIONS WITHDRAWN 3 $480,287 9 $384,528 61 $376,076 2 $227,825 6 $377,345 2 $185,750 FILES CLOSED FOR INCOMPLETENESS 1 $239,000 3 $355,083 19 $370,141 0 $0 1 $416,360 1 $54,190
Aggregated Statistics For Year 2008(Based on 3 full and 2 partial tracts) A) FHA, FSA/RHS & VA B) Conventional C) Refinancings D) Home Improvement Loans E) Loans on Dwellings For 5+ Families F) Non-occupant Loans on G) Loans On Manufactured Number Average Value Number Average Value Number Average Value Number Average Value Number Average Value Number Average Value Number Average Value
LOANS ORIGINATED 9 $467,757 111 $322,007 166 $327,852 11 $321,892 2 $688,630 38 $337,777 28 $111,644 APPLICATIONS APPROVED, NOT ACCEPTED 1 $360,390 18 $348,251 39 $343,675 4 $221,180 0 $0 7 $360,964 3 $127,487 APPLICATIONS DENIED 3 $263,863 27 $342,126 90 $404,200 4 $143,288 3 $503,473 13 $348,572 13 $186,858 APPLICATIONS WITHDRAWN 1 $647,500 9 $448,481 24 $371,360 5 $245,868 0 $0 4 $357,508 0 $0 FILES CLOSED FOR INCOMPLETENESS 0 $0 4 $402,892 20 $348,594 3 $208,540 2 $746,440 0 $0 1 $182,100
Aggregated Statistics For Year 2007(Based on 3 full and 2 partial tracts) B) Conventional C) Refinancings D) Home Improvement Loans E) Loans on Dwellings For 5+ Families F) Non-occupant Loans on G) Loans On Manufactured Number Average Value Number Average Value Number Average Value Number Average Value Number Average Value Number Average Value
LOANS ORIGINATED 156 $400,693 274 $410,069 26 $303,800 1 $1,241,930 60 $423,105 22 $136,682 APPLICATIONS APPROVED, NOT ACCEPTED 26 $423,415 51 $431,619 7 $220,951 0 $0 9 $601,993 2 $333,200 APPLICATIONS DENIED 45 $385,352 136 $424,369 14 $212,941 0 $0 17 $411,177 9 $124,308 APPLICATIONS WITHDRAWN 11 $307,392 50 $403,439 2 $222,630 0 $0 4 $302,635 2 $159,550 FILES CLOSED FOR INCOMPLETENESS 4 $620,258 17 $336,957 0 $0 0 $0 3 $353,207 0 $0
Aggregated Statistics For Year 2006(Based on 3 full and 2 partial tracts) B) Conventional C) Refinancings D) Home Improvement Loans E) Loans on Dwellings For 5+ Families F) Non-occupant Loans on G) Loans On Manufactured Number Average Value Number Average Value Number Average Value Number Average Value Number Average Value Number Average Value
LOANS ORIGINATED 245 $372,269 380 $395,495 34 $334,773 2 $2,003,400 81 $411,904 38 $145,777 APPLICATIONS APPROVED, NOT ACCEPTED 50 $371,547 64 $371,992 5 $247,254 0 $0 12 $423,148 7 $108,201 APPLICATIONS DENIED 52 $372,713 123 $479,838 13 $177,093 1 $379,320 19 $572,297 8 $169,741 APPLICATIONS WITHDRAWN 30 $365,478 110 $375,678 3 $182,890 0 $0 13 $376,547 4 $176,055 FILES CLOSED FOR INCOMPLETENESS 6 $420,673 20 $381,286 3 $293,160 0 $0 0 $0 0 $0
Aggregated Statistics For Year 2005(Based on 3 full and 2 partial tracts) B) Conventional C) Refinancings D) Home Improvement Loans E) Loans on Dwellings For 5+ Families F) Non-occupant Loans on G) Loans On Manufactured Number Average Value Number Average Value Number Average Value Number Average Value Number Average Value Number Average Value
LOANS ORIGINATED 289 $412,245 493 $376,419 43 $361,254 3 $852,167 114 $376,834 24 $131,001 APPLICATIONS APPROVED, NOT ACCEPTED 33 $405,862 67 $365,178 5 $261,224 0 $0 9 $441,153 5 $122,638 APPLICATIONS DENIED 70 $375,263 124 $396,185 18 $279,067 0 $0 19 $305,228 6 $164,577 APPLICATIONS WITHDRAWN 48 $439,578 100 $345,642 13 $249,305 0 $0 19 $334,047 3 $91,890 FILES CLOSED FOR INCOMPLETENESS 8 $376,126 18 $426,961 2 $259,980 0 $0 2 $371,060 0 $0
Aggregated Statistics For Year 2004(Based on 3 full and 2 partial tracts) B) Conventional C) Refinancings D) Home Improvement Loans E) Loans on Dwellings For 5+ Families F) Non-occupant Loans on G) Loans On Manufactured Number Average Value Number Average Value Number Average Value Number Average Value Number Average Value Number Average Value
LOANS ORIGINATED 265 $333,467 510 $317,540 25 $220,729 3 $1,200,000 96 $315,151 34 $132,370 APPLICATIONS APPROVED, NOT ACCEPTED 26 $347,146 80 $301,846 2 $160,750 0 $0 9 $293,567 6 $128,165 APPLICATIONS DENIED 39 $417,867 113 $336,379 19 $148,453 2 $506,895 16 $433,094 7 $126,420 APPLICATIONS WITHDRAWN 39 $321,470 102 $320,969 7 $158,914 0 $0 8 $257,622 1 $187,320 FILES CLOSED FOR INCOMPLETENESS 6 $442,655 24 $313,186 1 $135,470 0 $0 2 $561,135 1 $232,230
Aggregated Statistics For Year 2003(Based on 3 full and 2 partial tracts) A) FHA, FSA/RHS & VA B) Conventional C) Refinancings D) Home Improvement Loans E) Loans on Dwellings For 5+ Families F) Non-occupant Loans on Number Average Value Number Average Value Number Average Value Number Average Value Number Average Value Number Average Value
LOANS ORIGINATED 1 $160,160 339 $282,183 1,293 $255,917 7 $36,354 6 $1,094,942 174 $253,740 APPLICATIONS APPROVED, NOT ACCEPTED 0 $0 34 $302,807 143 $257,776 3 $172,610 0 $0 12 $291,377 APPLICATIONS DENIED 0 $0 51 $267,068 176 $283,529 9 $60,301 0 $0 30 $304,385 APPLICATIONS WITHDRAWN 0 $0 37 $283,789 134 $292,578 1 $75,000 0 $0 14 $228,829 FILES CLOSED FOR INCOMPLETENESS 0 $0 5 $296,962 24 $280,518 0 $0 0 $0 4 $192,185
Aggregated Statistics For Year 2002(Based on 1 full and 1 partial tracts) B) Conventional C) Refinancings D) Home Improvement Loans F) Non-occupant Loans on Number Average Value Number Average Value Number Average Value Number Average Value
LOANS ORIGINATED 154 $274,771 364 $268,858 2 $91,950 51 $273,407 APPLICATIONS APPROVED, NOT ACCEPTED 11 $277,328 43 $277,437 3 $61,917 4 $280,238 APPLICATIONS DENIED 13 $227,307 38 $255,731 2 $33,550 7 $206,431 APPLICATIONS WITHDRAWN 15 $288,641 32 $263,900 2 $115,330 3 $212,927 FILES CLOSED FOR INCOMPLETENESS 2 $219,550 9 $272,590 0 $0 0 $0
Aggregated Statistics For Year 2001(Based on 1 full and 1 partial tracts) B) Conventional C) Refinancings D) Home Improvement Loans F) Non-occupant Loans on Number Average Value Number Average Value Number Average Value Number Average Value
LOANS ORIGINATED 128 $248,704 279 $246,235 15 $38,649 35 $233,730 APPLICATIONS APPROVED, NOT ACCEPTED 12 $204,150 35 $240,289 5 $75,218 4 $193,422 APPLICATIONS DENIED 27 $196,486 37 $248,117 6 $55,608 4 $252,750 APPLICATIONS WITHDRAWN 19 $256,444 36 $265,883 2 $28,950 7 $233,024 FILES CLOSED FOR INCOMPLETENESS 3 $156,600 14 $244,663 0 $0 0 $0
Aggregated Statistics For Year 2000(Based on 1 full and 1 partial tracts) A) FHA, FSA/RHS & VA B) Conventional C) Refinancings D) Home Improvement Loans E) Loans on Dwellings For 5+ Families F) Non-occupant Loans on Number Average Value Number Average Value Number Average Value Number Average Value Number Average Value Number Average Value
LOANS ORIGINATED 1 $112,370 130 $233,047 69 $220,561 12 $93,062 1 $1,231,920 20 $258,808 APPLICATIONS APPROVED, NOT ACCEPTED 0 $0 16 $214,925 8 $200,044 1 $29,950 0 $0 2 $290,620 APPLICATIONS DENIED 0 $0 29 $174,516 18 $196,761 2 $28,335 0 $0 3 $262,383 APPLICATIONS WITHDRAWN 0 $0 14 $192,433 9 $158,971 2 $28,600 0 $0 1 $425,520 FILES CLOSED FOR INCOMPLETENESS 0 $0 2 $285,650 6 $176,113 0 $0 0 $0 1 $180,250
Aggregated Statistics For Year 1999(Based on 1 full and 2 partial tracts) A) FHA, FSA/RHS & VA B) Conventional C) Refinancings D) Home Improvement Loans E) Loans on Dwellings For 5+ Families F) Non-occupant Loans on Number Average Value Number Average Value Number Average Value Number Average Value Number Average Value Number Average Value
LOANS ORIGINATED 5 $167,672 307 $192,623 352 $177,386 24 $40,980 4 $1,299,538 89 $184,838 APPLICATIONS APPROVED, NOT ACCEPTED 0 $0 61 $138,538 58 $153,070 7 $50,357 0 $0 10 $144,546 APPLICATIONS DENIED 0 $0 90 $146,032 85 $148,999 4 $34,550 0 $0 15 $192,337 APPLICATIONS WITHDRAWN 0 $0 35 $155,827 56 $168,023 0 $0 0 $0 12 $157,782 FILES CLOSED FOR INCOMPLETENESS 0 $0 4 $145,152 21 $182,462 0 $0 0 $0 1 $74,930
Detailed HMDA statistics for the following Tracts:
1213.00
, 1214.01 , 1214.02 , 1214.03 , 1217.00
Private Mortgage Insurance Companies Aggregated Statistics For Year 2009(Based on 3 full and 2 partial tracts) A) Conventional B) Refinancings C) Non-occupant Loans on Number Average Value Number Average Value Number Average Value
LOANS ORIGINATED 3 $317,023 0 $0 0 $0 APPLICATIONS APPROVED, NOT ACCEPTED 3 $356,620 1 $494,000 1 $365,150 APPLICATIONS DENIED 0 $0 0 $0 0 $0 APPLICATIONS WITHDRAWN 0 $0 1 $605,000 0 $0 FILES CLOSED FOR INCOMPLETENESS 0 $0 0 $0 0 $0
Aggregated Statistics For Year 2008(Based on 3 full and 2 partial tracts) A) Conventional B) Refinancings Number Average Value Number Average Value
LOANS ORIGINATED 10 $365,069 1 $509,400 APPLICATIONS APPROVED, NOT ACCEPTED 5 $359,298 1 $756,650 APPLICATIONS DENIED 2 $394,710 0 $0 APPLICATIONS WITHDRAWN 0 $0 0 $0 FILES CLOSED FOR INCOMPLETENESS 1 $293,000 0 $0
Aggregated Statistics For Year 2007(Based on 3 full and 2 partial tracts) A) Conventional B) Refinancings Number Average Value Number Average Value
LOANS ORIGINATED 4 $485,555 2 $399,165 APPLICATIONS APPROVED, NOT ACCEPTED 1 $557,740 0 $0 APPLICATIONS DENIED 0 $0 0 $0 APPLICATIONS WITHDRAWN 0 $0 0 $0 FILES CLOSED FOR INCOMPLETENESS 0 $0 0 $0
Aggregated Statistics For Year 2006(Based on 1 full and 2 partial tracts) A) Conventional B) Refinancings Number Average Value Number Average Value
LOANS ORIGINATED 3 $385,930 2 $411,215 APPLICATIONS APPROVED, NOT ACCEPTED 1 $199,070 0 $0 APPLICATIONS DENIED 0 $0 0 $0 APPLICATIONS WITHDRAWN 0 $0 0 $0 FILES CLOSED FOR INCOMPLETENESS 0 $0 0 $0
Aggregated Statistics For Year 2005(Based on 2 full and 1 partial tracts) A) Conventional B) Refinancings Number Average Value Number Average Value
LOANS ORIGINATED 2 $237,680 0 $0 APPLICATIONS APPROVED, NOT ACCEPTED 1 $152,130 1 $658,940 APPLICATIONS DENIED 0 $0 0 $0 APPLICATIONS WITHDRAWN 0 $0 0 $0 FILES CLOSED FOR INCOMPLETENESS 0 $0 0 $0
Aggregated Statistics For Year 2004(Based on 2 full and 2 partial tracts) A) Conventional B) Refinancings C) Non-occupant Loans on Number Average Value Number Average Value Number Average Value
LOANS ORIGINATED 6 $386,977 1 $571,490 1 $563,000 APPLICATIONS APPROVED, NOT ACCEPTED 1 $399,090 1 $139,750 0 $0 APPLICATIONS DENIED 0 $0 0 $0 0 $0 APPLICATIONS WITHDRAWN 0 $0 0 $0 0 $0 FILES CLOSED FOR INCOMPLETENESS 0 $0 0 $0 0 $0
Aggregated Statistics For Year 2003(Based on 3 full and 2 partial tracts) A) Conventional B) Refinancings Number Average Value Number Average Value
LOANS ORIGINATED 8 $311,326 6 $339,472 APPLICATIONS APPROVED, NOT ACCEPTED 1 $321,000 4 $343,235 APPLICATIONS DENIED 0 $0 0 $0 APPLICATIONS WITHDRAWN 0 $0 0 $0 FILES CLOSED FOR INCOMPLETENESS 0 $0 0 $0
Aggregated Statistics For Year 2002(Based on 1 full and 1 partial tracts) A) Conventional B) Refinancings Number Average Value Number Average Value
LOANS ORIGINATED 7 $314,997 2 $468,630 APPLICATIONS APPROVED, NOT ACCEPTED 0 $0 2 $342,445 APPLICATIONS DENIED 0 $0 0 $0 APPLICATIONS WITHDRAWN 1 $342,270 0 $0 FILES CLOSED FOR INCOMPLETENESS 0 $0 0 $0
Aggregated Statistics For Year 2001(Based on 1 full and 1 partial tracts) A) Conventional B) Refinancings Number Average Value Number Average Value
LOANS ORIGINATED 7 $328,523 2 $243,275 APPLICATIONS APPROVED, NOT ACCEPTED 4 $291,425 0 $0 APPLICATIONS DENIED 0 $0 0 $0 APPLICATIONS WITHDRAWN 0 $0 0 $0 FILES CLOSED FOR INCOMPLETENESS 0 $0 0 $0
Aggregated Statistics For Year 2000(Based on 1 full and 1 partial tracts) A) Conventional B) Refinancings C) Non-occupant Loans on Number Average Value Number Average Value Number Average Value
LOANS ORIGINATED 11 $230,105 5 $273,372 1 $189,730 APPLICATIONS APPROVED, NOT ACCEPTED 2 $254,785 1 $174,470 0 $0 APPLICATIONS DENIED 0 $0 0 $0 0 $0 APPLICATIONS WITHDRAWN 0 $0 0 $0 0 $0 FILES CLOSED FOR INCOMPLETENESS 0 $0 1 $191,630 0 $0
Aggregated Statistics For Year 1999(Based on 1 full and 2 partial tracts) A) Conventional B) Refinancings C) Non-occupant Loans on Number Average Value Number Average Value Number Average Value
LOANS ORIGINATED 40 $222,860 6 $195,783 0 $0 APPLICATIONS APPROVED, NOT ACCEPTED 8 $237,341 3 $197,037 1 $92,930 APPLICATIONS DENIED 2 $273,140 0 $0 0 $0 APPLICATIONS WITHDRAWN 2 $185,170 3 $193,487 0 $0 FILES CLOSED FOR INCOMPLETENESS 1 $241,320 1 $182,140 0 $0
Detailed PMIC statistics for the following Tracts:
1213.00
, 1214.01 , 1214.02 , 1214.03 , 1217.00 Live Oak compared to California state average:
Unemployed percentage significantly below state average. Black race population percentage significantly below state average. Median age above state average. Foreign-born population percentage below state average. Length of stay since moving in above state average. Percentage of population with a bachelor's degree or higher above state average.
#86 on the list of "Top 101 cities with largest percentage of males in occupations: food preparation and serving related occupations (population 5,000+)"
#94 on the list of "Top 101 cities with the largest percentage of likely lesbian couples (counted as self-reported female-female unmarried-partner households) (population 5,000+)"
#101 on the list of "Top 101 cities with the most residents born in Europe, n.e.c. (population 500+)"
#2 on the list of "Top 101 counties with the lowest number of infant deaths per 1000 residents 2007-2013 (pop. 50,000+)"
#6 on the list of "Top 101 counties with the largest decrease in the number of infant deaths per 1000 residents 2000-2006 to 2007-2013 (pop. 50,000+)"
#9 on the list of "Top 101 counties with highest percentage of residents voting for 3rd party candidates in the 2012 Presidential Election (pop. 50,000+)"
#24 on the list of "Top 101 counties with the lowest Ozone (1-hour) air pollution readings in 2012 (ppm)"
#27 on the list of "Top 101 counties with highest percentage of residents voting for Obama (Democrat) in the 2012 Presidential Election (pop. 50,000+)"
Top Patent Applicants
Qian Chen (1)
Jason Earl Sannar (1)
Jason E. Sannar (1)
Total of 3 patent applications in 2008-2024.


 Recent articles from our blog. Our writers, many of them Ph.D. graduates or candidates, create easy-to-read articles on a wide variety of topics.

 (2.6 miles
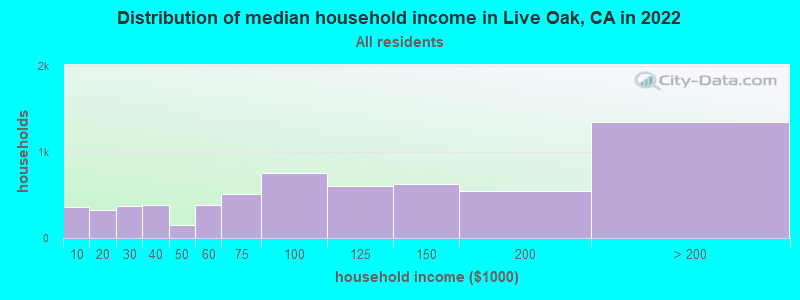


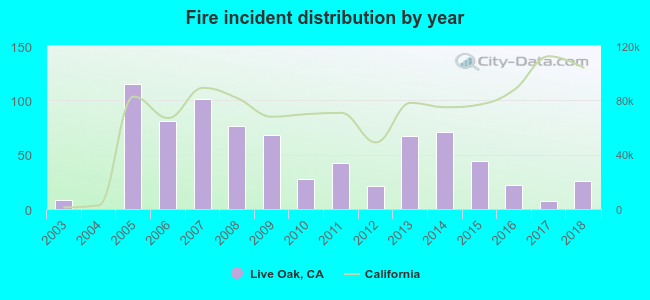 According to the data from the years 2003 - 2018 the average number of fires per year is 49. The highest number of fires - 115 took place in 2005, and the least - 0 in 2004. The data has a growing trend.
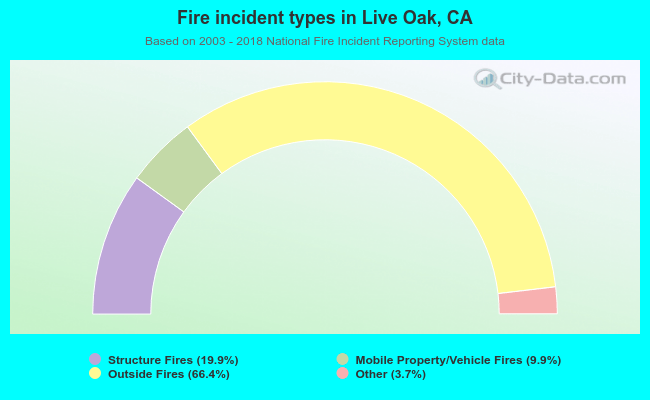 When looking into fire subcategories, the most incidents belonged to: Outside Fires (66.4%), and Structure Fires (19.9%).