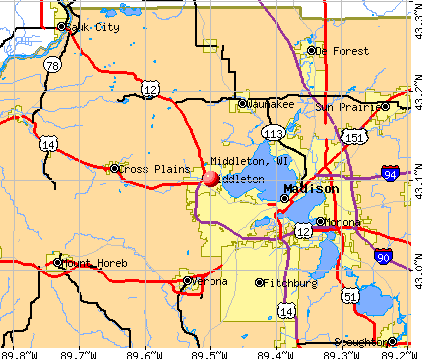
Middleton, Wisconsin

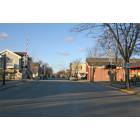
Middleton: House in the Woods in Middleton, WI
Middleton: Downtown Buildings

Middleton: Tiedemans Pond, Middleton WI
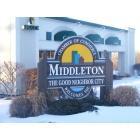
Middleton: Welcome To Middleton Wisconsin
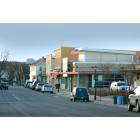
Middleton: Downtown Buildings

Middleton: St. Bernard's Cathlic Church
- add
your
Submit your own pictures of this city and show them to the world
- OSM Map
- General Map
- Google Map
- MSN Map
Population change since 2000: +41.6%
 |
| Males: 10,625 | |
| Females: 11,703 |
| Median resident age: | 38.7 years |
| Wisconsin median age: | 40.4 years |
Zip codes: 53562.
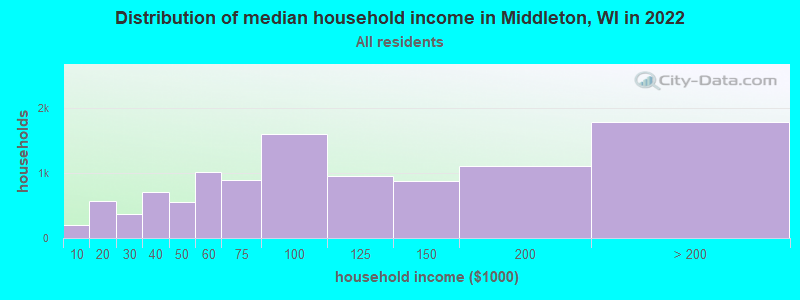
| Middleton: | $87,886 |
| WI: | $70,996 |
Estimated per capita income in 2022: $61,509 (it was $29,464 in 2000)
Middleton city income, earnings, and wages data
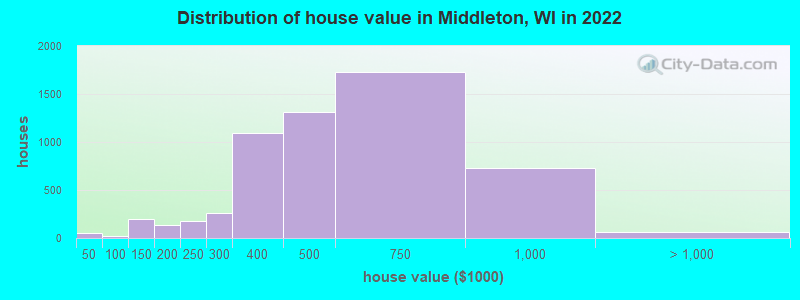
Estimated median house or condo value in 2022: $477,849 (it was $171,300 in 2000)
| Middleton: | $477,849 |
| WI: | $252,800 |
Mean prices in 2022: all housing units: $490,615; detached houses: $545,588; townhouses or other attached units: $417,145; in 2-unit structures: $420,437; in 3-to-4-unit structures: $171,236; in 5-or-more-unit structures: $290,459
Median gross rent in 2022: $1,315.
(4.9% for White Non-Hispanic residents, 50.1% for Black residents, 13.0% for Hispanic or Latino residents, 11.4% for two or more races residents)
Detailed information about poverty and poor residents in Middleton, WI


Compare current foreclosures near Middleton, WI:
| Photo | Address | Area | Beds / Baths | Price | Details |
|---|---|---|---|---|---|

|
#1
Century Ave
Middleton, WI 53562
|
- sq. feet
|
- baths - beds |
show details | |

|
#2
Old Sauk Rd Apt 222
Middleton, WI 53562
|
- sq. feet
|
- baths - beds |
show details | |

|
#3
Parmenter St # 323
Middleton, WI 53562
|
- sq. feet
|
- baths - beds |
show details | |

|
#4
Greenway Blvd Apt 412
Middleton, WI 53562
|
- sq. feet
|
- baths - beds |
show details | |

|
#5
Parmenter St Apt 5
Middleton, WI 53562
|
- sq. feet
|
- baths - beds |
show details | |

|
#6
Webber Rd Apt 4
Middleton, WI 53562
|
- sq. feet
|
- baths - beds |
show details | |

|
#7
Perch Park
Middleton, WI 53562
|
- sq. feet
|
- baths - beds |
show details | |

|
#8
Pheasant Ln Apt 215
Middleton, WI 53562
|
- sq. feet
|
- baths - beds |
show details | |

|
#9
Salerno Ct Apt 5
Middleton, WI 53562
|
- sq. feet
|
- baths - beds |
show details | |

|
#10
Pheasant Ln Apt 203
Middleton, WI 53562
|
- sq. feet
|
- baths - beds |
show details |
| Photo | Address | Area | Beds / Baths | Price | Details |
|---|---|---|---|---|---|

|
#11
South Ave Apt 6
Middleton, WI 53562
|
- sq. feet
|
- baths - beds |
show details | |

|
#12
Market St # 301
Middleton, WI 53562
|
- sq. feet
|
- baths - beds |
show details | |

|
#13
Brindisi Ct Apt 6
Middleton, WI 53562
|
- sq. feet
|
- baths - beds |
show details | |

|
#14
Sweeney Dr Apt 1
Middleton, WI 53562
|
- sq. feet
|
- baths - beds |
show details | |

|
#15
Milano Ct Apt 1
Middleton, WI 53562
|
- sq. feet
|
- baths - beds |
show details | |

|
#16
Pleasant View Rd # 102
Middleton, WI 53562
|
- sq. feet
|
- baths - beds |
show details | |

|
#17
Pheasant Ln
Middleton, WI 53562
|
- sq. feet
|
- baths - beds |
show details | |

|
#18
Century Ave
Middleton, WI 53562
|
- sq. feet
|
- baths - beds |
show details | |

|
#19
Red Oak Ct
Middleton, WI 53562
|
- sq. feet
|
- baths - beds |
show details | |

|
#20
Shorecrest Dr
Middleton, WI 53562
|
- sq. feet
|
- baths - beds |
show details |
| Photo | Address | Area | Beds / Baths | Price | Details |
|---|---|---|---|---|---|

|
#21
Black Opal Ave
Middleton, WI 53562
|
- sq. feet
|
- baths - beds |
show details | |

|
#22
Evergreen Rd
Middleton, WI 53562
|
- sq. feet
|
- baths - beds |
show details | |

|
#23
Tarragon Dr
Madison, WI 53716
|
1,444 sq. feet
|
2 baths 4 beds |
show details | |

|
#24
Calico Ln
Sun Prairie, WI 53590
|
- sq. feet
|
2 baths 3 beds |
show details | |

|
#25
S Burr Oak Ave
Oregon, WI 53575
|
- sq. feet
|
- baths - beds |
show details | |

|
#26
Meadow View Rd Apt 1
Mount Horeb, WI 53572
|
- sq. feet
|
- baths - beds |
show details | |

|
#27
E Cheryl Pkwy Apt 307
Madison, WI 53711
|
- sq. feet
|
- baths - beds |
show details | |

|
#28
Paoli St Apt 203
Verona, WI 53593
|
- sq. feet
|
- baths - beds |
show details | |

|
#29
E Cheryl Pkwy Unit 123
Madison, WI 53711
|
- sq. feet
|
- baths - beds |
show details | |

|
#30
Delaware Dr Apt 4
Sun Prairie, WI 53590
|
- sq. feet
|
- baths - beds |
show details |
| Photo | Address | Area | Beds / Baths | Price | Details |
|---|---|---|---|---|---|

|
#31
Janesville St # 101
Oregon, WI 53575
|
- sq. feet
|
- baths - beds |
show details | |

|
#32
Wright St # 106
Madison, WI 53704
|
- sq. feet
|
- baths - beds |
show details | |

|
#33
Hollywood Dr
Madison, WI 53713
|
- sq. feet
|
- baths - beds |
show details | |

|
#34
Mayfair Ave Apt 2
Madison, WI 53714
|
- sq. feet
|
- baths - beds |
show details | |

|
#35
Sunfield St
Sun Prairie, WI 53590
|
- sq. feet
|
- baths - beds |
show details | |

|
#36
Westgate Rd
Madison, WI 53716
|
- sq. feet
|
- baths - beds |
show details | |

|
#37
Park Cir
Sun Prairie, WI 53590
|
- sq. feet
|
- baths - beds |
show details | |

|
#38
Kinsman Blvd
Madison, WI 53704
|
- sq. feet
|
- baths - beds |
show details | |

|
#39
Effingham Way Apt 216
Sun Prairie, WI 53590
|
- sq. feet
|
- baths - beds |
show details | |

|
#40
Onsgard Rd Apt 4
Madison, WI 53704
|
- sq. feet
|
- baths - beds |
show details |
| Photo | Address | Area | Beds / Baths | Price | Details |
|---|---|---|---|---|---|

|
#41
Linnerud Dr Apt 306
Sun Prairie, WI 53590
|
- sq. feet
|
- baths - beds |
show details | |

|
#42
County Road Ab
Mc Farland, WI 53558
|
- sq. feet
|
- baths - beds |
show details | |

|
#43
Pirate Island Rd Apt 202
Madison, WI 53716
|
- sq. feet
|
- baths - beds |
show details | |

|
#44
Milwaukee St Unit 7605
Madison, WI 53707
|
- sq. feet
|
- baths - beds |
show details | |

|
#45
Goucher Ln
Madison, WI 53716
|
- sq. feet
|
- baths - beds |
show details | |

|
#46
N Walbridge Ave Apt 215
Madison, WI 53714
|
- sq. feet
|
- baths - beds |
show details | |

|
#47
Sassafras Dr # 210
Madison, WI 53711
|
- sq. feet
|
- baths - beds |
show details | |

|
#48
Huntington Dr
Sun Prairie, WI 53590
|
- sq. feet
|
- baths - beds |
show details | |

|
#49
Garden Dr Apt 14
Sun Prairie, WI 53590
|
- sq. feet
|
- baths - beds |
show details | |

|
Check over 1 million property listings on Foreclosure.com!
|
browse all offers | |||


- 17,24077.7%White alone
- 1,7948.1%Hispanic
- 1,2715.7%Asian alone
- 1,1125.0%Two or more races
- 6903.1%Black alone
- 540.2%American Indian alone
- 410.2%Other race alone
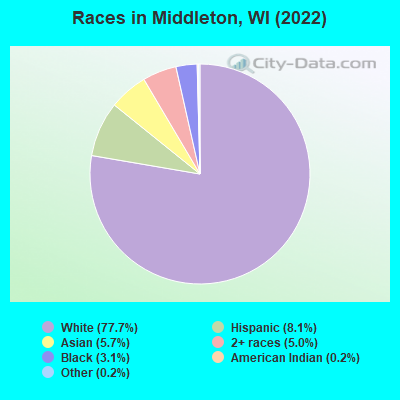
Races in Middleton detailed stats: ancestries, foreign born residents, place of birth
According to our research of Wisconsin and other state lists, there were 22 registered sex offenders living in Middleton, Wisconsin as of June 16, 2024.
The ratio of all residents to sex offenders in Middleton is 874 to 1.
The ratio of registered sex offenders to all residents in this city is lower than the state average.
Type |
2009 |
2010 |
2011 |
2012 |
2013 |
2014 |
2015 |
2016 |
2017 |
2018 |
2019 |
2020 |
2021 |
2022 |
|---|---|---|---|---|---|---|---|---|---|---|---|---|---|---|
| Murders (per 100,000) | 0 (0.0) | 0 (0.0) | 0 (0.0) | 0 (0.0) | 0 (0.0) | 0 (0.0) | 0 (0.0) | 0 (0.0) | 1 (5.2) | 0 (0.0) | 0 (0.0) | 0 (0.0) | 0 (0.0) | 0 (0.0) |
| Rapes (per 100,000) | 2 (12.3) | 3 (17.2) | 1 (5.7) | 4 (22.5) | 2 (10.9) | 1 (5.4) | 1 (5.3) | 0 (0.0) | 5 (25.8) | 2 (10.0) | 2 (10.0) | 2 (9.8) | 8 (39.1) | 3 (12.9) |
| Robberies (per 100,000) | 8 (49.1) | 10 (57.3) | 6 (34.3) | 8 (45.0) | 3 (16.3) | 7 (37.5) | 4 (21.1) | 4 (20.8) | 5 (25.8) | 9 (45.1) | 5 (24.9) | 2 (9.8) | 4 (19.5) | 1 (4.3) |
| Assaults (per 100,000) | 6 (36.8) | 5 (28.7) | 9 (51.4) | 5 (28.1) | 3 (16.3) | 4 (21.5) | 4 (21.1) | 4 (20.8) | 5 (25.8) | 41 (205.3) | 5 (24.9) | 8 (39.4) | 26 (127.0) | 15 (64.3) |
| Burglaries (per 100,000) | 59 (362.3) | 58 (332.5) | 73 (416.7) | 86 (483.9) | 50 (272.0) | 35 (187.7) | 36 (190.0) | 28 (145.4) | 37 (191.0) | 39 (195.3) | 43 (214.2) | 22 (108.3) | 33 (161.2) | 13 (55.7) |
| Thefts (per 100,000) | 305 (1,873) | 346 (1,984) | 377 (2,152) | 329 (1,851) | 283 (1,539) | 238 (1,276) | 231 (1,219) | 221 (1,147) | 236 (1,218) | 218 (1,092) | 202 (1,006) | 176 (866.1) | 199 (972.1) | 185 (792.4) |
| Auto thefts (per 100,000) | 10 (61.4) | 11 (63.1) | 11 (62.8) | 8 (45.0) | 7 (38.1) | 12 (64.4) | 8 (42.2) | 6 (31.1) | 9 (46.5) | 19 (95.1) | 23 (114.6) | 22 (108.3) | 24 (117.2) | 23 (98.5) |
| Arson (per 100,000) | 2 (12.3) | 1 (5.7) | 1 (5.7) | 0 (0.0) | 0 (0.0) | 0 (0.0) | 0 (0.0) | 0 (0.0) | 0 (0.0) | 0 (0.0) | 0 (0.0) | 0 (0.0) | 1 (4.9) | 0 (0.0) |
| City-Data.com crime index | 137.1 | 144.4 | 145.4 | 148.6 | 100.5 | 89.2 | 80.2 | 68.9 | 109.7 | 127.5 | 84.8 | 69.6 | 122.1 | 67.9 |
The City-Data.com crime index weighs serious crimes and violent crimes more heavily. Higher means more crime, U.S. average is 246.1. It adjusts for the number of visitors and daily workers commuting into cities.
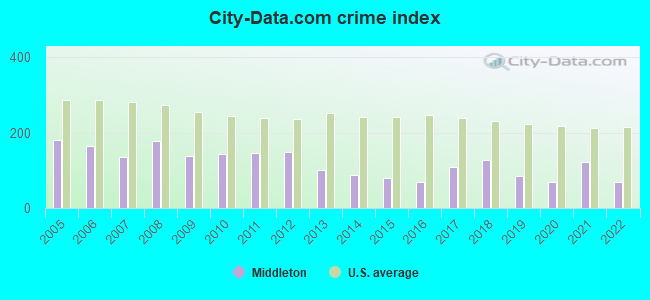
Crime rate in Middleton detailed stats: murders, rapes, robberies, assaults, burglaries, thefts, arson
Full-time law enforcement employees in 2021, including police officers: 47 (38 officers - 31 male; 7 female).
| Officers per 1,000 residents here: | 1.86 |
| Wisconsin average: | 2.07 |
 Recent articles from our blog. Our writers, many of them Ph.D. graduates or candidates, create easy-to-read articles on a wide variety of topics.

 | Clark Street Community School in Middleton? (2 replies) |
| Regret moving to Middleton! (39 replies) |
| Monona Grove HS vs West HS vs Middleton HS (3 replies) |
| Middleton railroad (1 reply) |
| Waunakee, Middleton, or Madison (16 replies) |
| Talk to me about what you love about Madison... (55 replies) |
Latest news from Middleton, WI collected exclusively by city-data.com from local newspapers, TV, and radio stations
Ancestries: German (23.0%), Irish (9.8%), English (5.1%), European (4.6%), Norwegian (4.5%), Polish (2.9%).
Current Local Time: CST time zone
Incorporated in 1963
Elevation: 940 feet
Land area: 8.07 square miles.
Population density: 2,765 people per square mile (average).
1,617 residents are foreign born (2.9% Asia, 2.7% Latin America, 1.5% Europe).
| This city: | 7.3% |
| Wisconsin: | 5.0% |
Median real estate property taxes paid for housing units with mortgages in 2022: $6,899 (1.5%)
Median real estate property taxes paid for housing units with no mortgage in 2022: $7,096 (1.5%)
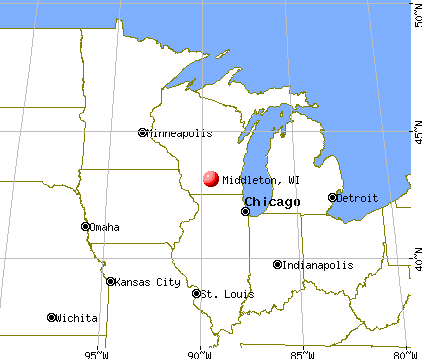
Nearest city with pop. 50,000+: Madison, WI  (5.6 miles , pop. 208,054).
Nearest city with pop. 1,000,000+: Chicago, IL (127.4 miles , pop. 2,896,016).
Nearest cities:
), ), ), Latitude: 43.10 N, Longitude: 89.50 W
Daytime population change due to commuting: +7,600 (+34.3%)
Workers who live and work in this city: 4,419 (36.6%)
Area code: 608

Middleton, Wisconsin accommodation & food services, waste management - Economy and Business Data
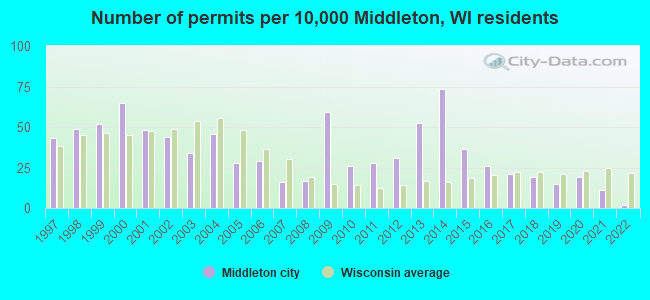
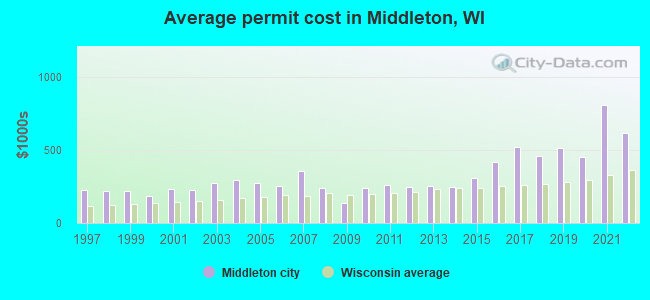
Single-family new house construction building permits:
- 2022: 3 buildings, average cost: $617,500
- 2021: 18 buildings, average cost: $809,600
- 2020: 30 buildings, average cost: $449,800
- 2019: 23 buildings, average cost: $514,500
- 2018: 30 buildings, average cost: $459,900
- 2017: 33 buildings, average cost: $520,800
- 2016: 41 buildings, average cost: $419,000
- 2015: 57 buildings, average cost: $310,600
- 2014: 116 buildings, average cost: $247,400
- 2013: 83 buildings, average cost: $250,900
- 2012: 49 buildings, average cost: $247,500
- 2011: 44 buildings, average cost: $258,700
- 2010: 41 buildings, average cost: $237,100
- 2009: 93 buildings, average cost: $135,700
- 2008: 26 buildings, average cost: $242,700
- 2007: 25 buildings, average cost: $355,800
- 2006: 46 buildings, average cost: $254,700
- 2005: 44 buildings, average cost: $275,300
- 2004: 72 buildings, average cost: $293,800
- 2003: 54 buildings, average cost: $276,200
- 2002: 69 buildings, average cost: $228,300
- 2001: 76 buildings, average cost: $235,900
- 2000: 102 buildings, average cost: $181,900
- 1999: 82 buildings, average cost: $222,200
- 1998: 77 buildings, average cost: $221,600
- 1997: 68 buildings, average cost: $224,600
| Here: | 2.0% |
| Wisconsin: | 2.7% |
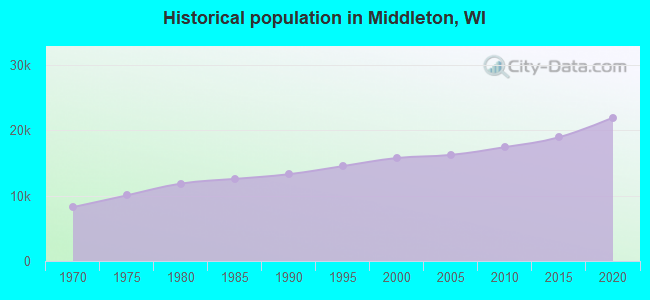
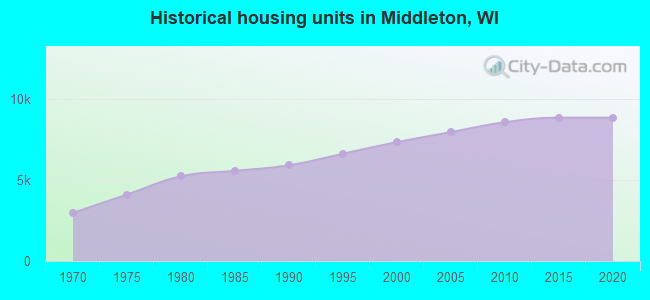
Population change in the 1990s: +1,861 (+13.4%).
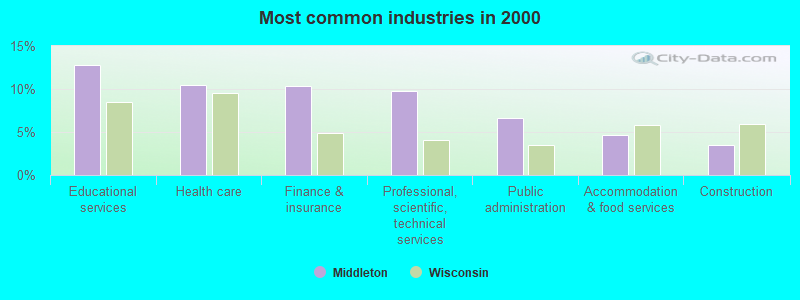
- Educational services (12.8%)
- Health care (10.5%)
- Finance & insurance (10.4%)
- Professional, scientific, technical services (9.8%)
- Public administration (6.6%)
- Accommodation & food services (4.7%)
- Construction (3.5%)
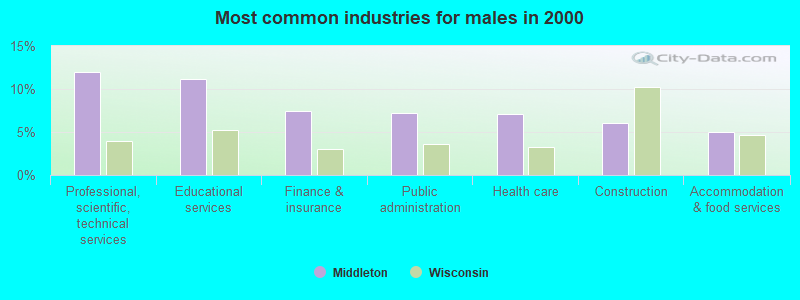
- Professional, scientific, technical services (11.9%)
- Educational services (11.2%)
- Finance & insurance (7.4%)
- Public administration (7.2%)
- Health care (7.1%)
- Construction (6.0%)
- Accommodation & food services (5.0%)
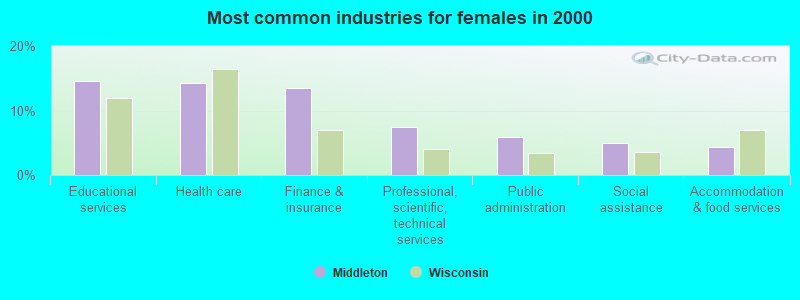
- Educational services (14.5%)
- Health care (14.2%)
- Finance & insurance (13.5%)
- Professional, scientific, technical services (7.5%)
- Public administration (5.9%)
- Social assistance (4.9%)
- Accommodation & food services (4.3%)

- Other management occupations, except farmers and farm managers (5.1%)
- Computer specialists (4.5%)
- Other office and administrative support workers, including supervisors (4.3%)
- Other sales and related occupations, including supervisors (4.2%)
- Postsecondary teachers (3.1%)
- Sales representatives, services, wholesale and manufacturing (3.0%)
- Secretaries and administrative assistants (2.7%)

- Computer specialists (6.2%)
- Other management occupations, except farmers and farm managers (6.0%)
- Other sales and related occupations, including supervisors (4.1%)
- Electrical equipment mechanics and other installation, maintenance, and repair workers, including supervisors (3.9%)
- Top executives (3.8%)
- Postsecondary teachers (3.7%)
- Sales representatives, services, wholesale and manufacturing (3.3%)

- Other office and administrative support workers, including supervisors (5.8%)
- Secretaries and administrative assistants (5.2%)
- Preschool, kindergarten, elementary, and middle school teachers (4.6%)
- Other sales and related occupations, including supervisors (4.3%)
- Other management occupations, except farmers and farm managers (4.2%)
- Registered nurses (3.9%)
- Customer service representatives (3.4%)
Average climate in Middleton, Wisconsin
Based on data reported by over 4,000 weather stations


|
|


(lower is better)
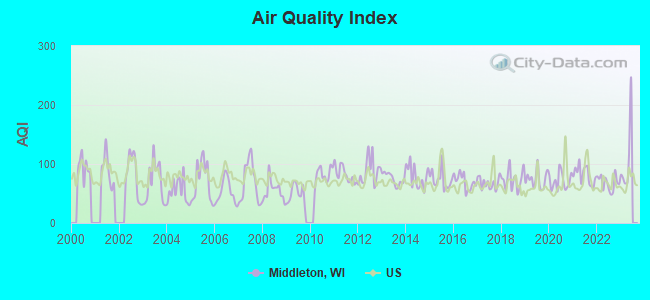
Air Quality Index (AQI) level in 2022 was 68.0. This is about average.
| City: | 68.0 |
| U.S.: | 72.6 |
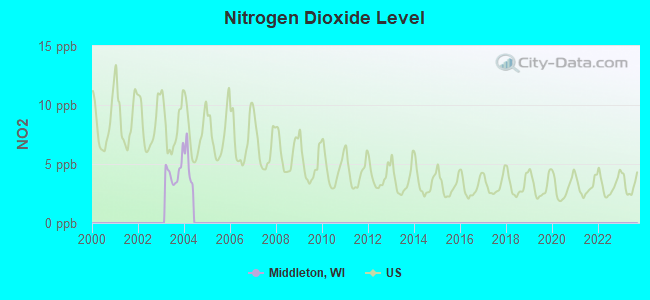
Nitrogen Dioxide (NO2) [ppb] level in 2003 was 4.36. This is about average. Closest monitor was 6.3 miles away from the city center.
| City: | 4.36 |
| U.S.: | 5.11 |
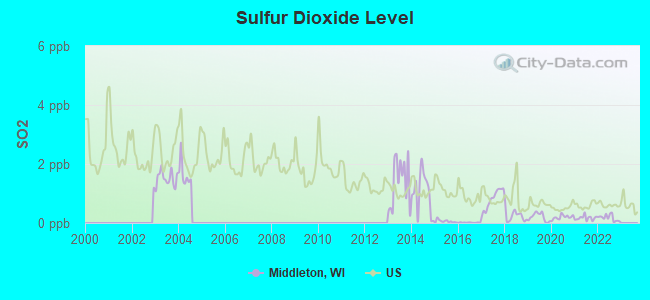
Sulfur Dioxide (SO2) [ppb] level in 2022 was 0.176. This is significantly better than average. Closest monitor was 5.3 miles away from the city center.
| City: | 0.176 |
| U.S.: | 1.515 |
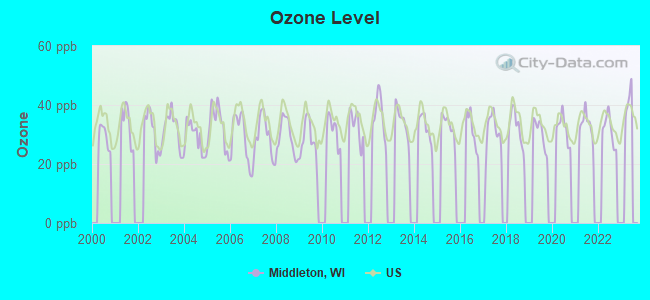
Ozone [ppb] level in 2022 was 31.6. This is about average. Closest monitor was 4.9 miles away from the city center.
| City: | 31.6 |
| U.S.: | 33.3 |
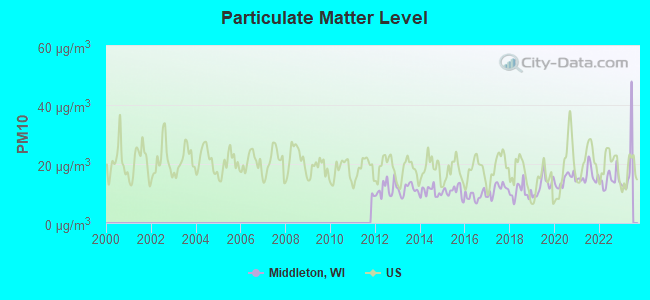
Particulate Matter (PM10) [µg/m3] level in 2022 was 14.7. This is better than average. Closest monitor was 3.8 miles away from the city center.
| City: | 14.7 |
| U.S.: | 19.2 |
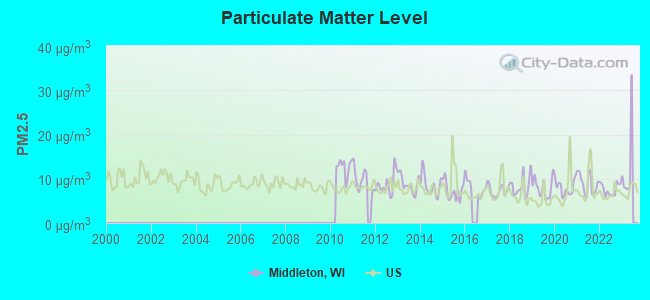
Particulate Matter (PM2.5) [µg/m3] level in 2022 was 7.61. This is about average. Closest monitor was 6.3 miles away from the city center.
| City: | 7.61 |
| U.S.: | 8.11 |
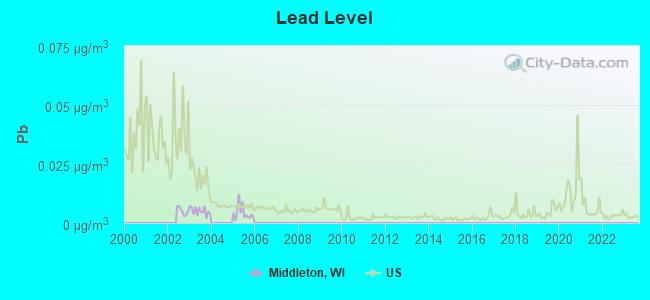
Lead (Pb) [µg/m3] level in 2005 was 0.00428. This is significantly better than average. Closest monitor was 5.3 miles away from the city center.
| City: | 0.00428 |
| U.S.: | 0.00931 |
Tornado activity:
Middleton-area historical tornado activity is above Wisconsin state average. It is 72% greater than the overall U.S. average.
On 6/7/1984, a category F5 (max. wind speeds 261-318 mph) tornado 12.4 miles away from the Middleton city center killed 9 people and injured 200 people and caused between $50,000 and $500,000 in damages.
On 8/2/1967, a category F3 (max. wind speeds 158-206 mph) tornado 3.2 miles away from the city center killed 2 people and injured 5 people and caused between $5000 and $50,000 in damages.
Earthquake activity:
Middleton-area historical earthquake activity is significantly above Wisconsin state average. It is 38% greater than the overall U.S. average.On 4/18/2008 at 09:36:59, a magnitude 5.4 (5.1 MB, 4.8 MS, 5.4 MW, 5.2 MW, Class: Moderate, Intensity: VI - VII) earthquake occurred 332.5 miles away from the city center
On 6/28/2004 at 06:10:52, a magnitude 4.2 (4.2 MW, Depth: 6.2 mi, Class: Light, Intensity: IV - V) earthquake occurred 117.6 miles away from the city center
On 6/10/1987 at 23:48:54, a magnitude 5.1 (4.9 MB, 4.4 MS, 4.6 MS, 5.1 LG) earthquake occurred 307.8 miles away from Middleton center
On 4/18/2008 at 09:36:59, a magnitude 5.2 (5.2 MW, Depth: 8.9 mi) earthquake occurred 332.5 miles away from the city center
On 2/10/2010 at 09:59:35, a magnitude 3.8 (3.8 MW, Depth: 6.2 mi, Class: Light, Intensity: II - III) earthquake occurred 93.5 miles away from Middleton center
On 5/2/2015 at 16:23:07, a magnitude 4.2 (4.2 MW, Depth: 2.8 mi) earthquake occurred 215.5 miles away from the city center
Magnitude types: regional Lg-wave magnitude (LG), body-wave magnitude (MB), surface-wave magnitude (MS), moment magnitude (MW)
Natural disasters:
The number of natural disasters in Dane County (18) is near the US average (15).Major Disasters (Presidential) Declared: 13
Emergencies Declared: 4
Causes of natural disasters: Storms: 12, Floods: 9, Tornadoes: 8, Winds: 2, Winter Storms: 2, Drought: 1, Hurricane: 1, Landslide: 1, Snow: 1, Snowstorm: 1, Other: 1 (Note: some incidents may be assigned to more than one category).

Main business address for: BONE CARE INTERNATIONAL INC (PHARMACEUTICAL PREPARATIONS).
Hospitals and medical centers in Middleton:
Airports located in Middleton:
- Middleton Municipal - Morey Field Airport (C29) (Runways: 2, Air Taxi Ops: 2,500, Itinerant Ops: 13,000, Local Ops: 25,000, Military Ops: 10)
College/University in Middleton:
Colleges/universities with over 2000 students nearest to Middleton:
- Edgewood College (about 5 miles; Madison, WI; Full-time enrollment: 2,455)
- University of Wisconsin-Madison (about 6 miles; Madison, WI; FT enrollment: 34,621)
- University of Wisconsin Colleges (about 6 miles; Madison, WI; FT enrollment: 10,019)
- Madison Area Technical College (about 9 miles; Madison, WI; FT enrollment: 9,603)
- Herzing University-Madison (about 11 miles; Madison, WI; FT enrollment: 3,160)
- University of Wisconsin-Whitewater (about 43 miles; Whitewater, WI; FT enrollment: 11,124)
- University of Wisconsin-Platteville (about 57 miles; Platteville, WI; FT enrollment: 7,679)
Public high schools in Middleton:
- MIDDLETON HIGH (Students: 1,879, Location: 2100 BRISTOL ST, Grades: 9-12)
- 21ST CENTURY ESCHOOL (Students: 79, Location: 2429 CLARK ST, Grades: KG-12, Charter school)
- CLARK STREET COMMUNITY SCHOOL (Location: 2429 CLARK ST, Grades: 9-12, Charter school)
Public elementary/middle schools in Middleton:
- KROMREY MIDDLE (Students: 733, Location: 7009 DONNA DR, Grades: 5-8)
- ELM LAWN ELEMENTARY (Students: 540, Location: 6701 WOODGATE RD, Grades: PK-4)
- SUNSET RIDGE ELEMENTARY (Students: 529, Location: 8686 AIRPORT RD, Grades: PK-4)
- NORTHSIDE ELEMENTARY (Students: 471, Location: 3620 HIGH RD, Grades: PK-4)
- SAUK TRAIL ELEMENTARY (Students: 391, Location: 2205 BRANCH ST, Grades: PK-4)
Private elementary/middle schools in Middleton:
Library in Middleton:
- MIDDLETON PUBLIC LIBRARY (Operating income: $1,644,667; Location: 7425 HUBBARD AVE.; 95,746 books; 8,370 e-books; 10,678 audio materials; 9,892 video materials; 1 local licensed databases; 28 state licensed databases; 10 other licensed databases; 248 print serial subscriptions; 1 electronic serial subscriptions)
Points of interest:
Notable locations in Middleton: Pleasant View Golf Club (A), Middleton Public Library (B), Middleton City Hall (C), City of Middleton Emergency Medical Services (D), Middleton Fire District Station 1 (E). Display/hide their locations on the map
Shopping Centers: Middleton Springs Shopping Center (1), Mid-Town Shopping Center (2). Display/hide their locations on the map
Main business address in Middleton: BONE CARE INTERNATIONAL INC (A). Display/hide its location on the map
Churches in Middleton include: Middleton Community Church (A), Saint Andrews Lutheran Church (B), Saint Bernards Catholic Church (C), Saint Dunstans Episcopal Church (D), Saint Lukes Lutheran Church (E). Display/hide their locations on the map
Cemetery: Saint Bernards Cemetery (1). Display/hide its location on the map
Lakes: Tiedemans Pond (A), Strickers Pond (B), Graber Pond (C), Esser Pond (D). Display/hide their locations on the map
Streams, rivers, and creeks: Pheasant Branch (A). Display/hide its location on the map
Parks in Middleton include: Baskerville Park (1), Firemans Park (2), Hawkridge Park (3), Lakeview Community Park (4), Meadow Park (5), Orchid Heights Park (6), Parisi Park (7), Parkside Heights Park (8), Stonefield Park (9). Display/hide their locations on the map
Tourist attractions: Middleton Area Historical Society (Cultural Attractions- Events- & Facilities; 7410 Hubbard Avenue), Middleton City - Administrator (Cultural Attractions- Events- & Facilities; 7426 Hubbard Avenue), Capitol Ice Arena (Amusement & Theme Parks; 2616 Pleasant View Road), Middleton Tourism Commission (1811 Parmenter Street), Mad City Rentals LLC (Tours & Charters; 5227 US Highway 12).
Hotels: Farifield Inn & Suites by Marriott-Mdsn WST Mddltn (8212 Greenway Boulevard), Country Inn Ste Madison West (2212 Deming Way), Country Inn & Suites by Carlson (2212 Deming Way), Colonial Motel (3001 West Beltline Highway), Marriott Madison West (1313 John Q Hammons Drive).
Birthplace of: Casey Cramer - 2005 NFL player (Carolina Panthers, born: Jan 5, 1982), Jon Erpenbach - Politician, Aaron Hohlbein - Soccer player, Nick Toon - Football player.
Drinking water stations with addresses in Middleton and their reported violations in the past:
KNOLLCREST (Address: 2249 PINEHURST DR , Population served: 66, Groundwater):Past health violations:SILK EXOTIC (Population served: 45, Groundwater):Past monitoring violations:
- MCL, Average - Between JAN-2011 and JUN-2011, Contaminant: Di(2-ethylhexyl) phthalate. Follow-up actions: St Public Notif requested (MAR-25-2011), St Other (MAR-25-2011), St Violation/Reminder Notice (MAR-25-2011), St Public Notif issued (APR-01-2011), St Public Notif received (APR-04-2011), St Compliance achieved (JUN-29-2011)
- MCL, Average - Between OCT-2010 and JUN-2011, Contaminant: Di(2-ethylhexyl) phthalate. Follow-up actions: St Public Notif requested (NOV-29-2010), St Violation/Reminder Notice (NOV-29-2010), St Other (NOV-29-2010), St Public Notif issued (DEC-01-2010), St Public Notif received (DEC-01-2010), St Compliance achieved (JUN-29-2011)
- MCL, Average - Between JUL-2010 and JUN-2011, Contaminant: Di(2-ethylhexyl) phthalate. Follow-up actions: St Public Notif requested (SEP-07-2010), St Violation/Reminder Notice (SEP-07-2010), St Other (SEP-07-2010), St Public Notif issued (SEP-10-2010), St Public Notif received (SEP-10-2010), St Compliance achieved (JUN-29-2011)
- MCL, Average - Between APR-2010 and JUN-2011, Contaminant: Di(2-ethylhexyl) phthalate. Follow-up actions: St Violation/Reminder Notice (JUL-08-2010), St Public Notif requested (JUL-08-2010), St Site Visit (enforcement) (JUL-08-2010), St Public Notif issued (JUL-22-2010), St Public Notif received (JUL-22-2010), St Violation/Reminder Notice (SEP-07-2010), St Public Notif requested (SEP-07-2010), St Violation/Reminder Notice (NOV-29-2010), St Public Notif received (DEC-01-2010), St Public Notif issued (DEC-01-2010), St Violation/Reminder Notice (MAR-25-2011), St Public Notif requested (MAR-25-2011), St Public Notif issued (APR-01-2011), St Public Notif received (APR-04-2011), St Compliance achieved (JUN-29-2011)
- Follow-up Or Routine LCR Tap M/R - In JAN-01-2005, Contaminant: Lead and Copper Rule. Follow-up actions: St Compliance achieved (FEB-06-2006), St Public Notif requested (FEB-13-2006), St Violation/Reminder Notice (FEB-13-2006), St Public Notif issued (FEB-21-2006), St Public Notif received (FEB-27-2006)
Past health violations:
- MCL, Monthly (TCR) - In SEP-2010, Contaminant: Coliform. Follow-up actions: St Public Notif requested (SEP-21-2010), St Boil Water Order (SEP-21-2010), St Violation/Reminder Notice (SEP-21-2010), St Public Notif received (SEP-27-2010), St Compliance achieved (SEP-29-2010)
Drinking water stations with addresses in Middleton that have no violations reported:
- OLSON TOON LANDSCAPING (Population served: 90, Primary Water Source Type: Groundwater)
- PEACE THROUGH CHRIST LUTHERAN CHURCH (Population served: 76, Primary Water Source Type: Groundwater)
- PDQ FOOD STORE 357 (Population served: 54, Primary Water Source Type: Groundwater)
- TOWN & COUNTRY MART (Population served: 29, Primary Water Source Type: Groundwater)
- SPRINGFIELD MOBIL (Population served: 27, Primary Water Source Type: Groundwater)
- NORTHERN LIGHT CHURCH (Population served: 25, Primary Water Source Type: Groundwater)
- LOST LAND LAKE LODGE CABIN ASSOCIATION (Population served: 25, Primary Water Source Type: Groundwater)
| This city: | 2.2 people |
| Wisconsin: | 2.4 people |
| This city: | 55.4% |
| Whole state: | 64.4% |
| This city: | 7.3% |
| Whole state: | 7.3% |
Likely homosexual households (counted as self-reported same-sex unmarried-partner households)
- Lesbian couples: 0.4% of all households
- Gay men: 0.3% of all households
6 people in group homes intended for adults in 2010
People in group quarters in Middleton in 2000:
- 68 people in nursing homes
- 43 people in other noninstitutional group quarters
- 8 people in homes for the physically handicapped
- 6 people in homes for the mentally ill
Banks with most branches in Middleton (2011 data):
- Capitol Bank: Old Sauk Road Facility, Sauk Gardens Branch, Middleton Glen Branch, Attic Angels Branch. Info updated 2006/11/03: Bank assets: $275.3 mil, Deposits: $234.9 mil, headquarters in Madison, WI, positive income, Commercial Lending Specialization, 14 total offices, Holding Company: Capitol Bankshares, Inc.
- State Bank of Cross Plains: Middleton - East at 6300 University Avenue, Suite 200, branch established on 2006/07/13; Middleton - West Branch at 8309 University Avenue, branch established on 1995/04/10. Info updated 2011/07/11: Bank assets: $797.7 mil, Deposits: $698.4 mil, headquarters in Cross Plains, WI, positive income, Commercial Lending Specialization, 10 total offices, Holding Company: S.B.c.p. Bancorp, Inc.
- Bank Mutual: Century Avenue Branch at 6209 Century Ave, branch established on 1940/08/14. Info updated 2011/07/21: Bank assets: $2,497.0 mil, Deposits: $2,046.0 mil, headquarters in Brown Deer, WI, negative income in the last year, Mortgage Lending Specialization, 79 total offices
- Wisconsin Community Bank: Middleton Branch at 5310 Century Avenue, branch established on 1998/02/02. Info updated 2007/09/26: Bank assets: $519.5 mil, Deposits: $429.1 mil, headquarters in Madison, WI, positive income, Commercial Lending Specialization, 10 total offices, Holding Company: Heartland Financial Usa, Inc.
- Wells Fargo Bank, National Association: Middleton Branch at 6622 University Avenue, branch established on 1996/02/05. Info updated 2011/04/05: Bank assets: $1,161,490.0 mil, Deposits: $905,653.0 mil, headquarters in Sioux Falls, SD, positive income, 6395 total offices, Holding Company: Wells Fargo & Company
- Starion Financial: Middleton, Wi Branch at 1651 John Q. Hammons Drive, branch established on 2006/07/06. Info updated 2011/11/08: Bank assets: $924.6 mil, Deposits: $779.2 mil, headquarters in Bismarck, ND, positive income, Commercial Lending Specialization, 13 total offices, Holding Company: Starion Bancorporation
- The Park Bank: Middleton Branch at 2275 Deming Way, branch established on 2004/09/20. Info updated 2012/01/13: Bank assets: $769.4 mil, Deposits: $604.8 mil, headquarters in Madison, WI, positive income, Commercial Lending Specialization, 12 total offices, Holding Company: Park Bancorporation, Inc.
- Associated Bank, National Association: Middleton Allen Branch at 2420 Allen Boulevard, branch established on 1994/11/02. Info updated 2008/09/12: Bank assets: $21,715.0 mil, Deposits: $15,244.4 mil, headquarters in Green Bay, WI, positive income, Commercial Lending Specialization, 282 total offices, Holding Company: Associated Banc-Corp
- Middleton Community Bank: at 3207 Parmenter Street, branch established on 1995/01/31. Info updated 2008/01/31: Bank assets: $218.1 mil, Deposits: $185.0 mil, local headquarters, positive income, Commercial Lending Specialization, 4 total offices, Holding Company: Mcb Bankshares, Inc.
- 3 other banks with 3 local branches
For population 15 years and over in Middleton:
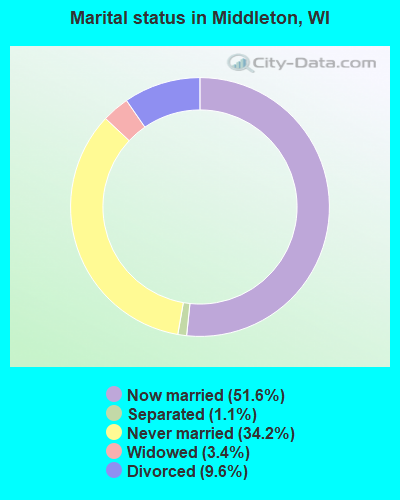
- Never married: 34.2%
- Now married: 51.6%
- Separated: 1.1%
- Widowed: 3.4%
- Divorced: 9.6%
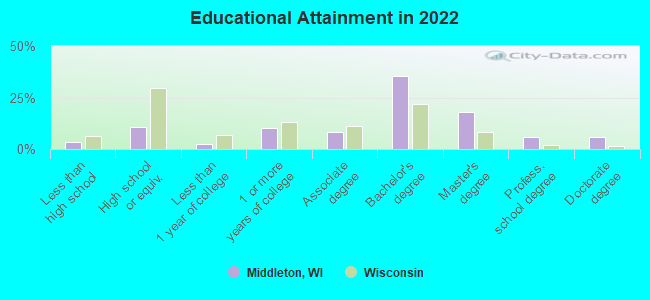
For population 25 years and over in Middleton:
- High school or higher: 96.6%
- Bachelor's degree or higher: 64.2%
- Graduate or professional degree: 28.8%
- Unemployed: 1.9%
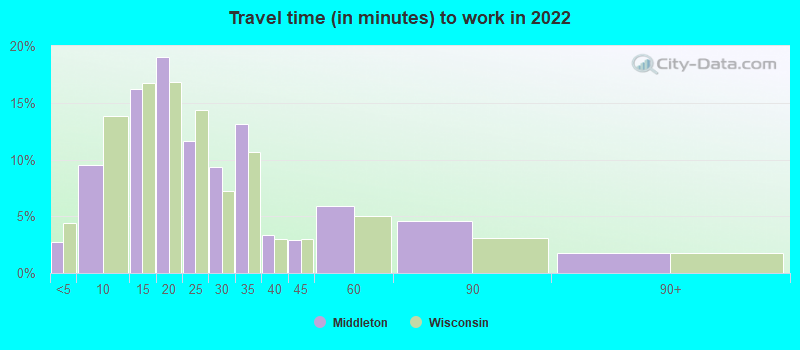
- Mean travel time to work (commute): 14.2 minutes
| Here: | 9.5 |
| Wisconsin average: | 10.4 |
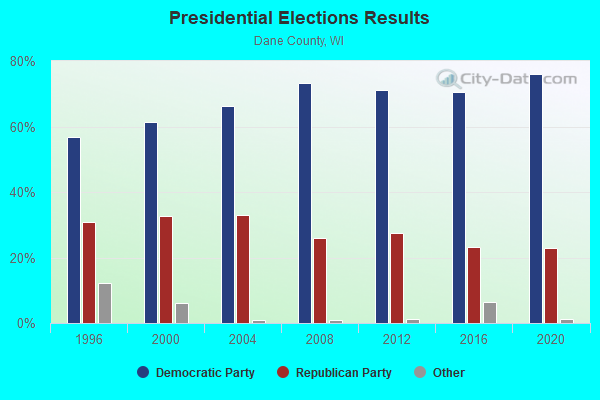
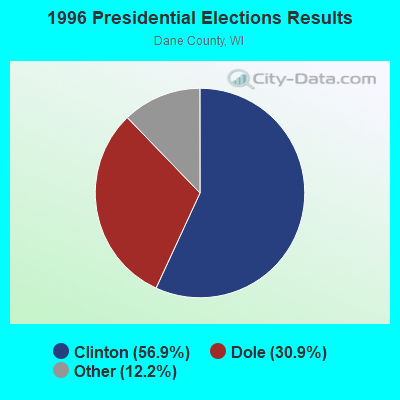
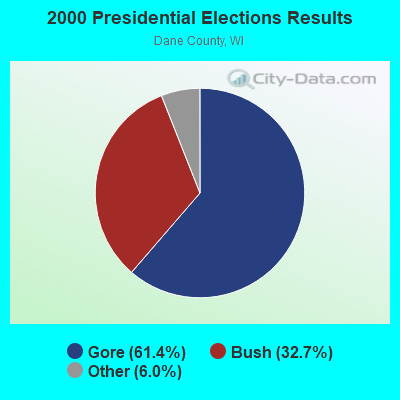
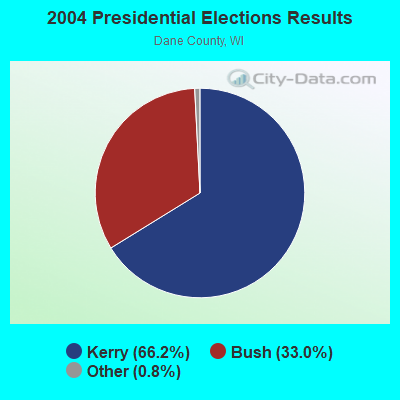
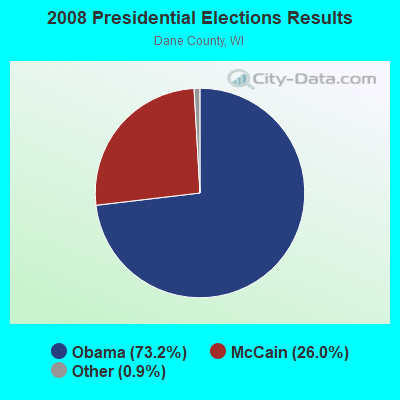
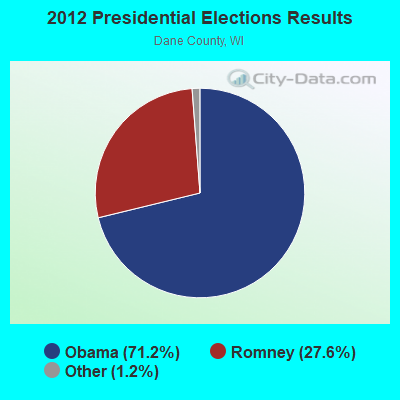
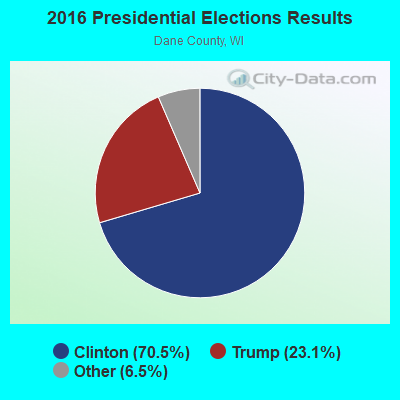
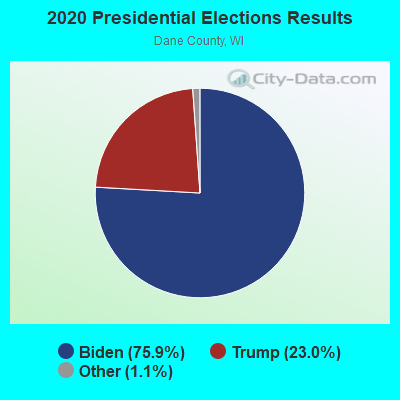
Graphs represent county-level data. Detailed 2008 Election Results
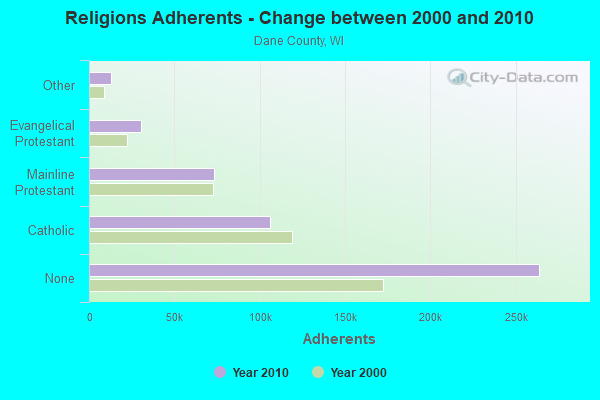
Religion statistics for Middleton, WI (based on Dane County data)
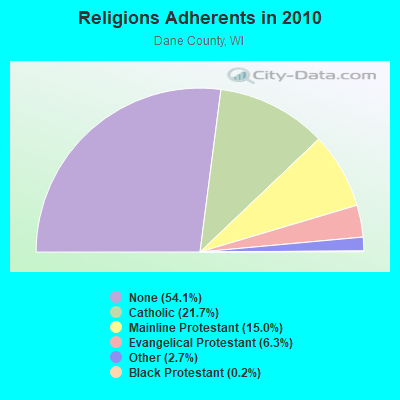
| Religion | Adherents | Congregations |
|---|---|---|
| Catholic | 106,036 | 34 |
| Mainline Protestant | 73,128 | 113 |
| Evangelical Protestant | 30,727 | 146 |
| Other | 12,968 | 49 |
| Black Protestant | 779 | 5 |
| Orthodox | 445 | 4 |
| None | 263,990 | - |
Food Environment Statistics:
| Dane County: | 1.53 / 10,000 pop. |
| Wisconsin: | 1.86 / 10,000 pop. |
| Dane County: | 0.04 / 10,000 pop. |
| Wisconsin: | 0.11 / 10,000 pop. |
| Dane County: | 0.11 / 10,000 pop. |
| Wisconsin: | 0.38 / 10,000 pop. |
| Dane County: | 3.24 / 10,000 pop. |
| Wisconsin: | 4.12 / 10,000 pop. |
| Here: | 8.03 / 10,000 pop. |
| State: | 8.64 / 10,000 pop. |
| Dane County: | 6.0% |
| State: | 7.6% |
| This county: | 23.9% |
| Wisconsin: | 27.5% |
| Dane County: | 11.1% |
| Wisconsin: | 13.0% |
Health and Nutrition:
| Here: | 51.0% |
| State: | 49.5% |
| This city: | 48.9% |
| Wisconsin: | 46.6% |
| This city: | 28.5 |
| Wisconsin: | 28.7 |
| This city: | 20.6% |
| State: | 21.4% |
| Middleton: | 10.1% |
| Wisconsin: | 10.2% |
| Middleton: | 6.8 |
| Wisconsin: | 6.8 |
| This city: | 33.5% |
| Wisconsin: | 34.0% |
| Here: | 58.4% |
| Wisconsin: | 56.3% |
| This city: | 79.8% |
| State: | 78.5% |
More about Health and Nutrition of Middleton, WI Residents
| Local government employment and payroll (March 2022) | |||||
| Function | Full-time employees | Monthly full-time payroll | Average yearly full-time wage | Part-time employees | Monthly part-time payroll |
|---|---|---|---|---|---|
| Police Protection - Officers | 39 | $292,114 | $89,881 | 0 | $0 |
| Streets and Highways | 19 | $113,663 | $71,787 | 0 | $0 |
| Parks and Recreation | 16 | $84,936 | $63,702 | 16 | $1,846 |
| Health | 15 | $108,464 | $86,771 | 3 | $1,906 |
| Local Libraries | 11 | $64,221 | $70,059 | 28 | $34,612 |
| Water Supply | 9 | $54,142 | $72,189 | 0 | $0 |
| Police - Other | 9 | $48,247 | $64,329 | 2 | $2,471 |
| Financial Administration | 6 | $42,363 | $84,726 | 2 | $5,247 |
| Other Government Administration | 6 | $48,055 | $96,110 | 10 | $5,501 |
| Housing and Community Development (Local) | 4 | $27,314 | $81,942 | 3 | $5,336 |
| Welfare | 3 | $15,768 | $63,072 | 11 | $21,802 |
| Other and Unallocable | 3 | $16,589 | $66,356 | 0 | $0 |
| Natural Resources | 1 | $7,018 | $84,216 | 0 | $0 |
| Judicial and Legal | 1 | $4,254 | $51,048 | 2 | $1,394 |
| Solid Waste Management | 0 | $0 | 2 | $691 | |
| Totals for Government | 142 | $927,147 | $78,350 | 79 | $80,805 |
Middleton government finances - Expenditure in 2021 (per resident):
- Construction - Regular Highways: $2,549,000 ($114.16)
Parks and Recreation: $1,771,000 ($79.32)
Health - Other: $779,000 ($34.89)
General - Other: $684,000 ($30.63)
Police Protection: $356,000 ($15.94)
Libraries: $143,000 ($6.40)
Sewerage: $64,000 ($2.87)
- Current Operations - General - Other: $6,045,000 ($270.74)
Police Protection: $6,006,000 ($268.99)
Parks and Recreation: $3,917,000 ($175.43)
Regular Highways: $3,312,000 ($148.33)
Sewerage: $3,127,000 ($140.05)
Water Utilities: $2,484,000 ($111.25)
Libraries: $2,132,000 ($95.49)
Health - Other: $2,007,000 ($89.89)
Central Staff Services: $1,257,000 ($56.30)
Local Fire Protection: $1,040,000 ($46.58)
Solid Waste Management: $1,003,000 ($44.92)
Financial Administration: $817,000 ($36.59)
Natural Resources - Other: $798,000 ($35.74)
Transit Utilities: $495,000 ($22.17)
Protective Inspection and Regulation - Other: $451,000 ($20.20)
Judicial and Legal Services: $390,000 ($17.47)
Air Transportation: $173,000 ($7.75)
- General - Interest on Debt: $1,357,000 ($60.78)
- Other Capital Outlay - General - Other: $814,000 ($36.46)
Water Utilities: $777,000 ($34.80)
Regular Highways: $217,000 ($9.72)
Parks and Recreation: $139,000 ($6.23)
Sewerage: $48,000 ($2.15)
- Total Salaries and Wages: $11,890,000 ($532.52)
Middleton government finances - Revenue in 2021 (per resident):
- Charges - Parks and Recreation: $3,405,000 ($152.50)
Sewerage: $2,913,000 ($130.46)
Other: $1,109,000 ($49.67)
Regular Highways: $883,000 ($39.55)
Natural Resources - Other: $153,000 ($6.85)
Air Transportation: $135,000 ($6.05)
Solid Waste Management: $11,000 ($0.49)
- Federal Intergovernmental - General Local Government Support: $194,000 ($8.69)
Other: $20,000 ($0.90)
- Local Intergovernmental - Other: $1,745,000 ($78.15)
Health and Hospitals: $218,000 ($9.76)
- Miscellaneous - Sale of Property: $2,685,000 ($120.25)
General Revenue - Other: $1,172,000 ($52.49)
Interest Earnings: $831,000 ($37.22)
Fines and Forfeits: $164,000 ($7.35)
Special Assessments: $133,000 ($5.96)
Donations From Private Sources: $98,000 ($4.39)
- Revenue - Water Utilities: $2,095,000 ($93.83)
- State Intergovernmental - General Local Government Support: $2,544,000 ($113.94)
Highways: $1,283,000 ($57.46)
Education: $497,000 ($22.26)
Other: $221,000 ($9.90)
- Tax - Property: $30,159,000 ($1350.73)
Other License: $3,199,000 ($143.27)
Other Selective Sales: $580,000 ($25.98)
Occupation and Business License - Other: $293,000 ($13.12)
Other: $35,000 ($1.57)
Middleton government finances - Debt in 2021 (per resident):
- Long Term Debt - Beginning Outstanding - Unspecified Public Purpose: $43,488,000 ($1947.69)
Outstanding Unspecified Public Purpose: $40,540,000 ($1815.66)
Retired Unspecified Public Purpose: $26,198,000 ($1173.32)
Issue, Unspecified Public Purpose: $23,250,000 ($1041.29)
Middleton government finances - Cash and Securities in 2021 (per resident):
- Bond Funds - Cash and Securities: $1,696,000 ($75.96)
- Other Funds - Cash and Securities: $69,319,000 ($3104.58)
5.62% of this county's 2021 resident taxpayers lived in other counties in 2020 ($67,560 average adjusted gross income)
| Here: | 5.62% |
| Wisconsin average: | 6.07% |
0.01% of residents moved from foreign countries ($96 average AGI)
Dane County: 0.01% Wisconsin average: 0.00%
Top counties from which taxpayers relocated into this county between 2020 and 2021:
| from Milwaukee County, WI | |
| from Cook County, IL | |
| from Rock County, WI |
6.55% of this county's 2020 resident taxpayers moved to other counties in 2021 ($75,791 average adjusted gross income)
| Here: | 6.55% |
| Wisconsin average: | 6.10% |
0.01% of residents moved to foreign countries ($41 average AGI)
Dane County: 0.01% Wisconsin average: 0.00%
Top counties to which taxpayers relocated from this county between 2020 and 2021:
| to Rock County, WI | |
| to Columbia County, WI | |
| to Milwaukee County, WI |
| Businesses in Middleton, WI | ||||
| Name | Count | Name | Count | |
|---|---|---|---|---|
| Ace Hardware | 2 | Justice | 1 | |
| Ann Taylor | 1 | Little Caesars Pizza | 1 | |
| Arby's | 1 | Marriott | 4 | |
| Ashley Furniture | 1 | Marshalls | 1 | |
| Bath & Body Works | 1 | MasterBrand Cabinets | 4 | |
| Blockbuster | 1 | Maurices | 1 | |
| CVS | 1 | McDonald's | 2 | |
| Chevrolet | 1 | New Balance | 2 | |
| Chico's | 1 | Nike | 4 | |
| Cold Stone Creamery | 1 | Papa John's Pizza | 1 | |
| Coldwater Creek | 1 | Pizza Hut | 1 | |
| Costco | 1 | SONIC Drive-In | 1 | |
| Dennys | 1 | Sprint Nextel | 1 | |
| Domino's Pizza | 1 | Starbucks | 2 | |
| FedEx | 7 | Subway | 2 | |
| Ford | 1 | T-Mobile | 1 | |
| Goodwill | 1 | T.G.I. Driday's | 1 | |
| H&R Block | 1 | Toys"R"Us | 1 | |
| Hardee's | 1 | UPS | 7 | |
| Haworth | 1 | Verizon Wireless | 1 | |
| Holiday Inn | 1 | Volkswagen | 1 | |
| J. Jill | 1 | Walgreens | 2 | |
| JoS. A. Bank | 1 | |||
Strongest AM radio stations in Middleton:
- WHA (970 AM; 5 kW; MADISON, WI; Owner: BOARD REGENTS OF UNIV OF WI SYSTEM)
- WLMV (1480 AM; 10 kW; MADISON, WI; Owner: MID-WEST MANAGEMENT, INC.)
- WTDY (1670 AM; 10 kW; MADISON, WI; Owner: MID-WEST MANAGEMENT, INC.)
- WTSO (1070 AM; 10 kW; MADISON, WI; Owner: CAPSTAR TX LIMITED PARTNERSHIP)
- WIBA (1310 AM; 5 kW; MADISON, WI; Owner: CAPSTAR TX LIMITED PARTNERSHIP)
- WTUX (1550 AM; daytime; 5 kW; MADISON, WI)
- WNWC (1190 AM; daytime; 5 kW; SUN PRAIRIE, WI; Owner: NORTHWESTERN COLLEGE)
- WTMJ (620 AM; 50 kW; MILWAUKEE, WI; Owner: JOURNAL BROADCAST CORPORATION)
- WISN (1130 AM; 50 kW; MILWAUKEE, WI; Owner: CAPSTAR TX LIMITED PARTNERSHIP)
- WSCR (670 AM; 50 kW; CHICAGO, IL; Owner: INFINITY BROADCASTING OPERATIONS, INC.)
- WGN (720 AM; 50 kW; CHICAGO, IL; Owner: WGN CONTINENTAL BROADCASTING CO.)
- WNAM (1280 AM; 50 kW; NEENAH-MENASHA, WI; Owner: CUMULUS LICENSING CORP.)
- WBBM (780 AM; 50 kW; CHICAGO, IL; Owner: INFINITY BROADCASTING OPERATIONS, INC.)
Strongest FM radio stations in Middleton:
- WERN (88.7 FM; MADISON, WI; Owner: STATE OF WISCONSIN - EDUCATIONAL COMMUNICATIONS BOARD)
- WZEE (104.1 FM; MADISON, WI; Owner: CAPSTAR TX LIMITED PARTNERSHIP)
- WIBA-FM (101.5 FM; MADISON, WI; Owner: CAPSTAR TX LIMITED PARTNERSHIP)
- WORT (89.9 FM; MADISON, WI; Owner: BACK PORCH RADIO BROADCASTING, INC.)
- W215AQ (90.9 FM; MADISON, WI; Owner: STATE OF WISCONSIN - EDUCATIONAL COMMUNICATIONS BOARD)
- WWQM-FM (106.3 FM; MIDDLETON, WI; Owner: MID-WEST MANAGEMENT INC.)
- WNWC-FM (102.5 FM; MADISON, WI; Owner: NORTHWESTERN COLLEGE)
- WCJZ (96.3 FM; SAUK CITY, WI; Owner: CAPSTAR TX LIMITED PARTNERSHIP)
- W277AE (103.3 FM; MADISON, WI; Owner: FAITH ACADEMY DBA WFEN)
- WMMM-FM (105.5 FM; VERONA, WI; Owner: ENTERCOM MADISON LICENSE, LLC.)
- WMGN (98.1 FM; MADISON, WI; Owner: MID-WEST MANAGEMENT, INC.)
- WOLX-FM (94.9 FM; BARABOO, WI; Owner: ENTERCOM MADISON LICENSE, LLC.)
- WMAD-FM (92.1 FM; SUN PRAIRIE, WI; Owner: CAPSTAR TX LIMITED PARTNERSHIP)
- WBZU (105.1 FM; WAUNAKEE, WI; Owner: ENTERCOM MADISON LICENSE, LLC.)
- WSUM (91.7 FM; MADISON, WI; Owner: BD. OF REGENTS OF UNIVERSITY OF WISCONSIN SYSTEM)
- WHIT-FM (93.1 FM; DE FOREST, WI; Owner: MID-WEST MANAGEMENT, INC.)
- WJJO (94.1 FM; WATERTOWN, WI; Owner: MID-WEST MANAGMENT, INC.)
- WSJY (107.3 FM; FORT ATKINSON, WI; Owner: NEWRADIO GROUP, LLC)
- WKPO (105.9 FM; EVANSVILLE, WI; Owner: GOOD KARMA BROADCASTING, L.L.C.)
- WJVL (99.9 FM; JANESVILLE, WI; Owner: SOUTHERN WISCONSIN BROADCASTING, L.L.C.)
TV broadcast stations around Middleton:
- WISC-TV (Channel 3; MADISON, WI; Owner: TELEVISION WISCONSIN, INC.)
- WMSN-TV (Channel 47; MADISON, WI; Owner: WMSN LICENSEE, LLC)
- WKOW-TV (Channel 27; MADISON, WI; Owner: WKOW TELEVISION, INC.)
- WHA-TV (Channel 21; MADISON, WI; Owner: BOARD OF REGENTS OF THE UNIV. OF WISCONSIN SYSTEM)
- WMTV (Channel 15; MADISON, WI; Owner: GRAY MIDAMERICA TV LICENSEE CORP.)
- W38CT (Channel 38; MADISON, WI; Owner: TRINITY BROADCASTING NETWORK)
- W23BW (Channel 23; MADISON, WI; Owner: THREE ANGELS BROADCASTING NETWORK)
- W58CO (Channel 58; SAULT STE. MARIE, MI; Owner: MS COMMUNICATIONS, LLC)
- W08CK (Channel 8; MADISON-MIDDLETON, WI; Owner: HEALTHY'S, INC.)
- National Bridge Inventory (NBI) Statistics
- 33Number of bridges
- 223ft / 68.2mTotal length
- $3,475,000Total costs
- 402,140Total average daily traffic
- 7,679Total average daily truck traffic
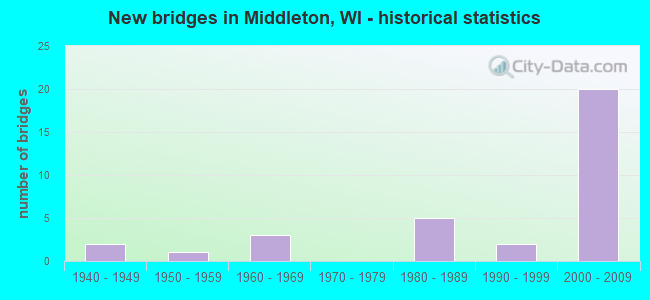
- New bridges - historical statistics
- 21940-1949
- 11950-1959
- 31960-1969
- 51980-1989
- 21990-1999
- 202000-2009
FCC Registered Private Land Mobile Towers: 1 (See the full list of FCC Registered Private Land Mobile Towers in Middleton, WI)
FCC Registered Broadcast Land Mobile Towers: 25 (See the full list of FCC Registered Broadcast Land Mobile Towers)
FCC Registered Microwave Towers: 11 (See the full list of FCC Registered Microwave Towers in this town)
FCC Registered Paging Towers: 1 (See the full list of FCC Registered Paging Towers)
FCC Registered Maritime Coast & Aviation Ground Towers: 1 (See the full list of FCC Registered Maritime Coast & Aviation Ground Towers)
FCC Registered Amateur Radio Licenses: 132 (See the full list of FCC Registered Amateur Radio Licenses in Middleton)
FAA Registered Aircraft: 42 (See the full list of FAA Registered Aircraft in Middleton)
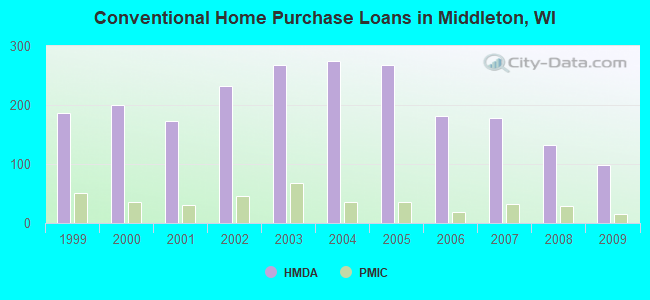
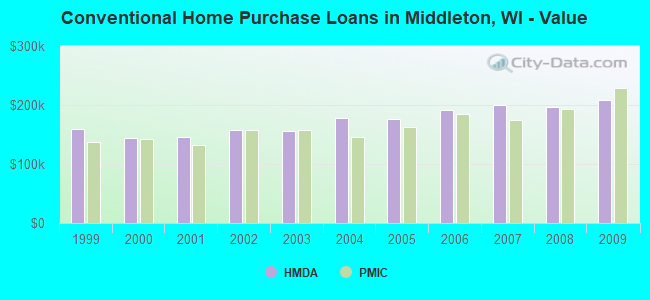
| Home Mortgage Disclosure Act Aggregated Statistics For Year 2009 (Based on 1 full and 4 partial tracts) | ||||||||||||
| A) FHA, FSA/RHS & VA Home Purchase Loans | B) Conventional Home Purchase Loans | C) Refinancings | D) Home Improvement Loans | E) Loans on Dwellings For 5+ Families | F) Non-occupant Loans on < 5 Family Dwellings (A B C & D) | |||||||
|---|---|---|---|---|---|---|---|---|---|---|---|---|
| Number | Average Value | Number | Average Value | Number | Average Value | Number | Average Value | Number | Average Value | Number | Average Value | |
| LOANS ORIGINATED | 23 | $183,716 | 98 | $208,578 | 677 | $194,822 | 36 | $145,002 | 2 | $166,260 | 19 | $209,010 |
| APPLICATIONS APPROVED, NOT ACCEPTED | 2 | $177,320 | 8 | $212,198 | 41 | $202,827 | 6 | $113,608 | 0 | $0 | 2 | $199,800 |
| APPLICATIONS DENIED | 1 | $287,550 | 11 | $191,197 | 74 | $217,620 | 6 | $22,467 | 0 | $0 | 6 | $238,272 |
| APPLICATIONS WITHDRAWN | 1 | $103,640 | 7 | $195,903 | 78 | $194,386 | 2 | $143,930 | 0 | $0 | 1 | $71,230 |
| FILES CLOSED FOR INCOMPLETENESS | 1 | $217,000 | 0 | $0 | 13 | $214,862 | 0 | $0 | 0 | $0 | 0 | $0 |
Detailed HMDA statistics for the following Tracts: 0002.05 , 0110.00, 0111.01, 0111.02, 0112.00
| Private Mortgage Insurance Companies Aggregated Statistics For Year 2009 (Based on 1 full and 4 partial tracts) | ||||
| A) Conventional Home Purchase Loans | B) Refinancings | |||
|---|---|---|---|---|
| Number | Average Value | Number | Average Value | |
| LOANS ORIGINATED | 15 | $228,007 | 22 | $224,925 |
| APPLICATIONS APPROVED, NOT ACCEPTED | 1 | $132,540 | 4 | $208,512 |
| APPLICATIONS DENIED | 1 | $77,230 | 1 | $170,840 |
| APPLICATIONS WITHDRAWN | 0 | $0 | 1 | $170,960 |
| FILES CLOSED FOR INCOMPLETENESS | 0 | $0 | 1 | $235,180 |
Detailed PMIC statistics for the following Tracts: 0002.05 , 0110.00, 0111.01, 0111.02, 0112.00
2002 - 2018 National Fire Incident Reporting System (NFIRS) incidents
- Fire incident types reported to NFIRS in Middleton, WI
- 32348.4%Structure Fires
- 23735.5%Outside Fires
- 8412.6%Mobile Property/Vehicle Fires
- 243.6%Other
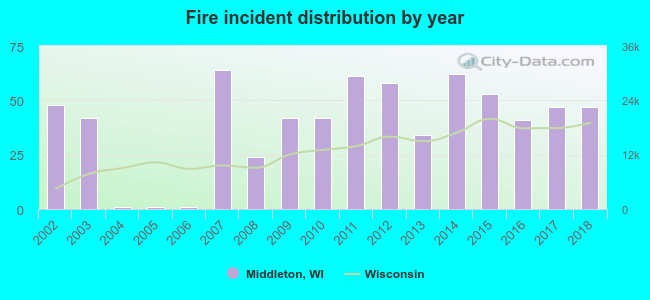 Based on the data from the years 2002 - 2018 the average number of fire incidents per year is 39. The highest number of fire incidents - 64 took place in 2007, and the least - 1 in 2004. The data has a declining trend.
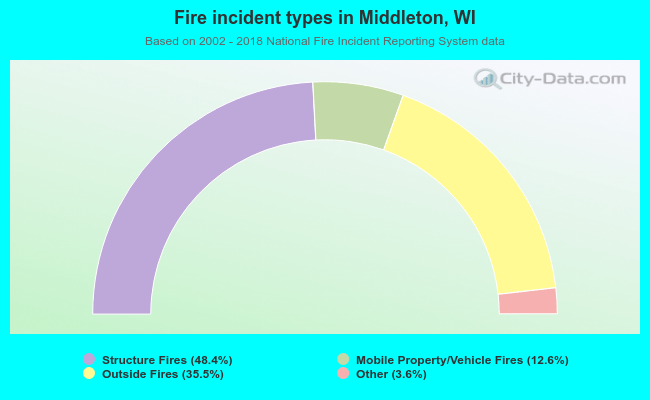 When looking into fire subcategories, the most reports belonged to: Structure Fires (48.4%), and Outside Fires (35.5%).
Fire-safe hotels and motels in Middleton, Wisconsin:
- Marriott Madison West, 1313 John Q Hammons Dr, Middleton, Wisconsin 53562 , Phone: (608) 831-2000, Fax: (608) 831-2040
- Fairfield Inn & Suites Madison West/Middleton, 8212 Greenway Blvd, Middleton, Wisconsin 53562 , Phone: (608) 831-1400, Fax: (608) 831-1435
- Country Inn And Suites, 2212 Deming Way, Middleton, Wisconsin 53562 , Phone: (608) 831-6970, Fax: (608) 831-6976
- Residence Inn Madison West/Middleton, 8400 Market St, Middleton, Wisconsin 53562 , Phone: (608) 662-1100, Fax: (608) 662-1101
- Courtyard By Marriott-Madison West/Middletown, 2266 Deming Way, Middleton, Wisconsin 53562 , Phone: (608) 203-0100, Fax: (608) 203-0101
- Staybridge Suites Middleton, 7790 Elmwood Ave, Middleton, Wisconsin 53562 , Phone: (608) 664-5888, Fax: (608) 664-5877
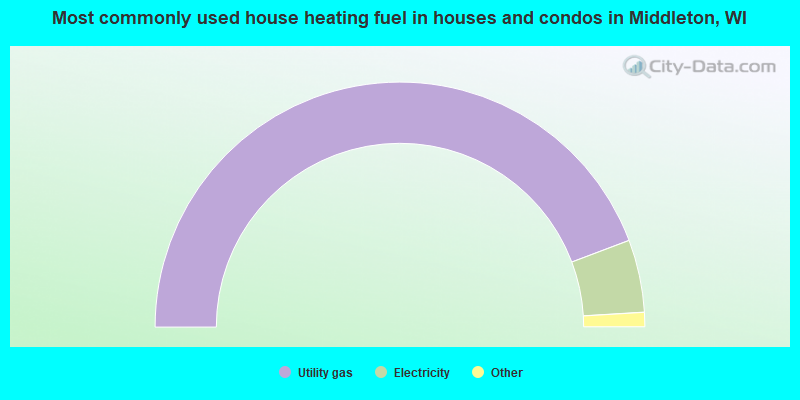
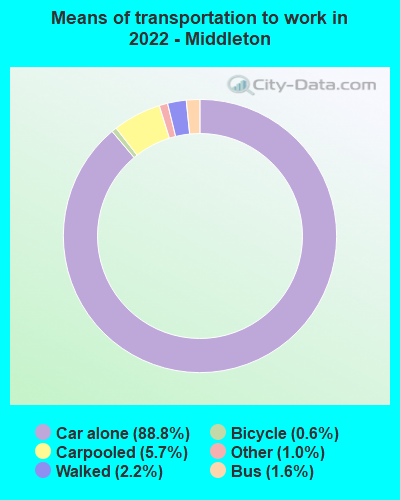
- 88.6%Utility gas
- 9.6%Electricity
- 1.3%Bottled, tank, or LP gas
- 0.3%Fuel oil, kerosene, etc.
- 0.2%Wood
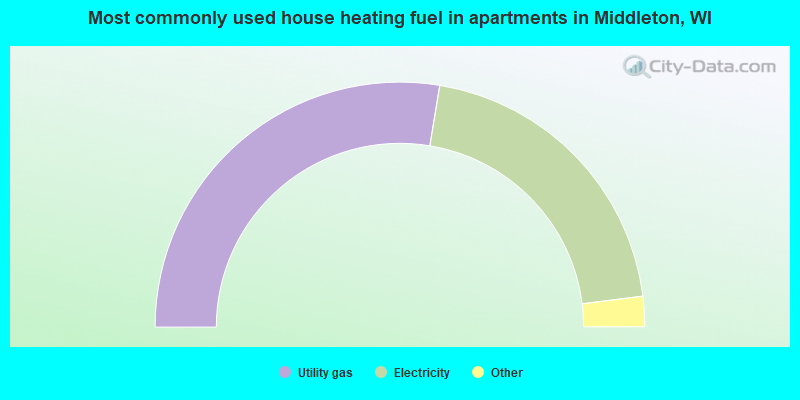
- 55.2%Utility gas
- 40.8%Electricity
- 1.8%No fuel used
- 1.1%Bottled, tank, or LP gas
- 0.5%Wood
- 0.3%Other fuel
- 0.2%Fuel oil, kerosene, etc.
Middleton compared to Wisconsin state average:
- Median house value above state average.
- Unemployed percentage significantly below state average.
- Foreign-born population percentage above state average.
- Length of stay since moving in above state average.
- House age below state average.
- Percentage of population with a bachelor's degree or higher significantly above state average.
Middleton on our top lists:
- #57 on the list of "Top 101 cities with the largest racial income disparity between any two races with at least 200 householders"
- #4 on the list of "Top 101 counties with the largest increase in the number of infant deaths per 1000 residents 2000-2006 to 2007-2013 (pop. 50,000+)"
- #39 on the list of "Top 101 counties with the most Mainline Protestant adherents"
- #45 on the list of "Top 101 counties with highest percentage of residents voting for Obama (Democrat) in the 2012 Presidential Election (pop. 50,000+)"
- #48 on the list of "Top 101 counties with the highest ground withdrawal of fresh water for public supply"
- #64 on the list of "Top 101 counties with the lowest percentage of residents relocating from foreign countries between 2010 and 2011"

|
|
Total of 929 patent applications in 2008-2024.