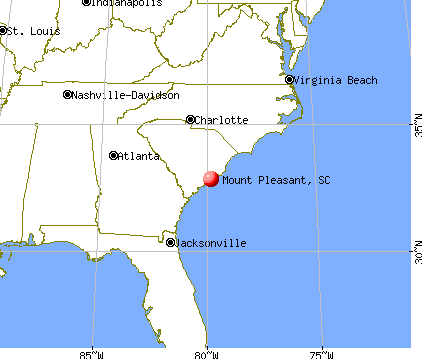
Mount Pleasant, South Carolina
Mount Pleasant: I'On Subdivision in Mt. Pleasant SC
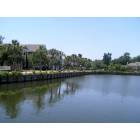
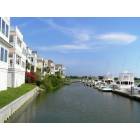
Mount Pleasant: Shem Creek located in the Old Village section of Mt. Pleasant..
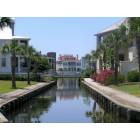
Mount Pleasant: I'On Subdivision in Mt. Pleasant SC
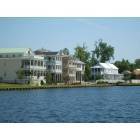
Mount Pleasant: I'On Subdivision in Mt. Pleasant SC
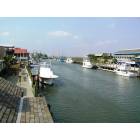
Mount Pleasant: Toler's Cove Marina
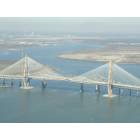
Mount Pleasant: The New Cooper River Bridge
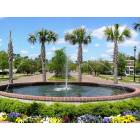
Mount Pleasant: Mt. Pleasant Town Center
Mount Pleasant: ION Subdivision

Mount Pleasant: Sunset from the Pitt Street Pier
Mount Pleasant: Alhambra Hall
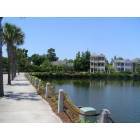
Mount Pleasant: Mount Pleasant, SC Waterfront Park
- see
23
more - add
your
Submit your own pictures of this town and show them to the world
- OSM Map
- General Map
- Google Map
- MSN Map
Population change since 2000: +98.6%
| Males: 46,346 | |
| Females: 48,199 |
| Median resident age: | 41.3 years |
| South Carolina median age: | 40.5 years |
Zip codes: 29466.
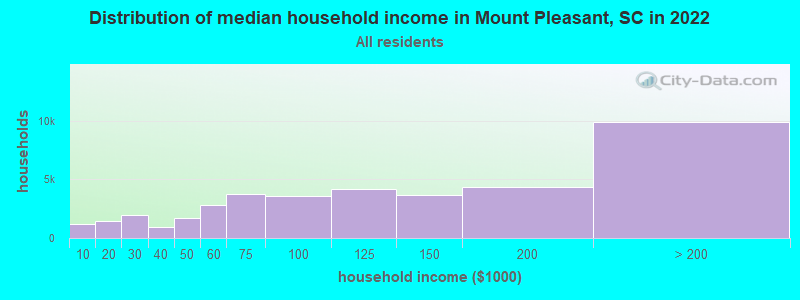
| Mount Pleasant: | $114,237 |
| SC: | $64,115 |
Estimated per capita income in 2022: $67,812 (it was $30,823 in 2000)
Mount Pleasant town income, earnings, and wages data
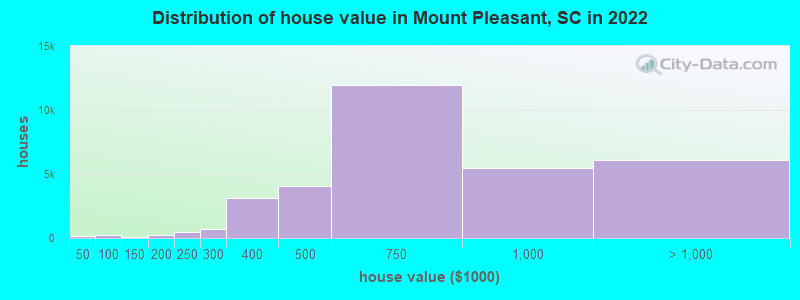
Estimated median house or condo value in 2022: $721,300 (it was $180,000 in 2000)
| Mount Pleasant: | $721,300 |
| SC: | $254,600 |
Mean prices in 2022: all housing units: $748,731; detached houses: $790,505; townhouses or other attached units: $421,882; in 2-unit structures: $257,527; in 3-to-4-unit structures: $255,142; in 5-or-more-unit structures: $406,483; mobile homes: $126,675
Median gross rent in 2022: $1,747.
Mount Pleasant, SC residents, houses, and apartments details
(5.0% for White Non-Hispanic residents, 11.8% for Black residents, 10.8% for Hispanic or Latino residents, 71.5% for American Indian residents, 84.5% for Native Hawaiian and other Pacific Islander residents, 25.5% for other race residents, 9.8% for two or more races residents)
Detailed information about poverty and poor residents in Mount Pleasant, SC


Compare current foreclosures in Mount Pleasant, SC:
| Photo | Address | Area | Beds / Baths | Price | Details |
|---|---|---|---|---|---|

|
#1
Hamlin Rd
Mount Pleasant, SC 29466
|
2,371 sq. feet
|
2 baths 4 beds |
$440,000
|
show details |

|
#2
Joseph Glover Rd
Mount Pleasant, SC 29466
|
1,539 sq. feet
|
2 baths 2 beds |
show details | |

|
#3
Premier Ln
Mount Pleasant, SC 29466
|
1,023 sq. feet
|
1 baths 3 beds |
show details | |

|
#4
Curran Pl
Mount Pleasant, SC 29466
|
1,707 sq. feet
|
2 baths 3 beds |
show details | |

|
#5
Alexandra Dr Unit 10
Mount Pleasant, SC 29464
|
976 sq. feet
|
2 baths 2 beds |
show details | |

|
#6
Penders Blvd
Mount Pleasant, SC 29466
|
4,862 sq. feet
|
4 baths 4 beds |
show details | |

|
#7
Veranda Vw
Mount Pleasant, SC 29464
|
1,556 sq. feet
|
2 baths 3 beds |
show details | |

|
#8
Harriman St
Mount Pleasant, SC 29466
|
2,644 sq. feet
|
3 baths 3 beds |
show details | |

|
#9
Hatchway Dr
Mount Pleasant, SC 29466
|
3,659 sq. feet
|
4 baths 5 beds |
show details | |

|
#10
Greystone Blvd # 13
Mount Pleasant, SC 29464
|
1,278 sq. feet
|
3 baths 2 beds |
show details |
| Photo | Address | Area | Beds / Baths | Price | Details |
|---|---|---|---|---|---|

|
#11
Stockdale St
Mount Pleasant, SC 29466
|
2,250 sq. feet
|
3 baths 3 beds |
show details | |

|
#12
Kings Gate Ln
Mount Pleasant, SC 29466
|
1,425 sq. feet
|
2 baths 3 beds |
show details | |

|
#13
Park West Blvd
Mount Pleasant, SC 29466
|
2,951 sq. feet
|
3 baths 4 beds |
show details | |

|
#14
Mathis Ferry Rd
Mount Pleasant, SC 29464
|
2,152 sq. feet
|
3 baths 3 beds |
show details | |

|
#15
Pilsdon Crst
Mount Pleasant, SC 29464
|
1,932 sq. feet
|
2 baths 3 beds |
show details | |

|
#16
Eagle St
Mount Pleasant, SC 29464
|
1,120 sq. feet
|
2 baths 3 beds |
show details | |

|
#17
Morningdale Dr
Mount Pleasant, SC 29466
|
1,896 sq. feet
|
2 baths 3 beds |
show details | |

|
#18
Bonnie Ln
Mount Pleasant, SC 29464
|
3,450 sq. feet
|
3 baths 4 beds |
show details | |

|
#19
Bloomingdale Ln
Mount Pleasant, SC 29466
|
2,072 sq. feet
|
2 baths 4 beds |
show details | |

|
#20
Village Creek Ln Apt 1
Mount Pleasant, SC 29464
|
1,060 sq. feet
|
2 baths 2 beds |
show details |
| Photo | Address | Area | Beds / Baths | Price | Details |
|---|---|---|---|---|---|

|
#21
Heron Pointe Blvd
Mount Pleasant, SC 29464
|
2,641 sq. feet
|
2 baths 4 beds |
show details | |

|
#22
Boston Grill Rd
Mount Pleasant, SC 29466
|
1,300 sq. feet
|
2 baths 5 beds |
show details | |

|
#23
Ashwycke St
Mount Pleasant, SC 29466
|
1,664 sq. feet
|
2 baths 3 beds |
show details | |

|
#24
N Marsh Dr
Mount Pleasant, SC 29466
|
2,300 sq. feet
|
2 baths 3 beds |
show details | |

|
#25
Deep Sea Cir
Mount Pleasant, SC 29464
|
2,405 sq. feet
|
3 baths 4 beds |
show details | |

|
#26
Rosewood Ln
Mount Pleasant, SC 29464
|
1,320 sq. feet
|
2 baths 3 beds |
show details | |

|
#27
Mathis Ferry Rd
Mount Pleasant, SC 29464
|
4,641 sq. feet
|
5 baths 5 beds |
show details | |

|
#28
Mathis Ferry Rd # C
Mount Pleasant, SC 29464
|
1,155 sq. feet
|
1 baths 3 beds |
show details | |

|
#29
Queensgate Way
Mount Pleasant, SC 29466
|
1,397 sq. feet
|
2 baths 3 beds |
show details | |

|
#30
Goblet Ave
Mount Pleasant, SC 29464
|
950 sq. feet
|
1 baths 3 beds |
show details |
| Photo | Address | Area | Beds / Baths | Price | Details |
|---|---|---|---|---|---|

|
#31
Wynford Ct
Mount Pleasant, SC 29464
|
1,280 sq. feet
|
2 baths 3 beds |
show details | |

|
#32
Greystone Bl 13
Mount Pleasant, SC 29464
|
1,277 sq. feet
|
2 baths 2 beds |
show details | |

|
#33
Heron Ave
Mount Pleasant, SC 29464
|
2,431 sq. feet
|
1 baths 2 beds |
show details | |

|
#34
Morningdale Dr
Mount Pleasant, SC 29466
|
1,748 sq. feet
|
2 baths 3 beds |
show details | |

|
#35
E Crossing Ln
Mount Pleasant, SC 29466
|
1,277 sq. feet
|
2 baths 3 beds |
show details | |

|
#36
Royalist Rd
Mount Pleasant, SC 29464
|
2,365 sq. feet
|
2 baths 3 beds |
show details | |

|
#37
Center Lake Dr
Mount Pleasant, SC 29464
|
2,288 sq. feet
|
2 baths 4 beds |
show details | |

|
#38
Atlantic St
Mount Pleasant, SC 29464
|
1,950 sq. feet
|
2 baths 4 beds |
show details | |

|
#39
Farm Quarter Rd
Mount Pleasant, SC 29464
|
2,736 sq. feet
|
2 baths 3 beds |
show details | |

|
#40
Wild Olive Dr
Mount Pleasant, SC 29464
|
1,403 sq. feet
|
2 baths 3 beds |
show details |
| Photo | Address | Area | Beds / Baths | Price | Details |
|---|---|---|---|---|---|

|
#41
Ventura Pl
Mount Pleasant, SC 29464
|
1,660 sq. feet
|
2 baths 2 beds |
show details | |

|
#42
Sandpiper Dr
Mount Pleasant, SC 29464
|
1,919 sq. feet
|
2 baths 3 beds |
show details | |

|
#43
Alston Rd
Mount Pleasant, SC 29464
|
883 sq. feet
|
1 baths 2 beds |
show details | |

|
#44
Summerwood Dr
Mount Pleasant, SC 29466
|
2,344 sq. feet
|
2 baths 4 beds |
show details | |

|
#45
Tall Grass Cir
Mount Pleasant, SC 29466
|
2,862 sq. feet
|
2 baths 4 beds |
show details | |

|
#46
Whispering Oaks Trl
Mount Pleasant, SC 29466
|
1,753 sq. feet
|
2 baths 3 beds |
show details | |

|
#47
Longview Rd
Mount Pleasant, SC 29464
|
1,443 sq. feet
|
2 baths 3 beds |
show details | |

|
#48
Natchez Cir
Mount Pleasant, SC 29464
|
2,096 sq. feet
|
2 baths 3 beds |
show details | |

|
#49
Gulf Dr
Mount Pleasant, SC 29466
|
- sq. feet
|
2 baths 3 beds |
show details | |

|
Check over 1 million property listings on Foreclosure.com!
|
browse all offers | |||


- 84,03190.3%White alone
- 3,2043.4%Black alone
- 2,2822.5%Two or more races
- 2,2472.4%Hispanic
- 1,5191.6%Asian alone
- 3700.4%Other race alone
- 420.05%American Indian alone
- 200.02%Native Hawaiian and Other
Pacific Islander alone
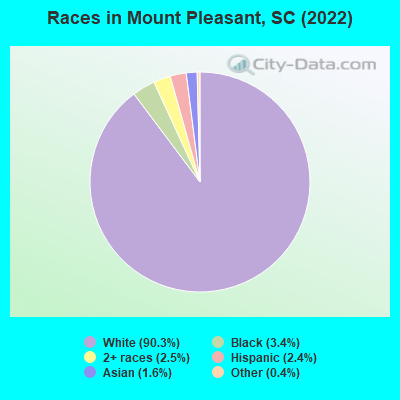
Races in Mount Pleasant detailed stats: ancestries, foreign born residents, place of birth
According to our research of South Carolina and other state lists, there were 4 registered sex offenders living in Mount Pleasant, South Carolina as of June 16, 2024.
The ratio of all residents to sex offenders in Mount Pleasant is 20,286 to 1.
The ratio of registered sex offenders to all residents in this city is much lower than the state average.
The City-Data.com crime index weighs serious crimes and violent crimes more heavily. Higher means more crime, U.S. average is 246.1. It adjusts for the number of visitors and daily workers commuting into cities.
- means the value is smaller than the state average.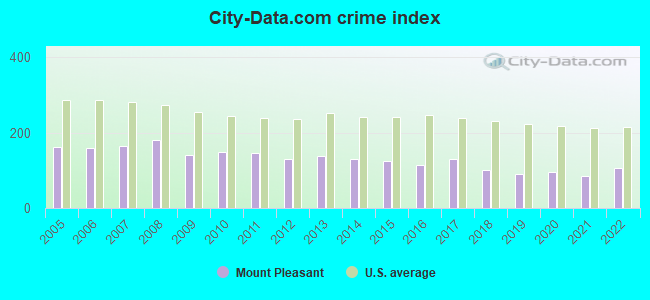
Crime rate in Mount Pleasant detailed stats: murders, rapes, robberies, assaults, burglaries, thefts, arson
Full-time law enforcement employees in 2020, including police officers: 175 (158 officers - 128 male; 30 female).
| Officers per 1,000 residents here: | 1.67 |
| South Carolina average: | 2.34 |
 Recent articles from our blog. Our writers, many of them Ph.D. graduates or candidates, create easy-to-read articles on a wide variety of topics.


Latest news from Mount Pleasant, SC collected exclusively by city-data.com from local newspapers, TV, and radio stations
Ancestries: English (22.2%), American (20.6%), Irish (9.1%), German (8.8%), Italian (5.0%), European (4.8%).
Current Local Time: EST time zone
Elevation: 24 feet
Land area: 41.9 square miles.
Population density: 2,257 people per square mile (low).
4,689 residents are foreign born (1.8% Europe, 1.4% Asia, 1.1% Latin America, 0.5% North America).
| This town: | 5.0% |
| South Carolina: | 5.3% |
Median real estate property taxes paid for housing units with mortgages in 2022: $2,323 (0.3%)
Median real estate property taxes paid for housing units with no mortgage in 2022: $2,282 (0.3%)
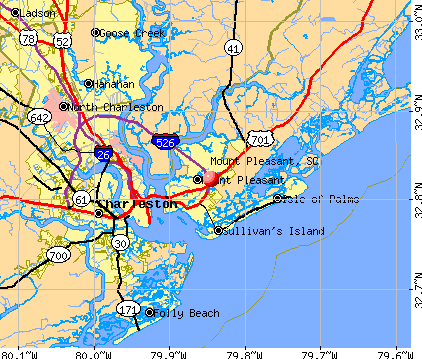
Nearest city with pop. 50,000+: Charleston, SC  (8.5 miles , pop. 96,650).
Nearest city with pop. 200,000+: Charlotte, NC (174.3 miles , pop. 540,828).
Nearest city with pop. 1,000,000+: Philadelphia, PA (560.8 miles , pop. 1,517,550).
Nearest cities:
), Latitude: 32.82 N, Longitude: 79.85 W
Daytime population change due to commuting: -1,219 (-1.3%)
Workers who live and work in this town: 25,815 (53.2%)
Area code: 843
Mount Pleasant tourist attractions:
- Boone Hall Plantation - Mount Pleasant, South Carolina - Large Family Owned House and Plantation
- Charleston Harbor Resort & Marina - Mount Pleasant, South Carolina Harbor side Hotel
- Patriots Point Naval & Maritime Museum - Mount Pleasant, South Carolina Maritime Museum
- Shem Creek Inn - Mount Pleasant, South Carolina - Hotel
- USS Yorktown - Charleston SC - Historical Naval Ship of World War II
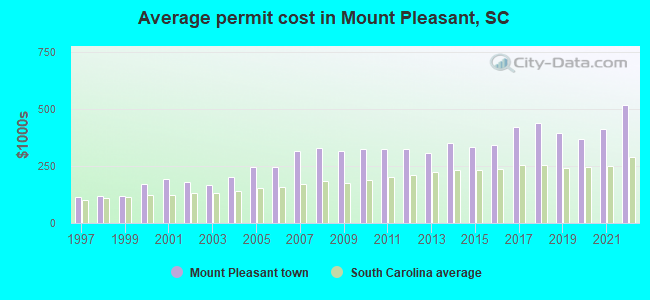
Single-family new house construction building permits:
- 2022: 478 buildings, average cost: $518,700
- 2021: 698 buildings, average cost: $411,500
- 2020: 660 buildings, average cost: $370,100
- 2019: 547 buildings, average cost: $395,300
- 2018: 781 buildings, average cost: $440,300
- 2017: 776 buildings, average cost: $419,800
- 2016: 959 buildings, average cost: $342,300
- 2015: 940 buildings, average cost: $334,800
- 2014: 739 buildings, average cost: $350,700
- 2013: 796 buildings, average cost: $306,500
- 2012: 492 buildings, average cost: $325,900
- 2011: 269 buildings, average cost: $325,100
- 2010: 226 buildings, average cost: $325,500
- 2009: 161 buildings, average cost: $314,400
- 2008: 230 buildings, average cost: $328,300
- 2007: 361 buildings, average cost: $317,600
- 2006: 829 buildings, average cost: $245,800
- 2005: 845 buildings, average cost: $247,400
- 2004: 960 buildings, average cost: $202,500
- 2003: 930 buildings, average cost: $168,700
- 2002: 885 buildings, average cost: $181,000
- 2001: 790 buildings, average cost: $191,500
- 2000: 1109 buildings, average cost: $172,500
- 1999: 1553 buildings, average cost: $117,500
- 1998: 915 buildings, average cost: $120,100
- 1997: 819 buildings, average cost: $115,200

| Here: | 2.1% |
| South Carolina: | 3.1% |
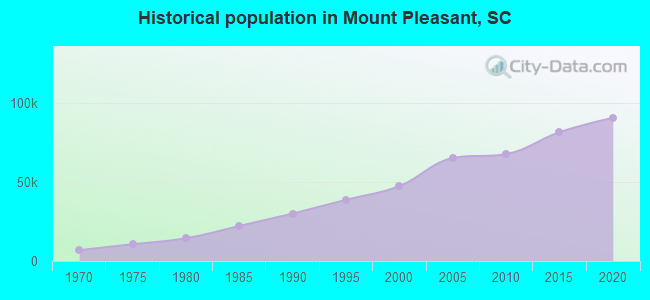
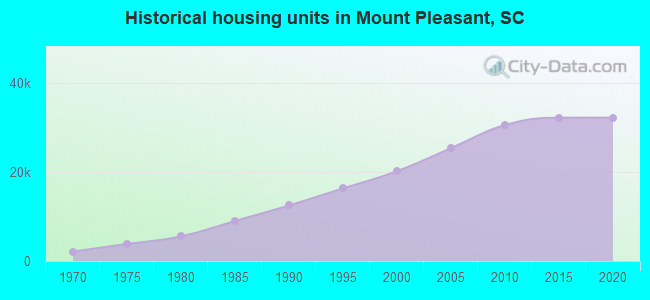
Population change in the 1990s: +16,364 (+52.4%).
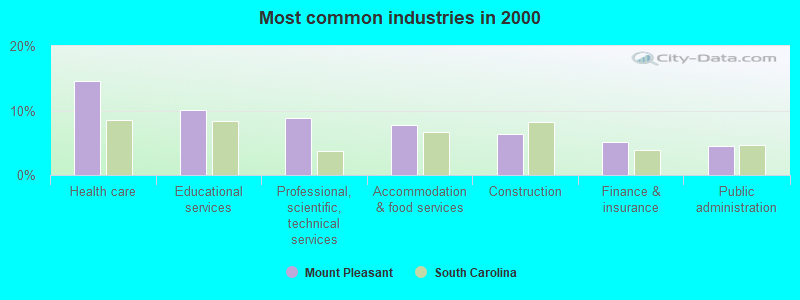
- Health care (14.6%)
- Educational services (10.1%)
- Professional, scientific, technical services (8.9%)
- Accommodation & food services (7.7%)
- Construction (6.3%)
- Finance & insurance (5.1%)
- Public administration (4.5%)
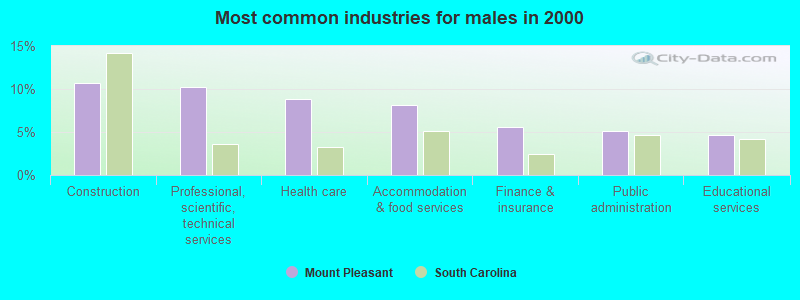
- Construction (10.7%)
- Professional, scientific, technical services (10.3%)
- Health care (8.9%)
- Accommodation & food services (8.1%)
- Finance & insurance (5.6%)
- Public administration (5.2%)
- Educational services (4.6%)
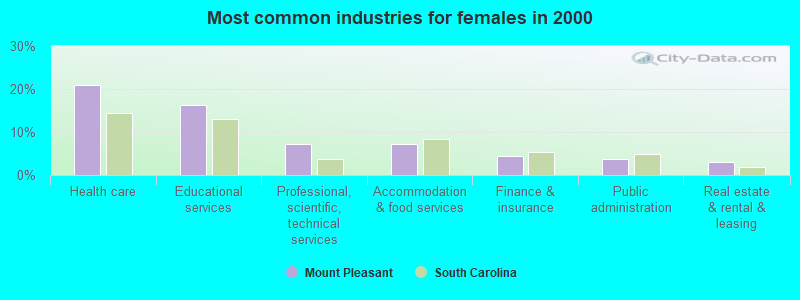
- Health care (21.0%)
- Educational services (16.4%)
- Professional, scientific, technical services (7.3%)
- Accommodation & food services (7.2%)
- Finance & insurance (4.5%)
- Public administration (3.7%)
- Real estate & rental & leasing (2.9%)
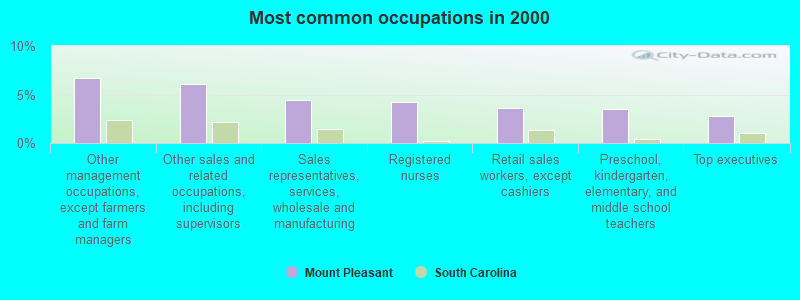
- Other management occupations, except farmers and farm managers (6.7%)
- Other sales and related occupations, including supervisors (6.1%)
- Sales representatives, services, wholesale and manufacturing (4.4%)
- Registered nurses (4.3%)
- Retail sales workers, except cashiers (3.6%)
- Preschool, kindergarten, elementary, and middle school teachers (3.5%)
- Top executives (2.8%)
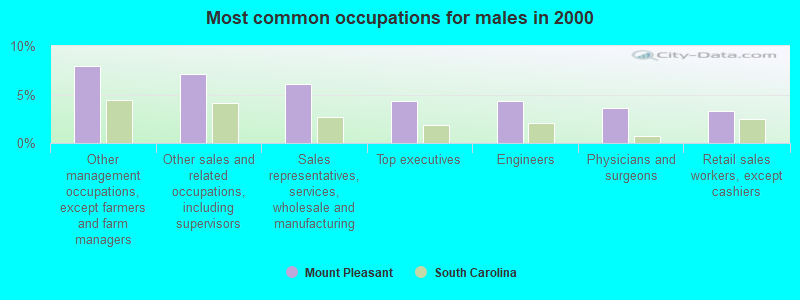
- Other management occupations, except farmers and farm managers (8.0%)
- Other sales and related occupations, including supervisors (7.1%)
- Sales representatives, services, wholesale and manufacturing (6.1%)
- Top executives (4.3%)
- Engineers (4.3%)
- Physicians and surgeons (3.6%)
- Retail sales workers, except cashiers (3.3%)
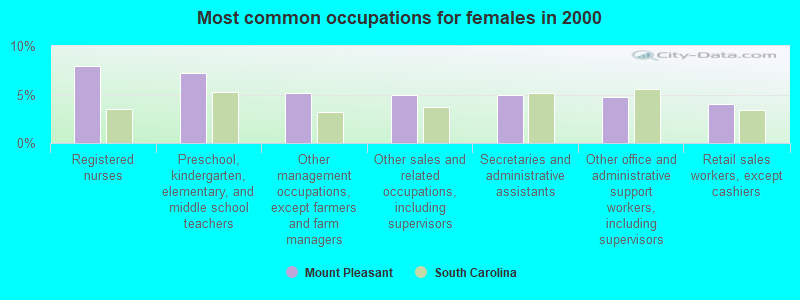
- Registered nurses (8.0%)
- Preschool, kindergarten, elementary, and middle school teachers (7.2%)
- Other management occupations, except farmers and farm managers (5.2%)
- Other sales and related occupations, including supervisors (5.0%)
- Secretaries and administrative assistants (4.9%)
- Other office and administrative support workers, including supervisors (4.7%)
- Retail sales workers, except cashiers (4.0%)
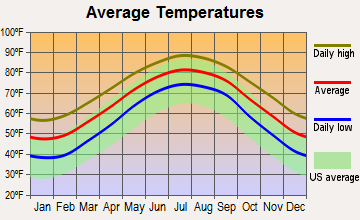
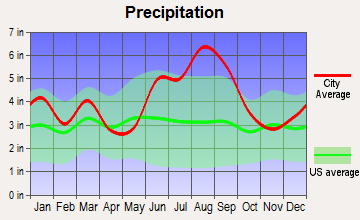
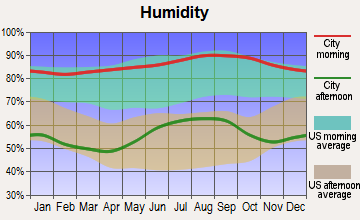
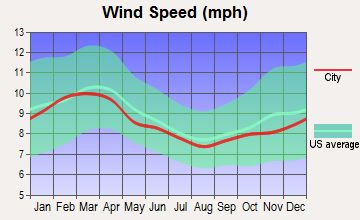
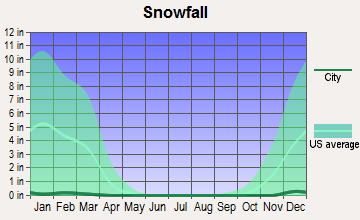
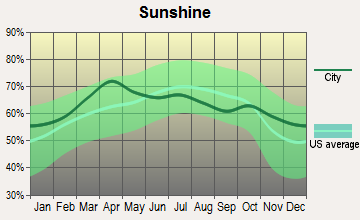
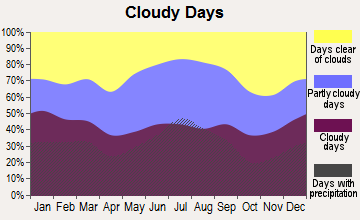
Average climate in Mount Pleasant, South Carolina
Based on data reported by over 4,000 weather stations
|
|

(lower is better)
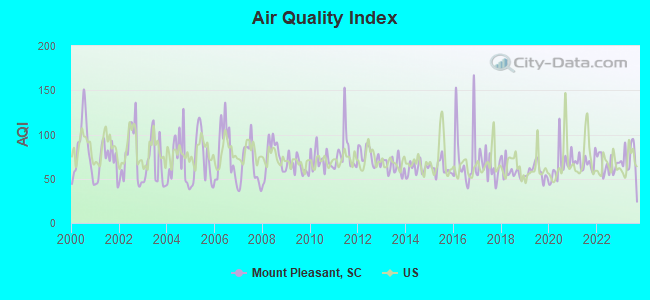
Air Quality Index (AQI) level in 2023 was 69.9. This is about average.
| City: | 69.9 |
| U.S.: | 72.6 |
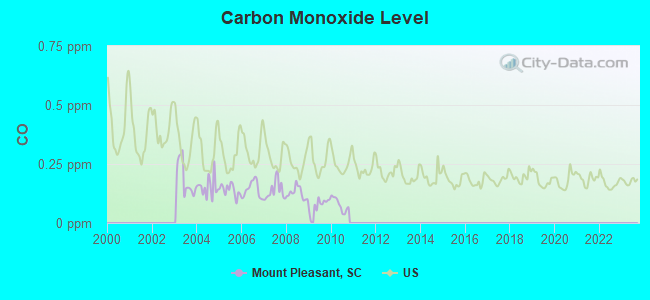
Carbon Monoxide (CO) [ppm] level in 2010 was 0.0779. This is significantly better than average. Closest monitor was 13.6 miles away from the city center.
| City: | 0.0779 |
| U.S.: | 0.2513 |
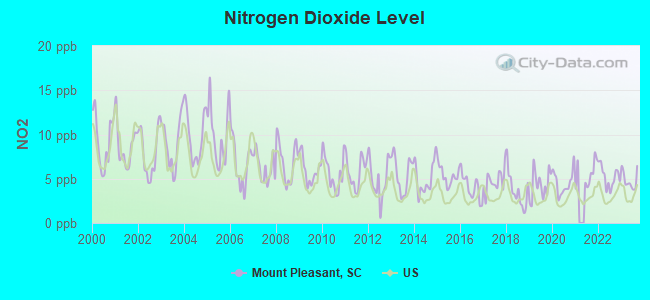
Nitrogen Dioxide (NO2) [ppb] level in 2023 was 4.83. This is about average. Closest monitor was 0.3 miles away from the city center.
| City: | 4.83 |
| U.S.: | 5.11 |
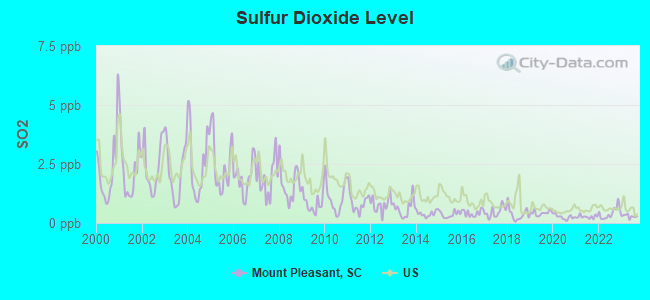
Sulfur Dioxide (SO2) [ppb] level in 2023 was 0.288. This is significantly better than average. Closest monitor was 0.3 miles away from the city center.
| City: | 0.288 |
| U.S.: | 1.515 |
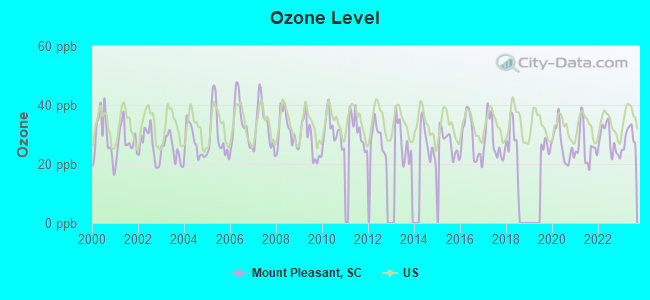
Ozone [ppb] level in 2023 was 29.0. This is about average. Closest monitor was 9.3 miles away from the city center.
| City: | 29.0 |
| U.S.: | 33.3 |
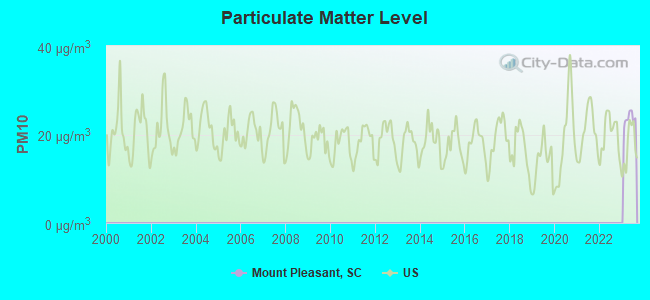

Particulate Matter (PM2.5) [µg/m3] level in 2023 was 9.89. This is worse than average. Closest monitor was 6.5 miles away from the city center.
| City: | 9.89 |
| U.S.: | 8.11 |
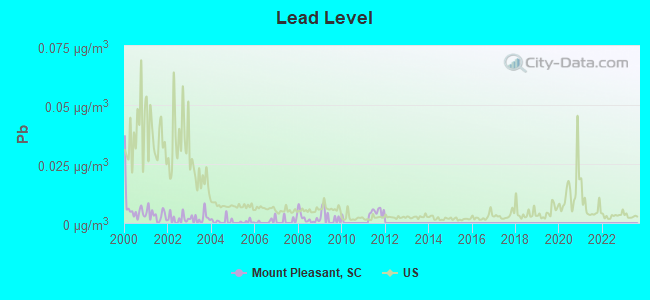
Lead (Pb) [µg/m3] level in 2011 was 0.00361. This is significantly better than average. Closest monitor was 5.0 miles away from the city center.
| City: | 0.00361 |
| U.S.: | 0.00931 |
Tornado activity:
Mount Pleasant-area historical tornado activity is significantly below South Carolina state average. It is 53% smaller than the overall U.S. average.
On 9/11/1960, a category F3 (max. wind speeds 158-206 mph) tornado 3.1 miles away from the Mount Pleasant town center injured 10 people and caused between $500,000 and $5,000,000 in damages.
On 8/29/1964, a category F2 (max. wind speeds 113-157 mph) tornado 3.6 miles away from the town center injured 2 people and caused between $500 and $5000 in damages.
Earthquake activity:
Mount Pleasant-area historical earthquake activity is significantly above South Carolina state average. It is 53% smaller than the overall U.S. average.On 11/22/1974 at 05:25:55, a magnitude 4.7 (4.7 MB, Class: Light, Intensity: IV - V) earthquake occurred 18.2 miles away from Mount Pleasant center
On 8/21/1992 at 16:31:55, a magnitude 4.4 (4.1 MB, 4.1 LG, 4.4 LG, Depth: 6.2 mi) earthquake occurred 22.2 miles away from the city center
On 8/2/1974 at 08:52:09, a magnitude 4.9 (4.3 MB, 4.9 LG) earthquake occurred 169.0 miles away from Mount Pleasant center
On 8/23/2011 at 17:51:04, a magnitude 5.8 (5.8 MW, Depth: 3.7 mi, Class: Moderate, Intensity: VI - VII) earthquake occurred 367.9 miles away from Mount Pleasant center
On 11/11/2002 at 23:39:29, a magnitude 4.0 (4.0 MB, Depth: 1.5 mi) earthquake occurred 29.5 miles away from Mount Pleasant center
On 4/17/1995 at 13:45:57, a magnitude 3.9 (3.9 LG, Depth: 6.2 mi, Class: Light, Intensity: II - III) earthquake occurred 15.5 miles away from the city center
Magnitude types: regional Lg-wave magnitude (LG), body-wave magnitude (MB), moment magnitude (MW)
Natural disasters:
The number of natural disasters in Charleston County (17) is near the US average (15).Major Disasters (Presidential) Declared: 7
Emergencies Declared: 6
Causes of natural disasters: Hurricanes: 9, Floods: 2, Storms: 2, Tropical Storms: 2, Winter Storms: 2, Drought: 1, Other: 1 (Note: some incidents may be assigned to more than one category).
Hospitals and medical centers in Mount Pleasant:
- CAROLINA HOSPICE CARE INC (410 MILL ST SUITE 401)
- EAST COOPER MEDICAL CENTER (Proprietary, provides emergency services, 2000 HOSPITAL DR)
- MOUNT PLEASANT HOSPITAL (Voluntary non-profit - Private, 3500 HIGHWAY 17 NORTH)
- FRANKE HEALTH CARE CENTER (1885 RIFLE RANGE ROAD)
- SANDPIPER REHAB AND NURSING (1049 ANNA KNAPP BOULEVARD)
- FRESENIUS MEDICAL CARE CHARLESTON COUNTY (901 VON KOLNITZ RD)
- MT PLEASANT DIALYSIS CENTER (1028 E-WALL STREET)
Airports located in Mount Pleasant:
- Mt Pleasant Regional-Faison Field Airport (LRO) (Runways: 1, Air Taxi Ops: 950, Itinerant Ops: 9,000, Local Ops: 19,000, Military Ops: 250)
- Raven's Run Airport (SC65) (Runways: 1)
Amtrak station near Mount Pleasant:
Colleges/universities with over 2000 students nearest to Mount Pleasant:
- College of Charleston (about 7 miles; Charleston, SC; Full-time enrollment: 10,974)
- Medical University of South Carolina (about 7 miles; Charleston, SC; FT enrollment: 2,138)
- Citadel Military College of South Carolina (about 7 miles; Charleston, SC; FT enrollment: 3,683)
- Trident Technical College (about 13 miles; Charleston, SC; FT enrollment: 13,125)
- Charleston Southern University (about 18 miles; Charleston, SC; FT enrollment: 3,012)
- South Carolina State University (about 75 miles; Orangeburg, SC; FT enrollment: 3,481)
- Orangeburg Calhoun Technical College (about 76 miles; Orangeburg, SC; FT enrollment: 2,113)
Public high school in Mount Pleasant:
- WANDO HIGH (Students: 3,382, Location: 1000 WARRIOR WAY, Grades: 9-12)
Biggest public elementary/middle schools in Mount Pleasant:
- THOMAS C. CARIO MIDDLE (Students: 1,284, Location: 3500 THOMAS CARIO BOULEVARD, Grades: 6-8)
- LAUREL HILL PRIMARY (Students: 1,113, Location: 3100 THOMAS CARIO BOULEVARD, Grades: PK-2)
- CHARLES PINCKNEY ELEMENTARY (Students: 1,027, Location: 3300 THOMAS CARIO BOULEVARD, Grades: 3-5)
- MOULTRIE MIDDLE (Students: 939, Location: 645 COLEMAN BOULEVARD, Grades: 6-8)
- BELLE HALL ELEMENTARY (Students: 813, Location: 385 EGYPT ROAD, Grades: PK-5)
- JENNIE MOORE ELEMENTARY (Students: 724, Location: 942 WHIPPLE ROAD, Grades: PK-5)
- MAMIE WHITESIDES ELEMENTARY (Students: 634, Location: 1565 RIFLE RANGE ROAD, Grades: PK-5)
- JAMES B. EDWARDS ELEMENTARY (Students: 568, Location: 885 VON KOLNITZ ROAD, Grades: PK-5)
- MT. PLEASANT ACADEMY (Students: 500, Location: 605 CENTER STREET, Grades: PK-5)
- LAING MIDDLE (Students: 495, Location: 1560 MATHIS FERRY ROAD, Grades: 6-8)
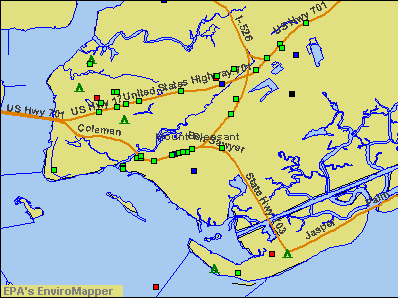
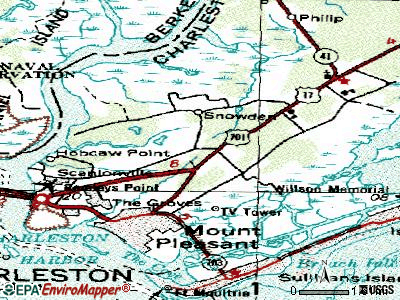
Points of interest:
Notable locations in Mount Pleasant: Wando Park Industrial Park (A), Anna Knapp Plaza (B), Brookgreen Town Center (C), Center Oak Plaza (D), Fairmont Plaza (E), Market Center (F), Mount Pleasant Town Center (G), National Crossing (H), Northcutt Plaza (I), Queensborough Center (J), Shoppes at Park West (K), Shops of Mount Pleasant (L), The Commons (M), Wando Crossing (N), Wando Plantation (O), Patriots Point Golf Links (P), Snee Farm Country Club Office (Q), Charleston Harbor Marina (R), Tolers Cove Marina (S), Crab Bank (T). Display/hide their locations on the map
Shopping Centers: Brickyard Falls Shopping Center (1), Mount Pleasant Square Shopping Center (2), Seaside Farms Shopping Center (3), Shelmore Shopping Center (4), Sweetgrass Shopping Center (5), Village Pointe Shopping Center (6), Sea Island Shopping Center (7), Patriots Plaza Shopping Center (8), Moultrie Shopping Center (9). Display/hide their locations on the map
Churches in Mount Pleasant include: Christ Episcopal Church (A), Ebenezer Church (B), Freewill Church (C), Friendship African Methodist Episcopal Church (D), Good Shepherd Church (E), Goodwill Church (F), Greater Olive Branch Church (G), Holy Trinity Church (H), Long Point Baptist Church (I). Display/hide their locations on the map
Cemeteries: Ocean Grove Cemetery (1), Confederate Cemetery (2), Venning Cemetery (3). Display/hide their locations on the map
Lakes and reservoirs: Lake Woodlawn (A), Lake Wackedaw (B). Display/hide their locations on the map
Rivers and creeks: Shem Creek (A), Wando River (B), Rathall Creek (C), Wagner Creek (D), Molasses Creek (E), Toomer Creek (F), Hobcaw Creek (G), Darrell Creek (H), Alston Creek (I). Display/hide their locations on the map
Parks in Mount Pleasant include: Mount Pleasant Sports Complex (1), Mount Pleasant Historic District (2), USS Yorktown State Park (3). Display/hide their locations on the map
Tourist attractions: Patriots Point Naval Museum (Patriots Point) (1), Yorktown (Museums; Patriots Point) (2), Charles Pinckney National Historic Site (Historical Places & Services; 1240 Long Point Road) (3), Carolina Coin Amusement (Amusement & Theme Parks; 1090 Johnnie Dodds Boulevard Suite C) (4), Bella Vita Retreat (1115 Shadow Lake Circle) (5), Spinz (613 Johnnie Dodds Boulevard) (6), McRae William H (1235 Long Point Road) (7), Boone Hall Plantation (Boone Hall Plantatio) (8), Coastal Expeditions Tours Kayak (Tours & Charters; 514 Mill Street Suite B) (9). Display/hide their approximate locations on the map
Hotels: Marriott Residence Inn (1116 Isle Of Palms Connec) (1), Quality Inn & Suites (196 Patriots Point Road) (2), Comfort Inn East (310 US 17 Bypass) (3), Hampton Inn Charleston-Mt Pleasant-Patri (255 Sessions Way) (4), Days Inn (261 Johnnie Dodds Boulevard) (5), Extended Stayamerica (304 Wingo Way) (6), Hilton Charleston Harbor Resort & Marina (20 Patriots Point Road) (7), Hampton Inn & Suites Isle of Palms (1104 Isle Of Palms Connector) (8), Fort Moultrie Motel (1330 Stuart Engals Boulevard) (9). Display/hide their approximate locations on the map
Court: MT Pleasant Town - Municipal Court (100 Ann Edwards Lane) (1). Display/hide its approximate location on the map
Birthplace of: Abraham J. Turner - Army general, Dexter Coakley - Football player, Temoc Suarez - Soccer player-coach, Amanda Baker - Television actor, Ben Hollingsworth - Soccer player, Kevin Warzynski - College basketball player (Kent State Golden Flashes).
| This town: | 2.4 people |
| South Carolina: | 2.5 people |
| This town: | 65.0% |
| Whole state: | 67.5% |
| This town: | 4.9% |
| Whole state: | 6.0% |
Likely homosexual households (counted as self-reported same-sex unmarried-partner households)
- Lesbian couples: 0.3% of all households
- Gay men: 0.3% of all households
People in group quarters in Mount Pleasant in 2010:
- 544 people in nursing facilities/skilled-nursing facilities
- 22 people in maritime/merchant vessels
- 2 people in other noninstitutional facilities
People in group quarters in Mount Pleasant in 2000:
- 496 people in nursing homes
- 73 people in wards in general hospitals for patients who have no usual home elsewhere
- 53 people in other noninstitutional group quarters
- 39 people in homes or halfway houses for drug/alcohol abuse
- 2 people in religious group quarters
Banks with most branches in Mount Pleasant (2011 data):
- Wells Fargo Bank, National Association: Long Point Road Branch, Mt Pleasant Towne Centre Night Depos, Mount Pleasant Main, Wando Crossing Branch, Mount Pleasant By-Pass Branch, The Market At Oakland Branch. Info updated 2011/04/05: Bank assets: $1,161,490.0 mil, Deposits: $905,653.0 mil, headquarters in Sioux Falls, SD, positive income, 6395 total offices, Holding Company: Wells Fargo & Company
- SouthCoast Community Bank: Southcoast Community Bank, Coleman Branch, Messenger Service Branch, I-Bank, Park West Branch. Info updated 2006/11/03: Bank assets: $425.3 mil, Deposits: $318.7 mil, local headquarters, negative income in the last year, Commercial Lending Specialization, 12 total offices, Holding Company: Southcoast Financial Corporation
- First Federal Savings and Loan Association of Charleston: 602 Hwy 17-N By-Pass Branch, 822 Coleman Boulevard Branch, Mount Pleasant Branch, Long Point Road Branch, Proprietors Place Branch. Info updated 2012/02/24: Bank assets: $3,140.4 mil, Deposits: $2,278.8 mil, headquarters in Charleston, SC, negative income in the last year, Mortgage Lending Specialization, 69 total offices
- SunTrust Bank: Mathis Ferry Branch, Mount Pleasant Square Bi-Lo Branch, Ivy Hall Branch. Info updated 2010/05/27: Bank assets: $171,291.7 mil, Deposits: $129,833.2 mil, headquarters in Atlanta, GA, positive income, Commercial Lending Specialization, 1716 total offices, Holding Company: Suntrust Banks, Inc.
- First Citizens Bank and Trust Company, Inc.: Coleman Blvd Branch, 17 North Branch, Johnnie Dodds Branch. Info updated 2011/08/24: Bank assets: $8,104.0 mil, Deposits: $6,880.8 mil, headquarters in Columbia, SC, positive income, 197 total offices, Holding Company: First Citizens Bancorporation, Inc.
- Bank of America, National Association: Anna Knapp Branch, Brookgreen Town Center Branch, Sweetgrass Branch. Info updated 2009/11/18: Bank assets: $1,451,969.3 mil, Deposits: $1,077,176.8 mil, headquarters in Charlotte, NC, positive income, 5782 total offices, Holding Company: Bank Of America Corporation
- Tidelands Bank: at 875 Lowcountry Boulevard, branch established on 2003/10/06; Park West Branch at 1100 Park West Boulevard, branch established on 2007/06/30. Info updated 2011/10/13: Bank assets: $532.3 mil, Deposits: $446.6 mil, local headquarters, negative income in the last year, Commercial Lending Specialization, 7 total offices, Holding Company: Tidelands Bancshares, Inc.
- Regions Bank: Mt. Pleasant Branch at 1210 Ben Sawyer Boulevard, branch established on 1996/09/30; Towne Centre Branch at 1200 Two Islands Court, branch established on 2003/03/03. Info updated 2011/02/24: Bank assets: $123,368.2 mil, Deposits: $98,301.3 mil, headquarters in Birmingham, AL, positive income, Commercial Lending Specialization, 1778 total offices, Holding Company: Regions Financial Corporation
- Branch Banking and Trust Company: Mt. Pleasant Branch at 885 Johnnie Dodds Boulevard, branch established on 1933/01/01; Mount Pleasant North Branch at 2692 N. Highway 17, branch established on 2001/11/29. Info updated 2010/03/29: Bank assets: $168,867.6 mil, Deposits: $127,549.5 mil, headquarters in Winston Salem, NC, positive income, Commercial Lending Specialization, 1793 total offices, Holding Company: Bb&T Corporation
- 13 other banks with 14 local branches
For population 15 years and over in Mount Pleasant:
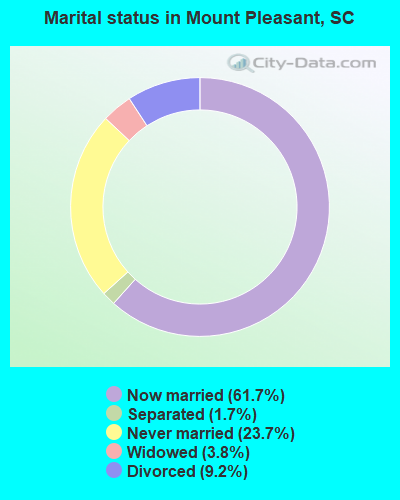
- Never married: 23.7%
- Now married: 61.7%
- Separated: 1.7%
- Widowed: 3.8%
- Divorced: 9.2%
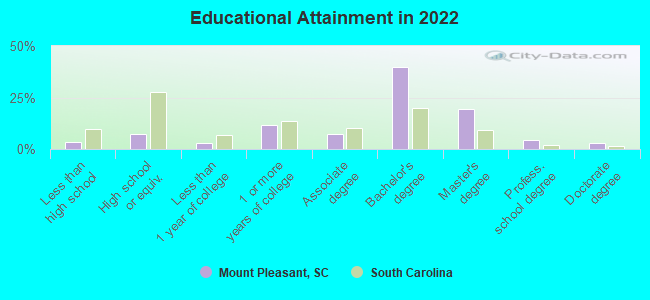
For population 25 years and over in Mount Pleasant:
- High school or higher: 96.5%
- Bachelor's degree or higher: 66.8%
- Graduate or professional degree: 26.8%
- Unemployed: 2.2%
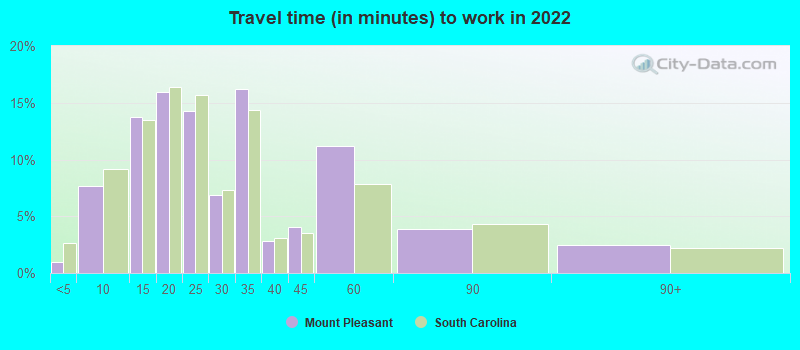
- Mean travel time to work (commute): 17.6 minutes
| Here: | 8.8 |
| South Carolina average: | 11.1 |
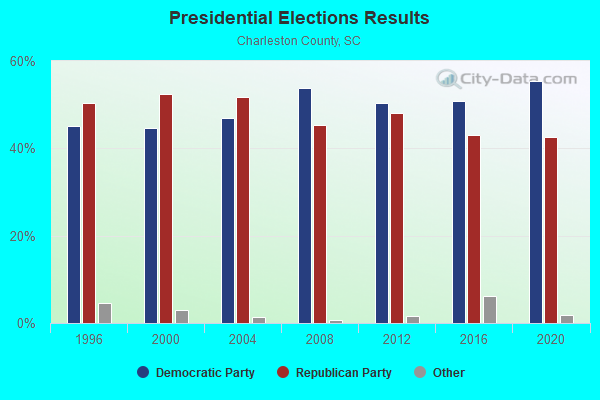
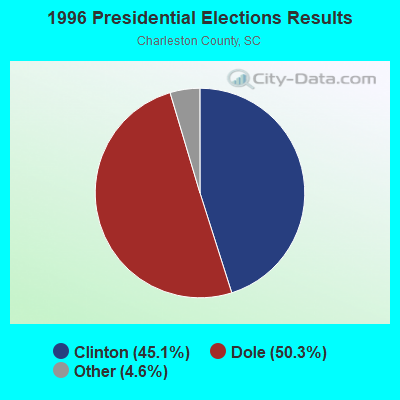
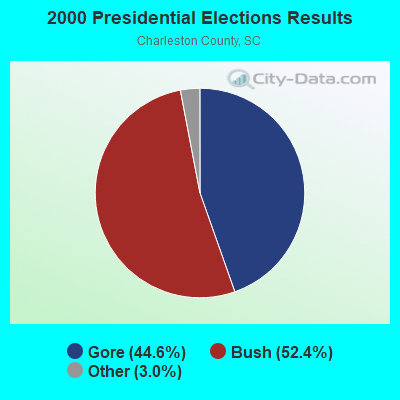
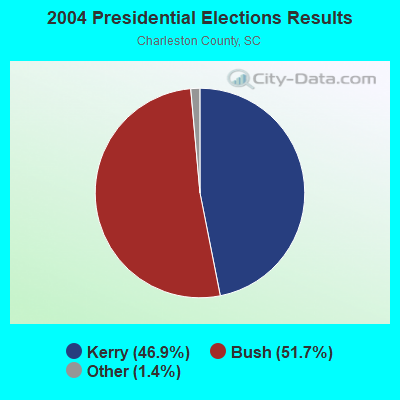
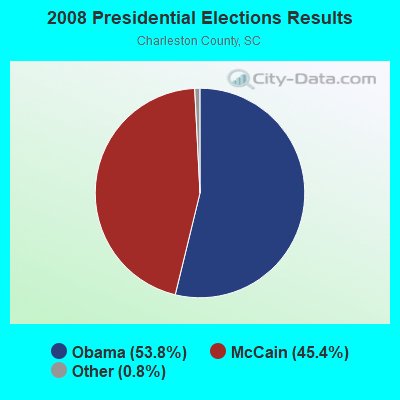
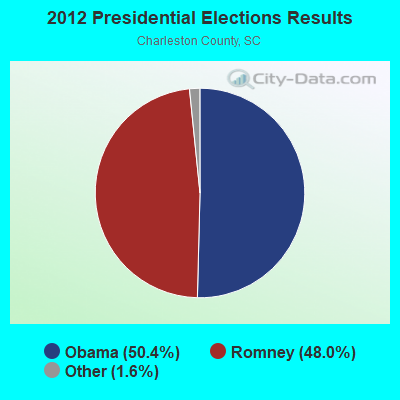
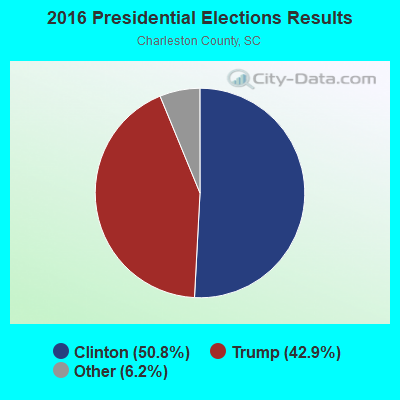
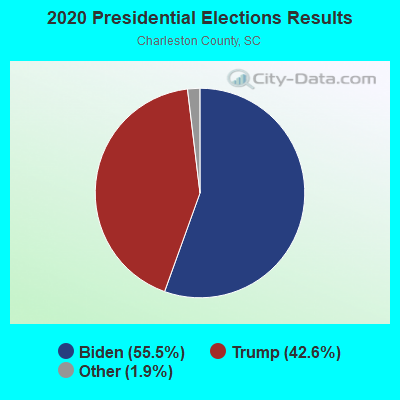
Graphs represent county-level data. Detailed 2008 Election Results
Political contributions by individuals in Mount Pleasant, SC
Religion statistics for Mount Pleasant, SC (based on Charleston County data)
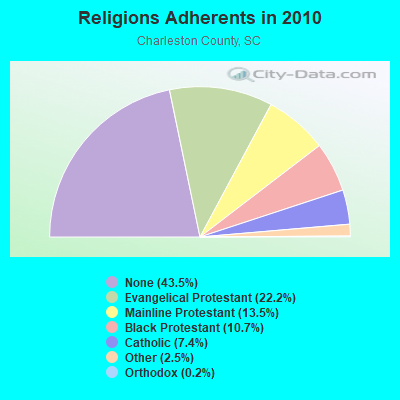
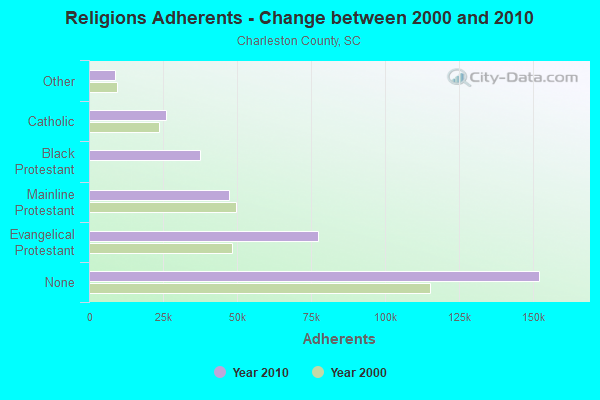
| Religion | Adherents | Congregations |
|---|---|---|
| Evangelical Protestant | 77,602 | 223 |
| Mainline Protestant | 47,209 | 106 |
| Black Protestant | 37,531 | 103 |
| Catholic | 26,003 | 19 |
| Other | 8,688 | 24 |
| Orthodox | 850 | 2 |
| None | 152,326 | - |
Food Environment Statistics:
| Charleston County: | 2.56 / 10,000 pop. |
| State: | 1.99 / 10,000 pop. |
| Here: | 0.15 / 10,000 pop. |
| South Carolina: | 0.15 / 10,000 pop. |
| Charleston County: | 0.55 / 10,000 pop. |
| South Carolina: | 0.85 / 10,000 pop. |
| Charleston County: | 4.08 / 10,000 pop. |
| South Carolina: | 5.38 / 10,000 pop. |
| This county: | 11.44 / 10,000 pop. |
| South Carolina: | 7.75 / 10,000 pop. |
| Charleston County: | 8.8% |
| South Carolina: | 10.6% |
| Charleston County: | 25.5% |
| State: | 29.4% |
| This county: | 13.7% |
| South Carolina: | 13.4% |
Health and Nutrition:
| This city: | 54.4% |
| South Carolina: | 49.2% |
| Here: | 54.0% |
| South Carolina: | 46.2% |
| This city: | 28.1 |
| South Carolina: | 29.0 |
| Mount Pleasant: | 19.4% |
| State: | 20.4% |
| This city: | 8.9% |
| South Carolina: | 11.0% |
| Here: | 6.9 |
| State: | 6.8 |
| Mount Pleasant: | 32.9% |
| South Carolina: | 34.4% |
| Here: | 61.6% |
| South Carolina: | 55.6% |
| Mount Pleasant: | 81.7% |
| South Carolina: | 79.9% |
More about Health and Nutrition of Mount Pleasant, SC Residents
| Local government employment and payroll (March 2022) | |||||
| Function | Full-time employees | Monthly full-time payroll | Average yearly full-time wage | Part-time employees | Monthly part-time payroll |
|---|---|---|---|---|---|
| Police Protection - Officers | 153 | $761,694 | $59,741 | 0 | $0 |
| Firefighters | 128 | $754,026 | $70,690 | 0 | $0 |
| Other Government Administration | 64 | $335,157 | $62,842 | 16 | $23,334 |
| Parks and Recreation | 58 | $248,988 | $51,515 | 93 | $84,654 |
| Solid Waste Management | 51 | $202,592 | $47,669 | 0 | $0 |
| Sewerage | 39 | $160,317 | $49,328 | 0 | $0 |
| Financial Administration | 33 | $177,774 | $64,645 | 0 | $0 |
| Police - Other | 19 | $78,769 | $49,749 | 0 | $0 |
| Other and Unallocable | 16 | $80,414 | $60,311 | 0 | $0 |
| Judicial and Legal | 15 | $75,095 | $60,076 | 6 | $12,055 |
| Streets and Highways | 10 | $72,403 | $86,884 | 0 | $0 |
| Fire - Other | 2 | $8,359 | $50,154 | 2 | $3,100 |
| Housing and Community Development (Local) | 1 | $3,858 | $46,296 | 0 | $0 |
| Natural Resources | 1 | $5,961 | $71,532 | 0 | $0 |
| Totals for Government | 590 | $2,965,405 | $60,313 | 117 | $123,143 |
Mount Pleasant government finances - Expenditure in 2021 (per resident):
- Construction - Sewerage: $28,024,000 ($296.41)
Water Utilities: $11,174,000 ($118.19)
Regular Highways: $5,072,000 ($53.65)
Local Fire Protection: $4,842,000 ($51.21)
Solid Waste Management: $2,513,000 ($26.58)
Parks and Recreation: $696,000 ($7.36)
Central Staff Services: $508,000 ($5.37)
Police Protection: $4,000 ($0.04)
- Current Operations - Police Protection: $16,435,000 ($173.83)
Sewerage: $15,959,000 ($168.80)
Solid Waste Management: $15,892,000 ($168.09)
Water Utilities: $12,767,000 ($135.04)
Local Fire Protection: $12,673,000 ($134.04)
General - Other: $10,054,000 ($106.34)
Parks and Recreation: $6,879,000 ($72.76)
Regular Highways: $6,179,000 ($65.36)
Central Staff Services: $6,078,000 ($64.29)
Financial Administration: $3,291,000 ($34.81)
Judicial and Legal Services: $1,838,000 ($19.44)
Natural Resources - Other: $198,000 ($2.09)
- General - Interest on Debt: $2,422,000 ($25.62)
- Intergovernmental to Local - Other - Water Utilities: $1,517,000 ($16.05)
Other - Natural Resources - Other: $465,000 ($4.92)
Other - Sewerage: $292,000 ($3.09)
Other - Police Protection: $151,000 ($1.60)
Other - Local Fire Protection: $60,000 ($0.63)
- Other Capital Outlay - General - Other: $2,298,000 ($24.31)
Sewerage: $808,000 ($8.55)
Water Utilities: $808,000 ($8.55)
Regular Highways: $760,000 ($8.04)
Police Protection: $447,000 ($4.73)
Local Fire Protection: $171,000 ($1.81)
Parks and Recreation: $146,000 ($1.54)
Financial Administration: $95,000 ($1.00)
- Total Salaries and Wages: $44,022,000 ($465.62)
- Water Utilities - Interest on Debt: $5,830,000 ($61.66)
Mount Pleasant government finances - Revenue in 2021 (per resident):
- Charges - Sewerage: $30,754,000 ($325.28)
Parks and Recreation: $2,927,000 ($30.96)
Other: $11,000 ($0.12)
- Federal Intergovernmental - Other: $7,018,000 ($74.23)
Highways: $118,000 ($1.25)
- Local Intergovernmental - Other: $1,021,000 ($10.80)
Public Welfare: $603,000 ($6.38)
General Local Government Support: $432,000 ($4.57)
Highways: $52,000 ($0.55)
Sewerage: $50,000 ($0.53)
Water Utilities: $34,000 ($0.36)
- Miscellaneous - General Revenue - Other: $15,598,000 ($164.98)
Special Assessments: $3,724,000 ($39.39)
Sale of Property: $719,000 ($7.60)
Interest Earnings: $601,000 ($6.36)
Fines and Forfeits: $479,000 ($5.07)
Donations From Private Sources: $46,000 ($0.49)
- Revenue - Water Utilities: $24,848,000 ($262.82)
- State Intergovernmental - General Local Government Support: $3,710,000 ($39.24)
Other: $907,000 ($9.59)
Highways: $167,000 ($1.77)
Sewerage: $40,000 ($0.42)
Water Utilities: $28,000 ($0.30)
- Tax - Property: $36,012,000 ($380.90)
Occupation and Business License - Other: $26,180,000 ($276.91)
General Sales and Gross Receipts: $11,492,000 ($121.55)
Other Selective Sales: $8,262,000 ($87.39)
Public Utility License: $7,822,000 ($82.73)
Other License: $1,268,000 ($13.41)
Mount Pleasant government finances - Debt in 2021 (per resident):
- Long Term Debt - Outstanding Unspecified Public Purpose: $254,908,000 ($2696.16)
Beginning Outstanding - Unspecified Public Purpose: $254,241,000 ($2689.10)
Issue, Unspecified Public Purpose: $20,470,000 ($216.51)
Retired Unspecified Public Purpose: $19,803,000 ($209.46)
Mount Pleasant government finances - Cash and Securities in 2021 (per resident):
- Bond Funds - Cash and Securities: $18,991,000 ($200.87)
- Other Funds - Cash and Securities: $295,704,000 ($3127.65)
- Sinking Funds - Cash and Securities: $2,882,000 ($30.48)
10.38% of this county's 2021 resident taxpayers lived in other counties in 2020 ($106,855 average adjusted gross income)
| Here: | 10.38% |
| South Carolina average: | 8.89% |
0.04% of residents moved from foreign countries ($264 average AGI)
Charleston County: 0.04% South Carolina average: 0.04%
Top counties from which taxpayers relocated into this county between 2020 and 2021:
| from Berkeley County, SC | |
| from Dorchester County, SC | |
| from Mecklenburg County, NC |
9.80% of this county's 2020 resident taxpayers moved to other counties in 2021 ($68,552 average adjusted gross income)
| Here: | 9.80% |
| South Carolina average: | 7.46% |
0.05% of residents moved to foreign countries ($339 average AGI)
Charleston County: 0.05% South Carolina average: 0.03%
Top counties to which taxpayers relocated from this county between 2020 and 2021:
| to Berkeley County, SC | |
| to Dorchester County, SC | |
| to Greenville County, SC |
| Businesses in Mount Pleasant, SC | ||||
| Name | Count | Name | Count | |
|---|---|---|---|---|
| AT&T | 1 | McDonald's | 3 | |
| Advance Auto Parts | 1 | Men's Wearhouse | 1 | |
| Ann Taylor | 1 | New Balance | 4 | |
| Applebee's | 1 | Nike | 4 | |
| Arby's | 1 | Office Depot | 1 | |
| Banana Republic | 1 | Old Navy | 1 | |
| Baskin-Robbins | 1 | Pier 1 Imports | 1 | |
| Best Western | 1 | Pizza Hut | 3 | |
| Blockbuster | 2 | Publix Super Markets | 3 | |
| Burger King | 1 | Qdoba Mexican Grill | 1 | |
| CVS | 5 | Quality | 1 | |
| Cache | 1 | Red Roof Inn | 1 | |
| Chevrolet | 1 | Rite Aid | 3 | |
| Chick-Fil-A | 2 | Rodeway Inn | 1 | |
| Chico's | 1 | SONIC Drive-In | 2 | |
| Circle K | 3 | Sleep Inn | 1 | |
| Coldwater Creek | 1 | Sprint Nextel | 2 | |
| Comfort Suites | 1 | Starbucks | 4 | |
| Domino's Pizza | 1 | Subway | 4 | |
| Dunkin Donuts | 2 | T.G.I. Driday's | 1 | |
| FedEx | 9 | Taco Bell | 2 | |
| GNC | 1 | Talbots | 2 | |
| GameStop | 1 | Target | 1 | |
| Gap | 1 | The Room Place | 1 | |
| H&R Block | 2 | Tire Kingdom | 1 | |
| Hilton | 3 | True Value | 1 | |
| Holiday Inn | 2 | U-Haul | 1 | |
| IHOP | 1 | UPS | 19 | |
| JoS. A. Bank | 1 | Verizon Wireless | 2 | |
| Just Tires | 1 | Volkswagen | 1 | |
| KFC | 1 | Waffle House | 1 | |
| Kohl's | 1 | Walgreens | 1 | |
| Lowe's | 1 | Walmart | 1 | |
| MainStay | 1 | Whole Foods Market | 1 | |
Strongest AM radio stations in Mount Pleasant:
- WZJY (1480 AM; 1 kW; MOUNT PLEASANT, SC; Owner: LEVAS COMMUNICATIONS, LLC)
- WIQB (1050 AM; 25 kW; CONWAY, SC; Owner: CUMULUS LICENSING CORP.)
- WTMA (1250 AM; 5 kW; CHARLESTON, SC; Owner: CITADEL BROADCASTING COMPANY)
- WSCC (730 AM; 5 kW; CHARLESTON, SC; Owner: CITICASTERS LICENSES, L.P.)
- WXTC (1390 AM; 5 kW; CHARLESTON, SC)
- WQSC (1340 AM; 1 kW; CHARLESTON, SC; Owner: KIRKMAN BROADCASTING, INC,)
- WQNT (1450 AM; 1 kW; CHARLESTON, SC; Owner: KIRKMAN BROADCASTING, INC.)
- WQTK (950 AM; 10 kW; MONCKS CORNER, SC; Owner: KIRKMAN BROADCASTING, INC.)
- WTMZ (910 AM; 0 kW; DORCHESTER TERR.-BRE, SC; Owner: CITADEL BROADCASTING COMPANY)
- WCEO (840 AM; daytime; 50 kW; COLUMBIA, SC; Owner: EASTERN BROADCASTING GROUP, INC.)
- WBAJ (890 AM; daytime; 50 kW; BLYTHEWOOD, SC; Owner: FAMILY FIRST)
- WQIZ (810 AM; daytime; 5 kW; ST. GEORGE, SC; Owner: RADIO PROPERTIES, LLC)
- WLFJ (660 AM; daytime; 50 kW; GREENVILLE, SC; Owner: CLEAR CHANNEL BROADCASTING LICENSES, INC.)
Strongest FM radio stations in Mount Pleasant:
- WEZL (103.5 FM; CHARLESTON, SC; Owner: CITICASTERS LICENSES, L.P.)
- WFCH (88.5 FM; CHARLESTON, SC; Owner: FAMILY STATIONS, INC.)
- WSSX-FM (95.1 FM; CHARLESTON, SC; Owner: CITADEL BROADCASTING COMPANY)
- WXLY (102.5 FM; NORTH CHARLESTON, SC; Owner: CITICASTERS LICENSES, L.P.)
- WRFQ (104.5 FM; MOUNT PLEASANT, SC; Owner: CITICASTERS LICENSES, L.P.)
- W220CN (91.9 FM; CHARLESTON, SC; Owner: RADIO TRAINING NETWORK, INC.)
- W205BJ (88.9 FM; CHARLESTON, SC; Owner: CALVARY CHAPEL OF TWIN FALLS, INC.)
- WSUY (96.9 FM; CHARLESTON, SC; Owner: CITADEL BROADCASTING COMPANY)
- WAVF (96.1 FM; HANAHAN, SC; Owner: APEX BROADCASTING, INC.)
- WSCI (89.3 FM; CHARLESTON, SC; Owner: SOUTH CAROLINA EDUCATIONAL TV COMMISSION)
- WWWZ (93.3 FM; SUMMERVILLE, SC; Owner: CITADEL BROADCASTING COMPANY)
- WALC (100.5 FM; CHARLESTON, SC; Owner: CITICASTERS LICENSES, L.P.)
- WSSP (94.3 FM; GOOSE CREEK, SC; Owner: CLEAR CHANNEL BROADCASTING LICENSES, INC.)
- WYBB (98.1 FM; FOLLY BEACH, SC; Owner: L.M. COMMUNICATIONS OF SOUTH CAROLINA, INC.)
- WCOO (105.5 FM; KIAWAH ISLAND, SC; Owner: L.M. COMMUNICATIONS II OF SOUTH CAROLINA, INC.)
- WMGL (101.7 FM; RAVENEL, SC; Owner: CITADEL BROADCASTING COMPANY)
- WCSQ (92.5 FM; MONCKS CORNER, SC; Owner: APEX BROADCASTING, INC.)
- WNKT (107.5 FM; ST. GEORGE, SC; Owner: CITADEL BROADCASTING COMPANY)
- WJNI (106.3 FM; LADSON, SC; Owner: THOMAS B. DANIELS)
- WJZX (99.7 FM; HOLLYWOOD, SC; Owner: APEX BROADCASTING, INC.)
TV broadcast stations around Mount Pleasant:
- W21BX (Channel 21; CHARLESTON, SC; Owner: TRINITY BROADCASTING NETWORK)
- WJRB-LP (Channel 18; CHARLESTON, SC; Owner: RAUL INFANTE, JR.)
- WCBD-TV (Channel 2; CHARLESTON, SC; Owner: MEDIA GENERAL COMMUNICATIONS, INC.)
- WCHD-LP (Channel 49; CHARLESTON, SC; Owner: IZZO LIVING TRUST)
- WCSC-TV (Channel 5; CHARLESTON, SC; Owner: WCSC, INC.)
- WITV (Channel 7; CHARLESTON, SC; Owner: SOUTH CAROLINA EDUCATIONAL TV COMMISSION)
- WCIV (Channel 4; CHARLESTON, SC; Owner: WCIV, LLC)
- WMMP (Channel 36; CHARLESTON, SC; Owner: WMMP LICENSEE L.P.)
- WTAT-TV (Channel 24; CHARLESTON, SC; Owner: WTAT LICENSEE, LLC)
- WJEA-LP (Channel 12; CHARLESTON, SC; Owner: CHARLES S. NAMEY)
- WJWJ-TV (Channel 16; BEAUFORT, SC; Owner: SOUTH CAROLINA EDUCATIONAL TV COMMISSION)
- WJNI-LP (Channel 57; NORTH CHARLESTON, SC; Owner: THOMAS B. DANIELS)
- WTBD-LP (Channel 22; NORTH CHARLESTON, SC; Owner: THOMAS B. DANIELS)
- W26CF (Channel 26; SUMMERVILLE, SC; Owner: DOVE BROADCASTING, INC.)
- National Bridge Inventory (NBI) Statistics
- 66Number of bridges
- 4,944ft / 1,507mTotal length
- $11,898,000Total costs
- 899,399Total average daily traffic
- 67,451Total average daily truck traffic
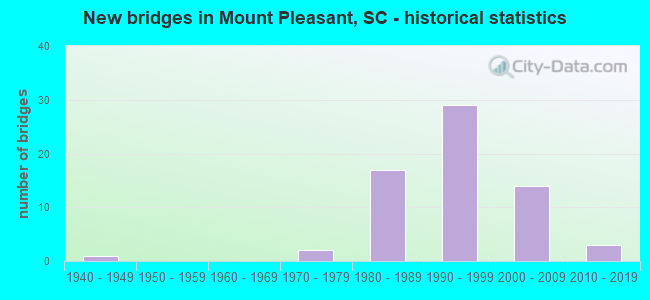
- New bridges - historical statistics
- 11940-1949
- 21970-1979
- 171980-1989
- 291990-1999
- 142000-2009
- 32010-2019
FCC Registered Commercial Land Mobile Towers: 4 (See the full list of FCC Registered Commercial Land Mobile Towers in Mount Pleasant, SC)
FCC Registered Private Land Mobile Towers: 7 (See the full list of FCC Registered Private Land Mobile Towers)
FCC Registered Broadcast Land Mobile Towers: 29 (See the full list of FCC Registered Broadcast Land Mobile Towers)
FCC Registered Microwave Towers: 26 (See the full list of FCC Registered Microwave Towers in this town)
FCC Registered Paging Towers: 2 (See the full list of FCC Registered Paging Towers)
FCC Registered Maritime Coast & Aviation Ground Towers: 6 (See the full list of FCC Registered Maritime Coast & Aviation Ground Towers)
FCC Registered Amateur Radio Licenses: 248 (See the full list of FCC Registered Amateur Radio Licenses in Mount Pleasant)
FAA Registered Aircraft Manufacturers and Dealers: 1 (See the full list of FAA Registered Manufacturers and Dealers in Mount Pleasant)
FAA Registered Aircraft: 73 (See the full list of FAA Registered Aircraft)
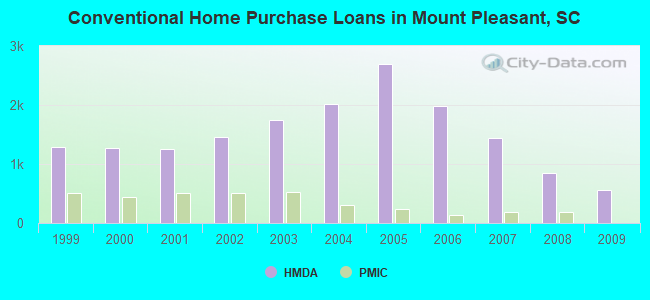
| Home Mortgage Disclosure Act Aggregated Statistics For Year 2009 (Based on 2 full and 4 partial tracts) | ||||||||||||
| A) FHA, FSA/RHS & VA Home Purchase Loans | B) Conventional Home Purchase Loans | C) Refinancings | D) Home Improvement Loans | F) Non-occupant Loans on < 5 Family Dwellings (A B C & D) | G) Loans On Manufactured Home Dwelling (A B C & D) | |||||||
|---|---|---|---|---|---|---|---|---|---|---|---|---|
| Number | Average Value | Number | Average Value | Number | Average Value | Number | Average Value | Number | Average Value | Number | Average Value | |
| LOANS ORIGINATED | 203 | $238,541 | 554 | $316,932 | 2,253 | $268,459 | 50 | $157,567 | 248 | $259,287 | 3 | $138,043 |
| APPLICATIONS APPROVED, NOT ACCEPTED | 6 | $240,912 | 33 | $303,982 | 134 | $313,182 | 5 | $117,780 | 19 | $256,051 | 1 | $124,760 |
| APPLICATIONS DENIED | 36 | $216,330 | 73 | $307,111 | 623 | $308,191 | 23 | $132,002 | 62 | $231,235 | 3 | $91,087 |
| APPLICATIONS WITHDRAWN | 28 | $238,666 | 93 | $310,671 | 436 | $285,957 | 4 | $137,785 | 51 | $233,834 | 0 | $0 |
| FILES CLOSED FOR INCOMPLETENESS | 4 | $224,270 | 17 | $378,151 | 114 | $262,716 | 3 | $209,393 | 15 | $225,886 | 0 | $0 |
Detailed HMDA statistics for the following Tracts: 0046.01 , 0046.04, 0046.05, 0046.06, 0046.07, 0047.00
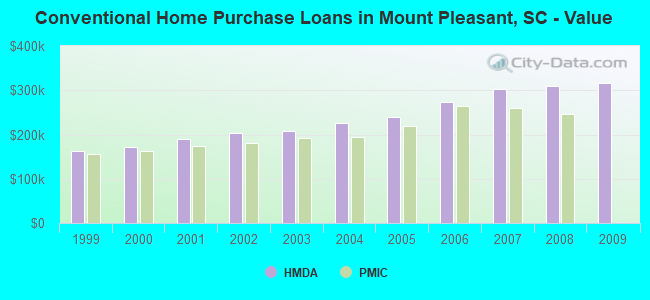
| Private Mortgage Insurance Companies Aggregated Statistics For Year 2008 (Based on 2 full and 4 partial tracts) | ||||||
| A) Conventional Home Purchase Loans | B) Refinancings | C) Non-occupant Loans on < 5 Family Dwellings (A & B) | ||||
|---|---|---|---|---|---|---|
| Number | Average Value | Number | Average Value | Number | Average Value | |
| LOANS ORIGINATED | 187 | $246,907 | 56 | $280,186 | 24 | $202,632 |
| APPLICATIONS APPROVED, NOT ACCEPTED | 50 | $333,870 | 26 | $286,601 | 7 | $391,736 |
| APPLICATIONS DENIED | 11 | $285,182 | 8 | $290,281 | 3 | $270,850 |
| APPLICATIONS WITHDRAWN | 13 | $286,226 | 5 | $363,586 | 4 | $163,448 |
| FILES CLOSED FOR INCOMPLETENESS | 4 | $309,292 | 4 | $465,688 | 2 | $244,650 |
Detailed PMIC statistics for the following Tracts: 0046.01 , 0046.04, 0046.05, 0046.06, 0046.07, 0047.00
2003 - 2018 National Fire Incident Reporting System (NFIRS) incidents
- Fire incident types reported to NFIRS in Mount Pleasant, SC
- 60142.6%Outside Fires
- 58641.6%Structure Fires
- 19113.5%Mobile Property/Vehicle Fires
- 322.3%Other
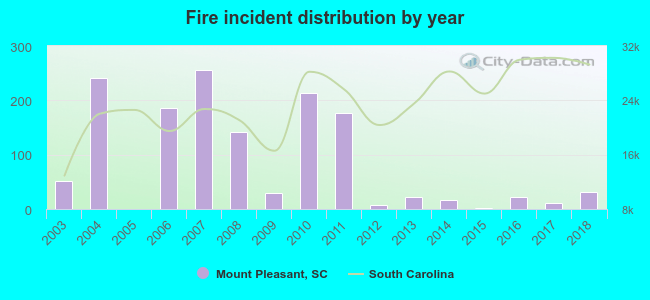 Based on the data from the years 2003 - 2018 the average number of fire incidents per year is 88. The highest number of reported fires - 256 took place in 2007, and the least - 0 in 2005. The data has a decreasing trend.
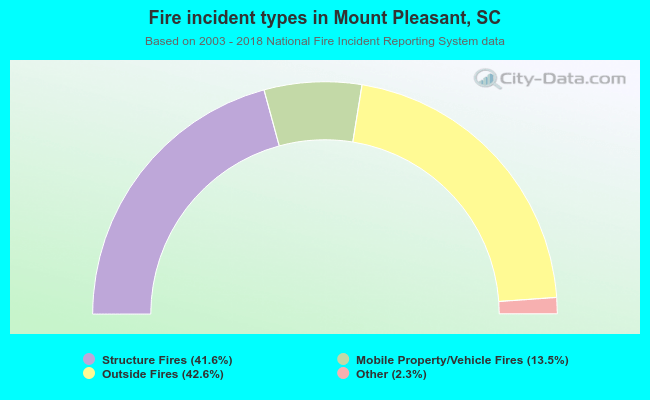 When looking into fire subcategories, the most incidents belonged to: Outside Fires (42.6%), and Structure Fires (41.6%).
Fire-safe hotels and motels in Mount Pleasant, South Carolina:
- Hampton Inn Patriots Point, 255 Sessions Way, Mount Pleasant, South Carolina 29464 , Phone: (843) 881-3300, Fax: (843) 881-6288
- Holiday Inn - Charleston, 250 Johnnie Dodds Blvd, Mount Pleasant, South Carolina 29464 , Phone: (843) 884-6000, Fax: (843) 881-1786
- Shem Creek Inn, 1401 Shrimp Boat Ln, Mount Pleasant, South Carolina 29464 , Phone: (843) 881-1000, Fax: (843) 849-6969
- Rodeway Inn, 310 Hwy 17 Byp, Mount Pleasant, South Carolina 29464 , Phone: (843) 884-5853, Fax: (843) 881-6279
- Quality Inn & Suites At Patriots Point, 196 Patriots Point Rd, Mount Pleasant, South Carolina 29464 , Phone: (843) 856-8817, Fax: (843) 856-8818
- Extended Stay America - Charleston - Mt Pleasant, 304 Wingo Way, Mount Pleasant, South Carolina 29464 , Phone: (843) 884-4453, Fax: (843) 884-3926
- Mainstay Suites, 400 Mcgrath Darby Blvd, Mount Pleasant, South Carolina 29464 , Phone: (843) 881-1722, Fax: (843) 881-1723
- Hampton Inn & Suites, 1104 Isle Of Palms Connector, Mount Pleasant, South Carolina 29464 , Phone: (843) 856-3900, Fax: (843) 881-6277
- 15 other hotels and motels
| Most common first names in Mount Pleasant, SC among deceased individuals | ||
| Name | Count | Lived (average) |
|---|---|---|
| John | 237 | 73.1 years |
| James | 187 | 72.1 years |
| William | 183 | 73.1 years |
| Mary | 182 | 79.3 years |
| Robert | 119 | 73.6 years |
| Charles | 103 | 74.7 years |
| Elizabeth | 95 | 80.6 years |
| Margaret | 91 | 79.6 years |
| Joseph | 87 | 76.1 years |
| Helen | 87 | 82.6 years |
| Most common last names in Mount Pleasant, SC among deceased individuals | ||
| Last name | Count | Lived (average) |
|---|---|---|
| Brown | 115 | 73.4 years |
| Smith | 81 | 76.7 years |
| Johnson | 50 | 77.7 years |
| Wilson | 47 | 80.4 years |
| Simmons | 44 | 73.0 years |
| Williams | 42 | 75.4 years |
| Robinson | 41 | 71.3 years |
| Wright | 41 | 71.9 years |
| Jones | 40 | 77.6 years |
| Washington | 39 | 74.0 years |
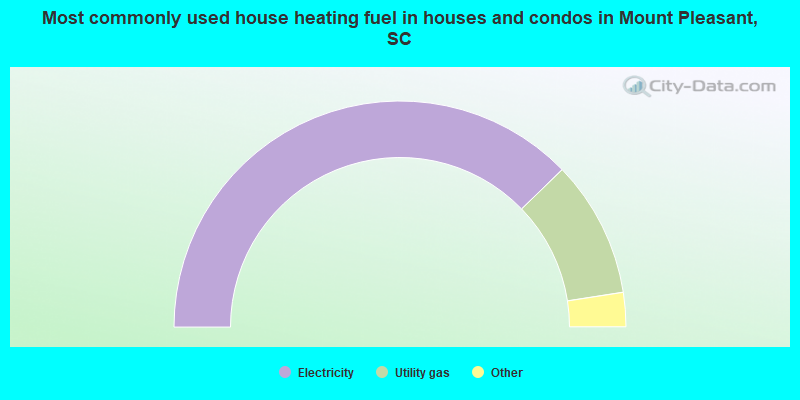
- 75.5%Electricity
- 19.6%Utility gas
- 3.9%Bottled, tank, or LP gas
- 0.7%Solar energy
- 0.2%Fuel oil, kerosene, etc.
- 0.1%No fuel used
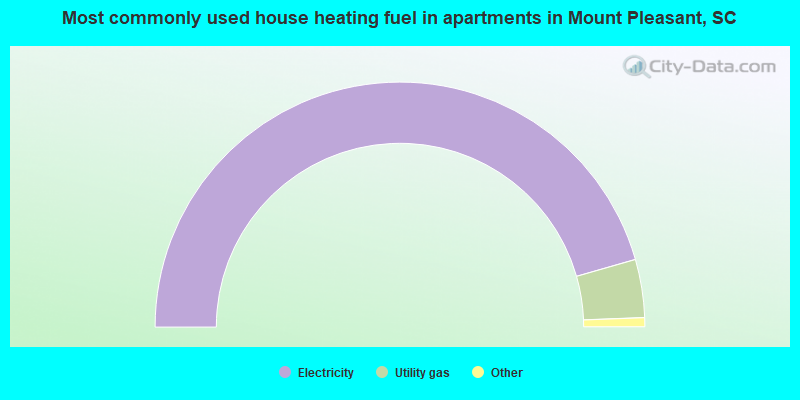
- 91.2%Electricity
- 7.7%Utility gas
- 0.8%No fuel used
- 0.4%Bottled, tank, or LP gas
Mount Pleasant compared to South Carolina state average:
- Median household income above state average.
- Median house value significantly above state average.
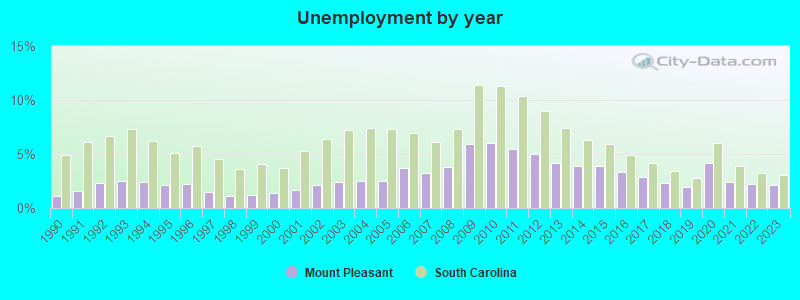
- Unemployed percentage significantly below state average.
- Black race population percentage significantly below state average.
- Foreign-born population percentage above state average.
- Length of stay since moving in significantly below state average.
- House age below state average.
- Percentage of population with a bachelor's degree or higher significantly above state average.
Mount Pleasant on our top lists:
- #4 on the list of "Top 101 cities with largest percentage of females in occupations: management occupations (population 50,000+)"
- #5 on the list of "Top 101 cities with largest percentage of males in occupations: management occupations (population 50,000+)"
- #6 on the list of "Top 101 cities with largest percentage of females in occupations: architecture and engineering occupations (population 50,000+)"
- #8 on the list of "Top 101 cities with the lowest number of robberies per 100,000 residents (population 50,000+)"
- #17 on the list of "Top 101 cities with largest percentage of males in occupations: business and financial operations occupations (population 50,000+)"
- #18 on the list of "Top 101 cities with largest percentage of males in occupations: health diagnosing and treating practitioners and other technical occupations (population 50,000+)"
- #19 on the list of "Top 101 cities with largest percentage of females in occupations: health diagnosing and treating practitioners and other technical occupations (population 50,000+)"
- #25 on the list of "Top 101 cities with largest percentage of females in industries: broadcasting, internet publishing, and telecommunications services (population 50,000+)"
- #25 on the list of "Top 101 cities with largest percentage of males in industries: broadcasting, internet publishing, and telecommunications services (population 50,000+)"
- #25 on the list of "Top 101 cities with largest percentage of females in industries: wholesale electronic markets and agents and brokers (population 50,000+)"
- #25 on the list of "Top 101 cities with largest percentage of males in industries: wholesale electronic markets and agents and brokers (population 50,000+)"
- #26 on the list of "Top 101 cities with largest percentage of females in industries: other services, except public administration (population 50,000+)"
- #27 on the list of "Top 101 cities with largest percentage of females in industries: information (population 50,000+)"
- #27 on the list of "Top 101 cities with the largest percentage of elementary and middle school students in private schools (5,000+ students)"
- #27 on the list of "Top 101 cities with largest percentage of males in industries: arts, entertainment, and recreation (population 50,000+)"
- #28 on the list of "Top 101 cities with the most people born in other U.S. states (population 50,000+)"
- #28 on the list of "Top 101 cities with the smallest city-data.com crime index per police officer (population 50,000+)"
- #29 on the list of "Top 100 least racially diverse cities (pop. 50,000+)"
- #32 on the list of "Top 101 cities with most building permits per 10,000 residents (population 50,000+)"
- #32 on the list of "Top 101 cities with the most people below the poverty level, excluding cities with 15% or more of residents in college and with the median age below 28 (population 50,000+)"
- #14 on the list of "Top 101 counties with the most Black Protestant congregations"
- #21 on the list of "Top 101 counties with the largest decrease in the number of infant deaths per 1000 residents 2000-2006 to 2007-2013 (pop. 50,000+)"
- #22 on the list of "Top 101 counties with the most Black Protestant adherents"
- #24 on the list of "Top 101 counties with the lowest surface withdrawal of fresh water for public supply (pop. 50,000+)"
- #43 on the list of "Top 101 counties with the lowest Nitrogen Dioxide air pollution readings in 2012 (ppm)"

|
|
Total of 330 patent applications in 2008-2024.