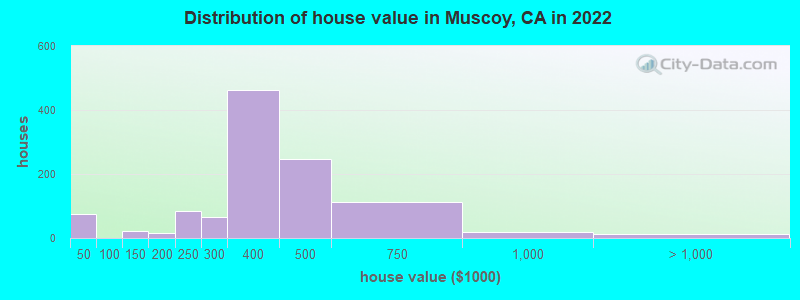
Estimated median house or condo value in 2022: $393,731 (it was $87,700 in 2000)
Muscoy:
$393,731
CA:
$715,900
Mean prices in 2022:all housing units: $538,674; detached houses: $572,275; townhouses or other attached units: $512,095; in 2-unit structures: $547,337; in 3-to-4-unit structures: $471,159; in 5-or-more-unit structures: $418,370; mobile homes: $119,083; occupied boats, rvs, vans, etc.: $73,388
Median gross rent in 2022: $1,734.
March 2022 cost of living index in Muscoy: 83.8 (less than average, U.S. average is 100)
Percentage of residents living in poverty in 2022: 18.3%
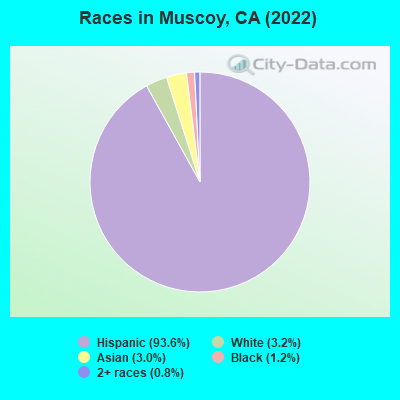
(26.5% for White Non-Hispanic residents, 79.0% for Black residents, 15.1% for Hispanic or Latino residents, 42.4% for American Indian residents, 26.9% for Native Hawaiian and other Pacific Islander residents, 19.8% for other race residents, 22.1% for two or more races residents)
Latest news from Muscoy, CA collected exclusively by city-data.com from local newspapers, TV, and radio stations
Current Local Time: PST time zone
Elevation: 1385 feet
Land area: 2.92 square miles.
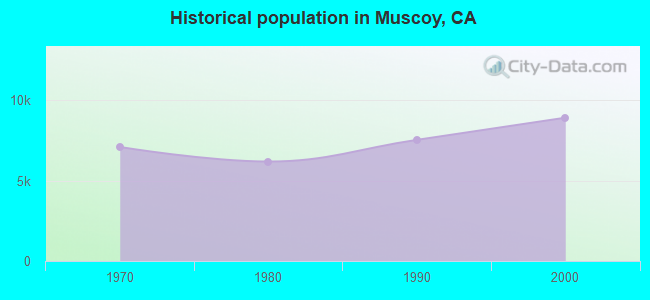
Population density: 3,641 people per square mile (average).
4,483 residents are foreign born (36.5% Latin America).
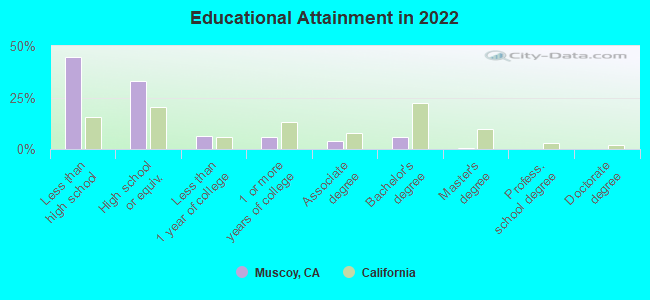
This place:
37.8%
California:
26.5%
Median real estate property taxes paid for housing units with mortgages in 2022: $2,086 (0.5%) Median real estate property taxes paid for housing units with no mortgage in 2022: $1,546 (0.4%)
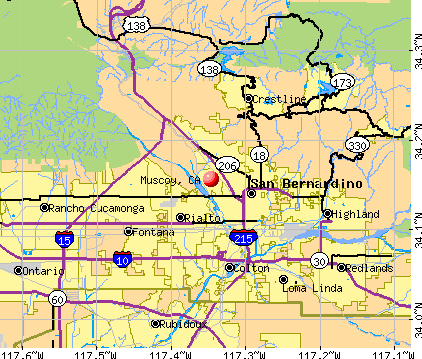
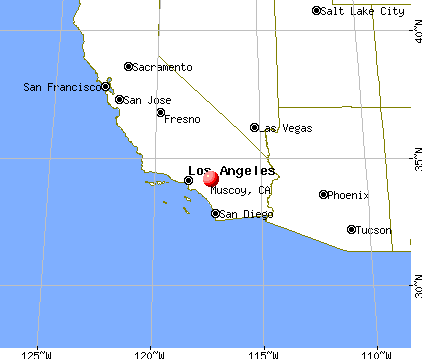
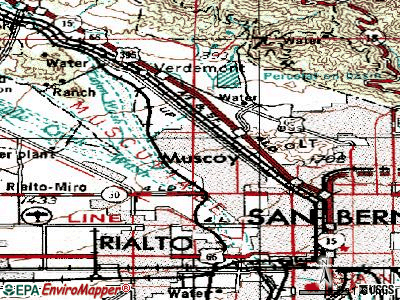
Nearest city with pop. 50,000+: San Bernardino, CA (3.6 miles , pop. 185,401).
Nearest city with pop. 200,000+: Riverside, CA (14.7 miles , pop. 255,166).
Nearest city with pop. 1,000,000+: Los Angeles, CA (59.1 miles , pop. 3,694,820).
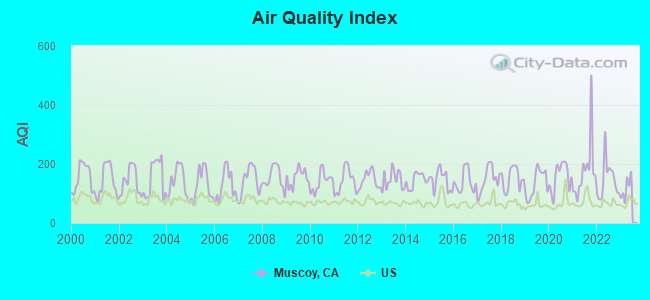
Air Quality Index (AQI) level in 2022 was 145. This is significantly worse than average.
City:
145
U.S.:
73
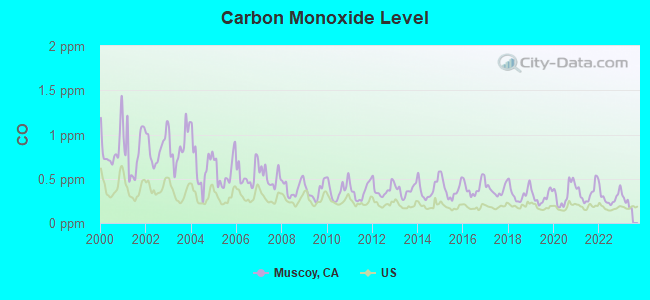
Carbon Monoxide (CO) [ppm] level in 2022 was 0.290. This is about average.Closest monitor was 5.1 miles away from the city center.
City:
0.290
U.S.:
0.251
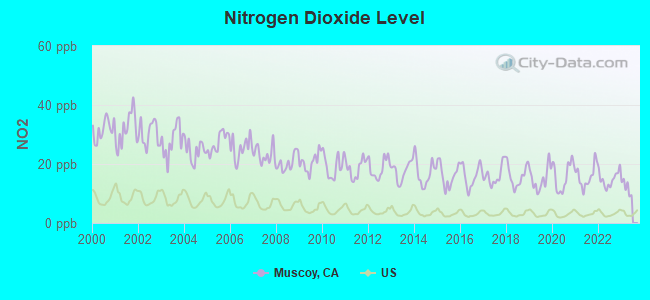
Nitrogen Dioxide (NO2) [ppb] level in 2022 was 14.9. This is significantly worse than average.Closest monitor was 5.1 miles away from the city center.
City:
14.9
U.S.:
5.1
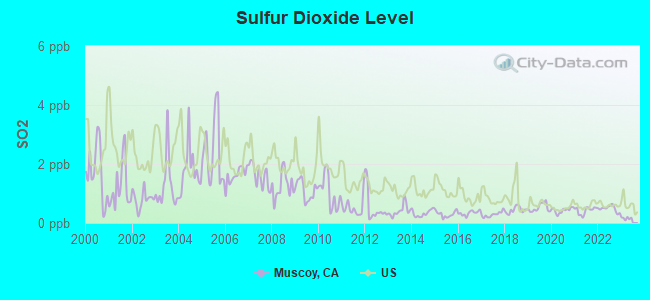
Sulfur Dioxide (SO2) [ppb] level in 2022 was 0.488. This is significantly better than average.Closest monitor was 5.1 miles away from the city center.
City:
0.488
U.S.:
1.515
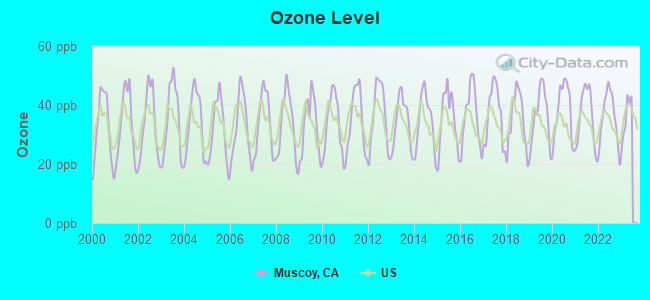
Ozone [ppb] level in 2022 was 35.6. This is about average.Closest monitor was 5.1 miles away from the city center.
City:
35.6
U.S.:
33.3
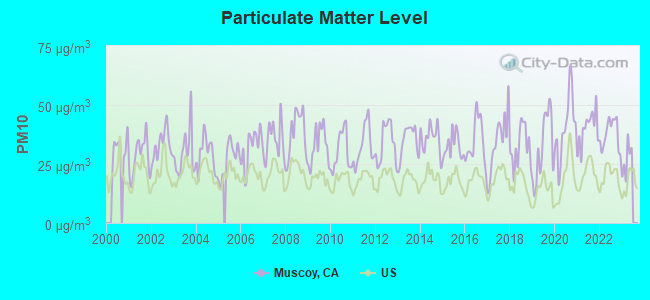
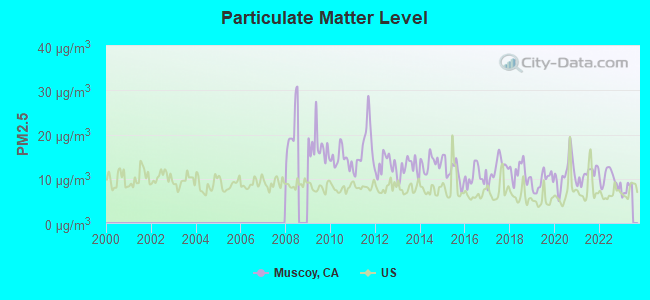
Particulate Matter (PM10) [µg/m3] level in 2022 was 37.7. This is significantly worse than average.Closest monitor was 5.4 miles away from the city center.
City:
37.7
U.S.:
19.2
Particulate Matter (PM2.5) [µg/m3] level in 2022 was 10.0. This is worse than average.Closest monitor was 5.4 miles away from the city center.
City:
10.0
U.S.:
8.1
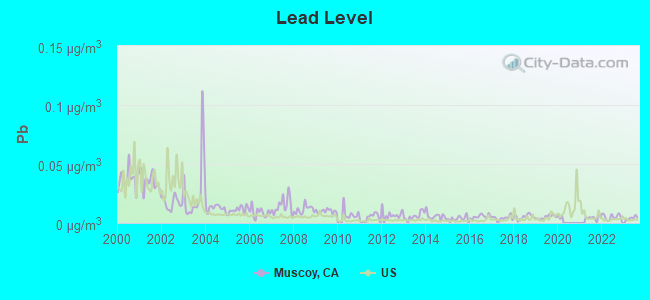
Lead (Pb) [µg/m3] level in 2023 was 0.00426. This is significantly better than average.Closest monitor was 5.1 miles away from the city center.
City:
0.00426
U.S.:
0.00931
Earthquake activity:
Muscoy-area historical earthquake activity is significantly above California state average. It is 7395% greater than the overall U.S. average.
On 6/28/1992 at 11:57:34, a magnitude 7.6 (6.2 MB, 7.6 MS, 7.3 MW, Depth: 0.7 mi, Class: Major, Intensity: VIII - XII) earthquake occurred 46.7 miles away from Muscoy center, causing 3 deaths (1 shaking deaths, 2 other deaths) and 400 injuries, causing $100,000,000 total damage and $40,000,000 insured losses On 7/21/1952 at 11:52:14, a magnitude 7.7 (7.7 UK) earthquake occurred 110.8 miles away from the city center, causing $50,000,000 total damage On 10/16/1999 at 09:46:44, a magnitude 7.4 (6.3 MB, 7.4 MS, 7.2 MW, 7.3 ML) earthquake occurred 57.7 miles away from Muscoy center On 6/28/1992 at 15:05:30, a magnitude 6.9 (6.3 MB, 6.7 MS, 6.5 MW, 6.9 ME, Depth: 3.1 mi, Class: Strong, Intensity: VII - IX) earthquake occurred 31.7 miles away from the city center On 5/19/1940 at 04:36:40, a magnitude 7.2 (7.2 UK) earthquake occurred 114.8 miles away from the city center, causing $33,000,000 total damage On 4/21/1918 at 22:32:30, a magnitude 6.8 (6.8 UK) earthquake occurred 24.4 miles away from the city center Magnitude types: body-wave magnitude (MB), energy magnitude (ME), local magnitude (ML), surface-wave magnitude (MS), moment magnitude (MW)
Natural disasters:
The number of natural disasters in San Bernardino County (46) is a lot greater than the US average (15). Major Disasters (Presidential) Declared: 27 Emergencies Declared: 2
Causes of natural disasters: Fires: 24, Floods: 18, Storms: 9, Winter Storms: 6, Landslides: 5, Mudslides: 4, Heavy Rains: 2, Earthquake: 1, Flash Flood: 1, Freeze: 1, Hurricane: 1, Snow: 1, Tornado: 1, Tropical Storm: 1, Wind: 1, Other: 1 (Note: some incidents may be assigned to more than one category).
Hospitals and medical centers near Muscoy:
DAVITA-MOUNTAIN VISTA DIALYSIS CENTER (Dialysis Facility, about 2 miles away; SAN BERNARDINO, CA)
RAI-NORTH RIVERSIDE-RIALTO (Dialysis Facility, about 3 miles away; RIALTO, CA)
COMMUNITY HOSPITAL OF SAN BERNARDINO Acute Care Hospitals (about 3 miles away; SAN BERNARDINO, CA)
ROBERT H BALLARD REHAB HOSP D/P (Nursing Home, about 3 miles away; SAN BERNARDINO, CA)
SHANDIN HILLS CONVALESCENT HOSPITAL (Nursing Home, about 3 miles away; SAN BERNARDINO, CA)
SHANDIN HILLS BEHAVIOR THERAPY CENTER (Nursing Home, about 3 miles away; SAN BERNARDINO, CA)
HILLCREST NURSING HOME (Nursing Home, about 3 miles away; SAN BERNARDINO, CA)
Amtrak stations near Muscoy:
5 miles: SAN BERNADINO (SAN BERNARDINO, 1170 W. 3RD ST.) . Services: ticket office, partially wheelchair accessible, public payphones, free short-term parking, free long-term parking.
13 miles: RIVERSIDE (4066 VINE ST.) - Bus Station . Services: fully wheelchair accessible, public payphones, full-service food facilities, free short-term parking, free long-term parking, call for car rental service, call for taxi service, public transit connection.
17 miles: MORENO VALLEY (ARCO MINI MART, 2624 E. ALESSANDRO BLVD.) - Bus Station . Services: public payphones.
Colleges/universities with over 2000 students nearest to Muscoy:
California State University-San Bernardino (about 3 miles; San Bernardino, CA; Full-time enrollment: 15,748)
San Bernardino Valley College (about 6 miles; San Bernardino, CA; FT enrollment: 7,444)
The Art Institute of California-Argosy University Inland Empire (about 8 miles; San Bernardino, CA; FT enrollment: 2,238)
Loma Linda University (about 9 miles; Loma Linda, CA; FT enrollment: 2,839)
University of Redlands (about 13 miles; Redlands, CA; FT enrollment: 4,854)
University of California-Riverside (about 13 miles; Riverside, CA; FT enrollment: 20,647)
Riverside City College (about 13 miles; Riverside, CA; FT enrollment: 10,661)
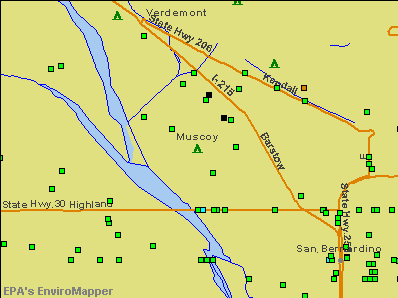
Notable locations in Muscoy: San Bernardino County Fire Department Station 75 Muscoy (A), Muscovy Grange (B), Muscovy Community Center (C), Inland Empire Job Corps Center (D). Display/hide their locations on the map
Churches in Muscoy include: Living Fiath Full Gospel Church (A), Muscovy Faith Assembly of God Church (B), Muscovy United Methodist Church (C), Saint Timothy Community Church (D), Shield of Faith Revival Center (E), California Muscovy Church (F). Display/hide their locations on the map
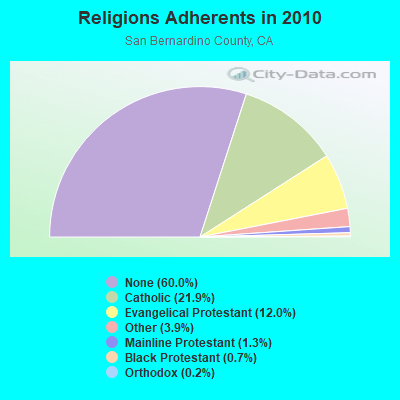
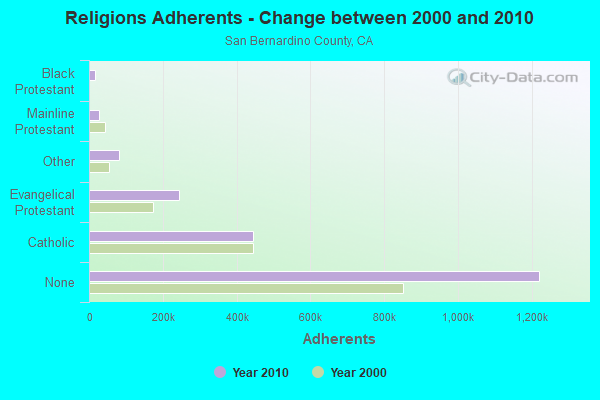
Religion statistics for Muscoy, CA (based on San Bernardino County data)
Religion
Adherents
Congregations
Catholic
445,334
55
Evangelical Protestant
243,524
832
Other
80,047
205
Mainline Protestant
26,062
135
Black Protestant
14,969
37
Orthodox
3,868
10
None
1,221,406
-
Source: Clifford Grammich, Kirk Hadaway, Richard Houseal, Dale E.Jones, Alexei Krindatch, Richie Stanley and Richard H.Taylor. 2012. 2010 U.S.Religion Census: Religious Congregations & Membership Study. Association of Statisticians of American Religious Bodies. Jones, Dale E., et al. 2002. Congregations and Membership in the United States 2000. Nashville, TN: Glenmary Research Center. Graphs represent county-level data
Thomas McGovern, 1300ft Nw Of Gray St And 5th Ave Intersection. (Lat: 34.173583 Lon: -117.364139), Type: 12.1, Structure height: 06071 m, Overall height: 12.1 m, Registrant: Union Pacific Railroad, Uplicensing@up.Com, , Omaha, Phone: (402) 544-1777
Thomas McGovern, 1300ft Nw Of Gray St And 5th Ave Intersection. (Lat: 34.173583 Lon: -117.364139), Type: 12.1, Structure height: 06071 m, Overall height: 12.1 m, Licensee ID: C, Registrant: Union Pacific Railroad, Uplicensing@up.Com, , Omaha, Phone: (402) 544-1777
Thomas J McGovern, 1300ft Nw Of Gray St And 5th Ave Intersection. (Lat: 34.173583 Lon: -117.364139), Type: 12.1, Structure height: 06071 m, Overall height: 12.1 m, Registrant: Union Pacific Railroad, Uplicensing@up.Com, , Omaha, Phone: (402) 544-1777
FCC Registered Broadcast Land Mobile Towers:
2
Ono M3 MP76.2 - DED, Bnsf Ls7600 Mp76.2 - Ono Ded (Lat: 34.162583 Lon: -117.339861), Type: Building, Structure height: 3 m, Overall height: 3.7 m, Call Sign: WQAT741, Assigned Frequencies: 161.190 MHz, Grant Date: 06/27/2014, Expiration Date: 08/04/2024, Certifier: Robert C Leedham, Registrant: Bnsf Railway Co., 4515 Kansas Avenue, Kansas City, KS 66106, Phone: (913) 551-4015, Fax: (913) 551-4053, Email:
MP 490.0, Mp 490.00, Mojave Sub (Lat: 34.344000 Lon: -117.401639), Type: Bant, Structure height: 3 m, Overall height: 4 m, Call Sign: WQEK258, Assigned Frequencies: 160.740 MHz, 160.320 MHz, Grant Date: 01/23/2016, Expiration Date: 02/16/2026, Certifier: Larry Kopiasz, Registrant: Prokarma, 222 So 15th St., Suite 505n, Omaha, NE 68102, Phone: (402) 522-5068, Fax: (402) 346-6676, Email:
FCC Registered Microwave Towers:
1
IE04174A, 2505 Blake St (Lat: 34.150667 Lon: -117.357333), Type: Mtower, Structure height: 10.4 m, Overall height: 12.2 m, Call Sign: WQRI842, Assigned Frequencies: 19640.0 MHz, Grant Date: 08/04/2023, Expiration Date: 05/23/2033, Cancellation Date: 08/07/2023, Certifier: Dan Menser, Registrant: T-Mobile Usa, Inc., 12920 Se 38th Street, Bellevue, WA 98006, Phone: (425) 383-8401, Fax: (425) 383-4840, Email:
FCC Registered Paging Towers:
1
Atop Little Mountain On Little Mountain Road (Lat: 34.159167 Lon: -117.315028), Call Sign: KNKO264, Assigned Frequencies: 931.912 MHz, Grant Date: 04/27/1999, Expiration Date: 04/01/2009, Cancellation Date: 08/08/2001, Registrant: Joyce & Jacobs, 1019 19th Street, N.W., 14th Fl., Ph-2, Washington, DC 20036, Phone: (202) 457-0100
Home Mortgage Disclosure Act Aggregated Statistics For Year 2009 (Based on 1 partial tract)
A) FHA, FSA/RHS & VA Home Purchase Loans
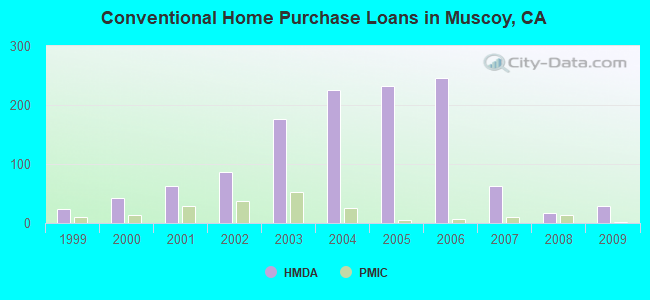
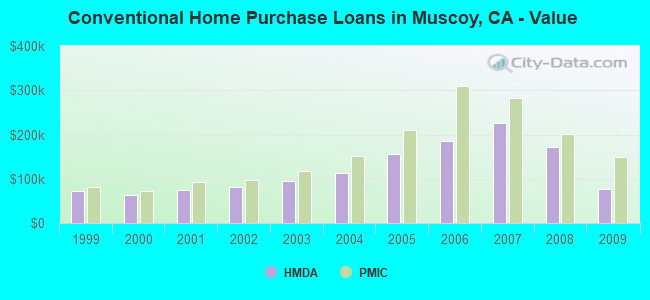
B) Conventional Home Purchase Loans
C) Refinancings
D) Home Improvement Loans
F) Non-occupant Loans on < 5 Family Dwellings (A B C & D)
Number
Average Value
Number
Average Value
Number
Average Value
Number
Average Value
Number
Average Value
LOANS ORIGINATED
43
$123,324
28
$76,990
16
$132,247
0
$0
16
$80,298
APPLICATIONS APPROVED, NOT ACCEPTED
5
$135,602
3
$107,657
5
$131,088
0
$0
1
$80,740
APPLICATIONS DENIED
12
$144,368
8
$103,304
30
$145,753
4
$187,312
9
$99,082
APPLICATIONS WITHDRAWN
12
$101,918
4
$79,260
7
$107,714
1
$35,620
4
$67,532
FILES CLOSED FOR INCOMPLETENESS
1
$186,420
2
$59,370
8
$135,882
0
$0
1
$66,490
Aggregated Statistics For Year 2008 (Based on 1 partial tract)
A) FHA, FSA/RHS & VA Home Purchase Loans
B) Conventional Home Purchase Loans
C) Refinancings
D) Home Improvement Loans
F) Non-occupant Loans on < 5 Family Dwellings (A B C & D)
G) Loans On Manufactured Home Dwelling (A B C & D)
Number
Average Value
Number
Average Value
Number
Average Value
Number
Average Value
Number
Average Value
Number
Average Value
LOANS ORIGINATED
15
$167,542
17
$171,230
41
$166,424
7
$82,440
8
$150,949
0
$0
APPLICATIONS APPROVED, NOT ACCEPTED
2
$110,130
13
$211,494
23
$209,524
2
$244,010
5
$195,446
1
$93,800
APPLICATIONS DENIED
9
$148,952
27
$236,996
94
$222,391
20
$138,926
17
$158,378
2
$947,250
APPLICATIONS WITHDRAWN
3
$192,753
5
$124,558
26
$185,942
5
$77,418
8
$143,008
0
$0
FILES CLOSED FOR INCOMPLETENESS
1
$119,930
7
$214,580
11
$219,561
4
$94,695
2
$208,090
0
$0
Aggregated Statistics For Year 2007 (Based on 1 partial tract)
A) FHA, FSA/RHS & VA Home Purchase Loans
B) Conventional Home Purchase Loans
C) Refinancings
D) Home Improvement Loans
E) Loans on Dwellings For 5+ Families
F) Non-occupant Loans on < 5 Family Dwellings (A B C & D)
G) Loans On Manufactured Home Dwelling (A B C & D)
Number
Average Value
Number
Average Value
Number
Average Value
Number
Average Value
Number
Average Value
Number
Average Value
Number
Average Value
LOANS ORIGINATED
2
$283,195
62
$225,912
232
$223,623
40
$167,320
2
$397,780
29
$221,020
1
$290,910
APPLICATIONS APPROVED, NOT ACCEPTED
0
$0
31
$176,712
53
$247,606
7
$164,116
0
$0
12
$231,692
0
$0
APPLICATIONS DENIED
1
$386,500
88
$233,567
220
$243,938
52
$177,334
0
$0
27
$233,280
2
$104,195
APPLICATIONS WITHDRAWN
3
$292,893
20
$197,821
83
$241,121
13
$159,522
0
$0
8
$227,906
1
$14,840
FILES CLOSED FOR INCOMPLETENESS
0
$0
8
$269,391
31
$254,544
3
$149,613
0
$0
4
$218,630
1
$168,020
Aggregated Statistics For Year 2006 (Based on 1 partial tract)
A) FHA, FSA/RHS & VA Home Purchase Loans
B) Conventional Home Purchase Loans
C) Refinancings
D) Home Improvement Loans
E) Loans on Dwellings For 5+ Families
F) Non-occupant Loans on < 5 Family Dwellings (A B C & D)
G) Loans On Manufactured Home Dwelling (A B C & D)
Number
Average Value
Number
Average Value
Number
Average Value
Number
Average Value
Number
Average Value
Number
Average Value
Number
Average Value
LOANS ORIGINATED
1
$327,720
246
$185,864
404
$212,816
50
$166,141
1
$287,940
69
$207,640
2
$132,690
APPLICATIONS APPROVED, NOT ACCEPTED
0
$0
58
$200,220
81
$213,673
8
$183,528
0
$0
18
$247,408
1
$30,870
APPLICATIONS DENIED
1
$126,460
145
$192,625
216
$222,069
46
$151,884
1
$210,760
31
$223,385
1
$124,680
APPLICATIONS WITHDRAWN
0
$0
73
$173,434
163
$208,119
11
$161,595
0
$0
17
$212,929
0
$0
FILES CLOSED FOR INCOMPLETENESS
0
$0
8
$209,354
34
$233,516
1
$54,030
0
$0
4
$173,062
1
$165,640
Aggregated Statistics For Year 2005 (Based on 1 partial tract)
A) FHA, FSA/RHS & VA Home Purchase Loans
B) Conventional Home Purchase Loans
C) Refinancings
D) Home Improvement Loans
E) Loans on Dwellings For 5+ Families
F) Non-occupant Loans on < 5 Family Dwellings (A B C & D)
G) Loans On Manufactured Home Dwelling (A B C & D)
Number
Average Value
Number
Average Value
Number
Average Value
Number
Average Value
Number
Average Value
Number
Average Value
Number
Average Value
LOANS ORIGINATED
3
$193,743
233
$156,704
448
$172,079
47
$162,270
1
$114,580
61
$177,769
2
$159,110
APPLICATIONS APPROVED, NOT ACCEPTED
0
$0
53
$150,329
93
$168,138
14
$134,685
0
$0
15
$155,470
2
$78,665
APPLICATIONS DENIED
1
$140,710
129
$148,361
231
$174,432
52
$102,699
0
$0
41
$162,790
3
$86,680
APPLICATIONS WITHDRAWN
1
$151,390
70
$158,060
192
$169,947
21
$133,498
0
$0
27
$148,733
1
$97,960
FILES CLOSED FOR INCOMPLETENESS
0
$0
12
$214,622
64
$149,835
2
$196,515
0
$0
4
$172,025
0
$0
Aggregated Statistics For Year 2004 (Based on 1 partial tract)
A) FHA, FSA/RHS & VA Home Purchase Loans
B) Conventional Home Purchase Loans
C) Refinancings
D) Home Improvement Loans
E) Loans on Dwellings For 5+ Families
F) Non-occupant Loans on < 5 Family Dwellings (A B C & D)
G) Loans On Manufactured Home Dwelling (A B C & D)
Number
Average Value
Number
Average Value
Number
Average Value
Number
Average Value
Number
Average Value
Number
Average Value
Number
Average Value
LOANS ORIGINATED
11
$157,385
225
$112,608
423
$132,050
45
$102,934
1
$189,980
59
$133,230
1
$30,280
APPLICATIONS APPROVED, NOT ACCEPTED
1
$86,680
74
$129,956
100
$126,630
8
$72,802
0
$0
21
$122,020
2
$39,480
APPLICATIONS DENIED
3
$137,540
88
$123,159
238
$128,850
40
$82,138
0
$0
25
$128,714
3
$140,113
APPLICATIONS WITHDRAWN
5
$161,486
37
$126,988
167
$127,286
18
$91,166
0
$0
13
$122,256
1
$167,420
FILES CLOSED FOR INCOMPLETENESS
3
$129,623
7
$99,317
39
$125,408
4
$95,140
0
$0
7
$134,430
0
$0
Aggregated Statistics For Year 2003 (Based on 1 partial tract)
A) FHA, FSA/RHS & VA Home Purchase Loans
B) Conventional Home Purchase Loans
C) Refinancings
D) Home Improvement Loans
E) Loans on Dwellings For 5+ Families
F) Non-occupant Loans on < 5 Family Dwellings (A B C & D)
Number
Average Value
Number
Average Value
Number
Average Value
Number
Average Value
Number
Average Value
Number
Average Value
LOANS ORIGINATED
38
$120,787
176
$95,012
346
$102,312
13
$34,572
0
$0
40
$102,829
APPLICATIONS APPROVED, NOT ACCEPTED
5
$118,502
51
$111,790
77
$98,816
5
$39,184
0
$0
21
$99,544
APPLICATIONS DENIED
12
$117,107
103
$92,842
198
$97,031
24
$29,141
1
$153,770
25
$94,826
APPLICATIONS WITHDRAWN
10
$109,300
34
$90,399
156
$108,381
5
$53,314
0
$0
14
$97,536
FILES CLOSED FOR INCOMPLETENESS
5
$125,152
9
$106,668
26
$104,377
1
$14,840
0
$0
2
$78,665
Aggregated Statistics For Year 2002 (Based on 1 partial tract)
A) FHA, FSA/RHS & VA Home Purchase Loans
B) Conventional Home Purchase Loans
C) Refinancings
D) Home Improvement Loans
E) Loans on Dwellings For 5+ Families
F) Non-occupant Loans on < 5 Family Dwellings (A B C & D)
Number
Average Value
Number
Average Value
Number
Average Value
Number
Average Value
Number
Average Value
Number
Average Value
LOANS ORIGINATED
69
$106,444
87
$80,614
156
$89,538
8
$22,190
0
$0
27
$75,026
APPLICATIONS APPROVED, NOT ACCEPTED
15
$101,285
28
$91,069
40
$87,185
4
$20,038
0
$0
8
$73,470
APPLICATIONS DENIED
17
$102,955
38
$86,071
125
$87,834
20
$13,180
1
$151,390
18
$101,886
APPLICATIONS WITHDRAWN
18
$106,141
26
$78,072
74
$96,396
4
$23,898
2
$117,255
10
$74,213
FILES CLOSED FOR INCOMPLETENESS
4
$87,720
4
$71,095
39
$93,622
1
$8,310
1
$62,340
2
$142,785
Aggregated Statistics For Year 2001 (Based on 1 partial tract)
A) FHA, FSA/RHS & VA Home Purchase Loans
B) Conventional Home Purchase Loans
C) Refinancings
D) Home Improvement Loans
F) Non-occupant Loans on < 5 Family Dwellings (A B C & D)
Number
Average Value
Number
Average Value
Number
Average Value
Number
Average Value
Number
Average Value
LOANS ORIGINATED
81
$95,637
63
$74,976
97
$80,921
8
$28,942
21
$81,930
APPLICATIONS APPROVED, NOT ACCEPTED
5
$103,542
15
$96,852
24
$82,673
1
$23,750
3
$116,960
APPLICATIONS DENIED
11
$98,393
30
$75,598
112
$80,081
30
$18,741
11
$71,244
APPLICATIONS WITHDRAWN
14
$102,031
19
$75,868
61
$94,350
7
$17,641
6
$78,567
FILES CLOSED FOR INCOMPLETENESS
2
$111,615
6
$59,568
14
$76,502
1
$2,970
2
$40,965
Aggregated Statistics For Year 2000 (Based on 1 partial tract)
A) FHA, FSA/RHS & VA Home Purchase Loans
B) Conventional Home Purchase Loans
C) Refinancings
D) Home Improvement Loans
E) Loans on Dwellings For 5+ Families
F) Non-occupant Loans on < 5 Family Dwellings (A B C & D)
Number
Average Value
Number
Average Value
Number
Average Value
Number
Average Value
Number
Average Value
Number
Average Value
LOANS ORIGINATED
93
$89,208
43
$63,926
43
$64,686
8
$23,154
1
$73,030
14
$63,144
APPLICATIONS APPROVED, NOT ACCEPTED
9
$88,989
12
$62,141
16
$74,435
8
$35,770
0
$0
5
$63,408
APPLICATIONS DENIED
24
$93,780
37
$71,870
69
$72,001
17
$19,662
0
$0
15
$71,679
APPLICATIONS WITHDRAWN
16
$92,024
13
$71,472
23
$64,791
3
$25,530
0
$0
3
$69,860
FILES CLOSED FOR INCOMPLETENESS
7
$85,323
1
$147,240
17
$89,544
1
$5,940
0
$0
2
$78,665
Aggregated Statistics For Year 1999 (Based on 1 partial tract)
A) FHA, FSA/RHS & VA Home Purchase Loans
B) Conventional Home Purchase Loans
C) Refinancings
D) Home Improvement Loans
E) Loans on Dwellings For 5+ Families
F) Non-occupant Loans on < 5 Family Dwellings (A B C & D)
Detailed PMIC statistics for the following Tracts:0041.00
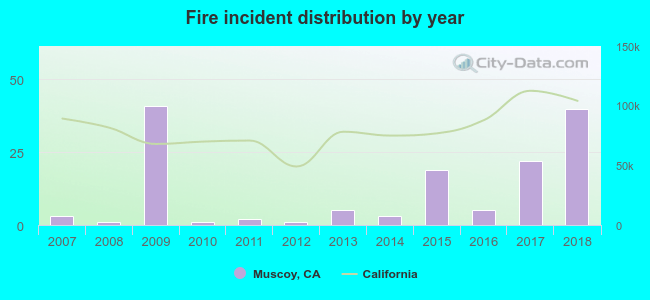
2007 - 2018 National Fire Incident Reporting System (NFIRS) incidents
According to the data from the years 2007 - 2018 the average number of fires per year is 12. The highest number of fires - 41 took place in 2009, and the least - 1 in 2008. The data has a rising trend.
When looking into fire subcategories, the most reports belonged to: Outside Fires (48.3%), and Structure Fires (30.1%).
Fire incident types reported to NFIRS in Muscoy, CA


 Recent articles from our blog. Our writers, many of them Ph.D. graduates or candidates, create easy-to-read articles on a wide variety of topics.

 (3.6 miles


 According to the data from the years 2007 - 2018 the average number of fires per year is 12. The highest number of fires - 41 took place in 2009, and the least - 1 in 2008. The data has a rising trend.
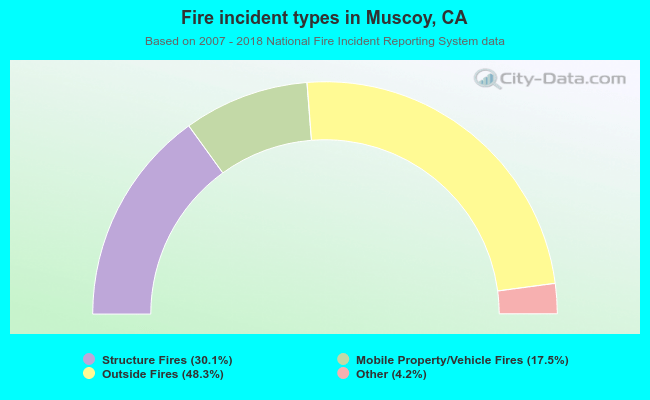 When looking into fire subcategories, the most reports belonged to: Outside Fires (48.3%), and Structure Fires (30.1%).