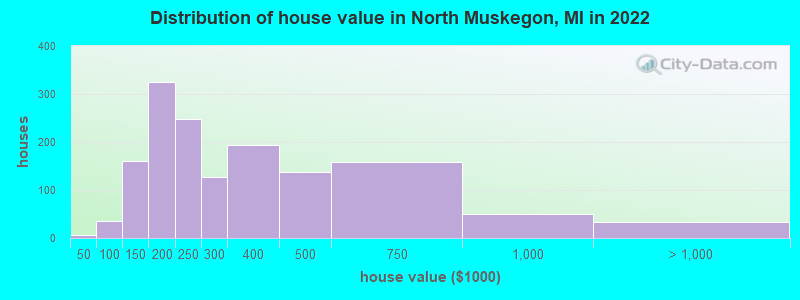
Estimated median house or condo value in 2022: $248,145 (it was $126,500 in 2000)
North Muskegon:
$248,145
MI:
$224,400
Mean prices in 2022:all housing units: $458,918; detached houses: $475,558; townhouses or other attached units: $232,267; in 5-or-more-unit structures: $252,850
Median gross rent in 2022: $1,412.
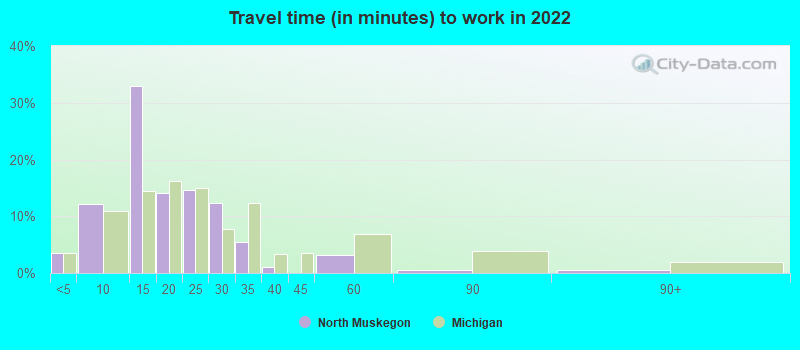
March 2022 cost of living index in North Muskegon: 83.4 (less than average, U.S. average is 100)
Percentage of residents living in poverty in 2022: 6.4%
(6.6% for White Non-Hispanic residents, 17.1% for Black residents, 4.1% for two or more races residents)
According to our research of Michigan and other state lists, there were 10 registered sex offenders living in North Muskegon, Michigan as of June 16, 2024. The ratio of all residents to sex offenders in North Muskegon is 381 to 1. The ratio of registered sex offenders to all residents in this city is lower than the state average.
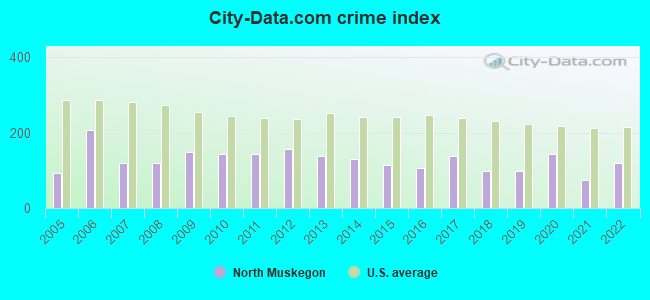
Crime rates in North Muskegon by year
Type
2009
2010
2011
2012
2013
2014
2015
2016
2017
2018
2019
2020
2021
2022
Murders (per 100,000)
0 (0.0)
0 (0.0)
0 (0.0)
0 (0.0)
0 (0.0)
0 (0.0)
0 (0.0)
0 (0.0)
0 (0.0)
0 (0.0)
0 (0.0)
0 (0.0)
0 (0.0)
0 (0.0)
Rapes (per 100,000)
0 (0.0)
0 (0.0)
1 (26.4)
0 (0.0)
1 (26.6)
0 (0.0)
1 (26.5)
1 (26.5)
1 (26.4)
0 (0.0)
2 (52.7)
5 (131.8)
1 (26.4)
3 (73.1)
Robberies (per 100,000)
1 (25.6)
1 (26.4)
1 (26.4)
1 (26.5)
0 (0.0)
1 (26.4)
1 (26.5)
0 (0.0)
2 (52.7)
0 (0.0)
0 (0.0)
0 (0.0)
1 (26.4)
0 (0.0)
Assaults (per 100,000)
1 (25.6)
4 (105.7)
1 (26.4)
5 (132.7)
4 (106.5)
1 (26.4)
2 (53.0)
3 (79.4)
2 (52.7)
1 (26.4)
0 (0.0)
0 (0.0)
2 (52.7)
2 (48.7)
Burglaries (per 100,000)
3 (76.9)
3 (79.2)
10 (264.3)
5 (132.7)
3 (79.9)
3 (79.2)
6 (158.9)
1 (26.5)
2 (52.7)
3 (79.1)
1 (26.3)
2 (52.7)
2 (52.7)
0 (0.0)
Thefts (per 100,000)
123 (3,152)
101 (2,668)
85 (2,247)
103 (2,733)
75 (1,997)
103 (2,721)
61 (1,616)
62 (1,641)
79 (2,082)
74 (1,950)
49 (1,290)
30 (790.9)
27 (712.0)
46 (1,121)
Auto thefts (per 100,000)
3 (76.9)
1 (26.4)
0 (0.0)
2 (53.1)
5 (133.1)
1 (26.4)
0 (0.0)
0 (0.0)
1 (26.4)
4 (105.4)
1 (26.3)
1 (26.4)
1 (26.4)
3 (73.1)
Arson (per 100,000)
0 (0.0)
0 (0.0)
1 (26.4)
0 (0.0)
0 (0.0)
0 (0.0)
0 (0.0)
0 (0.0)
0 (0.0)
0 (0.0)
0 (0.0)
0 (0.0)
0 (0.0)
0 (0.0)
City-Data.com crime index
150.4
143.4
142.7
157.3
138.7
129.7
115.5
104.5
136.5
97.3
97.7
142.9
73.8
118.9
The City-Data.com crime index weighs serious crimes and violent crimes more heavily. Higher means more crime, U.S. average is 246.1. It adjusts for the number of visitors and daily workers commuting into cities.
Latest news from North Muskegon, MI collected exclusively by city-data.com from local newspapers, TV, and radio stations
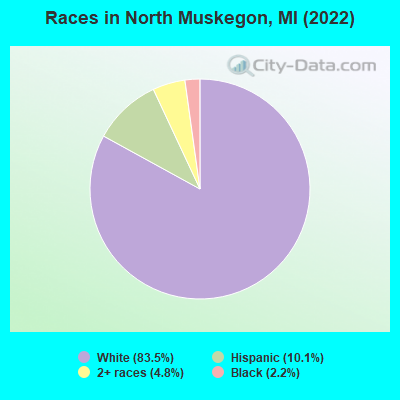
Ancestries: German (15.7%), English (14.8%), Dutch (11.5%), Irish (5.2%), European (5.0%), Polish (5.0%).
Current Local Time: EST time zone
Elevation: 621 feet
Land area: 1.78 square miles.
Population density: 2,290 people per square mile (low).
59 residents are foreign born
This city:
1.4%
Michigan:
6.9%
Median real estate property taxes paid for housing units with mortgages in 2022: $3,063 (1.3%) Median real estate property taxes paid for housing units with no mortgage in 2022: $3,575 (1.2%)
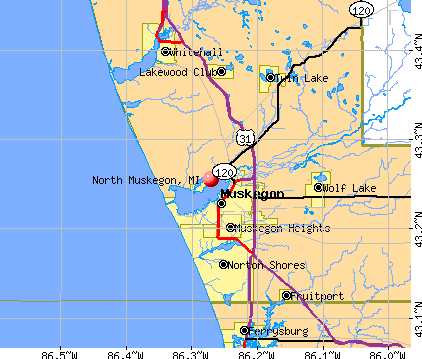
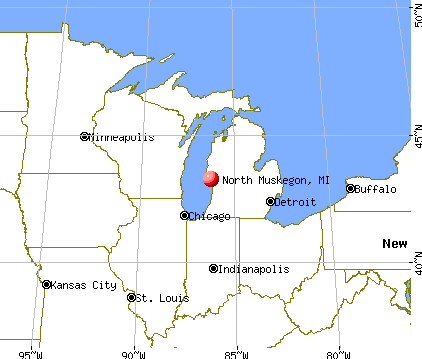
Nearest city with pop. 50,000+: Grand Rapids, MI (37.1 miles , pop. 197,800).
Nearest city with pop. 200,000+: Milwaukee, WI (86.2 miles , pop. 596,974).
Nearest city with pop. 1,000,000+: Chicago, IL (121.3 miles , pop. 2,896,016).
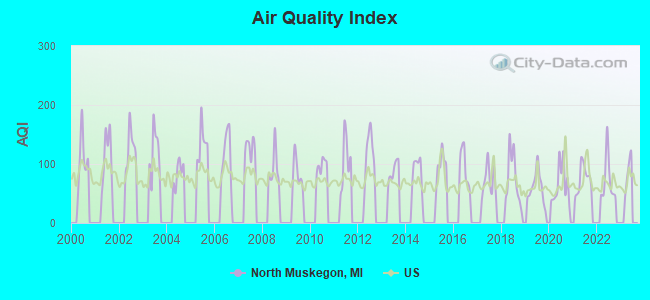
Air Quality Index (AQI) level in 2022 was 72.6. This is about average.
City:
72.6
U.S.:
72.6
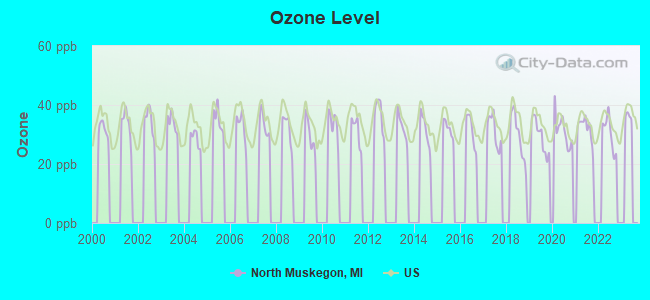
Ozone [ppb] level in 2022 was 30.4. This is about average.Closest monitor was 2.6 miles away from the city center.
City:
30.4
U.S.:
33.3
Tornado activity:
North Muskegon-area historical tornado activity is below Michigan state average. It is 41% smaller than the overall U.S. average.
On 4/11/1965, a category F4 (max. wind speeds 207-260 mph) tornado 24.1 miles away from the North Muskegon city center killed 5 peopleand injured 142 peopleand causedbetween $500,000 and $5,000,000 in damages.
On 4/3/1956, a category F5 (max. wind speeds 261-318 mph) tornado 40.6 miles away from the city center killed 18 peopleand injured 340 peopleand causedbetween $50,000 and $500,000 in damages.
Earthquake activity:
North Muskegon-area historical earthquake activity is significantly above Michigan state average. It is 23% smaller than the overall U.S. average.
On 5/2/2015 at 16:23:07, a magnitude 4.2 (4.2 MW, Depth: 2.8 mi, Class: Light, Intensity: IV - V) earthquake occurred 82.5 miles away from North Muskegon center On 4/18/2008 at 09:36:59, a magnitude 5.4 (5.1 MB, 4.8 MS, 5.4 MW, 5.2 MW, Class: Moderate, Intensity: VI - VII) earthquake occurred 342.8 miles away from the city center On 1/31/1986 at 16:46:43, a magnitude 5.0 (5.0 MB) earthquake occurred 284.8 miles away from North Muskegon center On 9/25/1998 at 19:52:52, a magnitude 5.2 (4.8 MB, 4.3 MS, 5.2 LG, 4.5 MW, Depth: 3.1 mi) earthquake occurred 324.0 miles away from North Muskegon center On 6/10/1987 at 23:48:54, a magnitude 5.1 (4.9 MB, 4.4 MS, 4.6 MS, 5.1 LG) earthquake occurred 318.0 miles away from North Muskegon center On 7/12/1986 at 08:19:37, a magnitude 4.5 (4.5 MB) earthquake occurred 211.9 miles away from North Muskegon center Magnitude types: regional Lg-wave magnitude (LG), body-wave magnitude (MB), surface-wave magnitude (MS), moment magnitude (MW)
Natural disasters:
The number of natural disasters in Muskegon County (12) is smaller than the US average (15). Major Disasters (Presidential) Declared: 7 Emergencies Declared: 4
Causes of natural disasters: Floods: 6, Storms: 6, Tornadoes: 2, Winds: 2, Winter Storms: 2, Blizzard: 1, Hurricane: 1, Snowstorm: 1, Other: 1 (Note: some incidents may be assigned to more than one category).
Hospitals and medical centers in North Muskegon:
HILLCREST NURSING AND REHABILITATION COMMUNITY (695 MITZI ST)
Other hospitals and medical centers near North Muskegon:
HILLCREST NURSING CENTRE (Nursing Home, about 2 miles away; MUSKEGON, MI)
HACKLEY VISITING NURSE SERVICES AND HOSPICE (Hospital, about 2 miles away; MUSKEGON, MI)
HARBOR HOSPICE (Hospital, about 2 miles away; MUSKEGON, MI)
INTENSIVA HOSPITAL OF MUSKEGON (Hospital, about 3 miles away; MUSKEGON, MI)
MERCY HEALTH PARTNERS, HACKLEY CAMPUS Acute Care Hospitals (about 3 miles away; MUSKEGON, MI)
SELECT SPECIALTY HOSPITAL-WESTERN MICH (Hospital, about 3 miles away; MUSKEGON, MI)
CHRISTIAN CARE NURSING CENTER (Nursing Home, about 3 miles away; MUSKEGON, MI)
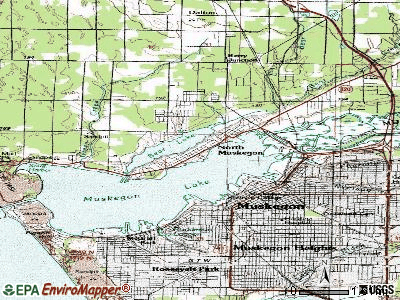
Notable locations in North Muskegon: Point Marine Incorporated (A), Walker Memorial Library (B), North Muskegon Police Department (C), North Muskegon Fire Department (D). Display/hide their locations on the map
Birthplace of: Colby Beckstrom - PGA Tour Golf player (born: 2/3/83).
Muskegon County has a predicted average indoor radon screening level less than 2 pCi/L (pico curies per liter) - Low Potential
Drinking water stations with addresses in North Muskegon and their reported violations in the past:
PNC BANK (Population served: 25, Groundwater):
Past monitoring violations:
One routine major monitoring violation
Drinking water stations with addresses in North Muskegon that have no violations reported:
LAKETON TOWNSHIP HALL (Population served: 50,Primary Water Source Type: Groundwater)
MR SCRIBS PIZZA (Population served: 25,Primary Water Source Type: Groundwater)
Average household size:
This city:
2.3 people
Michigan:
2.5 people
Percentage of family households:
This city:
65.9%
Whole state:
66.0%
Percentage of households with unmarried partners:
This city:
4.5%
Whole state:
6.4%
Likely homosexual households (counted as self-reported same-sex unmarried-partner households)
Lesbian couples: 0.1% of all households
Gay men: 0.2% of all households
47 people in nursing facilities/skilled-nursing facilities in 2010
6 people in group homes intended for adults in 2010
People in group quarters in North Muskegon in 2000:
81 people in other group homes
54 people in nursing homes
6 people in homes for the mentally retarded
5 people in homes for the physically handicapped
2 people in homes for the mentally ill
Banks with branches in North Muskegon (2011 data):
The Huntington National Bank: Northside Branch, Northside Branch, Northside Branch. Info updated 2012/04/02: Bank assets: $54,183.4 mil, Deposits: $44,300.3 mil, headquarters in Columbus, OH, positive income, Commercial Lending Specialization, 878 total offices, Holding Company: Huntington Bancshares Incorporated
Community Shores Bank: North Muskegon Branch at 180 North Causeway, branch established on 2007/01/08. Info updated 2006/11/03: Bank assets: $208.6 mil, Deposits: $191.6 mil, headquarters in Muskegon, MI, negative income in the last year, Commercial Lending Specialization, 4 total offices, Holding Company: Community Shores Bank Corporation
Comerica Bank: Northside Branch at 414 Center Street, branch established on 1963/05/20. Info updated 2011/07/29: Bank assets: $60,970.5 mil, Deposits: $48,300.9 mil, headquarters in Dallas, TX, positive income, Commercial Lending Specialization, 497 total offices, Holding Company: Comerica Incorporated
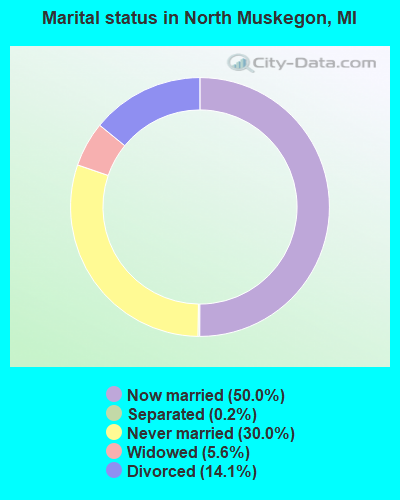
For population 15 years and over in North Muskegon:
Never married: 30.0%
Now married: 50.0%
Separated: 0.2%
Widowed: 5.6%
Divorced: 14.1%
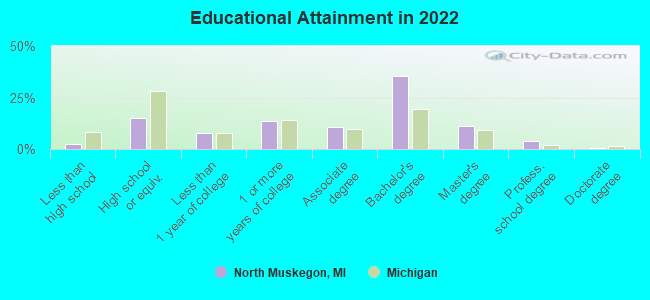
For population 25 years and over in North Muskegon:
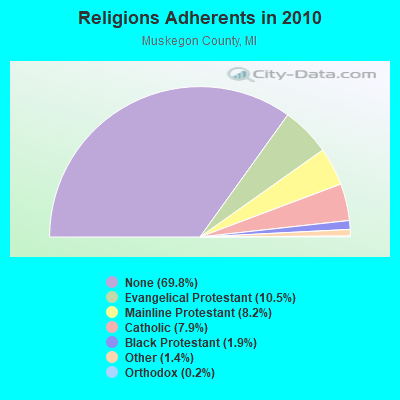
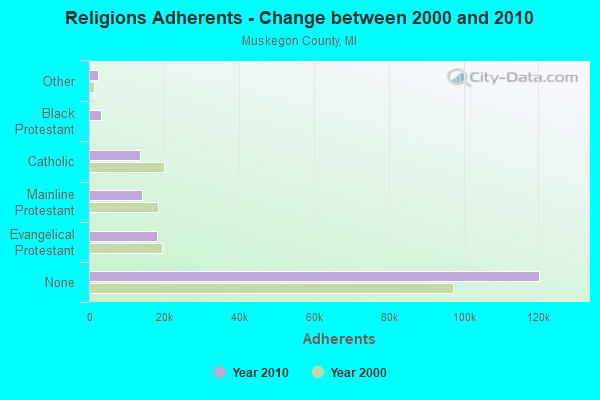
Religion statistics for North Muskegon, MI (based on Muskegon County data)
Religion
Adherents
Congregations
Evangelical Protestant
18,063
105
Mainline Protestant
14,051
49
Catholic
13,687
11
Black Protestant
3,314
11
Other
2,464
10
Orthodox
350
1
None
120,259
-
Source: Clifford Grammich, Kirk Hadaway, Richard Houseal, Dale E.Jones, Alexei Krindatch, Richie Stanley and Richard H.Taylor. 2012. 2010 U.S.Religion Census: Religious Congregations & Membership Study. Association of Statisticians of American Religious Bodies. Jones, Dale E., et al. 2002. Congregations and Membership in the United States 2000. Nashville, TN: Glenmary Research Center. Graphs represent county-level data
FAA Registered Aircraft Manufacturers and Dealers:
2
J R AVIATION LLC, 1923 Scenic Dr, North Muskegon, MI 49445 Certificate: D000331 (LLC), Certificate Issue Date: 06/24/2005, Expiration Date: 06/23/2006
J R AVIATION LLC, 1923 Scenic Dr, North Muskegon, MI 49445 Certificate: D000331 (Corporation), Certificate Issue Date: 06/24/2005, Expiration Date: 06/23/2006
FAA Registered Aircraft:
3
Aircraft: ISRAEL AEROSPACE INDUSTRIESLTD GULFSTREAM G150 (Category: Land, Engines: 2, Seats: 11, Weight: 20,000+ Pounds), Engine: HONEYWELL TFE73140AR200 (4420 Pounds of Thrust) (Turbo-fan) N-Number: 285GA, N285GA, N-285GA, Serial Number: 285, Year manufactured: 2009, Airworthiness Date: 05/08/2013, Certificate Issue Date: 11/04/2019 Registrant (LLC): Pfc Holdings LLC, 320 E Circle Dr, North Muskegon, MI 49445
Aircraft: PIPER PA-28-236 (Category: Land, Seats: 4, Weight: Up to 12,499 Pounds), Engine: LYCOMING 0-540 SERIES (250 HP) (Reciprocating) N-Number: 625BG, N625BG, N-625BG, Serial Number: 28-8011005, Year manufactured: 1979, Airworthiness Date: 08/31/2000, Certificate Issue Date: 04/12/2013 Registrant (LLC): N625bg LLC, 1221 Central Ave, North Muskegon, MI 49445
Aircraft: BEECH 35-B33 (Category: Land, Seats: 4, Weight: Up to 12,499 Pounds, Speed: 138 mph), Engine: CONT MOTOR I0-470 SERIES (260 HP) (Reciprocating) N-Number: 8652M, N8652M, N-8652M, Serial Number: CD-672, Year manufactured: 1963, Airworthiness Date: 09/16/1963, Certificate Issue Date: 02/19/2002 Registrant (Individual): Thomas M Graff, 470 W Circle Dr, North Muskegon, MI 49445
Home Mortgage Disclosure Act Aggregated Statistics For Year 2009 (Based on 1 full tract)
A) FHA, FSA/RHS & VA Home Purchase Loans
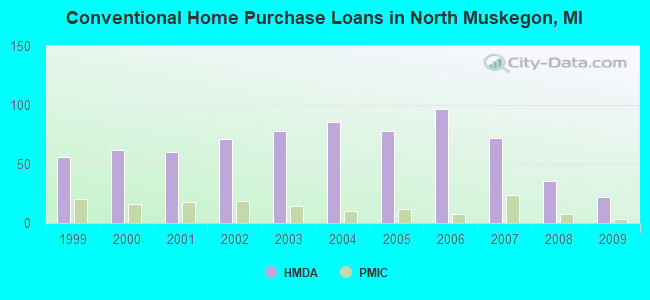
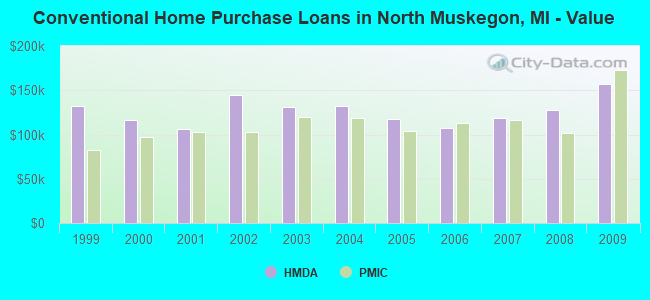
B) Conventional Home Purchase Loans
C) Refinancings
D) Home Improvement Loans
F) Non-occupant Loans on < 5 Family Dwellings (A B C & D)
Number
Average Value
Number
Average Value
Number
Average Value
Number
Average Value
Number
Average Value
LOANS ORIGINATED
16
$86,312
22
$156,818
115
$165,513
3
$40,667
9
$161,556
APPLICATIONS APPROVED, NOT ACCEPTED
0
$0
3
$315,000
5
$161,600
1
$7,000
0
$0
APPLICATIONS DENIED
6
$76,667
6
$352,500
21
$171,286
2
$15,500
1
$304,000
APPLICATIONS WITHDRAWN
2
$60,500
3
$384,667
17
$156,647
1
$13,000
0
$0
FILES CLOSED FOR INCOMPLETENESS
0
$0
0
$0
11
$180,182
0
$0
2
$232,500
Aggregated Statistics For Year 2008 (Based on 1 full tract)
A) FHA, FSA/RHS & VA Home Purchase Loans
B) Conventional Home Purchase Loans
C) Refinancings
D) Home Improvement Loans
E) Loans on Dwellings For 5+ Families
F) Non-occupant Loans on < 5 Family Dwellings (A B C & D)
Number
Average Value
Number
Average Value
Number
Average Value
Number
Average Value
Number
Average Value
Number
Average Value
LOANS ORIGINATED
11
$103,182
36
$127,583
64
$165,344
2
$29,000
1
$2,700,000
12
$150,167
APPLICATIONS APPROVED, NOT ACCEPTED
1
$87,000
4
$95,500
3
$146,667
0
$0
0
$0
1
$122,000
APPLICATIONS DENIED
5
$146,800
3
$140,333
24
$132,292
8
$58,625
0
$0
4
$105,000
APPLICATIONS WITHDRAWN
0
$0
3
$163,667
6
$225,000
1
$16,000
0
$0
2
$269,000
FILES CLOSED FOR INCOMPLETENESS
0
$0
0
$0
2
$238,500
0
$0
0
$0
0
$0
Aggregated Statistics For Year 2007 (Based on 1 full tract)
A) FHA, FSA/RHS & VA Home Purchase Loans
B) Conventional Home Purchase Loans
C) Refinancings
D) Home Improvement Loans
E) Loans on Dwellings For 5+ Families
F) Non-occupant Loans on < 5 Family Dwellings (A B C & D)
G) Loans On Manufactured Home Dwelling (A B C & D)
Number
Average Value
Number
Average Value
Number
Average Value
Number
Average Value
Number
Average Value
Number
Average Value
Number
Average Value
LOANS ORIGINATED
6
$89,167
72
$119,028
51
$128,314
12
$29,417
1
$50,000
16
$156,188
2
$45,000
APPLICATIONS APPROVED, NOT ACCEPTED
0
$0
5
$105,000
11
$163,273
3
$117,333
0
$0
0
$0
0
$0
APPLICATIONS DENIED
1
$90,000
13
$92,615
35
$133,600
2
$13,000
0
$0
3
$69,333
0
$0
APPLICATIONS WITHDRAWN
0
$0
7
$131,000
10
$118,300
1
$12,000
0
$0
0
$0
0
$0
FILES CLOSED FOR INCOMPLETENESS
0
$0
6
$164,000
7
$67,143
0
$0
0
$0
0
$0
0
$0
Aggregated Statistics For Year 2006 (Based on 1 full tract)
A) FHA, FSA/RHS & VA Home Purchase Loans
B) Conventional Home Purchase Loans
C) Refinancings
D) Home Improvement Loans
E) Loans on Dwellings For 5+ Families
F) Non-occupant Loans on < 5 Family Dwellings (A B C & D)
G) Loans On Manufactured Home Dwelling (A B C & D)
Number
Average Value
Number
Average Value
Number
Average Value
Number
Average Value
Number
Average Value
Number
Average Value
Number
Average Value
LOANS ORIGINATED
6
$106,667
97
$107,330
81
$124,259
17
$26,412
1
$975,000
16
$137,500
2
$10,000
APPLICATIONS APPROVED, NOT ACCEPTED
0
$0
10
$94,700
18
$114,111
0
$0
0
$0
0
$0
1
$88,000
APPLICATIONS DENIED
0
$0
12
$50,667
33
$172,030
7
$52,571
0
$0
1
$30,000
7
$35,000
APPLICATIONS WITHDRAWN
1
$136,000
8
$163,250
27
$193,407
2
$325,000
0
$0
1
$412,000
0
$0
FILES CLOSED FOR INCOMPLETENESS
0
$0
2
$93,000
10
$130,500
0
$0
0
$0
0
$0
0
$0
Aggregated Statistics For Year 2005 (Based on 1 full tract)
A) FHA, FSA/RHS & VA Home Purchase Loans
B) Conventional Home Purchase Loans
C) Refinancings
D) Home Improvement Loans
F) Non-occupant Loans on < 5 Family Dwellings (A B C & D)
G) Loans On Manufactured Home Dwelling (A B C & D)
Number
Average Value
Number
Average Value
Number
Average Value
Number
Average Value
Number
Average Value
Number
Average Value
LOANS ORIGINATED
5
$107,600
78
$117,205
92
$127,554
15
$46,867
18
$107,278
1
$13,000
APPLICATIONS APPROVED, NOT ACCEPTED
1
$106,000
4
$303,500
18
$102,500
4
$80,000
1
$38,000
0
$0
APPLICATIONS DENIED
1
$63,000
11
$78,727
59
$148,593
11
$43,091
3
$135,000
0
$0
APPLICATIONS WITHDRAWN
0
$0
11
$87,091
44
$119,273
4
$259,500
1
$80,000
1
$195,000
FILES CLOSED FOR INCOMPLETENESS
0
$0
4
$101,750
14
$148,071
0
$0
1
$44,000
0
$0
Aggregated Statistics For Year 2004 (Based on 1 full tract)
A) FHA, FSA/RHS & VA Home Purchase Loans
B) Conventional Home Purchase Loans
C) Refinancings
D) Home Improvement Loans
F) Non-occupant Loans on < 5 Family Dwellings (A B C & D)
G) Loans On Manufactured Home Dwelling (A B C & D)
Number
Average Value
Number
Average Value
Number
Average Value
Number
Average Value
Number
Average Value
Number
Average Value
LOANS ORIGINATED
5
$123,200
86
$131,674
116
$138,664
13
$107,769
19
$161,158
1
$7,000
APPLICATIONS APPROVED, NOT ACCEPTED
0
$0
6
$157,667
18
$102,222
1
$5,000
0
$0
0
$0
APPLICATIONS DENIED
0
$0
10
$161,500
30
$124,867
9
$60,111
2
$78,500
1
$10,000
APPLICATIONS WITHDRAWN
2
$93,000
8
$134,875
24
$106,208
0
$0
0
$0
0
$0
FILES CLOSED FOR INCOMPLETENESS
0
$0
2
$87,500
17
$106,765
1
$122,000
0
$0
0
$0
Aggregated Statistics For Year 2003 (Based on 1 full tract)
A) FHA, FSA/RHS & VA Home Purchase Loans
B) Conventional Home Purchase Loans
C) Refinancings
D) Home Improvement Loans
E) Loans on Dwellings For 5+ Families
F) Non-occupant Loans on < 5 Family Dwellings (A B C & D)
Number
Average Value
Number
Average Value
Number
Average Value
Number
Average Value
Number
Average Value
Number
Average Value
LOANS ORIGINATED
6
$97,500
78
$130,603
294
$137,932
17
$56,059
1
$38,000
26
$141,538
APPLICATIONS APPROVED, NOT ACCEPTED
0
$0
3
$133,667
20
$105,400
2
$33,000
0
$0
0
$0
APPLICATIONS DENIED
0
$0
7
$63,857
47
$136,447
4
$17,000
0
$0
1
$87,000
APPLICATIONS WITHDRAWN
0
$0
5
$138,600
32
$111,938
1
$15,000
0
$0
5
$105,400
FILES CLOSED FOR INCOMPLETENESS
0
$0
1
$86,000
8
$107,500
0
$0
0
$0
0
$0
Aggregated Statistics For Year 2002 (Based on 1 full tract)
A) FHA, FSA/RHS & VA Home Purchase Loans
B) Conventional Home Purchase Loans
C) Refinancings
D) Home Improvement Loans
F) Non-occupant Loans on < 5 Family Dwellings (A B C & D)
Number
Average Value
Number
Average Value
Number
Average Value
Number
Average Value
Number
Average Value
LOANS ORIGINATED
12
$94,750
71
$144,831
265
$138,826
15
$43,733
16
$117,938
APPLICATIONS APPROVED, NOT ACCEPTED
1
$100,000
10
$92,200
21
$149,619
2
$20,500
0
$0
APPLICATIONS DENIED
2
$65,500
6
$63,833
49
$112,020
5
$46,600
3
$16,333
APPLICATIONS WITHDRAWN
1
$134,000
8
$117,500
20
$115,700
2
$20,000
0
$0
FILES CLOSED FOR INCOMPLETENESS
0
$0
2
$97,500
5
$73,400
1
$5,000
0
$0
Aggregated Statistics For Year 2001 (Based on 1 full tract)
A) FHA, FSA/RHS & VA Home Purchase Loans
B) Conventional Home Purchase Loans
C) Refinancings
D) Home Improvement Loans
F) Non-occupant Loans on < 5 Family Dwellings (A B C & D)
Number
Average Value
Number
Average Value
Number
Average Value
Number
Average Value
Number
Average Value
LOANS ORIGINATED
5
$77,400
60
$106,250
201
$123,284
30
$22,900
12
$120,417
APPLICATIONS APPROVED, NOT ACCEPTED
2
$40,000
5
$61,000
22
$68,273
7
$21,429
0
$0
APPLICATIONS DENIED
1
$107,000
16
$65,312
23
$106,609
5
$29,400
0
$0
APPLICATIONS WITHDRAWN
0
$0
5
$120,200
18
$98,944
1
$10,000
0
$0
FILES CLOSED FOR INCOMPLETENESS
0
$0
1
$98,000
6
$88,333
0
$0
0
$0
Aggregated Statistics For Year 2000 (Based on 1 full tract)
A) FHA, FSA/RHS & VA Home Purchase Loans
B) Conventional Home Purchase Loans
C) Refinancings
D) Home Improvement Loans
F) Non-occupant Loans on < 5 Family Dwellings (A B C & D)
Number
Average Value
Number
Average Value
Number
Average Value
Number
Average Value
Number
Average Value
LOANS ORIGINATED
11
$83,545
62
$115,984
62
$110,194
22
$15,773
6
$48,500
APPLICATIONS APPROVED, NOT ACCEPTED
1
$27,000
4
$73,250
10
$68,800
2
$14,500
0
$0
APPLICATIONS DENIED
1
$89,000
23
$80,783
26
$91,846
11
$14,182
3
$100,000
APPLICATIONS WITHDRAWN
0
$0
9
$112,556
5
$99,000
4
$54,500
0
$0
FILES CLOSED FOR INCOMPLETENESS
0
$0
1
$73,000
3
$85,333
0
$0
1
$93,000
Aggregated Statistics For Year 1999 (Based on 1 full tract)
A) FHA, FSA/RHS & VA Home Purchase Loans
B) Conventional Home Purchase Loans
C) Refinancings
D) Home Improvement Loans
F) Non-occupant Loans on < 5 Family Dwellings (A B C & D)
Detailed PMIC statistics for the following Tracts:0015.00
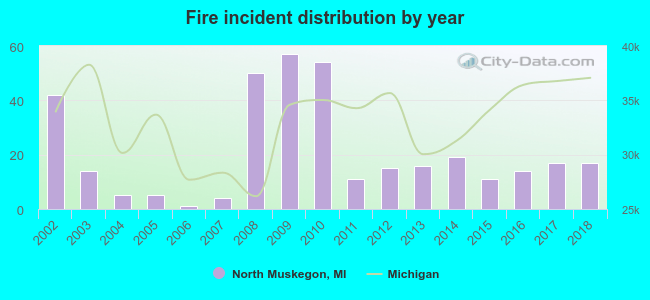
2002 - 2018 National Fire Incident Reporting System (NFIRS) incidents
Based on the data from the years 2002 - 2018 the average number of fire incidents per year is 21. The highest number of reported fire incidents - 57 took place in 2009, and the least - 1 in 2006. The data has a dropping trend.
When looking into fire subcategories, the most reports belonged to: Structure Fires (45.7%), and Outside Fires (33.0%).
Fire incident types reported to NFIRS in North Muskegon, MI


 Recent articles from our blog. Our writers, many of them Ph.D. graduates or candidates, create easy-to-read articles on a wide variety of topics.

 (37.1 miles


 Based on the data from the years 2002 - 2018 the average number of fire incidents per year is 21. The highest number of reported fire incidents - 57 took place in 2009, and the least - 1 in 2006. The data has a dropping trend.
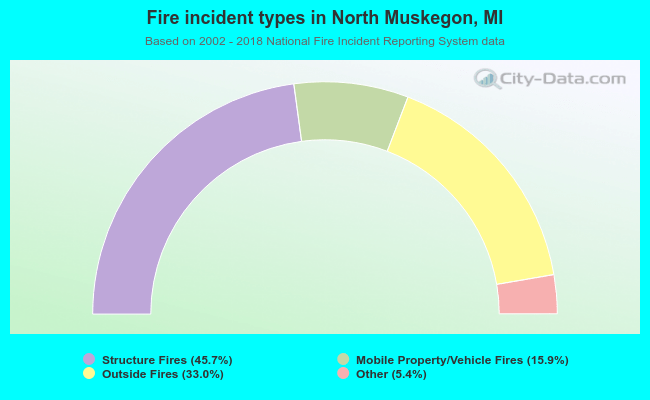 When looking into fire subcategories, the most reports belonged to: Structure Fires (45.7%), and Outside Fires (33.0%).