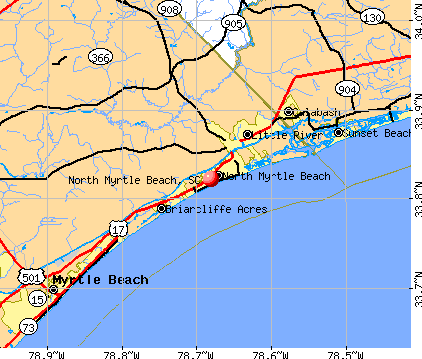
North Myrtle Beach, South Carolina
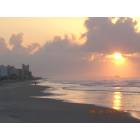
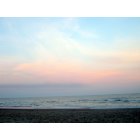
North Myrtle Beach: Sunrise in North Myrtle Beach - Late Summer 2006
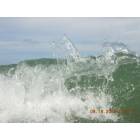
North Myrtle Beach: detail of a wave: close-up
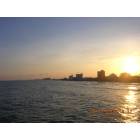
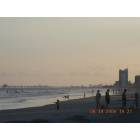
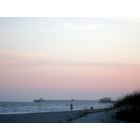
North Myrtle Beach: Sunset From The Cherry Grove Pier/View Of The Grand Strand - Late Summer 2006
North Myrtle Beach: From Cherry Grove Beach: Looking northeast towards Little River
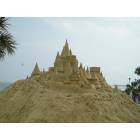
North Myrtle Beach: Sand Castle at Sunfest 6-3-06
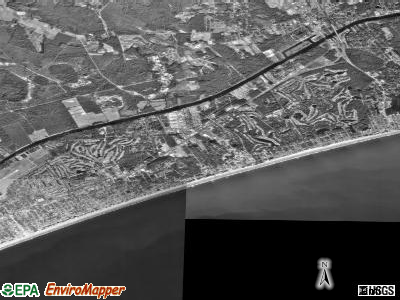
North Myrtle Beach: North Myrtle Beach
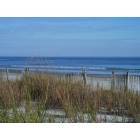
North Myrtle Beach: Beach in November
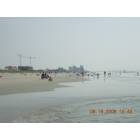
North Myrtle Beach: From Cherry Grove Beach: Looking Southwest towards Myrtle Beach/Grand Strand
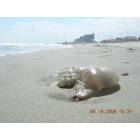
North Myrtle Beach: Jellyfish in the sand
North Myrtle Beach: North Myrtle Sunset
North Myrtle Beach: North Myrtle Beach pier shot at sunset
- see
16
more - add
your
Submit your own pictures of this city and show them to the world
- OSM Map
- General Map
- Google Map
- MSN Map
Population change since 2000: +80.8%
| Males: 9,783 | |
| Females: 10,053 |
| Median resident age: | 61.8 years |
| South Carolina median age: | 40.5 years |
Zip codes: 29582.
| North Myrtle Beach: | $71,171 |
| SC: | $64,115 |
Estimated per capita income in 2022: $52,407 (it was $27,006 in 2000)
North Myrtle Beach city income, earnings, and wages data
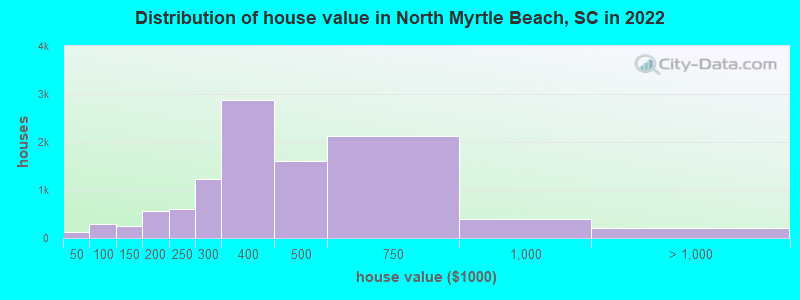
Estimated median house or condo value in 2022: $411,052 (it was $126,700 in 2000)
| North Myrtle Beach: | $411,052 |
| SC: | $254,600 |
Mean prices in 2022: all housing units: $435,934; detached houses: $519,259; townhouses or other attached units: $279,502; in 2-unit structures: $228,262; in 3-to-4-unit structures: $119,794; in 5-or-more-unit structures: $257,995; mobile homes: $122,487
Median gross rent in 2022: $1,322.
North Myrtle Beach, SC residents, houses, and apartments details
(5.9% for White Non-Hispanic residents, 11.1% for Hispanic or Latino residents, 4.5% for American Indian residents, 1.5% for two or more races residents)
Detailed information about poverty and poor residents in North Myrtle Beach, SC


Compare current foreclosures near North Myrtle Beach, SC:
| Photo | Address | Area | Beds / Baths | Price | Details |
|---|---|---|---|---|---|

|
#1
Clipper Rd
North Myrtle Beach, SC 29582
|
1,580 sq. feet
|
2 baths 3 beds |
show details | |

|
#2
Anne St
North Myrtle Beach, SC 29582
|
1,810 sq. feet
|
1 baths 3 beds |
show details | |

|
#3
Hill Top St
North Myrtle Beach, SC 29582
|
- sq. feet
|
- baths - beds |
show details | |

|
#4
Pireway Rd NW
Ash, NC 28420
|
1,248 sq. feet
|
2 baths 3 beds |
show details | |

|
#5
Chadsey Lake Dr
Calabash, NC 28467
|
1,408 sq. feet
|
2 baths 3 beds |
show details | |

|
#6
Hitchcock Way Apt 836
Myrtle Beach, SC 29577
|
1,211 sq. feet
|
2 baths 3 beds |
show details | |

|
#7
Channel I SW
Ocean Isle Beach, NC 28469
|
1,704 sq. feet
|
2 baths 2 beds |
show details | |

|
#8
E Northwind Dr SW
Ocean Isle Beach, NC 28469
|
1,296 sq. feet
|
2 baths 2 beds |
show details | |

|
#9
Partridge Rd SW
Ocean Isle Beach, NC 28469
|
1,264 sq. feet
|
2 baths 3 beds |
show details | |

|
#10
Sage Ct
Calabash, NC 28467
|
1,292 sq. feet
|
2 baths 3 beds |
show details |
| Photo | Address | Area | Beds / Baths | Price | Details |
|---|---|---|---|---|---|

|
#11
Pinebrook Cir
Little River, SC 29566
|
1,401 sq. feet
|
2 baths 3 beds |
show details | |

|
#12
Mitchell Dr Apt 1208
Myrtle Beach, SC 29577
|
1,140 sq. feet
|
2 baths 2 beds |
show details | |

|
#13
Stalvey Ave
Myrtle Beach, SC 29577
|
1,112 sq. feet
|
1 baths 3 beds |
show details | |

|
#14
Bendick Ct
Little River, SC 29566
|
2,112 sq. feet
|
3 baths 3 beds |
show details | |

|
#15
Valley Dr
Calabash, NC 28467
|
1,330 sq. feet
|
2 baths 3 beds |
show details | |

|
#16
Finch Dr SW
Shallotte, NC 28470
|
1,012 sq. feet
|
2 baths 3 beds |
show details | |

|
#17
Haystack Way
Calabash, NC 28467
|
2,080 sq. feet
|
2 baths 4 beds |
show details | |

|
#18
High Point Ave
Calabash, NC 28467
|
1,068 sq. feet
|
2 baths 2 beds |
show details | |

|
#19
Coteswood Dr
Myrtle Beach, SC 29572
|
1,620 sq. feet
|
1 baths 3 beds |
show details | |

|
#20
Churchill Downs Dr
Myrtle Beach, SC 29579
|
1,644 sq. feet
|
2 baths 3 beds |
show details |
| Photo | Address | Area | Beds / Baths | Price | Details |
|---|---|---|---|---|---|

|
#21
Pinewood Dr
Calabash, NC 28467
|
1,733 sq. feet
|
2 baths 3 beds |
show details | |

|
#22
Regency Oaks Dr
Myrtle Beach, SC 29579
|
1,092 sq. feet
|
2 baths 3 beds |
show details | |

|
#23
Weeping Willow Dr
Myrtle Beach, SC 29579
|
2,239 sq. feet
|
2 baths 3 beds |
show details | |

|
#24
Southern Trl
Myrtle Beach, SC 29579
|
1,956 sq. feet
|
2 baths 3 beds |
show details | |

|
#25
Cedar Branch Rd
Loris, SC 29569
|
1,457 sq. feet
|
2 baths 3 beds |
show details | |

|
#26
Farm Lake Dr
Myrtle Beach, SC 29579
|
1,355 sq. feet
|
2 baths 3 beds |
show details | |

|
#27
Little River Rd Apt 5a
Myrtle Beach, SC 29577
|
1,000 sq. feet
|
1 baths 2 beds |
show details | |

|
#28
Wyndfall Dr SW
Sunset Beach, NC 28468
|
1,328 sq. feet
|
2 baths 3 beds |
show details | |

|
#29
Heath Dr
Longs, SC 29568
|
1,407 sq. feet
|
2 baths 3 beds |
show details | |

|
#30
Wildhorse Dr
Conway, SC 29526
|
2,676 sq. feet
|
4 baths 4 beds |
show details |
| Photo | Address | Area | Beds / Baths | Price | Details |
|---|---|---|---|---|---|

|
#31
Arundel Rd
Myrtle Beach, SC 29577
|
2,472 sq. feet
|
2 baths 3 beds |
show details | |

|
#32
Seneca Ridge Dr
Myrtle Beach, SC 29579
|
2,056 sq. feet
|
2 baths 4 beds |
show details | |

|
#33
Indianola Ct
Myrtle Beach, SC 29579
|
3,111 sq. feet
|
2 baths 4 beds |
show details | |

|
#34
Waterway Village Blvd Apt 18b
Myrtle Beach, SC 29579
|
894 sq. feet
|
2 baths 2 beds |
show details | |

|
#35
Waterway Village Blvd Apt 15a
Myrtle Beach, SC 29579
|
894 sq. feet
|
2 baths 2 beds |
show details | |

|
#36
W Walkerton Rd
Myrtle Beach, SC 29579
|
1,610 sq. feet
|
2 baths 3 beds |
show details | |

|
#37
Isabel Ct
Myrtle Beach, SC 29579
|
1,478 sq. feet
|
2 baths 3 beds |
show details | |

|
#38
Beauclair Ct
Myrtle Beach, SC 29579
|
1,483 sq. feet
|
2 baths 3 beds |
show details | |

|
#39
Seneca Ridge Dr
Myrtle Beach, SC 29579
|
2,812 sq. feet
|
2 baths 4 beds |
show details | |

|
#40
3rd Ave S
Myrtle Beach, SC 29577
|
1,368 sq. feet
|
1 baths 3 beds |
show details |
| Photo | Address | Area | Beds / Baths | Price | Details |
|---|---|---|---|---|---|

|
#41
Lalton Dr
Conway, SC 29526
|
2,259 sq. feet
|
3 baths 3 beds |
show details | |

|
#42
Pilot House Pl
Calabash, NC 28467
|
1,600 sq. feet
|
3 baths 3 beds |
show details | |

|
#43
Abingdon Dr
Myrtle Beach, SC 29579
|
2,414 sq. feet
|
2 baths 3 beds |
show details | |

|
#44
Stoney Falls Blvd
Myrtle Beach, SC 29579
|
1,319 sq. feet
|
2 baths 3 beds |
show details | |

|
#45
Lake Tree Dr SW
Ocean Isle Beach, NC 28469
|
2,026 sq. feet
|
2 baths 3 beds |
show details | |

|
#46
Blackwolf Dr
Myrtle Beach, SC 29579
|
1,582 sq. feet
|
2 baths 3 beds |
show details | |

|
#47
River Oaks Dr
Myrtle Beach, SC 29579
|
606 sq. feet
|
1 baths 1 beds |
show details | |

|
#48
Bellegrove Dr
Myrtle Beach, SC 29579
|
1,410 sq. feet
|
2 baths 3 beds |
show details | |

|
#49
Freeboard Ln
Calabash, NC 28467
|
1,600 sq. feet
|
2 baths 3 beds |
show details | |

|
Check over 1 million property listings on Foreclosure.com!
|
browse all offers | |||


- 17,54786.6%White alone
- 1,4467.1%Hispanic
- 5152.5%Asian alone
- 5142.5%Two or more races
- 1800.9%Black alone
- 280.1%American Indian alone
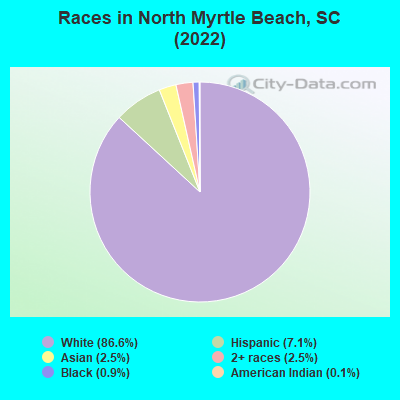
Races in North Myrtle Beach detailed stats: ancestries, foreign born residents, place of birth
According to our research of South Carolina and other state lists, there were 31 registered sex offenders living in North Myrtle Beach, South Carolina as of June 16, 2024.
The ratio of all residents to sex offenders in North Myrtle Beach is 526 to 1.
Type |
2009 |
2010 |
2011 |
2012 |
2013 |
2014 |
2015 |
2016 |
2017 |
2018 |
2019 |
2020 |
2021 |
2022 |
|---|---|---|---|---|---|---|---|---|---|---|---|---|---|---|
| Murders (per 100,000) | 0 (0.0) | 0 (0.0) | 3 (21.6) | 1 (7.0) | 0 (0.0) | 0 (0.0) | 4 (25.8) | 2 (12.5) | 1 (6.1) | 1 (6.0) | 1 (5.9) | 0 (0.0) | 1 (5.7) | 2 (10.1) |
| Rapes (per 100,000) | 7 (42.6) | 12 (87.3) | 13 (93.4) | 9 (63.1) | 14 (95.4) | 17 (112.8) | 17 (109.6) | 22 (138.0) | 20 (121.8) | 30 (179.8) | 16 (94.4) | 14 (81.5) | 17 (96.3) | 11 (55.3) |
| Robberies (per 100,000) | 20 (121.9) | 31 (225.4) | 43 (309.1) | 24 (168.4) | 20 (136.3) | 26 (172.5) | 25 (161.1) | 28 (175.6) | 13 (79.2) | 16 (95.9) | 10 (59.0) | 6 (34.9) | 6 (34.0) | 12 (60.3) |
| Assaults (per 100,000) | 73 (444.8) | 61 (443.6) | 47 (337.8) | 61 (428.0) | 87 (593.0) | 59 (391.4) | 53 (341.5) | 67 (420.2) | 37 (225.3) | 61 (365.5) | 45 (265.6) | 81 (471.4) | 77 (436.3) | 64 (321.8) |
| Burglaries (per 100,000) | 256 (1,560) | 481 (3,498) | 376 (2,703) | 367 (2,575) | 279 (1,902) | 331 (2,196) | 237 (1,527) | 197 (1,235) | 200 (1,218) | 194 (1,163) | 108 (637.5) | 90 (523.8) | 115 (651.6) | 75 (377.1) |
| Thefts (per 100,000) | 1,001 (6,099) | 1,190 (8,653) | 1,034 (7,432) | 1,064 (7,466) | 1,158 (7,893) | 1,309 (8,683) | 1,091 (7,031) | 927 (5,814) | 982 (5,980) | 785 (4,704) | 911 (5,377) | 847 (4,929) | 816 (4,624) | 733 (3,686) |
| Auto thefts (per 100,000) | 74 (450.9) | 154 (1,120) | 93 (668.5) | 105 (736.7) | 137 (933.8) | 157 (1,041) | 98 (631.5) | 116 (727.5) | 105 (639.4) | 199 (1,192) | 97 (572.5) | 63 (366.6) | 92 (521.3) | 56 (281.6) |
| Arson (per 100,000) | 2 (12.2) | 3 (21.8) | 2 (14.4) | 1 (7.0) | 4 (27.3) | 3 (19.9) | 8 (51.6) | 4 (25.1) | 3 (18.3) | 1 (6.0) | 1 (5.9) | 3 (17.5) | 4 (22.7) | 1 (5.0) |
| City-Data.com crime index | 548.8 | 906.7 | 818.1 | 738.5 | 759.3 | 804.5 | 694.5 | 649.4 | 554.0 | 622.6 | 463.7 | 433.1 | 458.1 | 343.2 |
The City-Data.com crime index weighs serious crimes and violent crimes more heavily. Higher means more crime, U.S. average is 246.1. It adjusts for the number of visitors and daily workers commuting into cities.
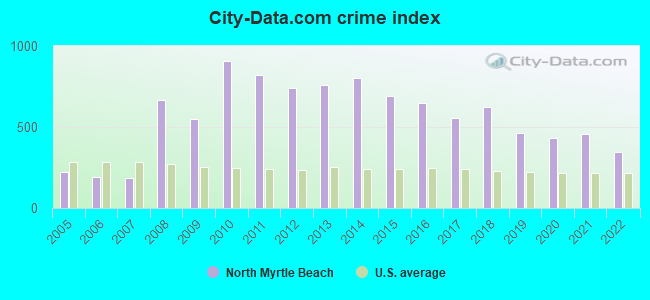
Crime rate in North Myrtle Beach detailed stats: murders, rapes, robberies, assaults, burglaries, thefts, arson
Full-time law enforcement employees in 2021, including police officers: 115 (82 officers - 71 male; 11 female).
| Officers per 1,000 residents here: | 4.65 |
| South Carolina average: | 2.21 |
 Recent articles from our blog. Our writers, many of them Ph.D. graduates or candidates, create easy-to-read articles on a wide variety of topics.

 | North Myrtle Beach vs. Myrtle Beach (11 replies) |
| Tell me about Myrtle Beach crime (15 replies) |
| Longs SC to Coastal Beach (7 replies) |
| Myrtle beach area vs. Fort Mill SC (5 replies) |
| Myrtle Beach area High Schools (1 reply) |
| We Like Conway........I think. (102 replies) |
Latest news from North Myrtle Beach, SC collected exclusively by city-data.com from local newspapers, TV, and radio stations
Ancestries: European (15.1%), English (14.6%), Irish (11.7%), American (10.6%), German (9.1%), Scotch-Irish (4.5%).
Current Local Time: EST time zone
Elevation: 8 feet
Land area: 13.0 square miles.
Population density: 1,521 people per square mile (low).
1,476 residents are foreign born (4.0% Latin America, 1.7% Asia, 1.1% Europe).
| This city: | 7.3% |
| South Carolina: | 5.3% |
Median real estate property taxes paid for housing units with mortgages in 2022: $1,360 (0.3%)
Median real estate property taxes paid for housing units with no mortgage in 2022: $1,409 (0.3%)
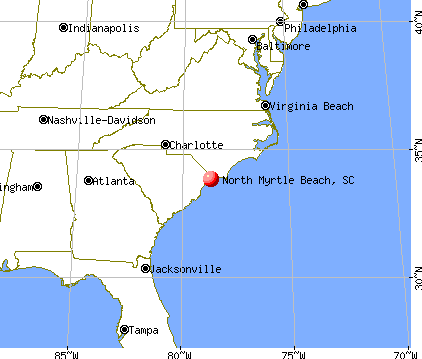
Nearest city with pop. 50,000+: Wilmington, NC  (52.1 miles , pop. 75,838).
Nearest city with pop. 200,000+: Raleigh, NC (138.1 miles , pop. 276,093).
Nearest city with pop. 1,000,000+: Philadelphia, PA (469.7 miles , pop. 1,517,550).
Nearest cities:
), ), ), Latitude: 33.82 N, Longitude: 78.68 W
Daytime population change due to commuting: +3,928 (+19.4%)
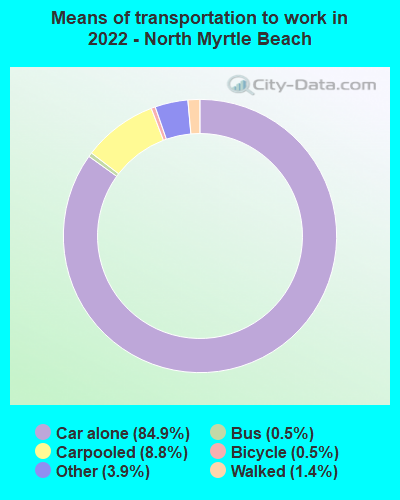
Workers who live and work in this city: 3,924 (45.1%)
Area code: 843
Property values in North Myrtle Beach, SC
North Myrtle Beach tourist attractions:
- Alabama Theatre- North Myrtle Beach, South Carolina - Theater Featuring Musical Shows
- Alligator Adventure - North Myrtle Beach, South Carolina - Reptile Zoo
- Avista Resort - North Myrtle Beach, SC - Condo Rentals and Timeshares
- Barefoot Landing - North Myrtle Beach, South Carolina - Shopping Complex With Restaurants and Entertainment Venues
- Barefoot Resort & Golf Club, Love Course, North Myrtle Beach, South Carolina - Ranked #1 Among the Top 50 Courses in Myrtle Beach by Golf Digest
- Bay Watch Resort - North Myrtle Beach, SC - Smoke Free Condo Rentals
- Beach Cove Resort - North Myrtle Beach, SC - Suite and Condo Rentals
- Ghosts and Legends Theatre - North Myrtle Beach, South Carolina - Ghost Themed Theater
- Hawaiian Rumble - North Myrtle Beach, South Carolina - MiniGolf Course
- Inlet Point Plantation Stables - North Myrtle Beach, South Carolina Horse Riding Center
- Towers on the Grove
- North Myrtle Beach - Myrtle Beach, South Carolina - City and Popular Tourist Destination
- Ocean Drive Beach and Golf Resort - North Myrtle Beach, SC - Rental Suites, Condos, and Apartments
- Prince Resort Condos - North Myrtle Beach, South Carolina - Resort by Cherry Grove Pier
- Sands Beach Club Resort - North Myrtle Beach, SC - Beachfront Suites with Ocean Views
- SeaSide Hotel - North Myrtle Beach, SC - Luxury Beachfront Condominium Rentals
- Tidewater Golf Club, North Myrtle Beach, South Carolina ? Known as the ``Pebble Beach of the East''
- T.I.G.E.R.S. Preservation Station - North Myrtle Beach, South Carolina Wildlife Exhibit & Zoo
- Wyndham Ocean Boulevard - North Myrtle Beach, SC - Seaside Condo Resort
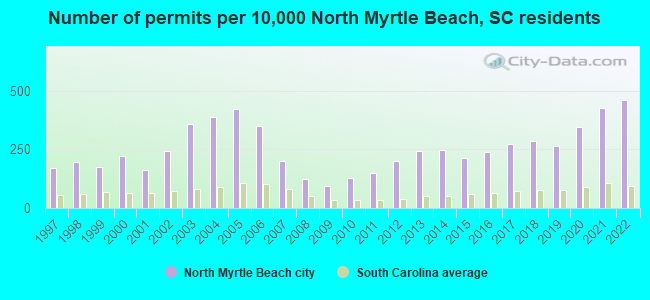
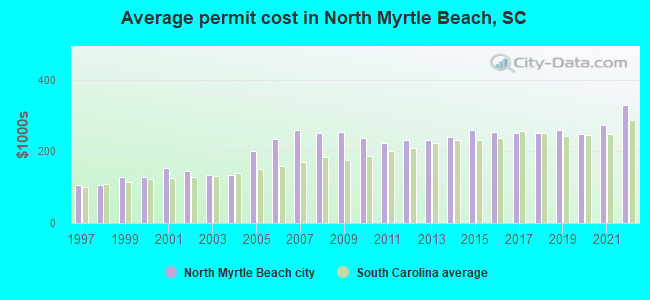
Single-family new house construction building permits:
- 2022: 505 buildings, average cost: $330,700
- 2021: 465 buildings, average cost: $272,500
- 2020: 380 buildings, average cost: $250,200
- 2019: 290 buildings, average cost: $260,800
- 2018: 314 buildings, average cost: $252,900
- 2017: 297 buildings, average cost: $252,500
- 2016: 262 buildings, average cost: $253,900
- 2015: 232 buildings, average cost: $259,100
- 2014: 273 buildings, average cost: $241,200
- 2013: 265 buildings, average cost: $230,700
- 2012: 221 buildings, average cost: $231,100
- 2011: 162 buildings, average cost: $223,300
- 2010: 138 buildings, average cost: $238,900
- 2009: 104 buildings, average cost: $254,700
- 2008: 136 buildings, average cost: $253,100
- 2007: 221 buildings, average cost: $261,000
- 2006: 383 buildings, average cost: $236,400
- 2005: 462 buildings, average cost: $200,900
- 2004: 425 buildings, average cost: $133,200
- 2003: 391 buildings, average cost: $132,500
- 2002: 265 buildings, average cost: $145,600
- 2001: 179 buildings, average cost: $154,500
- 2000: 244 buildings, average cost: $130,100
- 1999: 192 buildings, average cost: $130,200
- 1998: 215 buildings, average cost: $106,700
- 1997: 186 buildings, average cost: $105,900
| Here: | 3.9% |
| South Carolina: | 3.1% |
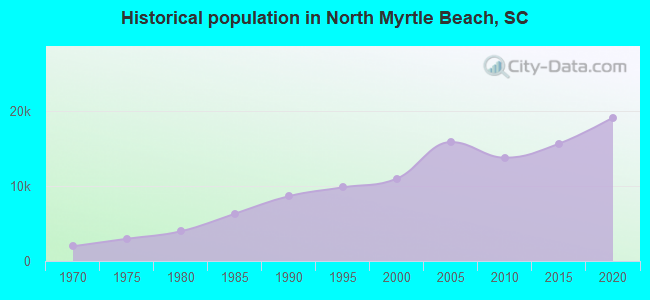
Population change in the 1990s: +1,857 (+20.4%).
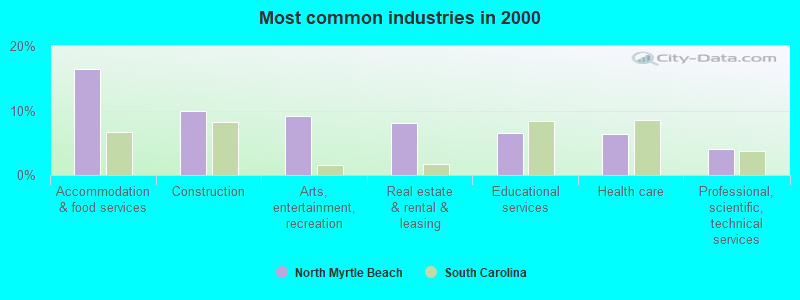
- Accommodation & food services (16.5%)
- Construction (10.0%)
- Arts, entertainment, recreation (9.2%)
- Real estate & rental & leasing (8.0%)
- Educational services (6.5%)
- Health care (6.3%)
- Professional, scientific, technical services (4.1%)
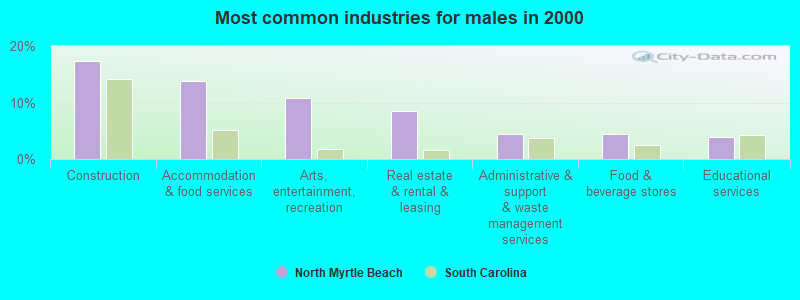
- Construction (17.4%)
- Accommodation & food services (13.8%)
- Arts, entertainment, recreation (10.8%)
- Real estate & rental & leasing (8.6%)
- Administrative & support & waste management services (4.5%)
- Food & beverage stores (4.4%)
- Educational services (4.0%)
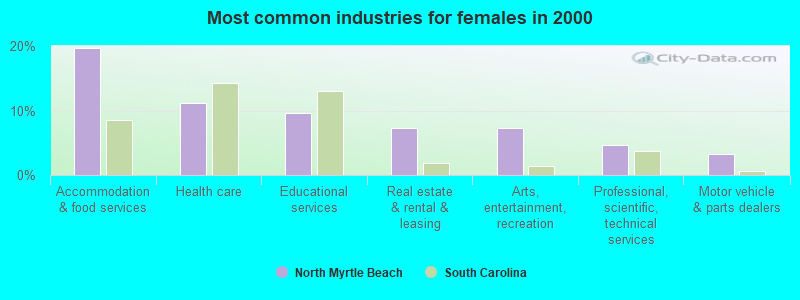
- Accommodation & food services (19.7%)
- Health care (11.1%)
- Educational services (9.6%)
- Real estate & rental & leasing (7.3%)
- Arts, entertainment, recreation (7.2%)
- Professional, scientific, technical services (4.6%)
- Motor vehicle & parts dealers (3.2%)
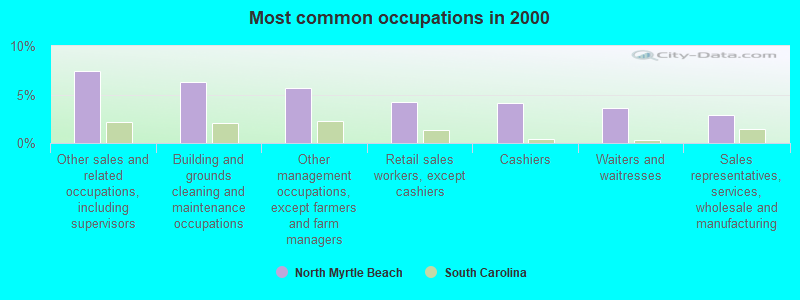
- Other sales and related occupations, including supervisors (7.5%)
- Building and grounds cleaning and maintenance occupations (6.3%)
- Other management occupations, except farmers and farm managers (5.7%)
- Retail sales workers, except cashiers (4.3%)
- Cashiers (4.1%)
- Waiters and waitresses (3.6%)
- Sales representatives, services, wholesale and manufacturing (2.9%)
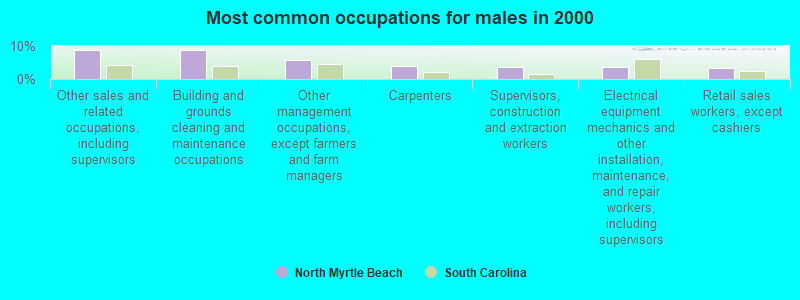
- Other sales and related occupations, including supervisors (8.9%)
- Building and grounds cleaning and maintenance occupations (8.9%)
- Other management occupations, except farmers and farm managers (5.8%)
- Carpenters (4.0%)
- Supervisors, construction and extraction workers (3.7%)
- Electrical equipment mechanics and other installation, maintenance, and repair workers, including supervisors (3.7%)
- Retail sales workers, except cashiers (3.2%)
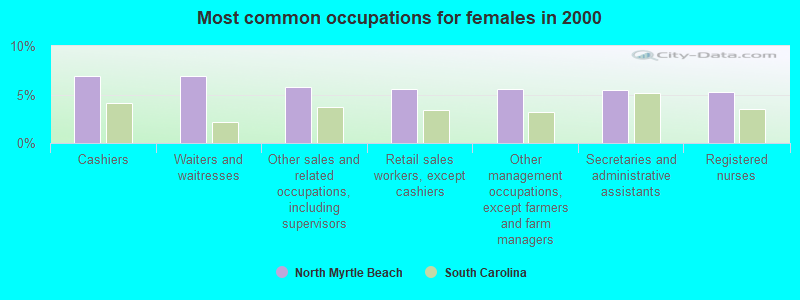
- Cashiers (6.9%)
- Waiters and waitresses (6.9%)
- Other sales and related occupations, including supervisors (5.8%)
- Retail sales workers, except cashiers (5.6%)
- Other management occupations, except farmers and farm managers (5.6%)
- Secretaries and administrative assistants (5.5%)
- Registered nurses (5.3%)
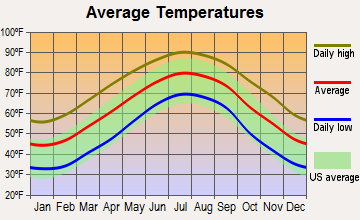
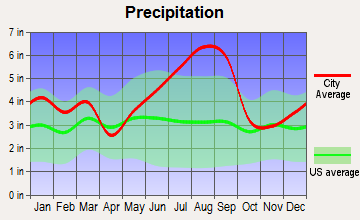
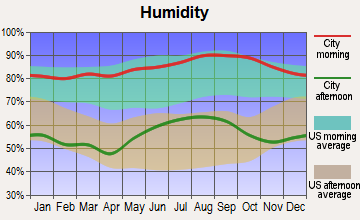
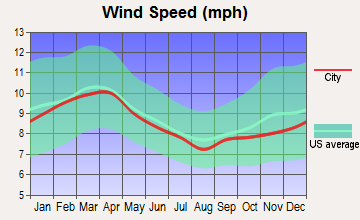
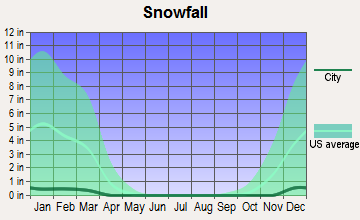
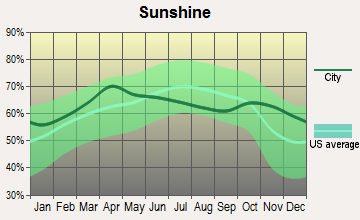
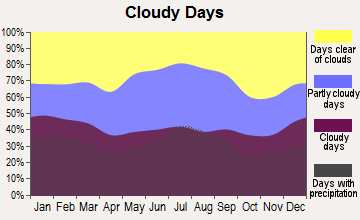
Average climate in North Myrtle Beach, South Carolina
Based on data reported by over 4,000 weather stations
(lower is better)
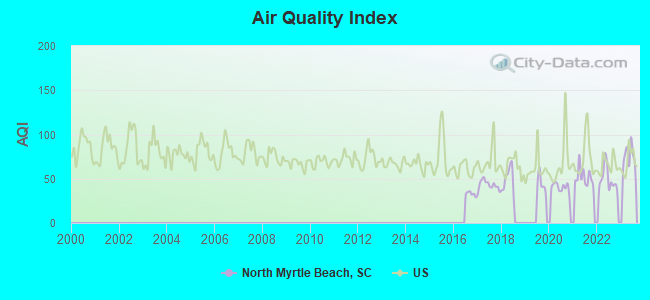
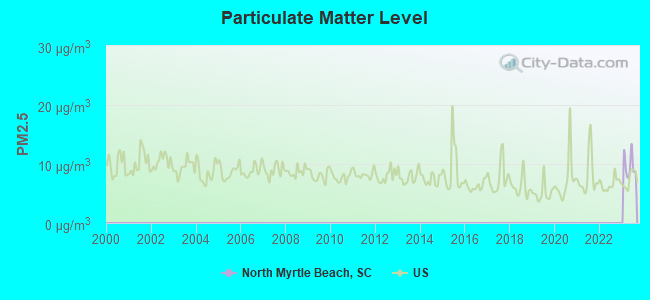
Air Quality Index (AQI) level in 2023 was 75.2. This is about average.
| City: | 75.2 |
| U.S.: | 72.6 |
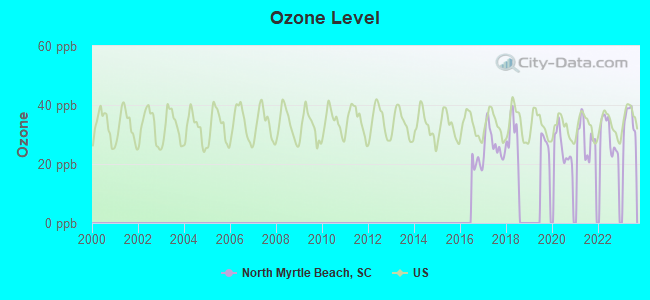
Ozone [ppb] level in 2023 was 35.1. This is about average. Closest monitor was 13.7 miles away from the city center.
| City: | 35.1 |
| U.S.: | 33.3 |
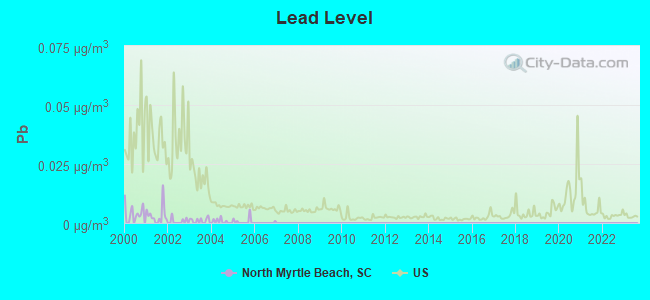
Lead (Pb) [µg/m3] level in 2007 was 0.00000. This is significantly better than average. Closest monitor was 13.7 miles away from the city center.
| City: | 0.00000 |
| U.S.: | 0.00931 |
Tornado activity:
North Myrtle Beach-area historical tornado activity is below South Carolina state average. It is 34% smaller than the overall U.S. average.
On 8/17/1965, a category F3 (max. wind speeds 158-206 mph) tornado 0.8 miles away from the North Myrtle Beach city center injured 46 people and caused between $50,000 and $500,000 in damages.
On 11/7/1995, a category F4 (max. wind speeds 207-260 mph) tornado 38.7 miles away from the city center injured one person and caused between $500,000 and $5,000,000 in damages.
Earthquake activity:
North Myrtle Beach-area historical earthquake activity is significantly above South Carolina state average. It is 58% smaller than the overall U.S. average.On 8/23/2011 at 17:51:04, a magnitude 5.8 (5.8 MW, Depth: 3.7 mi, Class: Moderate, Intensity: VI - VII) earthquake occurred 285.8 miles away from the city center
On 11/22/1974 at 05:25:55, a magnitude 4.7 (4.7 MB, Class: Light, Intensity: IV - V) earthquake occurred 105.9 miles away from the city center
On 8/9/2020 at 12:07:37, a magnitude 5.1 (5.1 MW, Depth: 4.7 mi) earthquake occurred 228.7 miles away from the city center
On 8/21/1992 at 16:31:55, a magnitude 4.4 (4.1 MB, 4.1 LG, 4.4 LG, Depth: 6.2 mi) earthquake occurred 98.6 miles away from the city center
On 8/2/1974 at 08:52:09, a magnitude 4.9 (4.3 MB, 4.9 LG) earthquake occurred 218.7 miles away from the city center
On 4/17/1995 at 13:45:57, a magnitude 3.9 (3.9 LG, Depth: 6.2 mi, Class: Light, Intensity: II - III) earthquake occurred 100.4 miles away from the city center
Magnitude types: regional Lg-wave magnitude (LG), body-wave magnitude (MB), moment magnitude (MW)
Natural disasters:
The number of natural disasters in Horry County (22) is greater than the US average (15).Major Disasters (Presidential) Declared: 10
Emergencies Declared: 5
Causes of natural disasters: Hurricanes: 12, Fires: 3, Floods: 2, Storms: 2, Winter Storms: 2, Ice Storm: 1, Tropical Storm: 1, Other: 1 (Note: some incidents may be assigned to more than one category).

Hospitals and medical centers in North Myrtle Beach:
Other hospitals and medical centers near North Myrtle Beach:
- GRAND STRAND REGIONAL MEDICAL CENTER Acute Care Hospitals (about 10 miles away; MYRTLE BEACH, SC)
- COVENANT TOWERS HEALTHCARE CENTER (Nursing Home, about 12 miles away; MYRTLE BEACH, SC)
- FRESENIUS MEDICAL CARE MYRTLE BEACH (Dialysis Facility, about 13 miles away; MYRTLE BEACH, SC)
- AMEDISYS HOME HEALTH OF MYRTLE BEACH (Home Health Center, about 15 miles away; MYRTLE BEACH, SC)
Airports located in North Myrtle Beach:
- Grand Strand Airport (CRE) (Runways: 1, Air Taxi Ops: 1,070, Itinerant Ops: 31,788, Local Ops: 13,117, Military Ops: 695)
Colleges/universities with over 2000 students nearest to North Myrtle Beach:
- Horry-Georgetown Technical College (about 19 miles; Conway, SC; Full-time enrollment: 5,772)
- Coastal Carolina University (about 20 miles; Conway, SC; FT enrollment: 8,881)
- Cape Fear Community College (about 51 miles; Wilmington, NC; FT enrollment: 8,372)
- Miller-Motte College-Wilmington (about 54 miles; Wilmington, NC; FT enrollment: 2,395)
- University of North Carolina Wilmington (about 54 miles; Wilmington, NC; FT enrollment: 13,112)
- Robeson Community College (about 59 miles; Lumberton, NC; FT enrollment: 2,322)
- Francis Marion University (about 62 miles; Florence, SC; FT enrollment: 3,624)
Public elementary/middle school in North Myrtle Beach:
Private elementary/middle school in North Myrtle Beach:
User-submitted facts and corrections:
- WNMB Radio in North Myrtle Beach is owned by Norman Communications Inc. (not Fidelity Broadcasting) Licensed was transferred by FCC in 2004
Points of interest:
Notable locations in North Myrtle Beach: Gator Hole Golf Course (A), Robbers Roost Golf Club (B), Sherwood Forest Campground (C), Surf Golf and Beach Club (D), Camp Nixon (E), Harbourgate Resort and Marina (F), North Myrtle Beach Ocean Drive Wastewater Treatment Facility (G), Windy Hill Antiaircraft Camp (H), J Bryan Floyd Community Center (I), North Myrtle Beach City Hall (J), Horry County Fire Department North Myrtle Beach (K), North Myrtle Beach Fire Department Station 5 (L), North Myrtle Beach Fire Department Station 2 (M), North Myrtle Beach Fire Department Station 3 (N), North Myrtle Beach Fire Department Station 1 (O), North Myrtle Beach Police Department - Customer Service (P), Briarcliffe Acres Police Department (Q). Display/hide their locations on the map
Shopping Centers: North Strand Plaza Shopping Center (1), Surfwood Shopping Center (2). Display/hide their locations on the map
Churches in North Myrtle Beach include: Lakeside Baptist Church (A), King of Glory Lutheran Church (B), First Baptist Church (C), Church of God (D), Trinity Church (E), Lake Side Church (F), Coastal Christian Center (G), Our Lady Star of the Sea Church (H), Saint Stephens Church (I). Display/hide their locations on the map
Cemetery: Southeastern Memorial Gardens (1). Display/hide its location on the map
Lakes, reservoirs, and swamps: Prices Swamp Run (A), Lewis Pond (B), Prices Swamp (C). Display/hide their locations on the map
Streams, rivers, and creeks: Salt Flat Creek (A), Nixon Creek (B), Camp Branch Run (C), Eden Saltworks Creek (D). Display/hide their locations on the map
Parks in North Myrtle Beach include: McLean Park (1), Central Park (2). Display/hide their locations on the map
Beaches: Windy Hill Beach (A), Cherry Grove Beach (B), Futch Beach (C). Display/hide their locations on the map
Tourist attractions: Preservation Station (Petting Zoos; Bearfoot Landings) (1), Exotic Aquarium Designs (Cultural Attractions- Events- & Facilities; 1415 Old Highway 17 North) (2), Libraries-Horry County - Branches- North Myrtle Beach (Cultural Attractions- Events- & Facilities; 799 2nd Avenue North) (3), Sheraton Broadway Plantation (Tourism Consultants; 1104 Kings Highway) (4), Libraries-Horry County - North Myrtle Beach (Cultural Attractions- Events- & Facilities; 799 2nd Avenue North) (5), Palmetto Vacations of the Carolinas (Recreation Areas; 905 Sea Mountain Hwy) (6), Park Place Properties (Amusement & Theme Parks; 614 Sea Mountain Highway) (7), Fun World (Amusement & Theme Parks; 700 7th Avenue South) (8), Grand PRIX Family Thrill Parks (Amusement & Theme Parks; 3201 South King Highway) (9). Display/hide their approximate locations on the map
Hotels: Maritime Beach Club (440 N Ocean Blvd) (1), Ocean Garden Villas (1809 South Ocean Boulevard) (2), Best Western Inn & Suites (1601 Highway 17 South) (3), Ocean Inn (1305 North Ocean Boulevard) (4), Back to the Beach (1416 South Ocean Boulevard) (5), Crescent Beach Villas (1709 South Ocean Boulevard) (6), By the Sea Motel (1801 South Ocean Boulevard) (7), Hampton Inn Harbourgate (2112 Little River Neck Road) (8), Holiday Inn (2713 South Ocean Blvd) (9). Display/hide their approximate locations on the map
Birthplace of: Matt Kyle - College basketball player (Yale Bulldogs).
| This city: | 2.0 people |
| South Carolina: | 2.5 people |
| This city: | 58.5% |
| Whole state: | 67.5% |
| This city: | 6.7% |
| Whole state: | 6.0% |
Likely homosexual households (counted as self-reported same-sex unmarried-partner households)
- Lesbian couples: 0.5% of all households
- Gay men: 0.4% of all households
Banks with most branches in North Myrtle Beach (2011 data):
- TD Bank, National Association: Crescent Beach Branch at 1801 Highway 17 South, branch established on 1994/05/05; Cherry Grove Branch at 1201 Sea Mountain Highway, branch established on 1988/07/18. Info updated 2010/10/04: Bank assets: $188,912.6 mil, Deposits: $153,149.8 mil, headquarters in Wilmington, DE, positive income, 1314 total offices, Holding Company: Toronto-Dominion Bank, The
- Branch Banking and Trust Company: North Myrtle Beach Main Branch at 521 Main St, branch established on 1954/01/11; North Myrtle Beach Highway 17 Branch at 720 Highway 17 South, branch established on 1986/07/16. Info updated 2010/03/29: Bank assets: $168,867.6 mil, Deposits: $127,549.5 mil, headquarters in Winston Salem, NC, positive income, Commercial Lending Specialization, 1793 total offices, Holding Company: Bb&T Corporation
- The Conway National Bank: North Myrtle Beach Office Branch at 110 Highway 17 North, branch established on 2002/09/30; Northside Branch at Highway 17 And Chestnut Road, branch established on 1977/05/02. Info updated 2010/06/01: Bank assets: $914.3 mil, Deposits: $733.3 mil, headquarters in Conway, SC, positive income, Commercial Lending Specialization, 15 total offices, Holding Company: Cnb Corporation
- First Federal Savings and Loan Association of Charleston: North Myrtle Beach Branch at 550 Highway 17 North, branch established on 2004/01/21; North Myrtle Branch at 606 Main Street, branch established on 2005/06/06. Info updated 2012/02/24: Bank assets: $3,140.4 mil, Deposits: $2,278.8 mil, headquarters in Charleston, SC, negative income in the last year, Mortgage Lending Specialization, 69 total offices
- Wells Fargo Bank, National Association: North Myrtle Beach Branch at 1025 Highway 17 South, branch established on 1967/07/20; Barefoot Commons Financial Center at 3910 Highwy 17 S, branch established on 2010/07/01. Info updated 2011/04/05: Bank assets: $1,161,490.0 mil, Deposits: $905,653.0 mil, headquarters in Sioux Falls, SD, positive income, 6395 total offices, Holding Company: Wells Fargo & Company
- Horry County State Bank: Ocean Drive Branch at 617 Hwy. 17 South, branch established on 2007/06/11; Windy Hill Branch at 4400 Hwy 17 South, branch established on 2002/05/24. Info updated 2006/11/03: Bank assets: $537.9 mil, Deposits: $491.4 mil, headquarters in Loris, SC, negative income in the last year, Commercial Lending Specialization, 13 total offices, Holding Company: Hcsb Financial Corporation
- First Citizens Bank and Trust Company, Inc.: North Myrtle Beach Branch at 601 Highway 17 South, branch established on 1999/03/22. Info updated 2011/08/24: Bank assets: $8,104.0 mil, Deposits: $6,880.8 mil, headquarters in Columbia, SC, positive income, 197 total offices, Holding Company: First Citizens Bancorporation, Inc.
- Bank of America, National Association: North Myrtle Beach Branch at 1339 U.S. Highway 17, South, branch established on 1974/02/11. Info updated 2009/11/18: Bank assets: $1,451,969.3 mil, Deposits: $1,077,176.8 mil, headquarters in Charlotte, NC, positive income, 5782 total offices, Holding Company: Bank Of America Corporation
- Carolina Bank & Trust Co.: N Myrtle Beach Branch at 1043 Sea Mountain Hwy, branch established on 2001/05/07. Info updated 2006/11/03: Bank assets: $358.5 mil, Deposits: $314.2 mil, headquarters in Lamar, SC, positive income, Commercial Lending Specialization, 16 total offices, Holding Company: First Carolina Bancshares Corporation
- 6 other banks with 6 local branches
For population 15 years and over in North Myrtle Beach:
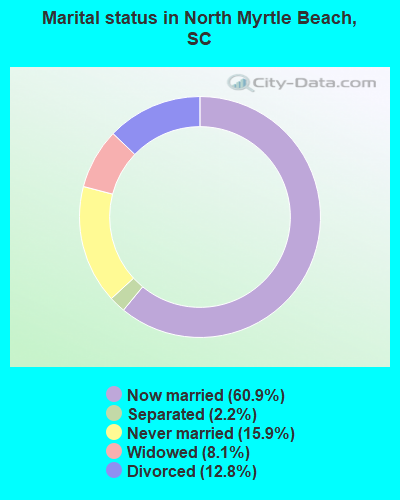
- Never married: 15.9%
- Now married: 60.9%
- Separated: 2.2%
- Widowed: 8.1%
- Divorced: 12.8%
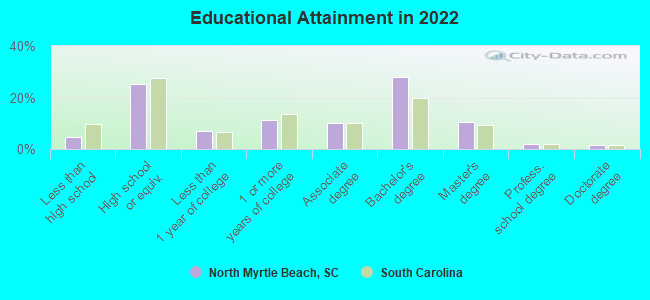
For population 25 years and over in North Myrtle Beach:
- High school or higher: 94.6%
- Bachelor's degree or higher: 39.1%
- Graduate or professional degree: 13.5%
- Unemployed: 3.9%
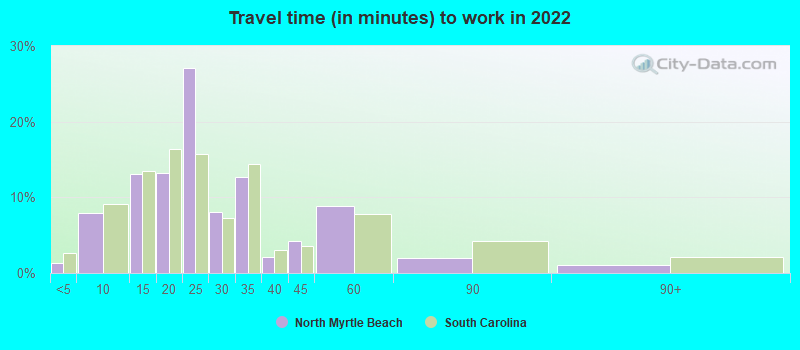
- Mean travel time to work (commute): 19.6 minutes
| Here: | 9.4 |
| South Carolina average: | 11.1 |
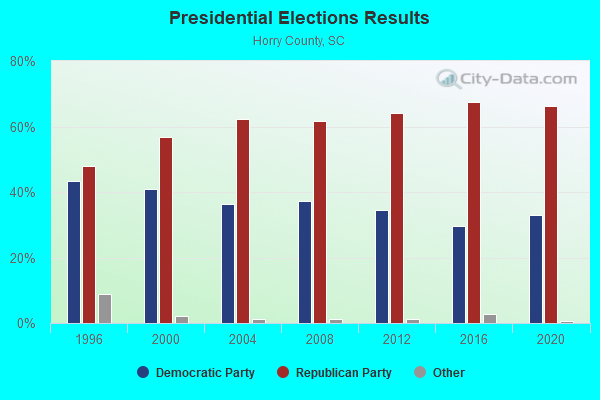
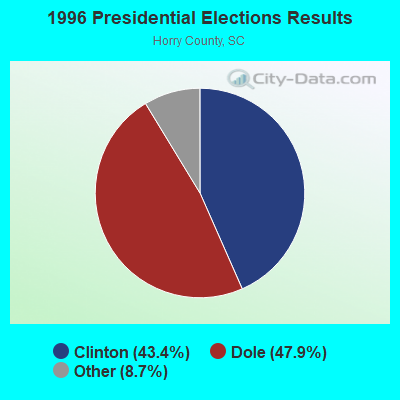
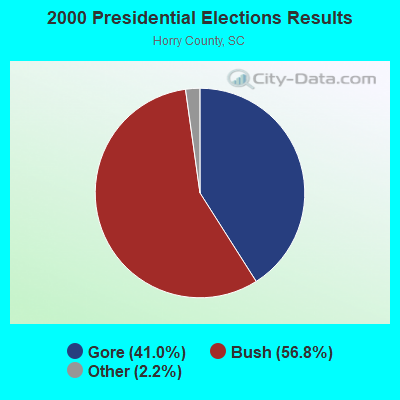
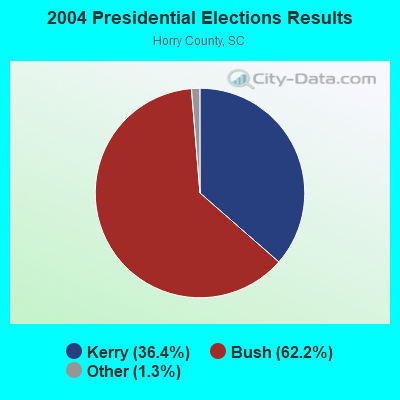
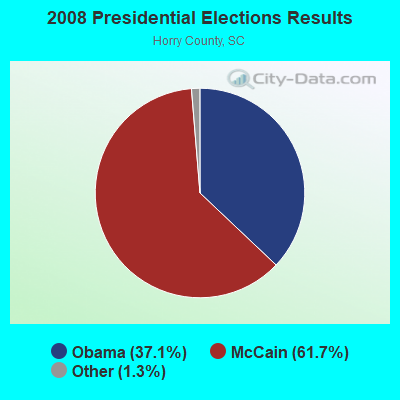

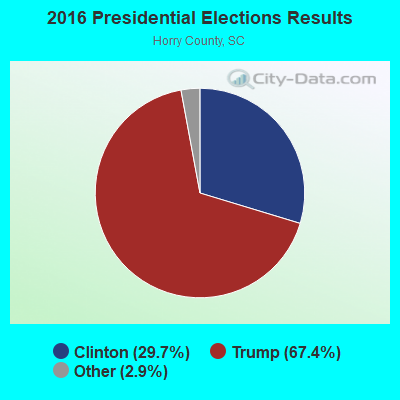
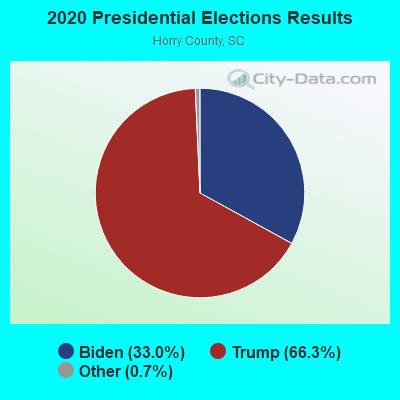
Graphs represent county-level data. Detailed 2008 Election Results
Political contributions by individuals in North Myrtle Beach, SC
Religion statistics for North Myrtle Beach, SC (based on Horry County data)
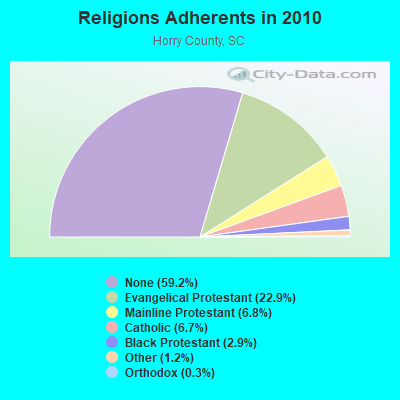
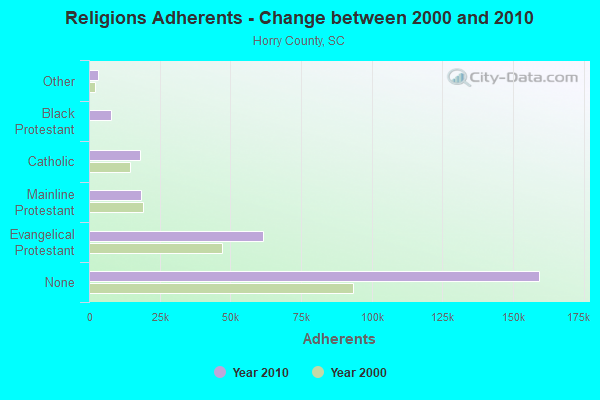
| Religion | Adherents | Congregations |
|---|---|---|
| Evangelical Protestant | 61,718 | 270 |
| Mainline Protestant | 18,278 | 39 |
| Catholic | 18,159 | 5 |
| Black Protestant | 7,891 | 41 |
| Other | 3,148 | 14 |
| Orthodox | 730 | 3 |
| None | 159,367 | - |
Food Environment Statistics:
| This county: | 2.24 / 10,000 pop. |
| South Carolina: | 1.99 / 10,000 pop. |
| Here: | 0.28 / 10,000 pop. |
| State: | 0.15 / 10,000 pop. |
| Here: | 0.68 / 10,000 pop. |
| South Carolina: | 0.85 / 10,000 pop. |
| Horry County: | 6.57 / 10,000 pop. |
| South Carolina: | 5.38 / 10,000 pop. |
| Horry County: | 18.38 / 10,000 pop. |
| State: | 7.75 / 10,000 pop. |
| This county: | 9.9% |
| South Carolina: | 10.6% |
| Horry County: | 27.1% |
| South Carolina: | 29.4% |
| Horry County: | 15.8% |
| South Carolina: | 13.4% |
Health and Nutrition:
| Here: | 49.2% |
| South Carolina: | 49.2% |
| North Myrtle Beach: | 43.8% |
| South Carolina: | 46.2% |
| This city: | 28.5 |
| State: | 29.0 |
| North Myrtle Beach: | 22.5% |
| State: | 20.4% |
| North Myrtle Beach: | 9.8% |
| South Carolina: | 11.0% |
| North Myrtle Beach: | 6.9 |
| South Carolina: | 6.8 |
| North Myrtle Beach: | 35.1% |
| South Carolina: | 34.4% |
| North Myrtle Beach: | 52.8% |
| South Carolina: | 55.6% |
| This city: | 74.9% |
| State: | 79.9% |
More about Health and Nutrition of North Myrtle Beach, SC Residents
| Local government employment and payroll (March 2022) | |||||
| Function | Full-time employees | Monthly full-time payroll | Average yearly full-time wage | Part-time employees | Monthly part-time payroll |
|---|---|---|---|---|---|
| Police Protection - Officers | 81 | $423,199 | $62,696 | 0 | $0 |
| Parks and Recreation | 62 | $250,270 | $48,439 | 96 | $86,027 |
| Firefighters | 56 | $284,565 | $60,978 | 0 | $0 |
| Water Supply | 33 | $153,415 | $55,787 | 0 | $0 |
| Financial Administration | 30 | $172,958 | $69,183 | 1 | $1,452 |
| Solid Waste Management | 29 | $129,591 | $53,624 | 0 | $0 |
| Streets and Highways | 27 | $115,834 | $51,482 | 0 | $0 |
| Correction | 26 | $91,262 | $42,121 | 0 | $0 |
| Other and Unallocable | 21 | $94,647 | $54,084 | 0 | $0 |
| Other Government Administration | 19 | $155,968 | $98,506 | 2 | $2,515 |
| Police - Other | 13 | $72,099 | $66,553 | 0 | $0 |
| Sewerage | 11 | $73,018 | $79,656 | 0 | $0 |
| Judicial and Legal | 8 | $94,333 | $141,500 | 1 | $1,550 |
| Totals for Government | 416 | $2,111,158 | $60,899 | 100 | $91,544 |
North Myrtle Beach government finances - Expenditure in 2021 (per resident):
- Construction - Regular Highways: $4,316,000 ($217.58)
General Public Buildings: $2,057,000 ($103.70)
Police Protection: $539,000 ($27.17)
Natural Resources - Other: $440,000 ($22.18)
Sewerage: $93,000 ($4.69)
Parks and Recreation: $90,000 ($4.54)
- Current Operations - General - Other: $16,937,000 ($853.85)
Police Protection: $11,190,000 ($564.13)
Water Utilities: $6,431,000 ($324.21)
Local Fire Protection: $5,643,000 ($284.48)
Parks and Recreation: $4,293,000 ($216.42)
Miscellaneous Commercial Activities - Other: $4,215,000 ($212.49)
Sewerage: $3,765,000 ($189.81)
Central Staff Services: $3,624,000 ($182.70)
Solid Waste Management: $3,545,000 ($178.72)
Regular Highways: $2,877,000 ($145.04)
Financial Administration: $2,114,000 ($106.57)
Judicial and Legal Services: $1,383,000 ($69.72)
General Public Buildings: $1,185,000 ($59.74)
Natural Resources - Other: $257,000 ($12.96)
- General - Interest on Debt: $222,000 ($11.19)
- Other Capital Outlay - Parks and Recreation: $2,237,000 ($112.77)
Local Fire Protection: $845,000 ($42.60)
General - Other: $689,000 ($34.73)
Police Protection: $658,000 ($33.17)
Sewerage: $558,000 ($28.13)
Water Utilities: $499,000 ($25.16)
Regular Highways: $274,000 ($13.81)
General Public Building: $97,000 ($4.89)
Miscellaneous Commercial Activities - Other: $79,000 ($3.98)
Financial Administration: $48,000 ($2.42)
Central Staff Services: $29,000 ($1.46)
- Total Salaries and Wages: $36,841,000 ($1857.28)
North Myrtle Beach government finances - Revenue in 2021 (per resident):
- Charges - Sewerage: $6,180,000 ($311.55)
Solid Waste Management: $5,473,000 ($275.91)
Miscellaneous Commercial Activities: $5,466,000 ($275.56)
Natural Resources - Other: $2,987,000 ($150.58)
Parking Facilities: $993,000 ($50.06)
Parks and Recreation: $254,000 ($12.81)
- Federal Intergovernmental - Other: $1,261,000 ($63.57)
- Local Intergovernmental - Highways: $837,000 ($42.20)
Other: $42,000 ($2.12)
- Miscellaneous - General Revenue - Other: $7,700,000 ($388.18)
Special Assessments: $1,312,000 ($66.14)
Rents: $451,000 ($22.74)
Fines and Forfeits: $197,000 ($9.93)
Interest Earnings: $139,000 ($7.01)
Sale of Property: $62,000 ($3.13)
Donations From Private Sources: $40,000 ($2.02)
- Revenue - Water Utilities: $8,472,000 ($427.10)
- State Intergovernmental - Other: $5,447,000 ($274.60)
General Local Government Support: $1,294,000 ($65.23)
Highways: $992,000 ($50.01)
- Tax - Property: $20,246,000 ($1020.67)
Other Selective Sales: $13,731,000 ($692.23)
Other License: $8,798,000 ($443.54)
Public Utility License: $2,374,000 ($119.68)
North Myrtle Beach government finances - Debt in 2021 (per resident):
- Long Term Debt - Outstanding Unspecified Public Purpose: $5,858,000 ($295.32)
Issue, Unspecified Public Purpose: $5,000,000 ($252.07)
Beginning Outstanding - Unspecified Public Purpose: $3,224,000 ($162.53)
Retired Unspecified Public Purpose: $2,366,000 ($119.28)
Beginning Outstanding - Public Debt for Private Purpose: $2,253,000 ($113.58)
Retired Nonguaranteed - Public Debt for Private Purpose: $1,336,000 ($67.35)
Outstanding Nonguaranteed - Industrial Revenue: $916,000 ($46.18)
North Myrtle Beach government finances - Cash and Securities in 2021 (per resident):
- Other Funds - Cash and Securities: $40,253,000 ($2029.29)
- Sinking Funds - Cash and Securities: $916,000 ($46.18)
| Businesses in North Myrtle Beach, SC | ||||
| Name | Count | Name | Count | |
|---|---|---|---|---|
| Applebee's | 1 | McDonald's | 2 | |
| Arby's | 2 | Nike | 1 | |
| Best Western | 1 | Office Depot | 1 | |
| Buffalo Wild Wings | 1 | Olive Garden | 1 | |
| CVS | 2 | Papa John's Pizza | 1 | |
| Chick-Fil-A | 1 | Pizza Hut | 2 | |
| Circle K | 1 | Quality | 1 | |
| Clarks | 1 | Rite Aid | 1 | |
| Cold Stone Creamery | 1 | Sprint Nextel | 1 | |
| Comfort Inn | 1 | Starbucks | 1 | |
| Cracker Barrel | 1 | Subway | 3 | |
| Curves | 1 | Super 8 | 2 | |
| FedEx | 6 | T-Mobile | 2 | |
| Firestone Complete Auto Care | 1 | T.G.I. Driday's | 1 | |
| GNC | 1 | Taco Bell | 1 | |
| H&R Block | 1 | U-Haul | 1 | |
| Hardee's | 1 | UPS | 9 | |
| Hilton | 1 | Vans | 1 | |
| IHOP | 1 | Verizon Wireless | 1 | |
| KFC | 1 | Waffle House | 1 | |
| Kroger | 1 | Walgreens | 2 | |
| La Quinta | 1 | Walmart | 1 | |
| Lowe's | 1 | |||
Strongest AM radio stations in North Myrtle Beach:
- WMIR (1200 AM; 6 kW; ATLANTIC BEACH, SC; Owner: ATLANTIC BEACH RADIO, INC.)
- WQJM (1450 AM; 10 kW; MYRTLE BEACH, SC; Owner: NM LICENSING, LLC)
- WNMB (900 AM; 0 kW; NORTH MYRTLE BEACH, SC; Owner: FIDELITY BROADCASTING CORPORATION)
- WPJS (1330 AM; 5 kW; CONWAY, SC; Owner: WPJS BROADCASTING, INC.)
- WTAB (1370 AM; 5 kW; TABOR CITY, NC; Owner: WTAB, INC)
- WMYT (1180 AM; daytime; 10 kW; CAROLINA BEACH, NC; Owner: FAMILY RADIO NETWORK, INC.)
- WPTF (680 AM; 50 kW; RALEIGH, NC; Owner: FIRST STATE COMMUNICATIONS)
- WENC (1220 AM; 5 kW; WHITEVILLE, NC; Owner: DHA COMMUNICATIONS, INC.)
- WCEO (840 AM; daytime; 50 kW; COLUMBIA, SC; Owner: EASTERN BROADCASTING GROUP, INC.)
- WBAJ (890 AM; daytime; 50 kW; BLYTHEWOOD, SC; Owner: FAMILY FIRST)
- WJMX (970 AM; 10 kW; FLORENCE, SC; Owner: QANTUM OF FLORENCE LICENSE COMPANY, LLC)
- WAAV (980 AM; 5 kW; LELAND, NC; Owner: CUMULUS LICENSING CORP.)
- WLSC (1240 AM; 1 kW; LORIS, SC; Owner: J.A.R.C. BROADCASTING, INC.)
Strongest FM radio stations in North Myrtle Beach:
- WEZV (105.9 FM; NORTH MYRTLE BEACH, SC; Owner: FIDELITY BROADCASTING CORPORATION)
- WHQR (91.3 FM; WILMINGTON, NC; Owner: FRIENDS OF PUBLIC RADIO, INC.)
- WVCO (94.9 FM; LORIS, SC; Owner: CAROLINA BEACH MUSIC BROADCASTING CORP.)
- WYNA (104.9 FM; CALABASH, NC; Owner: COASTLINE COMMUNICATIONS OF CAROLINA INC)
- WYAV (104.1 FM; MYRTLE BEACH, SC; Owner: NM LICENSING, LLC)
- WKZQ-FM (101.7 FM; MYRTLE BEACH, SC; Owner: NM LICENSING, LLC)
- WMYB (92.1 FM; MYRTLE BEACH, SC; Owner: NM LICENSING, LLC)
- WGTR (107.9 FM; BUCKSPORT, SC; Owner: QANTUM OF MYRTLE BEACH LICENSE COMPANY, LLC)
- WKVC (88.9 FM; NORTH MYRTLE BEACH, SC; Owner: EDUCATIONAL MEDIA FOUNDATION)
- WYEZ (94.5 FM; MURRELLS INLET, SC; Owner: FIDELITY BROADCASTING CORPORATION)
- WHMC-FM (90.1 FM; CONWAY, SC; Owner: SOUTH CAROLINA EDUCATIONAL TV COMMISSION)
- WWXM (97.7 FM; GARDEN CITY, SC; Owner: QANTUM OF MYRTLE BEACH LICENSE COMPANY, LLC)
- WEGX (92.9 FM; DILLON, SC; Owner: QANTUM OF FLORENCE LICENSE COMPANY, LLC)
- WJXY-FM (93.9 FM; CONWAY, SC; Owner: CUMULUS LICENSING CORP.)
- WGNI (102.7 FM; WILMINGTON, NC; Owner: CUMULUS LICENSING CORP.)
- WRNN (99.5 FM; SOCASTEE, SC; Owner: NM LICENSING, LLC)
- WDAI (98.5 FM; PAWLEYS ISLAND, SC; Owner: CUMULUS LICENSING CORP.)
- WDZD (93.5 FM; OCEAN ISLE BEACH, NC; Owner: QANTUM OF MYRTLE BEACH LICENSE COMPANY, LLC)
- WYAK-FM (103.1 FM; SURFSIDE BEACH, SC; Owner: CUMULUS LICENSING CORP.)
- WMNX (97.3 FM; WILMINGTON, NC; Owner: CUMULUS LICENSING CORP.)
TV broadcast stations around North Myrtle Beach:
- WFXB (Channel 43; MYRTLE BEACH, SC; Owner: GE MEDIA, INC.)
- W49AN (Channel 49; MYRTLE BEACH, SC; Owner: DOVE BROADCASTING, INC.)
- WGSI-CA (Channel 11; MYRTLE BEACH, SC; Owner: BEACH TV OF SOUTH CAROLINA, INC.)
- WGSC-CA (Channel 8; MYRTLE BEACH, SC; Owner: BEACH TV OF SOUTH CAROLINA, INC.)
- WSFX-TV (Channel 26; WILMINGTON, NC; Owner: SOUTHEASTERN MEDIA HOLDINGS, INC.)
- WUNJ-TV (Channel 39; WILMINGTON, NC; Owner: UNIVERSITY OF NORTH CAROLINA)
- W34CQ (Channel 34; MYRTLE BEACH, SC; Owner: TRINITY BROADCASTING NETWORK)
- WHMC (Channel 23; CONWAY, SC; Owner: SOUTH CAROLINA EDUCATIONAL TV COMMISSION)
- WPDE-TV (Channel 15; FLORENCE, SC; Owner: GRAND STRAND COMMUNICATIONS)
- WWMB (Channel 21; FLORENCE, SC; Owner: ATLANTIC MEDIA GROUP, INC.)
- WBTW (Channel 13; FLORENCE, SC; Owner: MEDIA GENERAL BROADCASTING OF SO. CAROLINA HOLDINGS, INC.)
- WECT (Channel 6; WILMINGTON, NC; Owner: RAYCOM AMERICA, INC.)
- W47CK (Channel 47; SHALLOTTE, NC; Owner: CAROLINA CHRISTIAN BROADCASTING INC.)
- WWSC-LP (Channel 28; MYRTLE BEACH, SC; Owner: WWSC TELEVISION, INC.)
- National Bridge Inventory (NBI) Statistics
- 72Number of bridges
- 2,306ft / 703mTotal length
- $6,529,000Total costs
- 928,017Total average daily traffic
- 60,537Total average daily truck traffic
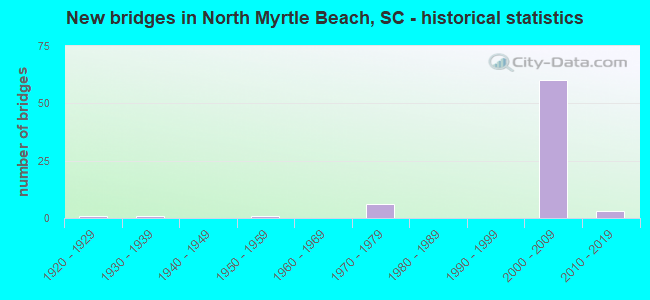
- New bridges - historical statistics
- 11920-1929
- 11930-1939
- 11950-1959
- 61970-1979
- 602000-2009
- 32010-2019
FCC Registered Commercial Land Mobile Towers: 1 (See the full list of FCC Registered Commercial Land Mobile Towers in North Myrtle Beach, SC)
FCC Registered Private Land Mobile Towers: 6 (See the full list of FCC Registered Private Land Mobile Towers)
FCC Registered Broadcast Land Mobile Towers: 55 (See the full list of FCC Registered Broadcast Land Mobile Towers)
FCC Registered Microwave Towers: 11 (See the full list of FCC Registered Microwave Towers in this town)
FCC Registered Maritime Coast & Aviation Ground Towers: 8 (See the full list of FCC Registered Maritime Coast & Aviation Ground Towers)
FCC Registered Amateur Radio Licenses: 82 (See the full list of FCC Registered Amateur Radio Licenses in North Myrtle Beach)
FAA Registered Aircraft Manufacturers and Dealers: 2 (See the full list of FAA Registered Manufacturers and Dealers in North Myrtle Beach)
FAA Registered Aircraft: 37 (See the full list of FAA Registered Aircraft)
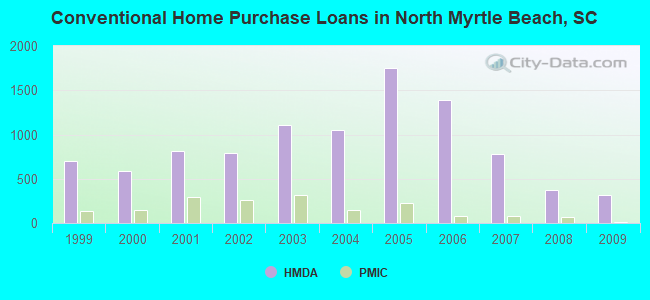
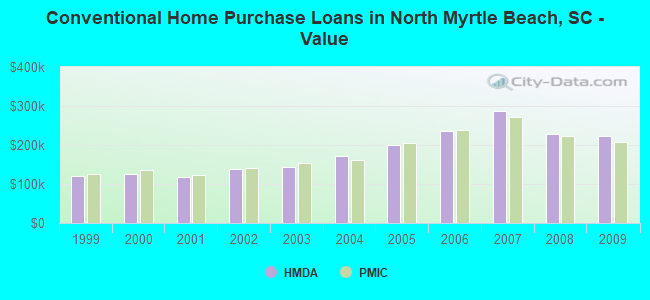
| Home Mortgage Disclosure Act Aggregated Statistics For Year 2009 (Based on 1 full and 3 partial tracts) | ||||||||||||||
| A) FHA, FSA/RHS & VA Home Purchase Loans | B) Conventional Home Purchase Loans | C) Refinancings | D) Home Improvement Loans | E) Loans on Dwellings For 5+ Families | F) Non-occupant Loans on < 5 Family Dwellings (A B C & D) | G) Loans On Manufactured Home Dwelling (A B C & D) | ||||||||
|---|---|---|---|---|---|---|---|---|---|---|---|---|---|---|
| Number | Average Value | Number | Average Value | Number | Average Value | Number | Average Value | Number | Average Value | Number | Average Value | Number | Average Value | |
| LOANS ORIGINATED | 8 | $154,748 | 318 | $223,848 | 510 | $225,534 | 13 | $125,658 | 5 | $612,920 | 552 | $221,947 | 5 | $55,872 |
| APPLICATIONS APPROVED, NOT ACCEPTED | 0 | $0 | 29 | $283,772 | 40 | $219,219 | 2 | $34,760 | 0 | $0 | 54 | $251,257 | 1 | $52,480 |
| APPLICATIONS DENIED | 8 | $134,030 | 106 | $268,249 | 297 | $241,322 | 8 | $110,490 | 0 | $0 | 290 | $236,431 | 6 | $80,763 |
| APPLICATIONS WITHDRAWN | 3 | $241,803 | 64 | $279,047 | 147 | $228,863 | 3 | $213,717 | 0 | $0 | 138 | $245,649 | 0 | $0 |
| FILES CLOSED FOR INCOMPLETENESS | 1 | $128,930 | 13 | $305,025 | 30 | $248,691 | 0 | $0 | 0 | $0 | 34 | $237,339 | 0 | $0 |
Detailed HMDA statistics for the following Tracts: 0402.00 , 0403.00, 0404.00, 0405.00
| Private Mortgage Insurance Companies Aggregated Statistics For Year 2009 (Based on 1 full and 3 partial tracts) | ||||||
| A) Conventional Home Purchase Loans | B) Refinancings | C) Non-occupant Loans on < 5 Family Dwellings (A & B) | ||||
|---|---|---|---|---|---|---|
| Number | Average Value | Number | Average Value | Number | Average Value | |
| LOANS ORIGINATED | 7 | $207,206 | 3 | $317,293 | 6 | $216,687 |
| APPLICATIONS APPROVED, NOT ACCEPTED | 5 | $225,662 | 2 | $232,435 | 4 | $210,120 |
| APPLICATIONS DENIED | 4 | $230,425 | 6 | $267,857 | 6 | $252,988 |
| APPLICATIONS WITHDRAWN | 3 | $199,663 | 3 | $189,143 | 3 | $201,703 |
| FILES CLOSED FOR INCOMPLETENESS | 3 | $138,677 | 0 | $0 | 3 | $138,677 |
Detailed PMIC statistics for the following Tracts: 0402.00 , 0403.00, 0404.00, 0405.00
2002 - 2018 National Fire Incident Reporting System (NFIRS) incidents
- Fire incident types reported to NFIRS in North Myrtle Beach, SC
- 71843.6%Structure Fires
- 68341.4%Outside Fires
- 20412.4%Mobile Property/Vehicle Fires
- 432.6%Other
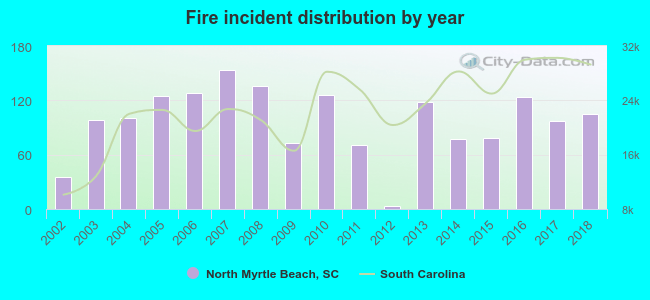 According to the data from the years 2002 - 2018 the average number of fire incidents per year is 97. The highest number of reported fires - 153 took place in 2007, and the least - 3 in 2012. The data has a growing trend.
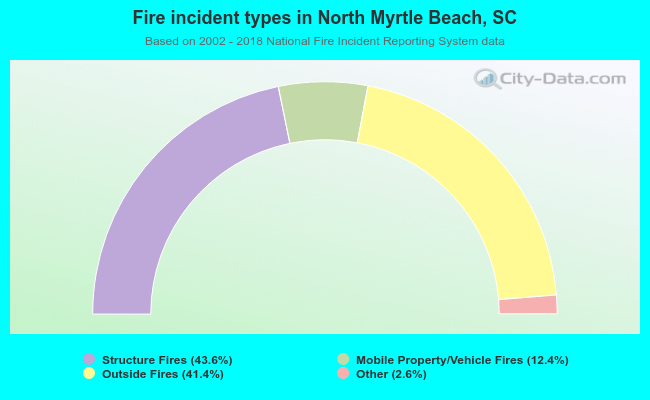 When looking into fire subcategories, the most incidents belonged to: Structure Fires (43.6%), and Outside Fires (41.4%).
Fire-safe hotels and motels in North Myrtle Beach, South Carolina:
- Cherry Grove Manor, 2104 N Ocean Blvd, North Myrtle Beach, South Carolina 29582 , Phone: (843) 249-2731
- Hampton Inn-Harborgate, 2112 Little Riv Neck Rd, North Myrtle Beach, South Carolina 29582 , Phone: (843) 249-1997, Fax: (843) 249-1998
- Rodeway Inn North Myrtle Beach, 1755 Hwy 17 N, North Myrtle Beach, South Carolina 29582 , Phone: (843) 249-2490, Fax: (843) 280-5494
- Atlantic Breeze Ocean Resort, 1321 S Ocean Blvd, North Myrtle Beach, South Carolina 29582 , Phone: (843) 417-1700, Fax: (843) 417-1703
- Harbourgate Marina Club, 2100 Sea Mountain Hwy, North Myrtle Beach, South Carolina 29582 , Phone: (843) 417-1160, Fax: (843) 417-1161
- Bay Watch Resort & Conference Center, 2701 S Ocean Blvd, North Myrtle Beach, South Carolina 29582 , Phone: (843) 272-4600, Fax: (843) 272-4440
- Avista Resort, 300 N Ocean Blvd, North Myrtle Beach, South Carolina 29582 , Phone: (843) 249-2521, Fax: (843) 417-1061
- Prince Resort At The Cherry Grove Pier, 3500 N Ocean Blvd, North Myrtle Beach, South Carolina 29582 , Phone: (843) 417-1300, Fax: (843) 417-1303
- 2 other hotels and motels
| Most common first names in North Myrtle Beach, SC among deceased individuals | ||
| Name | Count | Lived (average) |
|---|---|---|
| James | 103 | 72.4 years |
| Robert | 96 | 72.1 years |
| William | 94 | 72.4 years |
| John | 80 | 73.5 years |
| Mary | 69 | 77.4 years |
| Charles | 46 | 74.8 years |
| George | 43 | 76.1 years |
| Joseph | 31 | 75.7 years |
| Thomas | 30 | 70.9 years |
| Margaret | 27 | 77.6 years |
| Most common last names in North Myrtle Beach, SC among deceased individuals | ||
| Last name | Count | Lived (average) |
|---|---|---|
| Bellamy | 49 | 72.3 years |
| Lewis | 37 | 74.1 years |
| Smith | 35 | 75.0 years |
| Johnson | 28 | 75.0 years |
| Gore | 28 | 72.0 years |
| Williams | 24 | 71.5 years |
| Ward | 22 | 73.0 years |
| Davis | 21 | 76.0 years |
| Brown | 20 | 71.8 years |
| Vereen | 19 | 68.4 years |
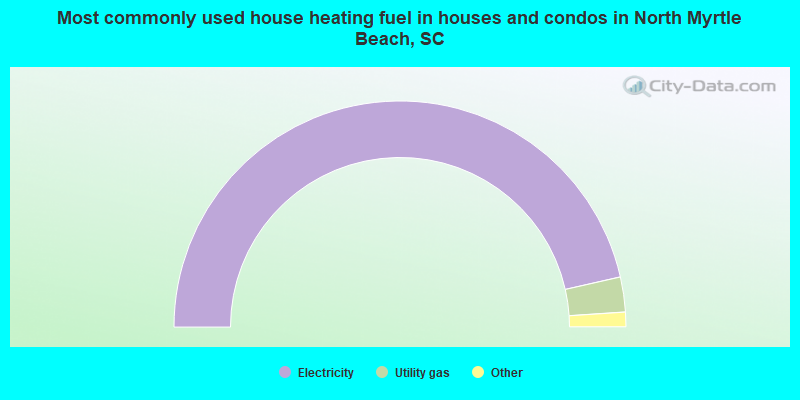
- 92.9%Electricity
- 5.0%Utility gas
- 1.8%Bottled, tank, or LP gas
- 0.3%No fuel used
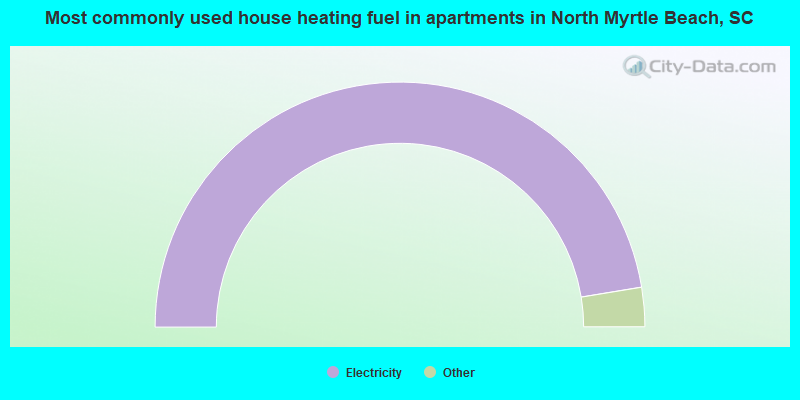
- 94.8%Electricity
- 3.2%Utility gas
- 0.8%Solar energy
- 0.6%Bottled, tank, or LP gas
- 0.6%Wood
North Myrtle Beach compared to South Carolina state average:
- Median house value above state average.
- Unemployed percentage significantly below state average.
- Black race population percentage significantly below state average.
- Hispanic race population percentage above state average.
- Median age significantly above state average.
- Foreign-born population percentage significantly above state average.
- Length of stay since moving in above state average.
- House age below state average.
- Percentage of population with a bachelor's degree or higher above state average.
North Myrtle Beach on our top lists:
- #16 on the list of "Top 101 cities with the most full-time financial administration workers per 1000 residents (population 5,000+)"
- #23 on the list of "Top 101 cities with largest percentage of males in occupations: food preparation and serving related occupations (population 5,000+)"
- #27 on the list of "Top 101 cities with the most full-time firefighters per 1000 residents (population 5,000+)"
- #29 on the list of "Top 101 cities with the most full-time park and recreation workers per 1000 residents (population 5,000+)"
- #36 on the list of "Top 101 cities with the highest number of police officers per 1000 residents (population 5,000+)"
- #38 on the list of "Top 101 cities with the highest number of burglaries per 100,000 residents, excludes tourist destinations and others with a lot of outsiders visiting based on city industries data (population 5,000+)"
- #39 on the list of "Top 101 cities with the highest number of thefts per 100,000 residents, excludes tourist destinations and others with a lot of outsiders visiting based on city industries data (population 5,000+)"
- #53 on the list of "Top 101 cities with largest percentage of males in industries: accommodation and food services (population 5,000+)"
- #56 on the list of "Top 101 cities with largest percentage of females in occupations: sales and related occupations (population 5,000+)"
- #56 on the list of "Top 100 cities with strongest arts, entertainment, recreation, accommodation and food services industries (pop. 5,000+)"
- #73 on the list of "Top 101 cities with the most people born in other U.S. states (population 5,000+)"
- #82 on the list of "Top 100 least-safe cities (highest city-data.com crime index) (pop. 5,000+)"
- #96 on the list of "Top 101 cities with largest percentage of females in industries: real estate and rental and leasing (population 5,000+)"
- #96 on the list of "Top 100 cities with oldest residents (pop. 5,000+)"
- #98 on the list of "Top 101 cities with the most local government spending on current operations of parks and recreation per resident (population 10,000+)"
- #2 on the list of "Top 101 counties with the highest percentage of residents that smoked 100+ cigarettes in their lives"
- #13 on the list of "Top 101 counties with the largest number of people moving in compared to moving out (pop. 50,000+)"
- #21 on the list of "Top 101 counties with the lowest percentage of residents that visited a dentist within the past year"
- #38 on the list of "Top 101 counties with the highest percentage of residents that drank alcohol in the past 30 days"
- #39 on the list of "Top 101 counties with the worst general health status score of residents (1-5), 3 years of data"

|
|
Total of 11 patent applications in 2008-2024.