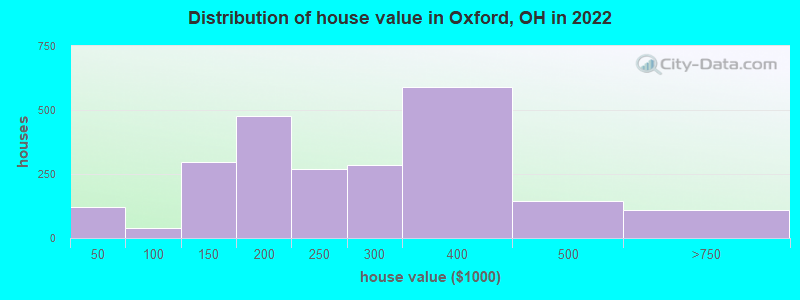
Estimated median house or condo value in 2022: $256,982 (it was $129,900 in 2000)
Oxford:
$256,982
OH:
$204,100
Mean prices in 2022:all housing units: $262,711; detached houses: $277,690; townhouses or other attached units: $192,205; in 2-unit structures: $165,872; in 3-to-4-unit structures: $168,139; in 5-or-more-unit structures: $132,222; mobile homes: $19,587
Median gross rent in 2022: $926.
March 2022 cost of living index in Oxford: 89.4 (less than average, U.S. average is 100)
Percentage of residents living in poverty in 2022: 46.3%
(43.4% for White Non-Hispanic residents, 48.0% for Black residents, 32.0% for Hispanic or Latino residents, 34.4% for other race residents, 59.2% for two or more races residents)
According to our research of Ohio and other state lists, there were 13 registered sex offenders living in Oxford, Ohio as of June 16, 2024. The ratio of all residents to sex offenders in Oxford is 1,705 to 1. The ratio of registered sex offenders to all residents in this city is much lower than the state average.
Crime rates in Oxford by year
Type
2009
2010
2011
2012
2013
2014
2015
2016
2017
2018
2019
2020
2021
2022
Murders (per 100,000)
0 (0.0)
0 (0.0)
0 (0.0)
0 (0.0)
0 (0.0)
0 (0.0)
1 (4.6)
1 (4.5)
0 (0.0)
0 (0.0)
0 (0.0)
0 (0.0)
0 (0.0)
0 (0.0)
Rapes (per 100,000)
14 (60.9)
11 (51.5)
13 (60.8)
11 (51.3)
3 (14.1)
12 (56.0)
4 (18.3)
11 (49.6)
7 (31.2)
15 (65.1)
9 (39.1)
2 (8.6)
4 (16.9)
1 (4.4)
Robberies (per 100,000)
5 (21.7)
9 (42.1)
5 (23.4)
2 (9.3)
9 (42.2)
5 (23.3)
7 (32.1)
7 (31.5)
4 (17.8)
2 (8.7)
3 (13.0)
5 (21.5)
3 (12.6)
5 (22.2)
Assaults (per 100,000)
57 (247.9)
60 (280.8)
63 (294.6)
50 (233.2)
35 (164.0)
40 (186.7)
58 (265.9)
20 (90.1)
5 (22.3)
8 (34.7)
12 (52.1)
22 (94.5)
21 (88.5)
4 (17.8)
Burglaries (per 100,000)
118 (513.2)
122 (570.9)
151 (706.0)
161 (750.8)
120 (562.4)
111 (518.1)
104 (476.7)
95 (428.0)
51 (227.1)
67 (290.8)
66 (286.4)
67 (287.8)
47 (198.0)
36 (159.9)
Thefts (per 100,000)
459 (1,996)
438 (2,050)
425 (1,987)
457 (2,131)
445 (2,085)
346 (1,615)
361 (1,655)
337 (1,518)
249 (1,109)
409 (1,775)
265 (1,150)
307 (1,319)
232 (977.6)
121 (537.3)
Auto thefts (per 100,000)
24 (104.4)
16 (74.9)
17 (79.5)
8 (37.3)
13 (60.9)
12 (56.0)
9 (41.3)
13 (58.6)
6 (26.7)
17 (73.8)
19 (82.4)
18 (77.3)
18 (75.8)
4 (17.8)
Arson (per 100,000)
6 (26.1)
9 (42.1)
7 (32.7)
13 (60.6)
7 (32.8)
1 (4.7)
0 (0.0)
2 (9.0)
1 (4.5)
5 (21.7)
3 (13.0)
2 (8.6)
0 (0.0)
0 (0.0)
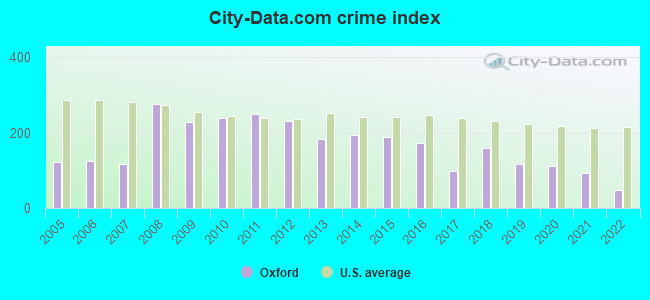
City-Data.com crime index
228.9
237.9
249.8
231.3
184.4
194.5
189.5
171.5
97.1
158.9
118.2
111.3
94.0
47.9
The City-Data.com crime index weighs serious crimes and violent crimes more heavily. Higher means more crime, U.S. average is 246.1. It adjusts for the number of visitors and daily workers commuting into cities.
Latest news from Oxford, OH collected exclusively by city-data.com from local newspapers, TV, and radio stations
Ancestries: German (9.0%), English (3.8%), European (3.5%), American (2.4%), Irish (1.7%), Italian (1.5%).
Current Local Time: EST time zone
Incorporated in 1960
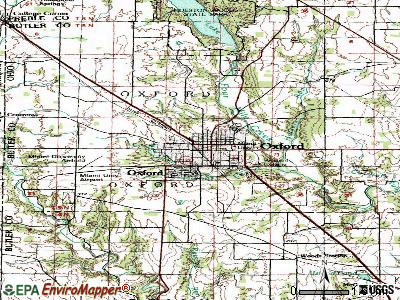
Elevation: 972 feet
Land area: 5.88 square miles.
Population density: 3,343 people per square mile (average).
3,052 residents are foreign born (11.5% Asia).
This city:
13.8%
Ohio:
4.9%
Median real estate property taxes paid for housing units with mortgages in 2022: $2,602 (0.9%) Median real estate property taxes paid for housing units with no mortgage in 2022: $2,521 (1.2%)
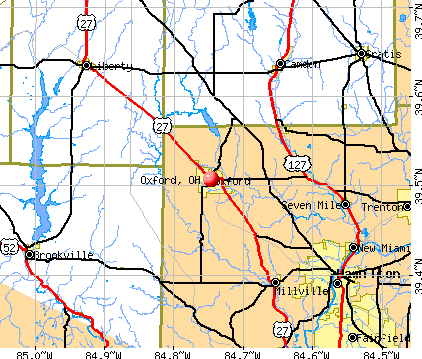
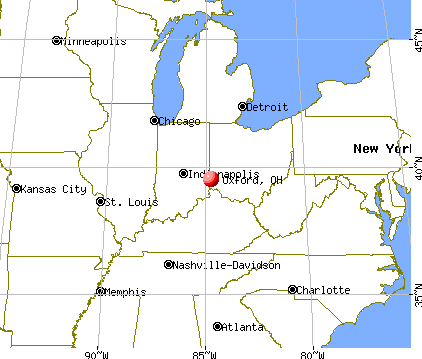
Nearest city with pop. 50,000+: Hamilton, OH (12.4 miles , pop. 60,690).
Nearest city with pop. 200,000+: Cincinnati, OH (28.8 miles , pop. 331,285).
Nearest city with pop. 1,000,000+: Chicago, IL (222.9 miles , pop. 2,896,016).
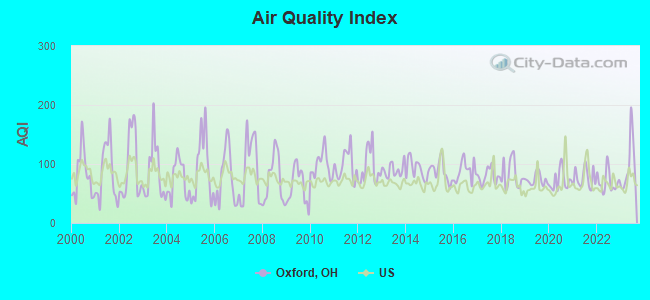
Air Quality Index (AQI) level in 2023 was 98.9. This is worse than average.
City:
98.9
U.S.:
72.6
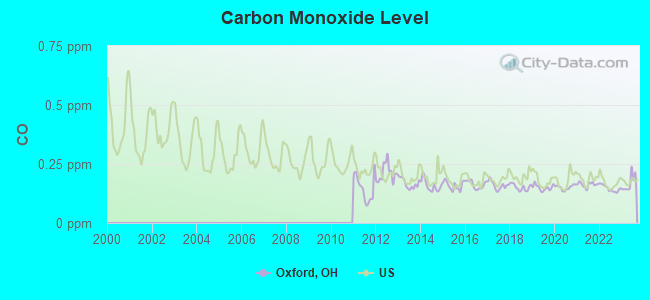
Carbon Monoxide (CO) [ppm] level in 2023 was 0.169. This is significantly better than average.Closest monitor was 20.5 miles away from the city center.
City:
0.169
U.S.:
0.251
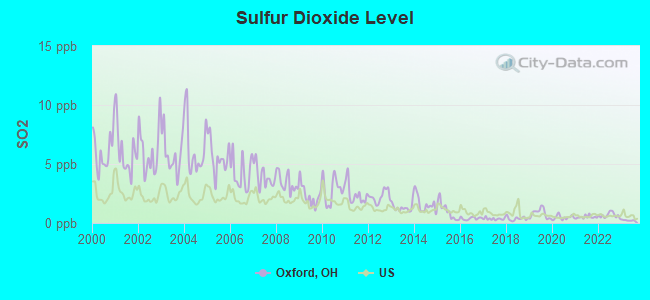
Sulfur Dioxide (SO2) [ppb] level in 2023 was 0.221. This is significantly better than average.Closest monitor was 0.4 miles away from the city center.
City:
0.221
U.S.:
1.515
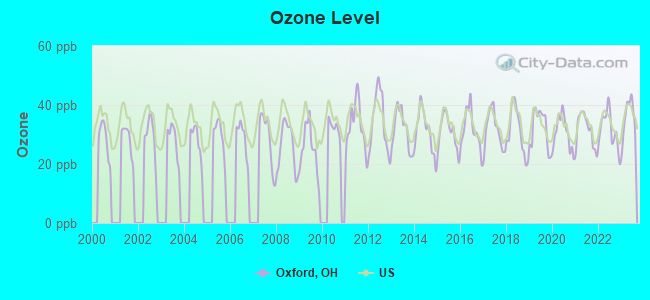
Ozone [ppb] level in 2023 was 35.5. This is about average.Closest monitor was 2.0 miles away from the city center.
City:
35.5
U.S.:
33.3
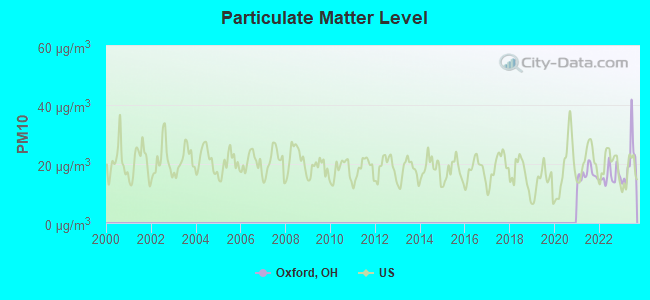
Particulate Matter (PM10) [µg/m3] level in 2023 was 21.0. This is about average.Closest monitor was 18.6 miles away from the city center.
City:
21.0
U.S.:
19.2
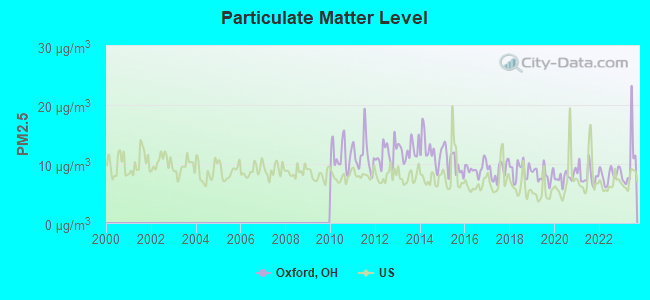
Particulate Matter (PM2.5) [µg/m3] level in 2023 was 10.2. This is worse than average.Closest monitor was 15.1 miles away from the city center.
City:
10.2
U.S.:
8.1
Tornado activity:
Oxford-area historical tornado activity is above Ohio state average. It is 87% greater than the overall U.S. average.
On 4/3/1974, a category F5 (max. wind speeds 261-318 mph) tornado 20.8 miles away from the Oxford city center killed 3 peopleand injured 210 people.
On 4/25/1961, a category F4 (max. wind speeds 207-260 mph) tornado 18.1 miles away from the city center injured 7 peopleand causedbetween $500,000 and $5,000,000 in damages.
Earthquake activity:
Oxford-area historical earthquake activity is significantly above Ohio state average. It is 46% greater than the overall U.S. average.
On 7/27/1980 at 18:52:21, a magnitude 5.2 (5.1 MB, 4.7 MS, 5.0 UK, 5.2 UK, Class: Moderate, Intensity: VI - VII) earthquake occurred 99.9 miles away from the city center On 4/18/2008 at 09:36:59, a magnitude 5.4 (5.1 MB, 4.8 MS, 5.4 MW, 5.2 MW) earthquake occurred 183.9 miles away from the city center On 4/18/2008 at 09:36:59, a magnitude 5.2 (5.2 MW, Depth: 8.9 mi) earthquake occurred 183.9 miles away from Oxford center On 6/10/1987 at 23:48:54, a magnitude 5.1 (4.9 MB, 4.4 MS, 4.6 MS, 5.1 LG) earthquake occurred 174.9 miles away from the city center On 7/12/1986 at 08:19:37, a magnitude 4.5 (4.5 MB, Class: Light, Intensity: IV - V) earthquake occurred 73.9 miles away from the city center On 9/7/1988 at 02:28:09, a magnitude 4.6 (4.5 MB, 4.6 LG) earthquake occurred 105.3 miles away from the city center Magnitude types: regional Lg-wave magnitude (LG), body-wave magnitude (MB), surface-wave magnitude (MS), moment magnitude (MW)
Natural disasters:
The number of natural disasters in Butler County (11) is smaller than the US average (15). Major Disasters (Presidential) Declared: 7 Emergencies Declared: 3
Causes of natural disasters: Floods: 5, Storms: 4, Tornadoes: 2, Blizzard: 1, Heavy Rain: 1, Hurricane: 1, Snow: 1, Snowstorm: 1, Tropical Depression: 1, Wind: 1, Other: 1 (Note: some incidents may be assigned to more than one category).
Hospitals and medical centers in Oxford:
MCCULLOUGH-HYDE MEMORIAL HOSPITAL (Voluntary non-profit - Private, provides emergency services, 110 NORTH POPLAR STREET)
KNOLLS OF OXFORD (6727 CONTRERAS ROAD)
LIBERTY NURSING CENTER OF OXFORD, LLC (6099 FAIRFIELD ROAD)
OXFORD VIEW NURSING CENTER (6099 FAIRFIELD RD)
FMC - OF TALAWANDA (5148 COLLEGE CORNER PIKE)
Airports and heliports located in Oxford:
Miami University Airport (OXD) (Runways: 1, Air Taxi Ops: 100, Itinerant Ops: 2,160, Local Ops: 14,438, Military Ops: 10)
13 miles: HAMILTON (M. L. KING BLVD AT HENRY ST.) . Services: public payphones, free short-term parking, call for taxi service, public transit connection.
Notable locations in Oxford: Oxford Country Club (A), Beta Bell Tower (B), Millett Assembly Hall (C), Billings Natatorium (D), Limper Museum (E), Edgar W King Library (F), McGuffey Museum (G), Hefner Museum (H), City of Oxford Fire Department (I), Oxford Municipal Building (J), Hall Auditorium (K), Withrow Court (L), Wilson Hall (M), Williams Hall (N), Wells Hall (O), Warfield Hall (P), Tappan Hall (Q), Swing Hall (R), Stoddard Hall (S), Sawyer Gymnasium (T). Display/hide their locations on the map
Churches in Oxford include: Vineyard Christian Fellowship Church (A), Saint Marys Catholic Church (B), Oxford United Methodist Church (C), Oxford Presbyterian Church (D), Oxford Church of Christ (E), Holy Trinity Episcopal Church (F), First Baptist Church (G), Bethel African Methodist Episcopal Church (H), Sesquicentennial Chapel (I). Display/hide their locations on the map
Parks in Oxford include: Doctor Martin Luther King Junior Park (1), Oxford Memorial Park (2), Bunger Field (3), Conrad Formal Gardens (4), Peffer Park (5), Ditmer Field (6), Inoles Park (7), Artz Park (8), Cook Field (9). Display/hide their locations on the map
Hotels: Amerihost Inn & Suites (5190 College Corner Pike), Amerihost Inn & Suites Oxford (5190 College Corner Pike), Alexander House (22 North College Avenue), Hampton Inn Oxford (5056 College Corner Pike), Governor's Room (22 North College Avenue), Best Western Sycamore Inn (6 East Sycamore Street), Holiday Inn Miami Univ (75 South Main Street).
Birthplace of: Caroline Harrison - Politician, David J. Eicher - Magazine editor, Earle Foxe - Actor, Tirrel Burton - Player of and football, G. V. Dorsey - Ohio doctor, Erwin Hinckly Barbour - Geologist, Kevin Dudley - Football player, Whitney Myers - Swimmer.
Butler County has a predicted average indoor radon screening level greater than 4 pCi/L (pico curies per liter) - Highest Potential
Average household size:
This city:
2.4 people
Ohio:
2.4 people
Percentage of family households:
This city:
32.9%
Whole state:
65.0%
Percentage of households with unmarried partners:
This city:
4.5%
Whole state:
6.8%
Likely homosexual households (counted as self-reported same-sex unmarried-partner households)
Lesbian couples: 0.3% of all households
Gay men: 0.4% of all households
7,393 people in college/university student housing in 2010
74 people in nursing facilities/skilled-nursing facilities in 2010
7,571 people in college dormitories (includes college quarters off campus) in 2000
119 people in nursing homes in 2000
Arena or stadium:
John D. Millett Hall. Miami University.
Banks with branches in Oxford (2011 data):
Fifth Third Bank: Uptown Oxford Branch at 19 North Poplar Street, branch established on 2004/08/16; Oxford Branch at 455 Mcguffey Avenue, branch established on 1985/06/30. Info updated 2009/10/05: Bank assets: $114,540.4 mil, Deposits: $89,689.1 mil, headquarters in Cincinnati, OH, positive income, Commercial Lending Specialization, 1378 total offices, Holding Company: Fifth Third Bancorp
First Merchants Bank National Association: Oxford at 4 North College Avenue, branch established on 1998/01/05. Info updated 2012/02/13: Bank assets: $4,154.9 mil, Deposits: $3,154.7 mil, headquarters in Muncie, IN, positive income, Commercial Lending Specialization, 89 total offices, Holding Company: First Merchants Corporation
The Somerville National Bank: Oxford Branch at 5400 College Corner Pike, branch established on 1995/06/05. Info updated 2006/11/03: Bank assets: $162.0 mil, Deposits: $142.2 mil, headquarters in Somerville, OH, positive income, 6 total offices
JPMorgan Chase Bank, National Association: Oxford Branch at 20 West High Street, branch established on 1906/01/01. Info updated 2011/11/10: Bank assets: $1,811,678.0 mil, Deposits: $1,190,738.0 mil, headquarters in Columbus, OH, positive income, International Specialization, 5577 total offices, Holding Company: Jpmorgan Chase & Co.
LCNB National Bank: Oxford Branch at 30 West Park Place, branch established on 1974/05/29. Info updated 2010/06/02: Bank assets: $787.1 mil, Deposits: $664.9 mil, headquarters in Lebanon, OH, positive income, Commercial Lending Specialization, 26 total offices, Holding Company: Lcnb Corp.
Miami Savings Bank: Oxford Branch at 475 Mcguffey Avenue, branch established on 1999/08/23. Info updated 2012/01/04: Bank assets: $115.4 mil, Deposits: $101.0 mil, headquarters in Miamitown, OH, positive income, Commercial Lending Specialization, 3 total offices
U.S. Bank National Association: Oxford Branch at One Lynn Street, branch established on 1974/10/15. Info updated 2012/01/30: Bank assets: $330,470.8 mil, Deposits: $236,091.5 mil, headquarters in Cincinnati, OH, positive income, 3121 total offices, Holding Company: U.S. Bancorp
First Financial Bank, National Association: Stewart Square Branch at 335 South College Avenue, branch established on 2007/12/10. Info updated 2009/09/21: Bank assets: $6,663.4 mil, Deposits: $5,754.9 mil, headquarters in Hamilton, OH, positive income, Commercial Lending Specialization, 101 total offices, Holding Company: First Financial Bancorp
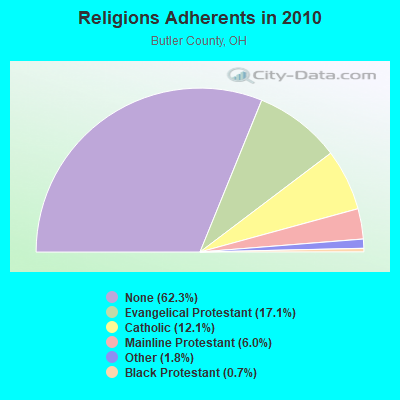
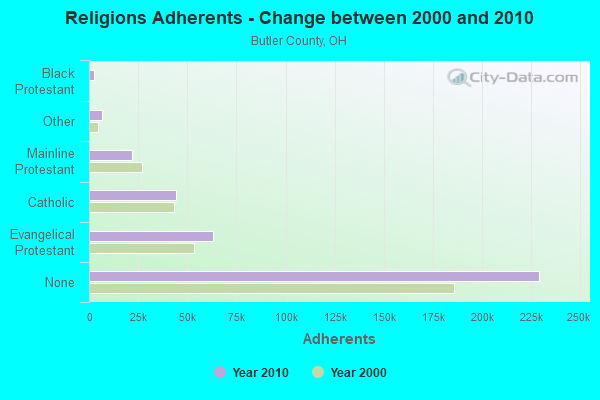
Religion statistics for Oxford, OH (based on Butler County data)
Religion
Adherents
Congregations
Evangelical Protestant
63,088
210
Catholic
44,417
13
Mainline Protestant
22,088
68
Other
6,647
28
Black Protestant
2,609
13
Orthodox
90
1
None
229,191
-
Source: Clifford Grammich, Kirk Hadaway, Richard Houseal, Dale E.Jones, Alexei Krindatch, Richie Stanley and Richard H.Taylor. 2012. 2010 U.S.Religion Census: Religious Congregations & Membership Study. Association of Statisticians of American Religious Bodies. Jones, Dale E., et al. 2002. Congregations and Membership in the United States 2000. Nashville, TN: Glenmary Research Center. Graphs represent county-level data
Aircraft: RHODENBAUGH TIMOTHY C PULSAR SERIES 1 (Category: Land, Seats: 2, Weight: Up to 12,499 Pounds), Engine: BOMBARDIER ROTAX (ALL) (Reciprocating) N-Number: 298TR, N298TR, N-298TR, Serial Number: 001, Year manufactured: 1998, Airworthiness Date: 04/27/1998, Certificate Issue Date: 08/13/1997 Registrant (Individual): Timothy C Rhodenbaugh, 170 Stone Creek Dr, Oxford, OH 45056
Aircraft: RHODENBAUGH TIM VELOCITY XL RG (Category: Land, Seats: 4, Weight: Up to 12,499 Pounds), Engine: CONT MOTOR IO-550 SERIES (300 HP) (Reciprocating) N-Number: 370TR, N370TR, N-370TR, Serial Number: 1, Year manufactured: 2005, Airworthiness Date: 08/05/2005, Certificate Issue Date: 06/08/2005 Registrant (Individual): Tim C Rhodenbaugh, 170 Stone Creek Dr, Oxford, OH 45056
Aircraft: RHODENBAUGH TIM AIRCAM (Category: Land, Engines: 2, Seats: 2, Weight: Up to 12,499 Pounds), Engine: ROTAX 912ULS SERIES (100 HP) (Reciprocating) N-Number: 515BL, N515BL, N-515BL, Serial Number: 003, Year manufactured: 2016, Airworthiness Date: 08/04/2016, Certificate Issue Date: 06/09/2016 Registrant (Individual): Tim Rhodenbaugh, 170 Stone Creek Dr, Oxford, OH 45056
Aircraft: CIRRUS DESIGN CORP SR22 (Category: Land, Seats: 4, Weight: Up to 12,499 Pounds), Engine: CONT MOTOR IO-550-N (310 HP) (Reciprocating) N-Number: 651CP, N651CP, N-651CP, Serial Number: 3670, Year manufactured: 2010, Airworthiness Date: 07/28/2010, Certificate Issue Date: 09/05/2019 Registrant (Individual): Rolf Brunckhorst, 146 Stone Creek Dr, Oxford, OH 45056
Aircraft: MOONEY M20J (Category: Land, Seats: 4, Weight: Up to 12,499 Pounds, Speed: 126 mph), Engine: Reciprocating N-Number: 5246A, N5246A, N-5246A, Serial Number: 24-3088, Certificate Issue Date: 06/27/2003 Registrant (Individual): William K Tilt, 5233 Booth Rd, Oxford, OH 45056 Deregistered:Cancel Date: 05/22/2017
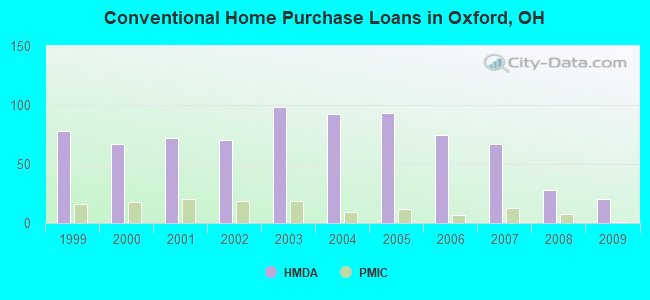
Home Mortgage Disclosure Act Aggregated Statistics For Year 2009 (Based on 4 partial tracts)
A) FHA, FSA/RHS & VA Home Purchase Loans
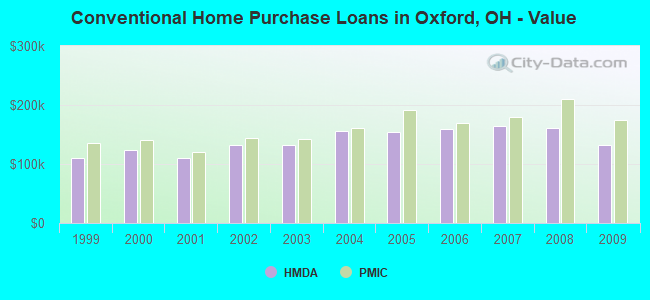
B) Conventional Home Purchase Loans
C) Refinancings
D) Home Improvement Loans
E) Loans on Dwellings For 5+ Families
F) Non-occupant Loans on < 5 Family Dwellings (A B C & D)
G) Loans On Manufactured Home Dwelling (A B C & D)
Number
Average Value
Number
Average Value
Number
Average Value
Number
Average Value
Number
Average Value
Number
Average Value
Number
Average Value
LOANS ORIGINATED
7
$134,180
20
$131,482
93
$167,738
1
$183,170
4
$805,345
22
$167,037
0
$0
APPLICATIONS APPROVED, NOT ACCEPTED
0
$0
2
$92,080
4
$170,285
0
$0
0
$0
0
$0
0
$0
APPLICATIONS DENIED
1
$103,170
5
$89,578
29
$222,733
3
$61,040
0
$0
11
$232,719
1
$49,360
APPLICATIONS WITHDRAWN
1
$31,550
2
$115,555
9
$182,607
0
$0
1
$508,900
3
$167,117
0
$0
FILES CLOSED FOR INCOMPLETENESS
0
$0
1
$30,530
2
$256,875
0
$0
0
$0
0
$0
0
$0
Aggregated Statistics For Year 2008 (Based on 1 full and 3 partial tracts)
A) FHA, FSA/RHS & VA Home Purchase Loans
B) Conventional Home Purchase Loans
C) Refinancings
D) Home Improvement Loans
E) Loans on Dwellings For 5+ Families
F) Non-occupant Loans on < 5 Family Dwellings (A B C & D)
G) Loans On Manufactured Home Dwelling (A B C & D)
Number
Average Value
Number
Average Value
Number
Average Value
Number
Average Value
Number
Average Value
Number
Average Value
Number
Average Value
LOANS ORIGINATED
8
$154,069
28
$160,812
64
$230,520
5
$47,642
4
$617,938
30
$278,784
0
$0
APPLICATIONS APPROVED, NOT ACCEPTED
1
$67,950
3
$159,803
5
$128,662
0
$0
0
$0
4
$133,498
0
$0
APPLICATIONS DENIED
0
$0
14
$204,318
31
$169,877
4
$74,780
0
$0
18
$210,066
1
$78,880
APPLICATIONS WITHDRAWN
0
$0
2
$186,640
11
$186,236
2
$231,210
0
$0
2
$246,090
0
$0
FILES CLOSED FOR INCOMPLETENESS
0
$0
1
$173,820
3
$222,917
0
$0
0
$0
0
$0
0
$0
Aggregated Statistics For Year 2007 (Based on 1 full and 3 partial tracts)
A) FHA, FSA/RHS & VA Home Purchase Loans
B) Conventional Home Purchase Loans
C) Refinancings
D) Home Improvement Loans
F) Non-occupant Loans on < 5 Family Dwellings (A B C & D)
G) Loans On Manufactured Home Dwelling (A B C & D)
Number
Average Value
Number
Average Value
Number
Average Value
Number
Average Value
Number
Average Value
Number
Average Value
LOANS ORIGINATED
1
$163,170
67
$163,688
62
$191,693
9
$187,949
57
$216,770
1
$112,120
APPLICATIONS APPROVED, NOT ACCEPTED
0
$0
9
$112,187
11
$216,435
1
$12,410
6
$176,108
0
$0
APPLICATIONS DENIED
0
$0
16
$120,293
20
$179,048
3
$87,323
8
$159,334
3
$22,127
APPLICATIONS WITHDRAWN
0
$0
5
$171,086
9
$194,479
1
$47,330
2
$157,990
0
$0
FILES CLOSED FOR INCOMPLETENESS
0
$0
1
$50,930
3
$193,493
1
$76,340
2
$206,330
0
$0
Aggregated Statistics For Year 2006 (Based on 1 full and 4 partial tracts)
A) FHA, FSA/RHS & VA Home Purchase Loans
B) Conventional Home Purchase Loans
C) Refinancings
D) Home Improvement Loans
E) Loans on Dwellings For 5+ Families
F) Non-occupant Loans on < 5 Family Dwellings (A B C & D)
G) Loans On Manufactured Home Dwelling (A B C & D)
Number
Average Value
Number
Average Value
Number
Average Value
Number
Average Value
Number
Average Value
Number
Average Value
Number
Average Value
LOANS ORIGINATED
3
$178,237
75
$159,502
56
$168,680
7
$157,474
3
$5,061,540
47
$200,677
1
$7,630
APPLICATIONS APPROVED, NOT ACCEPTED
0
$0
15
$147,612
14
$150,071
1
$35,670
0
$0
8
$152,295
0
$0
APPLICATIONS DENIED
0
$0
16
$175,380
24
$129,855
4
$19,845
0
$0
16
$170,024
1
$15,270
APPLICATIONS WITHDRAWN
0
$0
9
$164,368
18
$183,672
1
$25,450
0
$0
12
$218,708
0
$0
FILES CLOSED FOR INCOMPLETENESS
0
$0
2
$120,580
2
$260,420
1
$88,040
0
$0
1
$220,840
0
$0
Aggregated Statistics For Year 2005 (Based on 1 full and 4 partial tracts)
A) FHA, FSA/RHS & VA Home Purchase Loans
B) Conventional Home Purchase Loans
C) Refinancings
D) Home Improvement Loans
E) Loans on Dwellings For 5+ Families
F) Non-occupant Loans on < 5 Family Dwellings (A B C & D)
G) Loans On Manufactured Home Dwelling (A B C & D)
Number
Average Value
Number
Average Value
Number
Average Value
Number
Average Value
Number
Average Value
Number
Average Value
Number
Average Value
LOANS ORIGINATED
2
$139,520
93
$155,061
95
$194,622
8
$66,006
4
$414,498
73
$201,968
1
$26,970
APPLICATIONS APPROVED, NOT ACCEPTED
0
$0
11
$194,058
8
$123,809
2
$534,630
0
$0
4
$329,288
1
$33,130
APPLICATIONS DENIED
0
$0
13
$161,480
21
$182,476
3
$40,940
0
$0
11
$231,006
3
$21,543
APPLICATIONS WITHDRAWN
0
$0
9
$136,708
18
$162,093
2
$369,500
0
$0
8
$128,940
0
$0
FILES CLOSED FOR INCOMPLETENESS
0
$0
2
$95,290
2
$238,440
0
$0
0
$0
1
$34,610
0
$0
Aggregated Statistics For Year 2004 (Based on 1 full and 4 partial tracts)
A) FHA, FSA/RHS & VA Home Purchase Loans
B) Conventional Home Purchase Loans
C) Refinancings
D) Home Improvement Loans
E) Loans on Dwellings For 5+ Families
F) Non-occupant Loans on < 5 Family Dwellings (A B C & D)
G) Loans On Manufactured Home Dwelling (A B C & D)
Number
Average Value
Number
Average Value
Number
Average Value
Number
Average Value
Number
Average Value
Number
Average Value
Number
Average Value
LOANS ORIGINATED
1
$98,280
92
$155,264
95
$161,597
4
$33,800
4
$581,578
63
$185,776
1
$7,630
APPLICATIONS APPROVED, NOT ACCEPTED
0
$0
4
$128,273
12
$134,897
1
$22,860
0
$0
2
$149,850
1
$6,620
APPLICATIONS DENIED
0
$0
14
$191,307
15
$140,129
1
$109,660
0
$0
9
$209,737
2
$37,620
APPLICATIONS WITHDRAWN
0
$0
10
$145,844
23
$144,099
0
$0
0
$0
4
$219,358
0
$0
FILES CLOSED FOR INCOMPLETENESS
0
$0
2
$158,405
4
$109,948
1
$19,590
0
$0
2
$142,785
0
$0
Aggregated Statistics For Year 2003 (Based on 1 full and 4 partial tracts)
A) FHA, FSA/RHS & VA Home Purchase Loans
B) Conventional Home Purchase Loans
C) Refinancings
D) Home Improvement Loans
E) Loans on Dwellings For 5+ Families
F) Non-occupant Loans on < 5 Family Dwellings (A B C & D)
Number
Average Value
Number
Average Value
Number
Average Value
Number
Average Value
Number
Average Value
Number
Average Value
LOANS ORIGINATED
7
$124,579
98
$132,243
219
$130,207
5
$21,554
2
$684,420
79
$128,016
APPLICATIONS APPROVED, NOT ACCEPTED
0
$0
6
$158,773
18
$136,658
1
$6,860
0
$0
3
$150,070
APPLICATIONS DENIED
0
$0
10
$160,202
22
$117,513
1
$52,890
0
$0
4
$120,400
APPLICATIONS WITHDRAWN
0
$0
7
$153,691
22
$125,010
1
$19,150
0
$0
4
$139,108
FILES CLOSED FOR INCOMPLETENESS
0
$0
2
$85,900
10
$117,784
0
$0
0
$0
1
$56,480
Aggregated Statistics For Year 2002 (Based on 1 full and 4 partial tracts)
A) FHA, FSA/RHS & VA Home Purchase Loans
B) Conventional Home Purchase Loans
C) Refinancings
D) Home Improvement Loans
E) Loans on Dwellings For 5+ Families
F) Non-occupant Loans on < 5 Family Dwellings (A B C & D)
Number
Average Value
Number
Average Value
Number
Average Value
Number
Average Value
Number
Average Value
Number
Average Value
LOANS ORIGINATED
4
$121,375
70
$132,509
166
$126,309
4
$61,800
1
$680,800
46
$139,063
APPLICATIONS APPROVED, NOT ACCEPTED
0
$0
5
$102,618
24
$119,400
1
$8,350
0
$0
7
$130,544
APPLICATIONS DENIED
0
$0
5
$80,672
25
$134,892
4
$15,215
0
$0
4
$116,842
APPLICATIONS WITHDRAWN
0
$0
8
$92,560
15
$167,244
0
$0
0
$0
2
$247,960
FILES CLOSED FOR INCOMPLETENESS
0
$0
1
$201,750
5
$113,042
0
$0
0
$0
3
$125,953
Aggregated Statistics For Year 2001 (Based on 1 full and 4 partial tracts)
A) FHA, FSA/RHS & VA Home Purchase Loans
B) Conventional Home Purchase Loans
C) Refinancings
D) Home Improvement Loans
E) Loans on Dwellings For 5+ Families
F) Non-occupant Loans on < 5 Family Dwellings (A B C & D)
Number
Average Value
Number
Average Value
Number
Average Value
Number
Average Value
Number
Average Value
Number
Average Value
LOANS ORIGINATED
9
$114,706
72
$110,634
136
$138,041
11
$15,896
4
$656,870
55
$135,216
APPLICATIONS APPROVED, NOT ACCEPTED
0
$0
4
$129,838
19
$126,398
3
$31,817
0
$0
4
$90,655
APPLICATIONS DENIED
3
$119,287
15
$46,974
28
$143,107
6
$11,518
0
$0
4
$77,055
APPLICATIONS WITHDRAWN
0
$0
5
$103,730
27
$102,196
1
$47,570
0
$0
9
$104,989
FILES CLOSED FOR INCOMPLETENESS
0
$0
0
$0
8
$111,931
0
$0
0
$0
3
$95,133
Aggregated Statistics For Year 2000 (Based on 4 partial tracts)
A) FHA, FSA/RHS & VA Home Purchase Loans
B) Conventional Home Purchase Loans
C) Refinancings
D) Home Improvement Loans
E) Loans on Dwellings For 5+ Families
F) Non-occupant Loans on < 5 Family Dwellings (A B C & D)
Number
Average Value
Number
Average Value
Number
Average Value
Number
Average Value
Number
Average Value
Number
Average Value
LOANS ORIGINATED
4
$92,432
67
$124,192
37
$111,460
11
$12,175
2
$245,935
28
$119,780
APPLICATIONS APPROVED, NOT ACCEPTED
1
$53,510
8
$83,280
9
$115,056
2
$11,120
0
$0
4
$84,382
APPLICATIONS DENIED
1
$18,320
15
$95,889
20
$138,926
7
$14,204
0
$0
4
$349,315
APPLICATIONS WITHDRAWN
1
$48,850
2
$140,305
8
$124,126
3
$13,547
0
$0
1
$96,830
FILES CLOSED FOR INCOMPLETENESS
1
$75,600
0
$0
5
$105,176
0
$0
0
$0
0
$0
Aggregated Statistics For Year 1999 (Based on 1 full and 4 partial tracts)
A) FHA, FSA/RHS & VA Home Purchase Loans
B) Conventional Home Purchase Loans
C) Refinancings
D) Home Improvement Loans
E) Loans on Dwellings For 5+ Families
F) Non-occupant Loans on < 5 Family Dwellings (A B C & D)
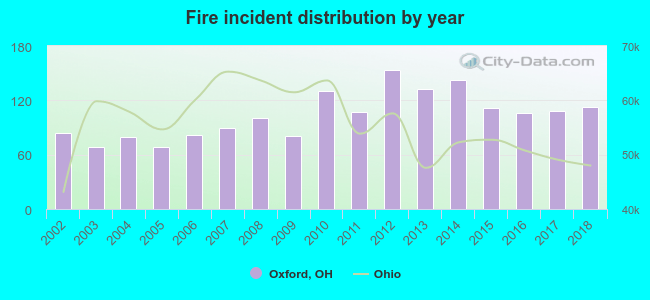
2002 - 2018 National Fire Incident Reporting System (NFIRS) incidents
Based on the data from the years 2002 - 2018 the average number of fire incidents per year is 104. The highest number of reported fire incidents - 154 took place in 2012, and the least - 68 in 2003. The data has a rising trend.
When looking into fire subcategories, the most reports belonged to: Structure Fires (55.1%), and Outside Fires (36.8%).
Fire incident types reported to NFIRS in Oxford, OH
#10 on the list of "Top 101 cities with the least people living the same house as 1 year ago (population 5,000+))"
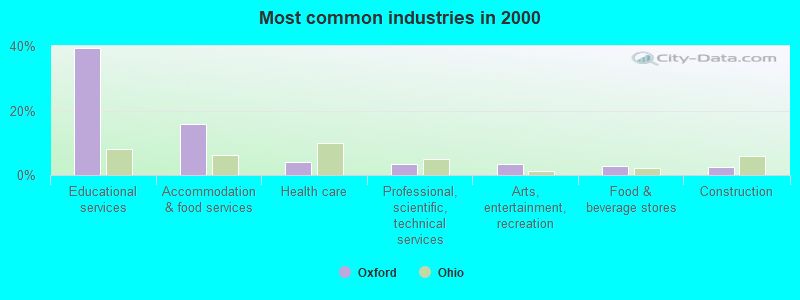
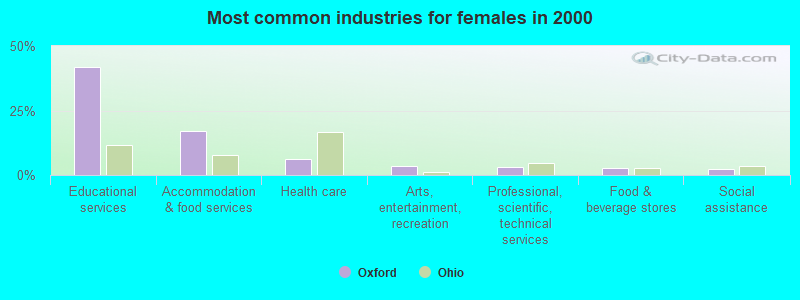
#11 on the list of "Top 101 cities with largest percentage of females in industries: educational services (population 5,000+)"
#18 on the list of "Top 101 cities with the lowest percentage of family households, population 10,000+"
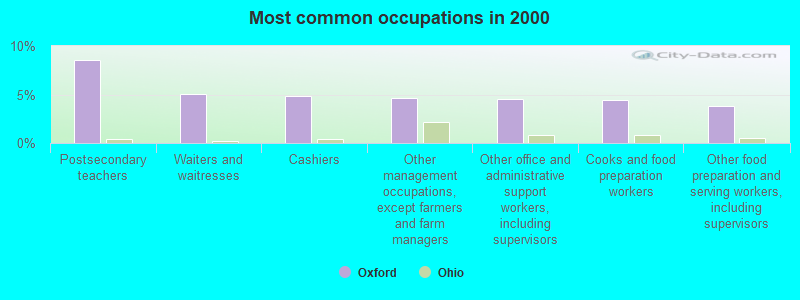
#26 on the list of "Top 101 cities with largest percentage of females in occupations: food preparation and serving related occupations (population 5,000+)"
#32 on the list of "Top 101 cities where the highest percentage of females (15+ years) which never married (with at least 1,000 females in this group)"
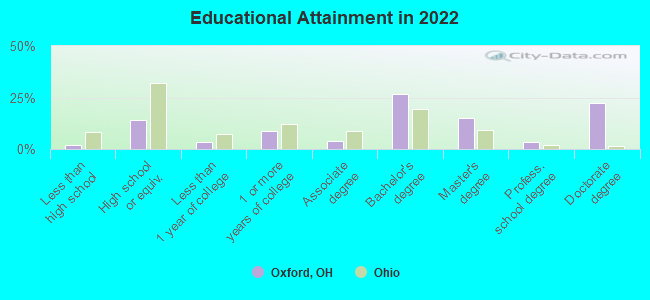
#33 on the list of "Top 101 cities with the most people having Doctorate degrees (population 500+)"
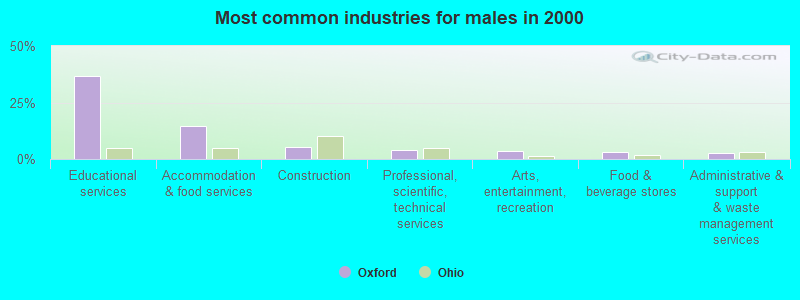
#34 on the list of "Top 101 cities with largest percentage of males in industries: educational services (population 5,000+)"
#37 on the list of "Top 101 cities with largest percentage of males in occupations: education, training, and library occupations (population 5,000+)"
#41 on the list of "Top 101 cities where the highest percentage of males (15+ years) which never married (with at least 1,000 males in this group)"
#44 on the list of "Top 101 cities with the lowest percentage of family households, population 1,000+"
#50 on the list of "Top 100 cities with youngest residents (pop. 5,000+)"
#54 on the list of "Top 101 cities with the largest household incomes disparities (population 5,000+)"
#63 on the list of "Top 101 cities with the largest percentage of people in college dormitories (includes college quarters off campus) (population 1,000+)"
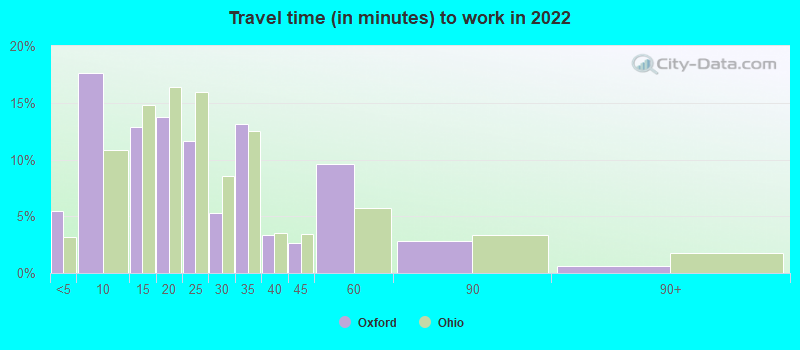
#70 on the list of "Top 101 cities with the most people walking to work (population 5,000+)"
#74 on the list of "Top 101 cities with the smallest percentage of divorced people (15+ years)(population 5,000+)"
#77 on the list of "Top 101 cities with largest percentage of males in occupations: life, physical, and social science occupations (population 5,000+)"
#93 on the list of "Top 101 cities with the most people having Master's or Doctorate degrees (population 5,000+)"
#94 on the list of "Top 101 cities with largest percentage of males in occupations: food preparation and serving related occupations (population 5,000+)"
#52 on the list of "Top 101 counties with the highest ground withdrawal of fresh water for public supply"
#56 on the list of "Top 101 counties with the highest Particulate Matter (PM2.5) Annual air pollution readings in 2012 (µg/m3)"
#60 on the list of "Top 101 counties with the highest number of infant deaths per 1000 residents 2007-2013 (pop. 50,000+)"
#92 on the list of "Top 101 counties with the largest decrease in the number of infant deaths per 1000 residents 2000-2006 to 2007-2013 (pop. 50,000+)"


 Recent articles from our blog. Our writers, many of them Ph.D. graduates or candidates, create easy-to-read articles on a wide variety of topics.

 (12.4 miles


 Based on the data from the years 2002 - 2018 the average number of fire incidents per year is 104. The highest number of reported fire incidents - 154 took place in 2012, and the least - 68 in 2003. The data has a rising trend.
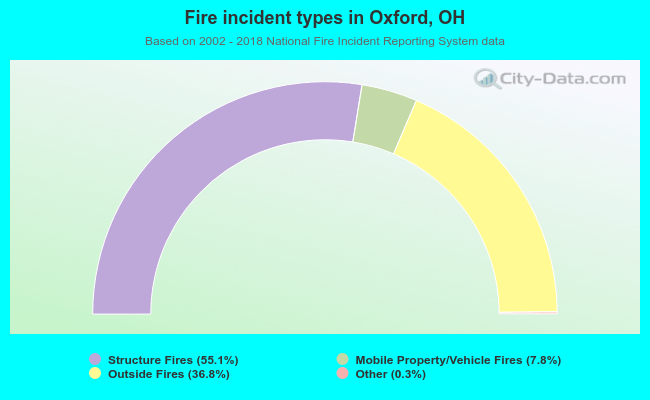 When looking into fire subcategories, the most reports belonged to: Structure Fires (55.1%), and Outside Fires (36.8%).