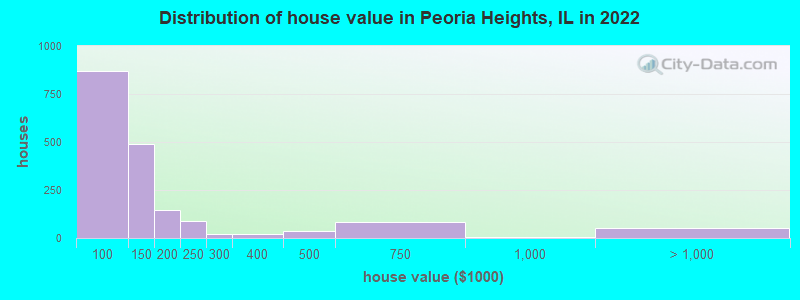
Estimated median house or condo value in 2022: $109,081 (it was $61,300 in 2000)
Peoria Heights:
$109,081
IL:
$251,600
Mean prices in 2022:all housing units: $187,509; detached houses: $192,152; townhouses or other attached units: $199,307; in 2-unit structures: $161,585; in 3-to-4-unit structures: $170,689; in 5-or-more-unit structures: $132,541; mobile homes: $38,650
Median gross rent in 2022: $883.
March 2022 cost of living index in Peoria Heights: 82.6 (low, U.S. average is 100)
Percentage of residents living in poverty in 2022: 12.1%
(10.4% for White Non-Hispanic residents, 20.8% for Black residents, 18.8% for Hispanic or Latino residents, 29.1% for two or more races residents)
According to our research of Illinois and other state lists, there were 5 registered sex offenders living in Peoria Heights, Illinois as of June 16, 2024. The ratio of all residents to sex offenders in Peoria Heights is 1,192 to 1. The ratio of registered sex offenders to all residents in this city is lower than the state average.
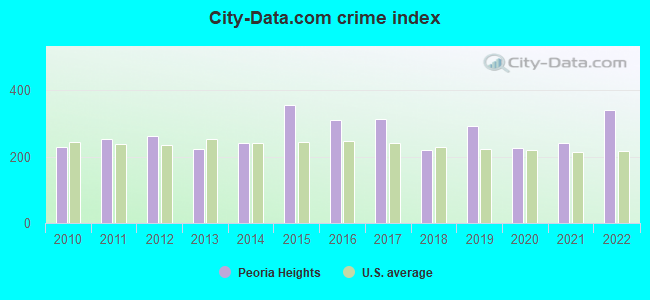
Crime rates in Peoria Heights by year
Type
2010
2011
2012
2013
2014
2015
2016
2017
2018
2019
2020
2021
2022
Murders (per 100,000)
0 (0.0)
0 (0.0)
1 (16.2)
0 (0.0)
0 (0.0)
0 (0.0)
1 (16.8)
1 (16.9)
0 (0.0)
0 (0.0)
0 (0.0)
0 (0.0)
0 (0.0)
Rapes (per 100,000)
1 (16.2)
0 (0.0)
1 (16.2)
3 (49.0)
4 (65.9)
10 (166.5)
6 (100.7)
4 (67.6)
7 (120.1)
11 (191.6)
6 (104.4)
2 (35.2)
6 (104.1)
Robberies (per 100,000)
4 (65.0)
5 (81.0)
2 (32.4)
2 (32.7)
3 (49.4)
4 (66.6)
1 (16.8)
5 (84.6)
0 (0.0)
2 (34.8)
2 (34.8)
3 (52.7)
4 (69.4)
Assaults (per 100,000)
21 (341.1)
25 (404.9)
14 (226.9)
19 (310.6)
16 (263.4)
19 (316.4)
22 (369.1)
14 (236.8)
11 (188.7)
17 (296.1)
21 (365.3)
27 (474.6)
30 (520.5)
Burglaries (per 100,000)
38 (617.3)
38 (615.4)
50 (810.4)
33 (539.5)
31 (510.4)
48 (799.2)
27 (453.0)
35 (591.9)
21 (360.3)
25 (435.4)
14 (243.6)
16 (281.2)
27 (468.4)
Thefts (per 100,000)
119 (1,933)
155 (2,510)
155 (2,512)
106 (1,733)
122 (2,009)
113 (1,881)
114 (1,913)
121 (2,046)
49 (840.8)
22 (383.1)
36 (626.3)
98 (1,723)
109 (1,891)
Auto thefts (per 100,000)
7 (113.7)
3 (48.6)
3 (48.6)
3 (49.0)
3 (49.4)
7 (116.6)
8 (134.2)
23 (389.0)
20 (343.2)
18 (313.5)
12 (208.8)
10 (175.8)
18 (312.3)
Arson (per 100,000)
0 (0.0)
1 (16.2)
2 (32.4)
0 (0.0)
1 (16.5)
3 (50.0)
0 (0.0)
3 (50.7)
0 (0.0)
0 (0.0)
0 (0.0)
1 (17.6)
0 (0.0)
City-Data.com crime index
230.3
252.6
261.6
222.2
240.2
357.0
311.9
315.1
220.1
293.8
225.8
241.5
341.6
The City-Data.com crime index weighs serious crimes and violent crimes more heavily. Higher means more crime, U.S. average is 246.1. It adjusts for the number of visitors and daily workers commuting into cities.
Latest news from Peoria Heights, IL collected exclusively by city-data.com from local newspapers, TV, and radio stations
Ancestries: German (16.7%), American (14.0%), Irish (10.1%), English (8.5%), Dutch (6.6%), Croatian (5.3%).
Current Local Time: CST time zone
Incorporated on 11/10/1901
Elevation: 789 feet
Land area: 2.64 square miles.
Population density: 2,188 people per square mile (low).
227 residents are foreign born (1.0% Latin America, 0.9% Asia, 0.8% North America, 0.7% Europe).
This village:
3.9%
Illinois:
14.1%
Median real estate property taxes paid for housing units with mortgages in 2022: $2,136 (2.2%) Median real estate property taxes paid for housing units with no mortgage in 2022: $2,081 (1.6%)
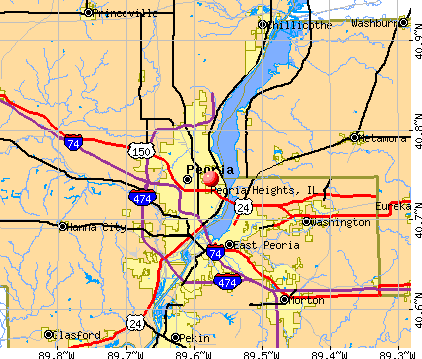
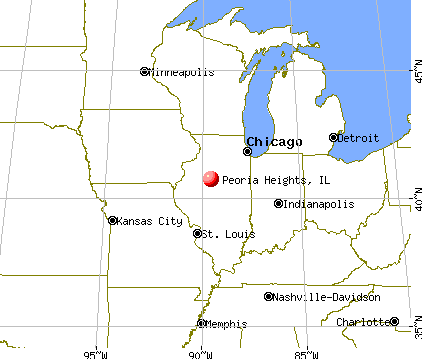
Nearest city with pop. 50,000+: Peoria, IL (2.5 miles , pop. 112,936).
Nearest city with pop. 200,000+: Chicago, IL (124.3 miles , pop. 2,896,016).
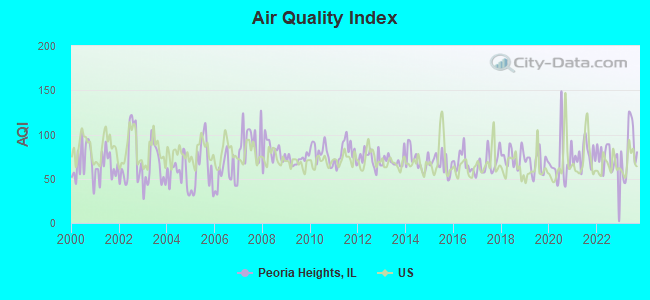
Air Quality Index (AQI) level in 2023 was 83.2. This is about average.
City:
83.2
U.S.:
72.6
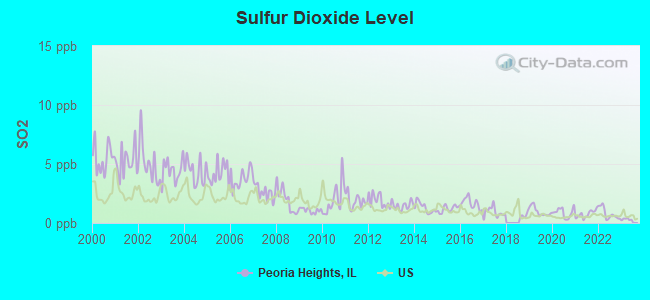
Sulfur Dioxide (SO2) [ppb] level in 2023 was 0.218. This is significantly better than average.Closest monitor was 1.9 miles away from the city center.
City:
0.218
U.S.:
1.515
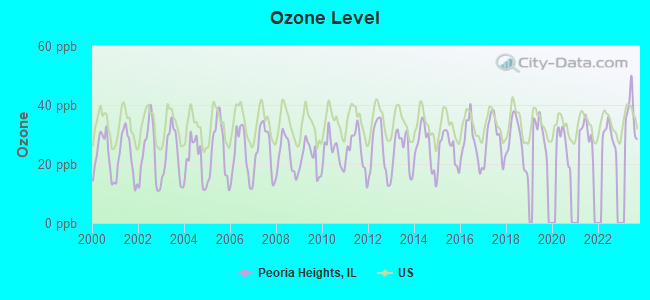
Ozone [ppb] level in 2023 was 36.9. This is about average.Closest monitor was 3.5 miles away from the city center.
City:
36.9
U.S.:
33.3
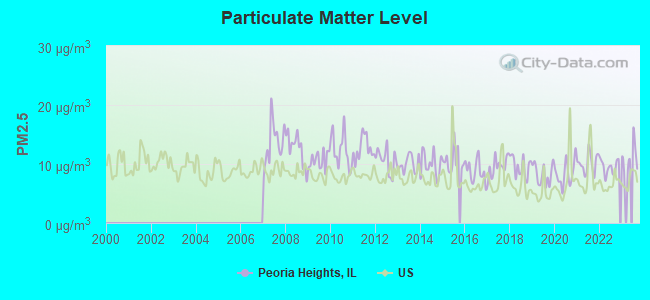
Particulate Matter (PM2.5) [µg/m3] level in 2023 was 11.1. This is worse than average.Closest monitor was 3.4 miles away from the city center.
City:
11.1
U.S.:
8.1
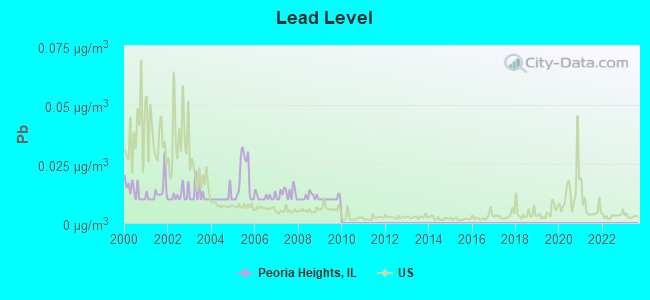
Lead (Pb) [µg/m3] level in 2009 was 0.0102. This is about average.Closest monitor was 3.3 miles away from the city center.
City:
0.0102
U.S.:
0.0093
Tornado activity:
Peoria Heights-area historical tornado activity is near Illinois state average. It is 86% greater than the overall U.S. average.
On 6/29/1976, a category F4 (max. wind speeds 207-260 mph) tornado 7.1 miles away from the Peoria Heights village center causedbetween $50,000 and $500,000 in damages.
On 7/13/2004, a category F4 tornado 13.4 miles away from the village center injured 3 people.
Earthquake activity:
Peoria Heights-area historical earthquake activity is significantly above Illinois state average. It is 129% greater than the overall U.S. average.
On 4/18/2008 at 09:36:59, a magnitude 5.4 (5.1 MB, 4.8 MS, 5.4 MW, 5.2 MW, Class: Moderate, Intensity: VI - VII) earthquake occurred 182.4 miles away from Peoria Heights center On 6/10/1987 at 23:48:54, a magnitude 5.1 (4.9 MB, 4.4 MS, 4.6 MS, 5.1 LG) earthquake occurred 160.6 miles away from the city center On 4/18/2008 at 09:36:59, a magnitude 5.2 (5.2 MW, Depth: 8.9 mi) earthquake occurred 182.4 miles away from Peoria Heights center On 6/18/2002 at 17:37:15, a magnitude 5.0 (4.3 MB, 4.6 MW, 5.0 LG) earthquake occurred 213.5 miles away from the city center On 4/18/2008 at 15:14:16, a magnitude 4.8 (4.5 MB, 4.8 MW, 4.6 MW, Class: Light, Intensity: IV - V) earthquake occurred 182.0 miles away from Peoria Heights center On 6/28/2004 at 06:10:52, a magnitude 4.2 (4.2 MW, Depth: 6.2 mi) earthquake occurred 60.7 miles away from Peoria Heights center Magnitude types: regional Lg-wave magnitude (LG), body-wave magnitude (MB), surface-wave magnitude (MS), moment magnitude (MW)
Natural disasters:
The number of natural disasters in Peoria County (14) is near the US average (15). Major Disasters (Presidential) Declared: 8 Emergencies Declared: 5
Causes of natural disasters: Storms: 8, Floods: 7, Snows: 2, Snowstorms: 2, Winter Storms: 2, Blizzard: 1, Hurricane: 1, Tornado: 1, Wind: 1, Other: 1 (Note: some incidents may be assigned to more than one category).
Hospitals and medical centers in Peoria Heights:
BELLA VISTA CARE CENTER (1629 GARDNER LANE)
HEIGHTS COLONIAL MANOR (1629 GARDNER LANE)
SAINT CLARE HOME (5533 NORTH GALENA ROAD)
Amtrak station near Peoria Heights:
8 miles: PEORIA AIRPORT (6100 W. EVERETT M. DIRKSEN PKY.) - Bus Station . Services: enclosed waiting area, public restrooms, public payphones, paid short-term parking, paid long-term parking, call for taxi service.
Colleges/universities with over 2000 students nearest to Peoria Heights:
Illinois Central College (about 4 miles; East Peoria, IL; Full-time enrollment: 7,158)
Bradley University (about 4 miles; Peoria, IL; FT enrollment: 5,152)
Heartland Community College (about 33 miles; Normal, IL; FT enrollment: 3,958)
Illinois State University (about 35 miles; Normal, IL; FT enrollment: 18,804)
Illinois Wesleyan University (about 36 miles; Bloomington, IL; FT enrollment: 2,323)
Illinois Valley Community College (about 47 miles; Oglesby, IL; FT enrollment: 2,747)
Western Illinois University (about 62 miles; Macomb, IL; FT enrollment: 10,755)
Notable locations in Peoria Heights: Peoria Country Club (A), Peoria Heights Village Hall (B), Peoria Heights Library (C), Peoria Heights Volunteer Fire Department Station 1 (D). Display/hide their locations on the map
Churches in Peoria Heights include: Galena Road Baptist Church (A), Olivet Missionary Church (B), Peoria Heights Congregational Church (C), Saint Thomas Church (D). Display/hide their locations on the map
Parks in Peoria Heights include: Bielfeldt Park (1), Woods Park (2), Illinois River State Fish and Wildlife Area (3), Forest Park South Nature Preserve (4), Forest Park Nature Center (5), Hillside Park (6), Woods Park (7). Display/hide their locations on the map
Peoria County has a predicted average indoor radon screening level greater than 4 pCi/L (pico curies per liter) - Highest Potential
Average household size:
This village:
2.1 people
Illinois:
2.6 people
Percentage of family households:
This village:
51.8%
Whole state:
65.8%
Percentage of households with unmarried partners:
This village:
9.3%
Whole state:
6.3%
Likely homosexual households (counted as self-reported same-sex unmarried-partner households)
Lesbian couples: 0.4% of all households
Gay men: 0.2% of all households
137 people in nursing facilities/skilled-nursing facilities in 2010
10 people in other noninstitutional facilities in 2010
92 people in homes or halfway houses for drug/alcohol abuse in 2000
2 people in religious group quarters in 2000
Banks with branches in Peoria Heights (2011 data):
Heritage Bank of Central Illinois: Prospect Branch at 4488 N Prospect Road, branch established on 1998/11/09. Info updated 2006/11/03: Bank assets: $314.6 mil, Deposits: $242.0 mil, headquarters in Trivoli, IL, positive income, Commercial Lending Specialization, 6 total offices, Holding Company: Trivoli Bancorp, Inc.
First State Bank of Forrest: Peoria Heights Branch at 4717 North Prospect Road, branch established on 1973/01/17. Info updated 2011/01/04: Bank assets: $124.4 mil, Deposits: $107.8 mil, headquarters in Forrest, IL, positive income, 5 total offices, Holding Company: Forrest Bancshares, Inc.
Marshall County State Bank: Peoria Heights Branch at 4440 North Prospect Suite A, branch established on 2010/08/09. Info updated 2006/11/03: Bank assets: $26.3 mil, Deposits: $22.4 mil, headquarters in Varna, IL, negative income in the last year, 2 total offices, Holding Company: Marshall-Putnam County Bancorporation, Inc.
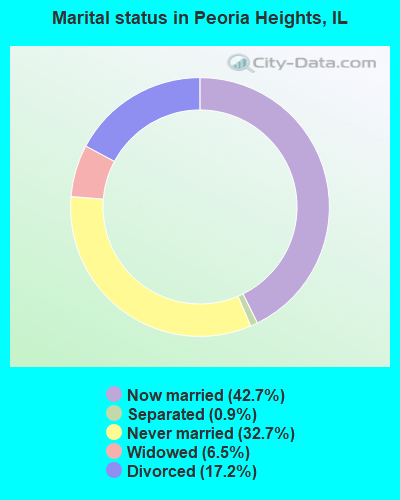
For population 15 years and over in Peoria Heights:
Never married: 32.7%
Now married: 42.7%
Separated: 0.9%
Widowed: 6.5%
Divorced: 17.2%
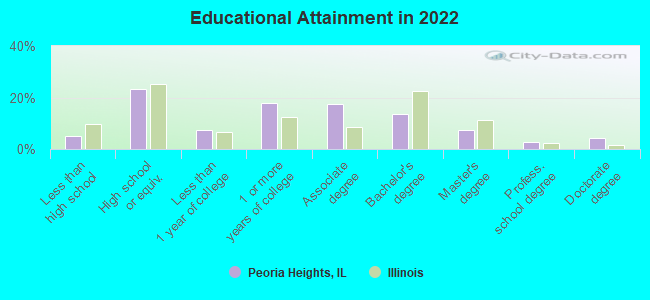
For population 25 years and over in Peoria Heights:
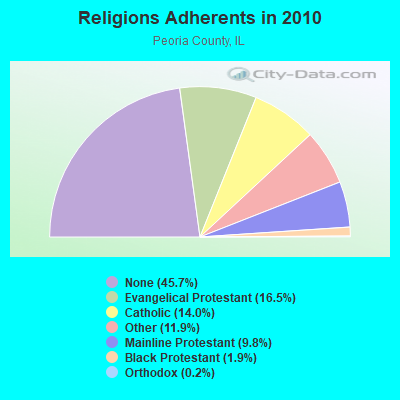
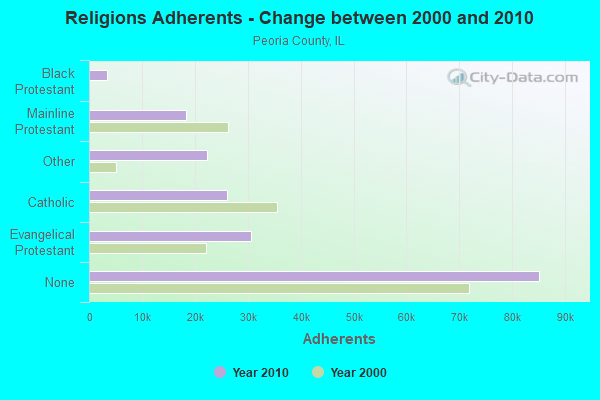
Religion statistics for Peoria Heights, IL (based on Peoria County data)
Religion
Adherents
Congregations
Evangelical Protestant
30,685
123
Catholic
26,165
20
Other
22,276
16
Mainline Protestant
18,343
56
Black Protestant
3,482
15
Orthodox
396
2
None
85,147
-
Source: Clifford Grammich, Kirk Hadaway, Richard Houseal, Dale E.Jones, Alexei Krindatch, Richie Stanley and Richard H.Taylor. 2012. 2010 U.S.Religion Census: Religious Congregations & Membership Study. Association of Statisticians of American Religious Bodies. Jones, Dale E., et al. 2002. Congregations and Membership in the United States 2000. Nashville, TN: Glenmary Research Center. Graphs represent county-level data
Aircraft: PIPER PA-23-150 (Category: Land, Engines: 2, Seats: 5, Weight: Up to 12,499 Pounds, Speed: 150 mph), Engine: LYCOMING 0-320 SERIES (180 HP) (Reciprocating) N-Number: 2090P, N2090P, N-2090P, Serial Number: 23-678, Year manufactured: 1956, Airworthiness Date: 08/15/1956, Certificate Issue Date: 01/09/2004 Registrant (Individual): Vernon W Martin, 4509 Constantine Ave, Peoria Heights, IL 61616
Aircraft: GULFSTREAM AM CORP COMM DIV 695A (Category: Land, Engines: 2, Seats: 11, Weight: Up to 12,499 Pounds), Engine: AIRESEARCH TPE331 SERIES (904 HP) (Turbo-prop) N-Number: 333UP, N333UP, N-333UP, Serial Number: 96015, Airworthiness Date: 06/18/1993, Certificate Issue Date: 12/04/2014 Registrant (LLC): Powers Aviation LLC, 1200 E Glen Ave, Peoria Heights, IL 61616
Aircraft: CESSNA 172E (Category: Land, Seats: 4, Weight: Up to 12,499 Pounds, Speed: 105 mph), Engine: CONT MOTOR 0-300 SER (145 HP) (Reciprocating) N-Number: 3897S, N3897S, N-3897S, Serial Number: 17251097, Year manufactured: 1964, Airworthiness Date: 01/03/1964, Certificate Issue Date: 02/06/2013 Registrant (Individual): Neil T Martin, 4509 N Constantine Ave, Peoria Heights, IL 61616
Aircraft: PIPER PA-23-160 (Category: Land, Engines: 2, Seats: 5, Weight: Up to 12,499 Pounds, Speed: 150 mph), Engine: LYCOMING 0-320 SERIES (180 HP) (Reciprocating) N-Number: 4373P, N4373P, N-4373P, Serial Number: 23-1874, Year manufactured: 1960, Airworthiness Date: 07/13/1993, Certificate Issue Date: 07/15/2015 Registrant (Individual): Vernon W Martin, 4509 Constantine Ave, Peoria Heights, IL 61616
Home Mortgage Disclosure Act Aggregated Statistics For Year 2009 (Based on 2 full and 1 partial tracts)
A) FHA, FSA/RHS & VA Home Purchase Loans
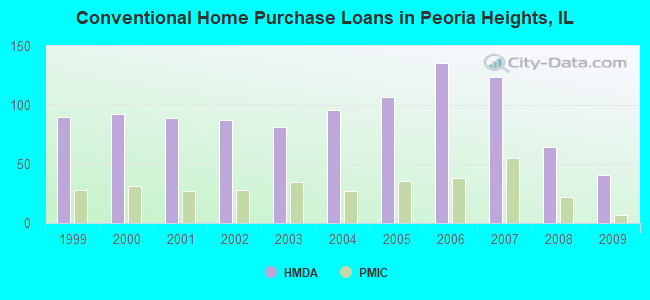
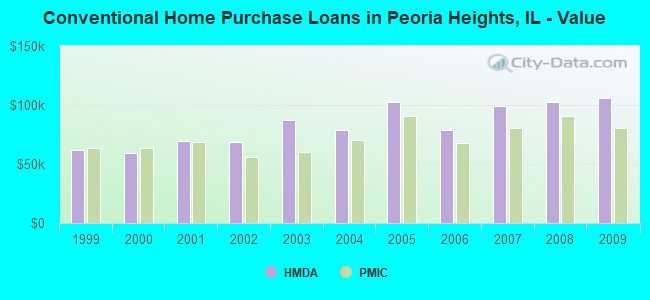
B) Conventional Home Purchase Loans
C) Refinancings
D) Home Improvement Loans
E) Loans on Dwellings For 5+ Families
F) Non-occupant Loans on < 5 Family Dwellings (A B C & D)
Number
Average Value
Number
Average Value
Number
Average Value
Number
Average Value
Number
Average Value
Number
Average Value
LOANS ORIGINATED
28
$82,946
41
$105,593
119
$135,424
19
$41,959
2
$3,922,350
36
$118,273
APPLICATIONS APPROVED, NOT ACCEPTED
2
$99,995
0
$0
9
$80,160
0
$0
0
$0
0
$0
APPLICATIONS DENIED
1
$41,400
2
$60,900
38
$103,834
11
$23,452
0
$0
2
$23,500
APPLICATIONS WITHDRAWN
2
$84,265
1
$63,860
26
$100,005
3
$25,917
0
$0
1
$106,600
FILES CLOSED FOR INCOMPLETENESS
1
$69,000
0
$0
2
$109,620
0
$0
0
$0
0
$0
Aggregated Statistics For Year 2008 (Based on 2 full and 1 partial tracts)
A) FHA, FSA/RHS & VA Home Purchase Loans
B) Conventional Home Purchase Loans
C) Refinancings
D) Home Improvement Loans
F) Non-occupant Loans on < 5 Family Dwellings (A B C & D)
Number
Average Value
Number
Average Value
Number
Average Value
Number
Average Value
Number
Average Value
LOANS ORIGINATED
50
$79,963
64
$102,216
89
$115,707
19
$57,386
33
$104,934
APPLICATIONS APPROVED, NOT ACCEPTED
1
$64,000
4
$63,640
8
$76,058
4
$20,412
2
$73,900
APPLICATIONS DENIED
4
$73,368
6
$97,313
45
$90,571
22
$49,580
3
$68,823
APPLICATIONS WITHDRAWN
2
$63,905
4
$176,760
21
$91,229
1
$45,800
2
$82,445
FILES CLOSED FOR INCOMPLETENESS
0
$0
1
$74,840
1
$137,170
0
$0
1
$69,850
Aggregated Statistics For Year 2007 (Based on 2 full and 1 partial tracts)
A) FHA, FSA/RHS & VA Home Purchase Loans
B) Conventional Home Purchase Loans
C) Refinancings
D) Home Improvement Loans
E) Loans on Dwellings For 5+ Families
F) Non-occupant Loans on < 5 Family Dwellings (A B C & D)
Number
Average Value
Number
Average Value
Number
Average Value
Number
Average Value
Number
Average Value
Number
Average Value
LOANS ORIGINATED
25
$88,141
124
$99,498
76
$88,527
29
$63,346
1
$160,000
40
$76,106
APPLICATIONS APPROVED, NOT ACCEPTED
1
$124,080
4
$126,360
18
$82,694
2
$22,720
0
$0
0
$0
APPLICATIONS DENIED
2
$67,350
17
$106,419
81
$78,772
34
$72,196
0
$0
8
$61,781
APPLICATIONS WITHDRAWN
0
$0
6
$123,498
29
$68,467
4
$60,605
0
$0
1
$35,870
FILES CLOSED FOR INCOMPLETENESS
0
$0
0
$0
6
$88,352
1
$28,960
0
$0
0
$0
Aggregated Statistics For Year 2006 (Based on 2 full and 1 partial tracts)
A) FHA, FSA/RHS & VA Home Purchase Loans
B) Conventional Home Purchase Loans
C) Refinancings
D) Home Improvement Loans
E) Loans on Dwellings For 5+ Families
F) Non-occupant Loans on < 5 Family Dwellings (A B C & D)
Number
Average Value
Number
Average Value
Number
Average Value
Number
Average Value
Number
Average Value
Number
Average Value
LOANS ORIGINATED
22
$77,533
136
$78,652
89
$74,090
33
$24,808
1
$251,450
37
$58,132
APPLICATIONS APPROVED, NOT ACCEPTED
2
$66,500
4
$149,478
7
$66,054
8
$29,694
0
$0
3
$58,567
APPLICATIONS DENIED
1
$66,850
25
$114,078
75
$82,232
21
$29,217
0
$0
6
$119,755
APPLICATIONS WITHDRAWN
1
$128,420
16
$144,040
43
$79,351
4
$32,200
0
$0
2
$31,960
FILES CLOSED FOR INCOMPLETENESS
0
$0
1
$69,570
6
$106,047
1
$54,880
0
$0
1
$33,930
Aggregated Statistics For Year 2005 (Based on 2 full and 1 partial tracts)
A) FHA, FSA/RHS & VA Home Purchase Loans
B) Conventional Home Purchase Loans
C) Refinancings
D) Home Improvement Loans
E) Loans on Dwellings For 5+ Families
F) Non-occupant Loans on < 5 Family Dwellings (A B C & D)
G) Loans On Manufactured Home Dwelling (A B C & D)
Number
Average Value
Number
Average Value
Number
Average Value
Number
Average Value
Number
Average Value
Number
Average Value
Number
Average Value
LOANS ORIGINATED
21
$73,745
107
$102,167
125
$73,076
28
$56,762
2
$580,000
41
$64,633
1
$8,080
APPLICATIONS APPROVED, NOT ACCEPTED
0
$0
8
$132,142
23
$78,486
4
$9,168
0
$0
0
$0
0
$0
APPLICATIONS DENIED
1
$74,840
21
$77,582
90
$80,482
29
$25,119
0
$0
6
$76,513
1
$76,610
APPLICATIONS WITHDRAWN
0
$0
9
$315,148
50
$94,870
5
$155,616
0
$0
2
$104,270
0
$0
FILES CLOSED FOR INCOMPLETENESS
0
$0
0
$0
12
$91,428
2
$73,340
0
$0
0
$0
0
$0
Aggregated Statistics For Year 2004 (Based on 2 full and 1 partial tracts)
A) FHA, FSA/RHS & VA Home Purchase Loans
B) Conventional Home Purchase Loans
C) Refinancings
D) Home Improvement Loans
E) Loans on Dwellings For 5+ Families
F) Non-occupant Loans on < 5 Family Dwellings (A B C & D)
G) Loans On Manufactured Home Dwelling (A B C & D)
Number
Average Value
Number
Average Value
Number
Average Value
Number
Average Value
Number
Average Value
Number
Average Value
Number
Average Value
LOANS ORIGINATED
26
$79,670
96
$78,914
147
$79,730
20
$25,230
3
$358,543
35
$43,750
0
$0
APPLICATIONS APPROVED, NOT ACCEPTED
3
$70,243
6
$118,310
21
$59,779
4
$58,262
0
$0
1
$158,650
0
$0
APPLICATIONS DENIED
1
$91,780
14
$46,160
90
$74,126
28
$33,159
1
$590,700
4
$52,242
1
$1,000
APPLICATIONS WITHDRAWN
0
$0
7
$139,130
54
$79,414
5
$31,738
0
$0
3
$59,537
0
$0
FILES CLOSED FOR INCOMPLETENESS
1
$85,810
1
$106,630
6
$77,290
1
$57,000
0
$0
0
$0
0
$0
Aggregated Statistics For Year 2003 (Based on 2 full and 1 partial tracts)
A) FHA, FSA/RHS & VA Home Purchase Loans
B) Conventional Home Purchase Loans
C) Refinancings
D) Home Improvement Loans
E) Loans on Dwellings For 5+ Families
F) Non-occupant Loans on < 5 Family Dwellings (A B C & D)
Number
Average Value
Number
Average Value
Number
Average Value
Number
Average Value
Number
Average Value
Number
Average Value
LOANS ORIGINATED
28
$68,048
81
$86,873
265
$80,777
33
$8,594
1
$1,077,620
45
$58,620
APPLICATIONS APPROVED, NOT ACCEPTED
1
$78,000
5
$346,912
38
$113,543
6
$9,533
0
$0
1
$26,000
APPLICATIONS DENIED
1
$63,000
8
$57,578
96
$68,223
14
$13,768
0
$0
6
$31,967
APPLICATIONS WITHDRAWN
1
$85,810
5
$64,138
63
$82,305
2
$32,955
0
$0
4
$43,902
FILES CLOSED FOR INCOMPLETENESS
0
$0
2
$58,870
9
$59,724
0
$0
0
$0
0
$0
Aggregated Statistics For Year 2002 (Based on 2 full and 1 partial tracts)
A) FHA, FSA/RHS & VA Home Purchase Loans
B) Conventional Home Purchase Loans
C) Refinancings
D) Home Improvement Loans
E) Loans on Dwellings For 5+ Families
F) Non-occupant Loans on < 5 Family Dwellings (A B C & D)
Number
Average Value
Number
Average Value
Number
Average Value
Number
Average Value
Number
Average Value
Number
Average Value
LOANS ORIGINATED
22
$64,260
87
$68,986
212
$83,367
38
$13,734
3
$654,890
47
$68,256
APPLICATIONS APPROVED, NOT ACCEPTED
1
$79,820
4
$210,288
17
$86,086
7
$14,266
0
$0
1
$28,940
APPLICATIONS DENIED
1
$84,520
9
$41,230
84
$71,781
27
$17,450
0
$0
2
$24,960
APPLICATIONS WITHDRAWN
0
$0
3
$51,060
44
$73,955
1
$11,300
0
$0
0
$0
FILES CLOSED FOR INCOMPLETENESS
0
$0
3
$55,870
7
$66,021
0
$0
0
$0
0
$0
Aggregated Statistics For Year 2001 (Based on 2 full and 1 partial tracts)
A) FHA, FSA/RHS & VA Home Purchase Loans
B) Conventional Home Purchase Loans
C) Refinancings
D) Home Improvement Loans
E) Loans on Dwellings For 5+ Families
F) Non-occupant Loans on < 5 Family Dwellings (A B C & D)
Number
Average Value
Number
Average Value
Number
Average Value
Number
Average Value
Number
Average Value
Number
Average Value
LOANS ORIGINATED
26
$56,810
89
$69,320
190
$68,644
52
$24,432
2
$1,218,315
34
$49,308
APPLICATIONS APPROVED, NOT ACCEPTED
0
$0
0
$0
28
$58,422
11
$16,321
0
$0
0
$0
APPLICATIONS DENIED
1
$71,010
11
$38,207
58
$58,455
31
$11,531
0
$0
1
$5,000
APPLICATIONS WITHDRAWN
0
$0
10
$92,865
34
$62,149
1
$32,630
0
$0
0
$0
FILES CLOSED FOR INCOMPLETENESS
1
$42,000
1
$47,890
3
$37,303
2
$9,810
0
$0
0
$0
Aggregated Statistics For Year 2000 (Based on 2 full and 1 partial tracts)
A) FHA, FSA/RHS & VA Home Purchase Loans
B) Conventional Home Purchase Loans
C) Refinancings
D) Home Improvement Loans
F) Non-occupant Loans on < 5 Family Dwellings (A B C & D)
Number
Average Value
Number
Average Value
Number
Average Value
Number
Average Value
Number
Average Value
LOANS ORIGINATED
31
$61,026
92
$59,549
80
$69,691
50
$18,820
18
$40,579
APPLICATIONS APPROVED, NOT ACCEPTED
0
$0
1
$96,440
22
$47,831
13
$14,460
1
$9,000
APPLICATIONS DENIED
1
$59,000
8
$42,086
62
$43,200
30
$10,623
1
$40,280
APPLICATIONS WITHDRAWN
0
$0
5
$71,826
41
$68,894
2
$28,070
2
$75,835
FILES CLOSED FOR INCOMPLETENESS
0
$0
2
$43,405
7
$59,909
0
$0
0
$0
Aggregated Statistics For Year 1999 (Based on 2 full and 1 partial tracts)
A) FHA, FSA/RHS & VA Home Purchase Loans
B) Conventional Home Purchase Loans
C) Refinancings
D) Home Improvement Loans
E) Loans on Dwellings For 5+ Families
F) Non-occupant Loans on < 5 Family Dwellings (A B C & D)
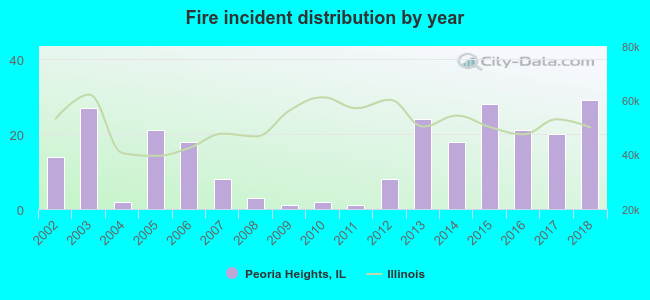
2002 - 2018 National Fire Incident Reporting System (NFIRS) incidents
Based on the data from the years 2002 - 2018 the average number of fires per year is 14. The highest number of fires - 29 took place in 2018, and the least - 1 in 2009. The data has an increasing trend.
When looking into fire subcategories, the most incidents belonged to: Structure Fires (46.5%), and Outside Fires (32.7%).
Fire incident types reported to NFIRS in Peoria Heights, IL


 Recent articles from our blog. Our writers, many of them Ph.D. graduates or candidates, create easy-to-read articles on a wide variety of topics.

 (2.5 miles


 Based on the data from the years 2002 - 2018 the average number of fires per year is 14. The highest number of fires - 29 took place in 2018, and the least - 1 in 2009. The data has an increasing trend.
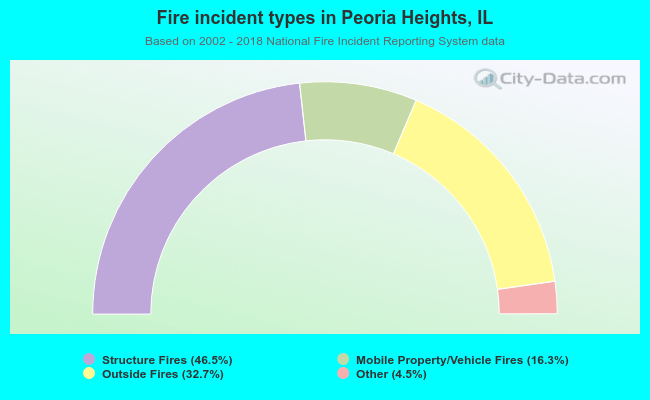 When looking into fire subcategories, the most incidents belonged to: Structure Fires (46.5%), and Outside Fires (32.7%).