Portage, Michigan Submit your own pictures of this city and show them to the world
OSM Map
General Map
Google Map
MSN Map
OSM Map
General Map
Google Map
MSN Map
OSM Map
General Map
Google Map
MSN Map
OSM Map
General Map
Google Map
MSN Map
Please wait while loading the map...
Population in 2022: 48,978 (99% urban, 1% rural). Population change since 2000: +9.1%Males: 23,820 Females: 25,158
March 2022 cost of living index in Portage: 82.8 (low, U.S. average is 100) Percentage of residents living in poverty in 2022: 7.8%for White Non-Hispanic residents , 30.0% for Black residents , 8.3% for Hispanic or Latino residents , 10.4% for other race residents , 9.1% for two or more races residents )
Profiles of local businesses
Business Search - 14 Million verified businesses
Data:
Median household income ($)
Median household income (% change since 2000)
Household income diversity
Ratio of average income to average house value (%)
Ratio of average income to average rent
Median household income ($) - White
Median household income ($) - Black or African American
Median household income ($) - Asian
Median household income ($) - Hispanic or Latino
Median household income ($) - American Indian and Alaska Native
Median household income ($) - Multirace
Median household income ($) - Other Race
Median household income for houses/condos with a mortgage ($)
Median household income for apartments without a mortgage ($)
Races - White alone (%)
Races - White alone (% change since 2000)
Races - Black alone (%)
Races - Black alone (% change since 2000)
Races - American Indian alone (%)
Races - American Indian alone (% change since 2000)
Races - Asian alone (%)
Races - Asian alone (% change since 2000)
Races - Hispanic (%)
Races - Hispanic (% change since 2000)
Races - Native Hawaiian and Other Pacific Islander alone (%)
Races - Native Hawaiian and Other Pacific Islander alone (% change since 2000)
Races - Two or more races (%)
Races - Two or more races (% change since 2000)
Races - Other race alone (%)
Races - Other race alone (% change since 2000)
Racial diversity
Unemployment (%)
Unemployment (% change since 2000)
Unemployment (%) - White
Unemployment (%) - Black or African American
Unemployment (%) - Asian
Unemployment (%) - Hispanic or Latino
Unemployment (%) - American Indian and Alaska Native
Unemployment (%) - Multirace
Unemployment (%) - Other Race
Population density (people per square mile)
Population - Males (%)
Population - Females (%)
Population - Males (%) - White
Population - Males (%) - Black or African American
Population - Males (%) - Asian
Population - Males (%) - Hispanic or Latino
Population - Males (%) - American Indian and Alaska Native
Population - Males (%) - Multirace
Population - Males (%) - Other Race
Population - Females (%) - White
Population - Females (%) - Black or African American
Population - Females (%) - Asian
Population - Females (%) - Hispanic or Latino
Population - Females (%) - American Indian and Alaska Native
Population - Females (%) - Multirace
Population - Females (%) - Other Race
Coronavirus confirmed cases (Jun 16, 2024)
Deaths caused by coronavirus (Jun 16, 2024)
Coronavirus confirmed cases (per 100k population) (Jun 16, 2024)
Deaths caused by coronavirus (per 100k population) (Jun 16, 2024)
Daily increase in number of cases (Jun 16, 2024)
Weekly increase in number of cases (Jun 16, 2024)
Cases doubled (in days) (Jun 16, 2024)
Hospitalized patients (Apr 18, 2022)
Negative test results (Apr 18, 2022)
Total test results (Apr 18, 2022)
COVID Vaccine doses distributed (per 100k population) (Sep 19, 2023)
COVID Vaccine doses administered (per 100k population) (Sep 19, 2023)
COVID Vaccine doses distributed (Sep 19, 2023)
COVID Vaccine doses administered (Sep 19, 2023)
Likely homosexual households (%)
Likely homosexual households (% change since 2000)
Likely homosexual households - Lesbian couples (%)
Likely homosexual households - Lesbian couples (% change since 2000)
Likely homosexual households - Gay men (%)
Likely homosexual households - Gay men (% change since 2000)
Cost of living index
Median gross rent ($)
Median contract rent ($)
Median monthly housing costs ($)
Median house or condo value ($)
Median house or condo value ($ change since 2000)
Mean house or condo value by units in structure - 1, detached ($)
Mean house or condo value by units in structure - 1, attached ($)
Mean house or condo value by units in structure - 2 ($)
Mean house or condo value by units in structure by units in structure - 3 or 4 ($)
Mean house or condo value by units in structure - 5 or more ($)
Mean house or condo value by units in structure - Boat, RV, van, etc. ($)
Mean house or condo value by units in structure - Mobile home ($)
Median house or condo value ($) - White
Median house or condo value ($) - Black or African American
Median house or condo value ($) - Asian
Median house or condo value ($) - Hispanic or Latino
Median house or condo value ($) - American Indian and Alaska Native
Median house or condo value ($) - Multirace
Median house or condo value ($) - Other Race
Median resident age
Resident age diversity
Median resident age - Males
Median resident age - Females
Median resident age - White
Median resident age - Black or African American
Median resident age - Asian
Median resident age - Hispanic or Latino
Median resident age - American Indian and Alaska Native
Median resident age - Multirace
Median resident age - Other Race
Median resident age - Males - White
Median resident age - Males - Black or African American
Median resident age - Males - Asian
Median resident age - Males - Hispanic or Latino
Median resident age - Males - American Indian and Alaska Native
Median resident age - Males - Multirace
Median resident age - Males - Other Race
Median resident age - Females - White
Median resident age - Females - Black or African American
Median resident age - Females - Asian
Median resident age - Females - Hispanic or Latino
Median resident age - Females - American Indian and Alaska Native
Median resident age - Females - Multirace
Median resident age - Females - Other Race
Commute - mean travel time to work (minutes)
Travel time to work - Less than 5 minutes (%)
Travel time to work - Less than 5 minutes (% change since 2000)
Travel time to work - 5 to 9 minutes (%)
Travel time to work - 5 to 9 minutes (% change since 2000)
Travel time to work - 10 to 19 minutes (%)
Travel time to work - 10 to 19 minutes (% change since 2000)
Travel time to work - 20 to 29 minutes (%)
Travel time to work - 20 to 29 minutes (% change since 2000)
Travel time to work - 30 to 39 minutes (%)
Travel time to work - 30 to 39 minutes (% change since 2000)
Travel time to work - 40 to 59 minutes (%)
Travel time to work - 40 to 59 minutes (% change since 2000)
Travel time to work - 60 to 89 minutes (%)
Travel time to work - 60 to 89 minutes (% change since 2000)
Travel time to work - 90 or more minutes (%)
Travel time to work - 90 or more minutes (% change since 2000)
Marital status - Never married (%)
Marital status - Now married (%)
Marital status - Separated (%)
Marital status - Widowed (%)
Marital status - Divorced (%)
Median family income ($)
Median family income (% change since 2000)
Median non-family income ($)
Median non-family income (% change since 2000)
Median per capita income ($)
Median per capita income (% change since 2000)
Median family income ($) - White
Median family income ($) - Black or African American
Median family income ($) - Asian
Median family income ($) - Hispanic or Latino
Median family income ($) - American Indian and Alaska Native
Median family income ($) - Multirace
Median family income ($) - Other Race
Median year house/condo built
Median year apartment built
Year house built - Built 2005 or later (%)
Year house built - Built 2000 to 2004 (%)
Year house built - Built 1990 to 1999 (%)
Year house built - Built 1980 to 1989 (%)
Year house built - Built 1970 to 1979 (%)
Year house built - Built 1960 to 1969 (%)
Year house built - Built 1950 to 1959 (%)
Year house built - Built 1940 to 1949 (%)
Year house built - Built 1939 or earlier (%)
Average household size
Household density (households per square mile)
Average household size - White
Average household size - Black or African American
Average household size - Asian
Average household size - Hispanic or Latino
Average household size - American Indian and Alaska Native
Average household size - Multirace
Average household size - Other Race
Occupied housing units (%)
Vacant housing units (%)
Owner occupied housing units (%)
Renter occupied housing units (%)
Vacancy status - For rent (%)
Vacancy status - For sale only (%)
Vacancy status - Rented or sold, not occupied (%)
Vacancy status - For seasonal, recreational, or occasional use (%)
Vacancy status - For migrant workers (%)
Vacancy status - Other vacant (%)
Residents with income below the poverty level (%)
Residents with income below 50% of the poverty level (%)
Children below poverty level (%)
Poor families by family type - Married-couple family (%)
Poor families by family type - Male, no wife present (%)
Poor families by family type - Female, no husband present (%)
Poverty status for native-born residents (%)
Poverty status for foreign-born residents (%)
Poverty among high school graduates not in families (%)
Poverty among people who did not graduate high school not in families (%)
Residents with income below the poverty level (%) - White
Residents with income below the poverty level (%) - Black or African American
Residents with income below the poverty level (%) - Asian
Residents with income below the poverty level (%) - Hispanic or Latino
Residents with income below the poverty level (%) - American Indian and Alaska Native
Residents with income below the poverty level (%) - Multirace
Residents with income below the poverty level (%) - Other Race
Air pollution - Air Quality Index (AQI)
Air pollution - CO
Air pollution - NO2
Air pollution - SO2
Air pollution - Ozone
Air pollution - PM10
Air pollution - PM25
Air pollution - Pb
Crime - Murders per 100,000 population
Crime - Rapes per 100,000 population
Crime - Robberies per 100,000 population
Crime - Assaults per 100,000 population
Crime - Burglaries per 100,000 population
Crime - Thefts per 100,000 population
Crime - Auto thefts per 100,000 population
Crime - Arson per 100,000 population
Crime - City-data.com crime index
Crime - Violent crime index
Crime - Property crime index
Crime - Murders per 100,000 population (5 year average)
Crime - Rapes per 100,000 population (5 year average)
Crime - Robberies per 100,000 population (5 year average)
Crime - Assaults per 100,000 population (5 year average)
Crime - Burglaries per 100,000 population (5 year average)
Crime - Thefts per 100,000 population (5 year average)
Crime - Auto thefts per 100,000 population (5 year average)
Crime - Arson per 100,000 population (5 year average)
Crime - City-data.com crime index (5 year average)
Crime - Violent crime index (5 year average)
Crime - Property crime index (5 year average)
1996 Presidential Elections Results (%) - Democratic Party (Clinton)
1996 Presidential Elections Results (%) - Republican Party (Dole)
1996 Presidential Elections Results (%) - Other
2000 Presidential Elections Results (%) - Democratic Party (Gore)
2000 Presidential Elections Results (%) - Republican Party (Bush)
2000 Presidential Elections Results (%) - Other
2004 Presidential Elections Results (%) - Democratic Party (Kerry)
2004 Presidential Elections Results (%) - Republican Party (Bush)
2004 Presidential Elections Results (%) - Other
2008 Presidential Elections Results (%) - Democratic Party (Obama)
2008 Presidential Elections Results (%) - Republican Party (McCain)
2008 Presidential Elections Results (%) - Other
2012 Presidential Elections Results (%) - Democratic Party (Obama)
2012 Presidential Elections Results (%) - Republican Party (Romney)
2012 Presidential Elections Results (%) - Other
2016 Presidential Elections Results (%) - Democratic Party (Clinton)
2016 Presidential Elections Results (%) - Republican Party (Trump)
2016 Presidential Elections Results (%) - Other
2020 Presidential Elections Results (%) - Democratic Party (Biden)
2020 Presidential Elections Results (%) - Republican Party (Trump)
2020 Presidential Elections Results (%) - Other
Ancestries Reported - Arab (%)
Ancestries Reported - Czech (%)
Ancestries Reported - Danish (%)
Ancestries Reported - Dutch (%)
Ancestries Reported - English (%)
Ancestries Reported - French (%)
Ancestries Reported - French Canadian (%)
Ancestries Reported - German (%)
Ancestries Reported - Greek (%)
Ancestries Reported - Hungarian (%)
Ancestries Reported - Irish (%)
Ancestries Reported - Italian (%)
Ancestries Reported - Lithuanian (%)
Ancestries Reported - Norwegian (%)
Ancestries Reported - Polish (%)
Ancestries Reported - Portuguese (%)
Ancestries Reported - Russian (%)
Ancestries Reported - Scotch-Irish (%)
Ancestries Reported - Scottish (%)
Ancestries Reported - Slovak (%)
Ancestries Reported - Subsaharan African (%)
Ancestries Reported - Swedish (%)
Ancestries Reported - Swiss (%)
Ancestries Reported - Ukrainian (%)
Ancestries Reported - United States (%)
Ancestries Reported - Welsh (%)
Ancestries Reported - West Indian (%)
Ancestries Reported - Other (%)
Educational Attainment - No schooling completed (%)
Educational Attainment - Less than high school (%)
Educational Attainment - High school or equivalent (%)
Educational Attainment - Less than 1 year of college (%)
Educational Attainment - 1 or more years of college (%)
Educational Attainment - Associate degree (%)
Educational Attainment - Bachelor's degree (%)
Educational Attainment - Master's degree (%)
Educational Attainment - Professional school degree (%)
Educational Attainment - Doctorate degree (%)
School Enrollment - Nursery, preschool (%)
School Enrollment - Kindergarten (%)
School Enrollment - Grade 1 to 4 (%)
School Enrollment - Grade 5 to 8 (%)
School Enrollment - Grade 9 to 12 (%)
School Enrollment - College undergrad (%)
School Enrollment - Graduate or professional (%)
School Enrollment - Not enrolled in school (%)
School enrollment - Public schools (%)
School enrollment - Private schools (%)
School enrollment - Not enrolled (%)
Median number of rooms in houses and condos
Median number of rooms in apartments
Housing units lacking complete plumbing facilities (%)
Housing units lacking complete kitchen facilities (%)
Density of houses
Urban houses (%)
Rural houses (%)
Households with people 60 years and over (%)
Households with people 65 years and over (%)
Households with people 75 years and over (%)
Households with one or more nonrelatives (%)
Households with no nonrelatives (%)
Population in households (%)
Family households (%)
Nonfamily households (%)
Population in families (%)
Family households with own children (%)
Median number of bedrooms in owner occupied houses
Mean number of bedrooms in owner occupied houses
Median number of bedrooms in renter occupied houses
Mean number of bedrooms in renter occupied houses
Median number of vehichles in owner occupied houses
Mean number of vehichles in owner occupied houses
Median number of vehichles in renter occupied houses
Mean number of vehichles in renter occupied houses
Mortgage status - with mortgage (%)
Mortgage status - with second mortgage (%)
Mortgage status - with home equity loan (%)
Mortgage status - with both second mortgage and home equity loan (%)
Mortgage status - without a mortgage (%)
Average family size
Average family size - White
Average family size - Black or African American
Average family size - Asian
Average family size - Hispanic or Latino
Average family size - American Indian and Alaska Native
Average family size - Multirace
Average family size - Other Race
Geographical mobility - Same house 1 year ago (%)
Geographical mobility - Moved within same county (%)
Geographical mobility - Moved from different county within same state (%)
Geographical mobility - Moved from different state (%)
Geographical mobility - Moved from abroad (%)
Place of birth - Born in state of residence (%)
Place of birth - Born in other state (%)
Place of birth - Native, outside of US (%)
Place of birth - Foreign born (%)
Housing units in structures - 1, detached (%)
Housing units in structures - 1, attached (%)
Housing units in structures - 2 (%)
Housing units in structures - 3 or 4 (%)
Housing units in structures - 5 to 9 (%)
Housing units in structures - 10 to 19 (%)
Housing units in structures - 20 to 49 (%)
Housing units in structures - 50 or more (%)
Housing units in structures - Mobile home (%)
Housing units in structures - Boat, RV, van, etc. (%)
House/condo owner moved in on average (years ago)
Renter moved in on average (years ago)
Year householder moved into unit - Moved in 1999 to March 2000 (%)
Year householder moved into unit - Moved in 1995 to 1998 (%)
Year householder moved into unit - Moved in 1990 to 1994 (%)
Year householder moved into unit - Moved in 1980 to 1989 (%)
Year householder moved into unit - Moved in 1970 to 1979 (%)
Year householder moved into unit - Moved in 1969 or earlier (%)
Means of transportation to work - Drove car alone (%)
Means of transportation to work - Carpooled (%)
Means of transportation to work - Public transportation (%)
Means of transportation to work - Bus or trolley bus (%)
Means of transportation to work - Streetcar or trolley car (%)
Means of transportation to work - Subway or elevated (%)
Means of transportation to work - Railroad (%)
Means of transportation to work - Ferryboat (%)
Means of transportation to work - Taxicab (%)
Means of transportation to work - Motorcycle (%)
Means of transportation to work - Bicycle (%)
Means of transportation to work - Walked (%)
Means of transportation to work - Other means (%)
Working at home (%)
Industry diversity
Most Common Industries - Agriculture, forestry, fishing and hunting, and mining (%)
Most Common Industries - Agriculture, forestry, fishing and hunting (%)
Most Common Industries - Mining, quarrying, and oil and gas extraction (%)
Most Common Industries - Construction (%)
Most Common Industries - Manufacturing (%)
Most Common Industries - Wholesale trade (%)
Most Common Industries - Retail trade (%)
Most Common Industries - Transportation and warehousing, and utilities (%)
Most Common Industries - Transportation and warehousing (%)
Most Common Industries - Utilities (%)
Most Common Industries - Information (%)
Most Common Industries - Finance and insurance, and real estate and rental and leasing (%)
Most Common Industries - Finance and insurance (%)
Most Common Industries - Real estate and rental and leasing (%)
Most Common Industries - Professional, scientific, and management, and administrative and waste management services (%)
Most Common Industries - Professional, scientific, and technical services (%)
Most Common Industries - Management of companies and enterprises (%)
Most Common Industries - Administrative and support and waste management services (%)
Most Common Industries - Educational services, and health care and social assistance (%)
Most Common Industries - Educational services (%)
Most Common Industries - Health care and social assistance (%)
Most Common Industries - Arts, entertainment, and recreation, and accommodation and food services (%)
Most Common Industries - Arts, entertainment, and recreation (%)
Most Common Industries - Accommodation and food services (%)
Most Common Industries - Other services, except public administration (%)
Most Common Industries - Public administration (%)
Occupation diversity
Most Common Occupations - Management, business, science, and arts occupations (%)
Most Common Occupations - Management, business, and financial occupations (%)
Most Common Occupations - Management occupations (%)
Most Common Occupations - Business and financial operations occupations (%)
Most Common Occupations - Computer, engineering, and science occupations (%)
Most Common Occupations - Computer and mathematical occupations (%)
Most Common Occupations - Architecture and engineering occupations (%)
Most Common Occupations - Life, physical, and social science occupations (%)
Most Common Occupations - Education, legal, community service, arts, and media occupations (%)
Most Common Occupations - Community and social service occupations (%)
Most Common Occupations - Legal occupations (%)
Most Common Occupations - Education, training, and library occupations (%)
Most Common Occupations - Arts, design, entertainment, sports, and media occupations (%)
Most Common Occupations - Healthcare practitioners and technical occupations (%)
Most Common Occupations - Health diagnosing and treating practitioners and other technical occupations (%)
Most Common Occupations - Health technologists and technicians (%)
Most Common Occupations - Service occupations (%)
Most Common Occupations - Healthcare support occupations (%)
Most Common Occupations - Protective service occupations (%)
Most Common Occupations - Fire fighting and prevention, and other protective service workers including supervisors (%)
Most Common Occupations - Law enforcement workers including supervisors (%)
Most Common Occupations - Food preparation and serving related occupations (%)
Most Common Occupations - Building and grounds cleaning and maintenance occupations (%)
Most Common Occupations - Personal care and service occupations (%)
Most Common Occupations - Sales and office occupations (%)
Most Common Occupations - Sales and related occupations (%)
Most Common Occupations - Office and administrative support occupations (%)
Most Common Occupations - Natural resources, construction, and maintenance occupations (%)
Most Common Occupations - Farming, fishing, and forestry occupations (%)
Most Common Occupations - Construction and extraction occupations (%)
Most Common Occupations - Installation, maintenance, and repair occupations (%)
Most Common Occupations - Production, transportation, and material moving occupations (%)
Most Common Occupations - Production occupations (%)
Most Common Occupations - Transportation occupations (%)
Most Common Occupations - Material moving occupations (%)
People in Group quarters - Institutionalized population (%)
People in Group quarters - Correctional institutions (%)
People in Group quarters - Federal prisons and detention centers (%)
People in Group quarters - Halfway houses (%)
People in Group quarters - Local jails and other confinement facilities (including police lockups) (%)
People in Group quarters - Military disciplinary barracks (%)
People in Group quarters - State prisons (%)
People in Group quarters - Other types of correctional institutions (%)
People in Group quarters - Nursing homes (%)
People in Group quarters - Hospitals/wards, hospices, and schools for the handicapped (%)
People in Group quarters - Hospitals/wards and hospices for chronically ill (%)
People in Group quarters - Hospices or homes for chronically ill (%)
People in Group quarters - Military hospitals or wards for chronically ill (%)
People in Group quarters - Other hospitals or wards for chronically ill (%)
People in Group quarters - Hospitals or wards for drug/alcohol abuse (%)
People in Group quarters - Mental (Psychiatric) hospitals or wards (%)
People in Group quarters - Schools, hospitals, or wards for the mentally retarded (%)
People in Group quarters - Schools, hospitals, or wards for the physically handicapped (%)
People in Group quarters - Institutions for the deaf (%)
People in Group quarters - Institutions for the blind (%)
People in Group quarters - Orthopedic wards and institutions for the physically handicapped (%)
People in Group quarters - Wards in general hospitals for patients who have no usual home elsewhere (%)
People in Group quarters - Wards in military hospitals for patients who have no usual home elsewhere (%)
People in Group quarters - Juvenile institutions (%)
People in Group quarters - Long-term care (%)
People in Group quarters - Homes for abused, dependent, and neglected children (%)
People in Group quarters - Residential treatment centers for emotionally disturbed children (%)
People in Group quarters - Training schools for juvenile delinquents (%)
People in Group quarters - Short-term care, detention or diagnostic centers for delinquent children (%)
People in Group quarters - Type of juvenile institution unknown (%)
People in Group quarters - Noninstitutionalized population (%)
People in Group quarters - College dormitories (includes college quarters off campus) (%)
People in Group quarters - Military quarters (%)
People in Group quarters - On base (%)
People in Group quarters - Barracks, unaccompanied personnel housing (UPH), (Enlisted/Officer), ;and similar group living quarters for military personnel (%)
People in Group quarters - Transient quarters for temporary residents (%)
People in Group quarters - Military ships (%)
People in Group quarters - Group homes (%)
People in Group quarters - Homes or halfway houses for drug/alcohol abuse (%)
People in Group quarters - Homes for the mentally ill (%)
People in Group quarters - Homes for the mentally retarded (%)
People in Group quarters - Homes for the physically handicapped (%)
People in Group quarters - Other group homes (%)
People in Group quarters - Religious group quarters (%)
People in Group quarters - Dormitories (%)
People in Group quarters - Agriculture workers' dormitories on farms (%)
People in Group quarters - Job Corps and vocational training facilities (%)
People in Group quarters - Other workers' dormitories (%)
People in Group quarters - Crews of maritime vessels (%)
People in Group quarters - Other nonhousehold living situations (%)
People in Group quarters - Other noninstitutional group quarters (%)
Residents speaking English at home (%)
Residents speaking English at home - Born in the United States (%)
Residents speaking English at home - Native, born elsewhere (%)
Residents speaking English at home - Foreign born (%)
Residents speaking Spanish at home (%)
Residents speaking Spanish at home - Born in the United States (%)
Residents speaking Spanish at home - Native, born elsewhere (%)
Residents speaking Spanish at home - Foreign born (%)
Residents speaking other language at home (%)
Residents speaking other language at home - Born in the United States (%)
Residents speaking other language at home - Native, born elsewhere (%)
Residents speaking other language at home - Foreign born (%)
Class of Workers - Employee of private company (%)
Class of Workers - Self-employed in own incorporated business (%)
Class of Workers - Private not-for-profit wage and salary workers (%)
Class of Workers - Local government workers (%)
Class of Workers - State government workers (%)
Class of Workers - Federal government workers (%)
Class of Workers - Self-employed workers in own not incorporated business and Unpaid family workers (%)
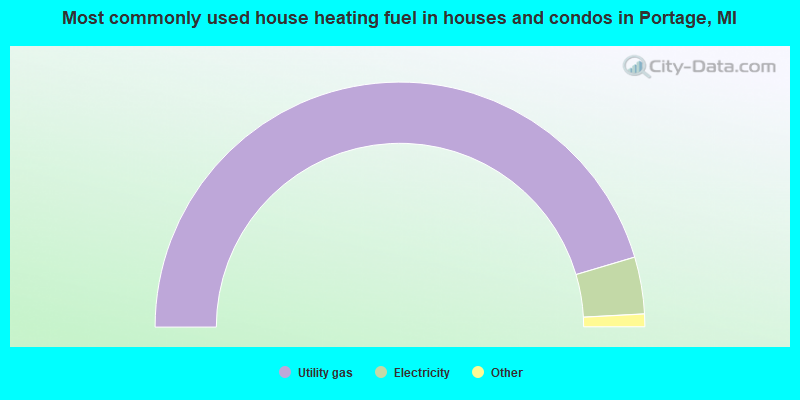
House heating fuel used in houses and condos - Utility gas (%)
House heating fuel used in houses and condos - Bottled, tank, or LP gas (%)
House heating fuel used in houses and condos - Electricity (%)
House heating fuel used in houses and condos - Fuel oil, kerosene, etc. (%)
House heating fuel used in houses and condos - Coal or coke (%)
House heating fuel used in houses and condos - Wood (%)
House heating fuel used in houses and condos - Solar energy (%)
House heating fuel used in houses and condos - Other fuel (%)
House heating fuel used in houses and condos - No fuel used (%)
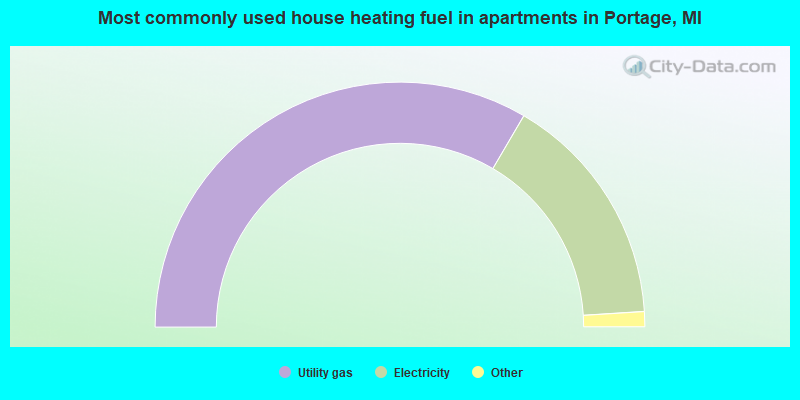
House heating fuel used in apartments - Utility gas (%)
House heating fuel used in apartments - Bottled, tank, or LP gas (%)
House heating fuel used in apartments - Electricity (%)
House heating fuel used in apartments - Fuel oil, kerosene, etc. (%)
House heating fuel used in apartments - Coal or coke (%)
House heating fuel used in apartments - Wood (%)
House heating fuel used in apartments - Solar energy (%)
House heating fuel used in apartments - Other fuel (%)
House heating fuel used in apartments - No fuel used (%)
Armed forces status - In Armed Forces (%)
Armed forces status - Civilian (%)
Armed forces status - Civilian - Veteran (%)
Armed forces status - Civilian - Nonveteran (%)
Fatal accidents locations in years 2005-2021
Fatal accidents locations in 2005
Fatal accidents locations in 2006
Fatal accidents locations in 2007
Fatal accidents locations in 2008
Fatal accidents locations in 2009
Fatal accidents locations in 2010
Fatal accidents locations in 2011
Fatal accidents locations in 2012
Fatal accidents locations in 2013
Fatal accidents locations in 2014
Fatal accidents locations in 2015
Fatal accidents locations in 2016
Fatal accidents locations in 2017
Fatal accidents locations in 2018
Fatal accidents locations in 2019
Fatal accidents locations in 2020
Fatal accidents locations in 2021
Alcohol use - People drinking some alcohol every month (%)
Alcohol use - People not drinking at all (%)
Alcohol use - Average days/month drinking alcohol
Alcohol use - Average drinks/week
Alcohol use - Average days/year people drink much
Audiometry - Average condition of hearing (%)
Audiometry - People that can hear a whisper from across a quiet room (%)
Audiometry - People that can hear normal voice from across a quiet room (%)
Audiometry - Ears ringing, roaring, buzzing (%)
Audiometry - Had a job exposure to loud noise (%)
Audiometry - Had off-work exposure to loud noise (%)
Blood Pressure & Cholesterol - Has high blood pressure (%)
Blood Pressure & Cholesterol - Checking blood pressure at home (%)
Blood Pressure & Cholesterol - Frequently checking blood cholesterol (%)
Blood Pressure & Cholesterol - Has high cholesterol level (%)
Consumer Behavior - Money monthly spent on food at supermarket/grocery store
Consumer Behavior - Money monthly spent on food at other stores
Consumer Behavior - Money monthly spent on eating out
Consumer Behavior - Money monthly spent on carryout/delivered foods
Consumer Behavior - Income spent on food at supermarket/grocery store (%)
Consumer Behavior - Income spent on food at other stores (%)
Consumer Behavior - Income spent on eating out (%)
Consumer Behavior - Income spent on carryout/delivered foods (%)
Current Health Status - General health condition (%)
Current Health Status - Blood donors (%)
Current Health Status - Has blood ever tested for HIV virus (%)
Current Health Status - Left-handed people (%)
Dermatology - People using sunscreen (%)
Diabetes - Diabetics (%)
Diabetes - Had a blood test for high blood sugar (%)
Diabetes - People taking insulin (%)
Diet Behavior & Nutrition - Diet health (%)
Diet Behavior & Nutrition - Milk product consumption (# of products/month)
Diet Behavior & Nutrition - Meals not home prepared (#/week)
Diet Behavior & Nutrition - Meals from fast food or pizza place (#/week)
Diet Behavior & Nutrition - Ready-to-eat foods (#/month)
Diet Behavior & Nutrition - Frozen meals/pizza (#/month)
Drug Use - People that ever used marijuana or hashish (%)
Drug Use - Ever used hard drugs (%)
Drug Use - Ever used any form of cocaine (%)
Drug Use - Ever used heroin (%)
Drug Use - Ever used methamphetamine (%)
Health Insurance - People covered by health insurance (%)
Kidney Conditions-Urology - Avg. # of times urinating at night
Medical Conditions - People with asthma (%)
Medical Conditions - People with anemia (%)
Medical Conditions - People with psoriasis (%)
Medical Conditions - People with overweight (%)
Medical Conditions - Elderly people having difficulties in thinking or remembering (%)
Medical Conditions - People who ever received blood transfusion (%)
Medical Conditions - People having trouble seeing even with glass/contacts (%)
Medical Conditions - People with arthritis (%)
Medical Conditions - People with gout (%)
Medical Conditions - People with congestive heart failure (%)
Medical Conditions - People with coronary heart disease (%)
Medical Conditions - People with angina pectoris (%)
Medical Conditions - People who ever had heart attack (%)
Medical Conditions - People who ever had stroke (%)
Medical Conditions - People with emphysema (%)
Medical Conditions - People with thyroid problem (%)
Medical Conditions - People with chronic bronchitis (%)
Medical Conditions - People with any liver condition (%)
Medical Conditions - People who ever had cancer or malignancy (%)
Mental Health - People who have little interest in doing things (%)
Mental Health - People feeling down, depressed, or hopeless (%)
Mental Health - People who have trouble sleeping or sleeping too much (%)
Mental Health - People feeling tired or having little energy (%)
Mental Health - People with poor appetite or overeating (%)
Mental Health - People feeling bad about themself (%)
Mental Health - People who have trouble concentrating on things (%)
Mental Health - People moving or speaking slowly or too fast (%)
Mental Health - People having thoughts they would be better off dead (%)
Oral Health - Average years since last visit a dentist
Oral Health - People embarrassed because of mouth (%)
Oral Health - People with gum disease (%)
Oral Health - General health of teeth and gums (%)
Oral Health - Average days a week using dental floss/device
Oral Health - Average days a week using mouthwash for dental problem
Oral Health - Average number of teeth
Pesticide Use - Households using pesticides to control insects (%)
Pesticide Use - Households using pesticides to kill weeds (%)
Physical Activity - People doing vigorous-intensity work activities (%)
Physical Activity - People doing moderate-intensity work activities (%)
Physical Activity - People walking or bicycling (%)
Physical Activity - People doing vigorous-intensity recreational activities (%)
Physical Activity - People doing moderate-intensity recreational activities (%)
Physical Activity - Average hours a day doing sedentary activities
Physical Activity - Average hours a day watching TV or videos
Physical Activity - Average hours a day using computer
Physical Functioning - People having limitations keeping them from working (%)
Physical Functioning - People limited in amount of work they can do (%)
Physical Functioning - People that need special equipment to walk (%)
Physical Functioning - People experiencing confusion/memory problems (%)
Physical Functioning - People requiring special healthcare equipment (%)
Prescription Medications - Average number of prescription medicines taking
Preventive Aspirin Use - Adults 40+ taking low-dose aspirin (%)
Reproductive Health - Vaginal deliveries (%)
Reproductive Health - Cesarean deliveries (%)
Reproductive Health - Deliveries resulted in a live birth (%)
Reproductive Health - Pregnancies resulted in a delivery (%)
Reproductive Health - Women breastfeeding newborns (%)
Reproductive Health - Women that had a hysterectomy (%)
Reproductive Health - Women that had both ovaries removed (%)
Reproductive Health - Women that have ever taken birth control pills (%)
Reproductive Health - Women taking birth control pills (%)
Reproductive Health - Women that have ever used Depo-Provera or injectables (%)
Reproductive Health - Women that have ever used female hormones (%)
Sexual Behavior - People 18+ that ever had sex (vaginal, anal, or oral) (%)
Sexual Behavior - Males 18+ that ever had vaginal sex with a woman (%)
Sexual Behavior - Males 18+ that ever performed oral sex on a woman (%)
Sexual Behavior - Males 18+ that ever had anal sex with a woman (%)
Sexual Behavior - Males 18+ that ever had any sex with a man (%)
Sexual Behavior - Females 18+ that ever had vaginal sex with a man (%)
Sexual Behavior - Females 18+ that ever performed oral sex on a man (%)
Sexual Behavior - Females 18+ that ever had anal sex with a man (%)
Sexual Behavior - Females 18+ that ever had any kind of sex with a woman (%)
Sexual Behavior - Average age people first had sex
Sexual Behavior - Average number of female sex partners in lifetime (males 18+)
Sexual Behavior - Average number of female vaginal sex partners in lifetime (males 18+)
Sexual Behavior - Average age people first performed oral sex on a woman (18+)
Sexual Behavior - Average number of woman performed oral sex on in lifetime (18+)
Sexual Behavior - Average number of male sex partners in lifetime (males 18+)
Sexual Behavior - Average number of male anal sex partners in lifetime (males 18+)
Sexual Behavior - Average age people first performed oral sex on a man (18+)
Sexual Behavior - Average number of male oral sex partners in lifetime (18+)
Sexual Behavior - People using protection when performing oral sex (%)
Sexual Behavior - Average number of times people have vaginal or anal sex a year
Sexual Behavior - People having sex without condom (%)
Sexual Behavior - Average number of male sex partners in lifetime (females 18+)
Sexual Behavior - Average number of male vaginal sex partners in lifetime (females 18+)
Sexual Behavior - Average number of female sex partners in lifetime (females 18+)
Sexual Behavior - Circumcised males 18+ (%)
Sleep Disorders - Average hours sleeping at night
Sleep Disorders - People that has trouble sleeping (%)
Smoking-Cigarette Use - People smoking cigarettes (%)
Taste & Smell - People 40+ having problems with smell (%)
Taste & Smell - People 40+ having problems with taste (%)
Taste & Smell - People 40+ that ever had wisdom teeth removed (%)
Taste & Smell - People 40+ that ever had tonsils teeth removed (%)
Taste & Smell - People 40+ that ever had a loss of consciousness because of a head injury (%)
Taste & Smell - People 40+ that ever had a broken nose or other serious injury to face or skull (%)
Taste & Smell - People 40+ that ever had two or more sinus infections (%)
Weight - Average height (inches)
Weight - Average weight (pounds)
Weight - Average BMI
Weight - People that are obese (%)
Weight - People that ever were obese (%)
Weight - People trying to lose weight (%)
According to our research of Michigan and other state lists, there were 97 registered sex offenders living in Portage, Michigan as of June 16, 2024 . The ratio of all residents to sex offenders in Portage is 499 to 1.The ratio of registered sex offenders to all residents in this city is lower than the state average.
The City-Data.com crime index weighs serious crimes and violent crimes more heavily. Higher means more crime, U.S. average is 246.1. It adjusts for the number of visitors and daily workers commuting into cities.
- means the value is smaller than the state average.
- means the value is about the same as the state average.
- means the value is bigger than the state average.
- means the value is much bigger than the state average.
Crime rate in Portage detailed stats: murders, rapes, robberies, assaults, burglaries, thefts, arson Officers per 1,000 residents here:
1.20Michigan average:
1.86
Latest news from Portage, MI collected exclusively by city-data.com from local newspapers, TV, and radio stations
Ancestries: German (11.9%), Dutch (9.4%), English (9.3%), American (9.3%), Irish (6.2%), European (4.3%).
Current Local Time:
Land area: 32.2 square miles.
Population density: 1,521 people per square mile (low).
2,710 residents are foreign born (2.4% Asia , 1.6% Latin America , 1.2% Europe ).
This city:
5.5%Michigan:
6.9%
Median real estate property taxes paid for housing units with mortgages in 2022: $3,990 (1.6%)Median real estate property taxes paid for housing units with no mortgage in 2022: $4,220 (1.7%)
Nearest city with pop. 50,000+: Kalamazoo, MI
Nearest city with pop. 200,000+: Fort Wayne, IN
Nearest city with pop. 1,000,000+: Chicago, IL
Nearest cities:
Latitude: 42.21 N, Longitude: 85.59 W
Daytime population change due to commuting: +11,231 (+23.0%)Workers who live and work in this city: 12,425 (48.0%)
Area code commonly used in this area: 269
Portage tourist attractions:
Single-family new house construction building permits:
2022: 89 buildings , average cost: $217,0002021: 116 buildings , average cost: $214,2002020: 100 buildings , average cost: $217,2002019: 75 buildings , average cost: $210,9002018: 57 buildings , average cost: $222,5002017: 77 buildings , average cost: $251,9002016: 73 buildings , average cost: $247,4002015: 50 buildings , average cost: $241,7002014: 49 buildings , average cost: $242,4002013: 39 buildings , average cost: $223,4002012: 21 buildings , average cost: $236,4002011: 30 buildings , average cost: $239,6002010: 33 buildings , average cost: $206,4002009: 28 buildings , average cost: $225,7002008: 35 buildings , average cost: $235,8002007: 82 buildings , average cost: $223,9002006: 127 buildings , average cost: $200,8002005: 171 buildings , average cost: $194,4002004: 209 buildings , average cost: $197,5002003: 284 buildings , average cost: $170,9002002: 310 buildings , average cost: $158,4002001: 204 buildings , average cost: $164,7002000: 203 buildings , average cost: $167,1001999: 191 buildings , average cost: $156,0001998: 172 buildings , average cost: $148,5001997: 177 buildings , average cost: $158,900Unemployment in December 2023:
Population change in the 1990s: +3,804 (+9.3%).
Most common occupations in Portage, MI (%)
Both Males Females
Other sales and related occupations, including supervisors (4.9%)
Other management occupations, except farmers and farm managers (4.3%)
Other office and administrative support workers, including supervisors (3.9%)
Other production occupations, including supervisors (3.8%)
Retail sales workers, except cashiers (3.6%)
Secretaries and administrative assistants (3.4%)
Preschool, kindergarten, elementary, and middle school teachers (3.2%)
Other management occupations, except farmers and farm managers (5.7%)
Other production occupations, including supervisors (5.7%)
Other sales and related occupations, including supervisors (5.5%)
Metal workers and plastic workers (4.4%)
Computer specialists (3.8%)
Electrical equipment mechanics and other installation, maintenance, and repair workers, including supervisors (3.7%)
Material recording, scheduling, dispatching, and distributing workers (3.5%)
Secretaries and administrative assistants (6.9%)
Other office and administrative support workers, including supervisors (6.6%)
Preschool, kindergarten, elementary, and middle school teachers (5.5%)
Registered nurses (4.9%)
Retail sales workers, except cashiers (4.8%)
Other sales and related occupations, including supervisors (4.2%)
Child care workers (3.9%)
Air pollution and air quality trends(lower is better)
AQI Ozone PM2.5
Tornado activity:
Portage-area historical tornado activity is above Michigan state average. It is 45% greater than the overall U.S. average.
On 4/2/1977, a category F4 (max. wind speeds 207-260 mph) tornado 5.3 miles away from the Portage city center injured 10 people and caused between $500,000 and $5,000,000 in damages.
On 4/3/1956, a category F5 (max. wind speeds 261-318 mph) tornado 45.3 miles away from the city center killed 18 people and injured 340 people and caused between $50,000 and $500,000 in damages.
Earthquake activity:
Portage-area historical earthquake activity is significantly above Michigan state average. It is 14% smaller than the overall U.S. average. On 5/2/2015 at 16:23:07, a magnitude 4.2 (4.2 MW, Depth: 2.8 mi, Class: Light, Intensity: IV - V) earthquake occurred 8.4 miles away from Portage center On 4/18/2008 at 09:36:59, a magnitude 5.4 (5.1 MB, 4.8 MS, 5.4 MW, 5.2 MW, Class: Moderate, Intensity: VI - VII) earthquake occurred 286.7 miles away from Portage center On 7/12/1986 at 08:19:37, a magnitude 4.5 (4.5 MB) earthquake occurred 131.8 miles away from Portage center On 1/31/1986 at 16:46:43, a magnitude 5.0 (5.0 MB) earthquake occurred 231.8 miles away from the city center On 9/25/1998 at 19:52:52, a magnitude 5.2 (4.8 MB, 4.3 MS, 5.2 LG, 4.5 MW, Depth: 3.1 mi) earthquake occurred 272.1 miles away from Portage center On 6/10/1987 at 23:48:54, a magnitude 5.1 (4.9 MB, 4.4 MS, 4.6 MS, 5.1 LG) earthquake occurred 263.6 miles away from the city center Magnitude types: regional Lg-wave magnitude (LG), body-wave magnitude (MB), surface-wave magnitude (MS), moment magnitude (MW) Natural disasters: The number of natural disasters in Kalamazoo County (10) is smaller than the US average (15).Major Disasters (Presidential) Declared: 4Emergencies Declared: 5Storms: 4, Tornadoes: 2, Winter Storms: 2, Blizzard: 1, Flood: 1, Freeze: 1, Hurricane: 1, Power Outage: 1, Snowstorm: 1, Wind: 1, Other: 1 (Note: some incidents may be assigned to more than one category). Main business address for: MANATRON INC SERVICES-COMPUTER INTEGRATED SYSTEMS DESIGN ).
Hospitals and medical centers in Portage: PROVINCIAL HOUSE OF PORTAGE (7855 CURRIER DR)
TENDERCARE PORTAGE (7855 CURRIER DR)
Other hospitals and medical centers near Portage: UNS HOME HEALTH AGENCY INC (Home Health Center, about 2 miles away; KALAMAZOO, MI)
PARAGON HOME HEALTHCARE, INC (Home Health Center, about 3 miles away; KALAMAZOO, MI)
GENTIVA HEALTH SERVICES (Home Health Center, about 3 miles away; KALAMAZOO, MI)
SOUTHERN CARE, INC (Hospital, about 3 miles away; KALAMAZOO, MI)
FMC - KALAMAZOO EAST (Dialysis Facility, about 4 miles away; KALAMAZOO, MI)
HAROLD AND GRACE UPJOHN COMMUN (Nursing Home, about 5 miles away; KALAMAZOO, MI)
ALLIANCE HOME HEALTH SERVICES, INC (Home Health Center, about 5 miles away; KALAMAZOO, MI)
Amtrak station near Portage: 6 miles: KALAMAZOO (459 N. BURDICK ST.) Services: ticket office, fully wheelchair accessible, enclosed waiting area, public restrooms, public payphones, snack bar, paid short-term parking, paid long-term parking, call for car rental service, taxi stand, intercity bus service.
Colleges/Universities in Portage: Ross Medical Education Center-Portage Full-time enrollment: 300; Location: 6235 S Westnedge; Private, for-profit; Website: www.rosseducation.edu)
Wright Beauty Academy Full-time enrollment: 134; Location: 6666 Lovers Ln; Private, for-profit; Website: www.wrightbeautyacademy.com)
Colleges/universities with over 2000 students nearest to Portage:
Kalamazoo Valley Community College (about 5 miles; Kalamazoo, MI ; Full-time enrollment: 7,369)
Western Michigan University (about 6 miles; Kalamazoo, MI ; FT enrollment: 20,840)
Kellogg Community College (about 23 miles; Battle Creek, MI ; FT enrollment: 4,078)
Lake Michigan College (about 42 miles; Benton Harbor, MI ; FT enrollment: 2,341)
Andrews University (about 43 miles; Berrien Springs, MI ; FT enrollment: 3,103)
Davenport University (about 45 miles; Grand Rapids, MI ; FT enrollment: 6,955)
Hope College (about 48 miles; Holland, MI ; FT enrollment: 3,535)
Public high schools in Portage:
Biggest public elementary/middle schools in Portage: PORTAGE WEST MIDDLE SCHOOL Students: 705, Location: 7145 MOORS BRIDGE RD, Grades: 6-8)PORTAGE CENTRAL MIDDLE SCHOOL Students: 679, Location: 8305 SOUTH WESTNEDGE AVE, Grades: 6-8)MOORSBRIDGE ELEMENTARY SCHOOL Students: 599, Location: 7361 MOORS BRIDGE RD, Grades: PK-5)LAKE CENTER ELEMENTARY SCHOOL Students: 581, Location: 10011 PORTAGE RD, Grades: KG-5)PORTAGE NORTH MIDDLE SCHOOL Students: 580, Location: 5808 OREGON AVE, Grades: 6-8)AMBERLY ELEMENTARY SCHOOL Students: 556, Location: 6637 AMBERLY ST, Grades: KG-5)HAVERHILL ELEMENTARY SCHOOL Students: 430, Location: 6633 HAVERHILL AVE, Grades: KG-5)ANGLING ROAD ELEMENTARY SCHOOL Students: 403, Location: 5340 ANGLING RD, Grades: KG-5)OAKLAND ACADEMY Students: 199, Location: 6325 OAKLAND DR, Grades: KG-6, Charter school )WOODLAND ELEMENTARY SCHOOL Location: 1401 WOODLAND DR, Grades: PK-5)
Private elementary/middle schools in Portage: ST MICHAEL LUTHERAN SCHOOL Students: 207, Location: 7211 OAKLAND DR, Grades: PK-8)
KALAMAZOO COUNTRY DAY SCHOOL Students: 167, Location: 4221 E MILHAM AVE, Grades: PK-8)
See full list of schools located in Portage Library in Portage: PORTAGE DISTRICT LIBRARY Operating income: $3,904,169; Location: 300 LIBRARY LANE; 150,422 books ; 3,231 e-books ; 19,520 audio materials ; 8,801 video materials ; 22 local licensed databases ; 5 other licensed databases ; 212 print serial subscriptions )
Notable locations in Portage: (A) , South Town Plaza (B) , Moors Golf Club (C) , Oakland Hills Golf Club (D) , Portage Police Department (E) , Portage City Hall (F) , Portage Fire Department (G) , Kalamazoo Aviation History Museum (H) , Portage District Library (I) , Portage Fire Department Station 1 (J) , Portage Fire Department Station 2 (K) , Portage Fire Department Station 3 (L) . Display/hide their locations on the map
Shopping Centers: (1) , Crossroads Mall (2) . Display/hide their locations on the map
Main business address in Portage: (A) . Display/hide its location on the map
Churches in Portage include: (A) , Prairie Edge Church (B) , First Church of the Nazarene (C) , First Assembly of God Church (D) , Victory Baptist Church (E) , Westminster Presbyterian Church (F) , Portage United Church of Christ (G) , Prince of Peace Lutheran Church (H) , Saint James Lutheran Church (I) . Display/hide their locations on the map
Cemeteries: (1) , Dry Prairie Cemetery (2) , Portage South Cemetery (3) , Portage Central Cemetery (4) . Display/hide their locations on the map
Lakes: (A) , West Lake (B) , Hampton Lake (C) , Gourdneck Lake (D) , Austin Lake (E) , Sugarloaf Lake (F) . Display/hide their locations on the map
Parks in Portage include: (1) , Westfield Park (2) , Lexington Green Park (3) , Portage Creek Bicentennial Park (4) , Allen Field (5) , Gourdneck State Game Area (6) . Display/hide their locations on the map
Hotels: (1) , Country Inn-Suites Kalamazoo (1912 East Kilgore Road) (2) , Country Inn & Suites by Carlson (1912 East Kilgore Road) (3) . Display/hide their approximate locations on the map
Courts: (1) , Reeves Court Services (912 East Osterhout) (2) . Display/hide their approximate locations on the map
Birthplace of: Scott Parse - Ice hockey player, Larry Hollenbeck - Busch series NASCAR driver (born : Apr 9, 1949), Chris Noonan (ice hockey) - Ice hockey goaltender, Evan Rankin - Ice hockey player.
Kalamazoo County has a predicted average indoor radon screening level greater than 4 pCi/L (pico curies per liter) - Highest Potential Drinking water stations with addresses in Portage and their reported violations in the past:
SOUTH PORTAGE LITTLE LEAGUE SOUTH (Address: 741 Calico Population served: 700, Groundwater):
Past health violations:
MCL, Monthly (TCR) - In AUG-2009, Contaminant: Coliform. Follow-up actions: St Public Notif received (AUG-18-2009), St Tech Assistance Visit (AUG-18-2009), St Compliance achieved (OCT-01-2009)
Address: 741 Calico Population served: 700, Groundwater):
Past monitoring violations:
One routine major monitoring violation
One regular monitoring violation
Population served: 300, Groundwater):
Past health violations:
MCL, Monthly (TCR) - In JUN-2008, Contaminant: Coliform. Follow-up actions: St Public Notif issued (JUN-17-2008), St Tech Assistance Visit (JUN-18-2008), St Public Notif received (JUN-25-2008), St Compliance achieved (JUL-16-2008)
Past monitoring violations:
One routine major monitoring violation
Population served: 60, Groundwater):
Past health violations:
MCL, Monthly (TCR) - In JUL-2009, Contaminant: Coliform. Follow-up actions: St Public Notif requested (JUL-09-2009), St Tech Assistance Visit (JUL-10-2009), St Compliance achieved (JUL-23-2009)
Past monitoring violations:
One routine major monitoring violation
Address: 2186 East Centre Ave. Population served: 45, Groundwater):
Past monitoring violations:
Initial Tap Sampling for Pb and Cu - In JUL-01-2007, Contaminant: Lead and Copper Rule. Follow-up actions: St Public Notif requested (AUG-21-2007), St Violation/Reminder Notice (AUG-21-2007), St Compliance achieved (SEP-27-2007), St Public Notif received (JUN-25-2008)
One routine major monitoring violation
2 regular monitoring violations
Average household size: This city:
2.4 peopleMichigan:
2.5 people
Percentage of family households: This city:
64.7%Whole state:
66.0%
Percentage of households with unmarried partners: This city:
6.7%Whole state:
6.4%
Likely homosexual households (counted as self-reported same-sex unmarried-partner households)
Lesbian couples: 0.4% of all households Gay men: 0.2% of all households
People in group quarters in Portage in 2010:
111 people in nursing facilities/skilled-nursing facilities
22 people in group homes intended for adults
21 people in residential treatment centers for adults
2 people in other noninstitutional facilities
People in group quarters in Portage in 2000:
132 people in other noninstitutional group quarters
120 people in nursing homes
120 people in other group homes
18 people in other workers' dormitories
13 people in homes for the mentally ill
8 people in homes for the mentally retarded
4 people in religious group quarters
Banks with most branches in Portage (2011 data):
PNC Bank, National Association: Woodbridge Hills Branch, Portage Branch, Lake Center Branch. Info updated 2012/03/20: Bank assets: $263,309.6 mil, Deposits: $197,343.0 mil, headquarters in Wilmington, DE, positive income , Commercial Lending Specialization, 3085 total offices , Holding Company: Pnc Financial Services Group, Inc., The
JPMorgan Chase Bank, National Association: Portage Westnedge Meijer Banking Cen, Portage Shaver Meijer Banking Ctr. B, West Centre Oakland Branch. Info updated 2011/11/10: Bank assets: $1,811,678.0 mil, Deposits: $1,190,738.0 mil, headquarters in Columbus, OH, positive income , International Specialization, 5577 total offices , Holding Company: Jpmorgan Chase & Co.
Fifth Third Bank: West Lake Branch, Woodbridge Branch, South Westnedge At Crossroads Branch. Info updated 2009/10/05: Bank assets: $114,540.4 mil, Deposits: $89,689.1 mil, headquarters in Cincinnati, OH, positive income , Commercial Lending Specialization, 1378 total offices , Holding Company: Fifth Third Bancorp
Keystone Community Bank: Woodbridge Branch at 3910 W. Centre Ave, branch established on 2003/11/03; Portage Branch at 6405 South Westnedge Avenue, branch established on 1997/07/30. Info updated 2006/11/03: Bank assets: $256.3 mil, Deposits: $212.4 mil, headquarters in Kalamazoo, MI, positive income , Commercial Lending Specialization, 7 total offices , Holding Company: Firstbank Corporation
Bank of America, National Association: Centre Ave. at 4431 West Centre Avenue, branch established on 1998/05/18; Crossroads Mall Branch at 6660 South Westnedge Avenue, branch established on 1893/01/01. Info updated 2009/11/18: Bank assets: $1,451,969.3 mil, Deposits: $1,077,176.8 mil, headquarters in Charlotte, NC, positive income , 5782 total offices , Holding Company: Bank Of America Corporation
Michigan Commerce Bank: Portage Branch at 800 East Milham, branch established on 1988/05/02. Info updated 2010/04/14: Bank assets: $777.0 mil, Deposits: $746.6 mil, headquarters in Ann Arbor, MI, negative income in the last year , Commercial Lending Specialization, 10 total offices , Holding Company: Capitol Bancorp Ltd.
Comerica Bank: Portage Branch at 7941 South Westnedge Avenue, branch established on 1953/12/07. Info updated 2011/07/29: Bank assets: $60,970.5 mil, Deposits: $48,300.9 mil, headquarters in Dallas, TX, positive income , Commercial Lending Specialization, 497 total offices , Holding Company: Comerica Incorporated
Horizon Bank, National Association: Kalamazoo Branch at 3250 West Centre Avenue, branch established on 2012/03/05. Info updated 2010/06/29: Bank assets: $1,546.9 mil, Deposits: $1,018.1 mil, headquarters in Michigan City, IN, positive income , 27 total offices , Holding Company: Horizon Bancorp
First National Bank of Michigan: Woodbridge Branch at 2700 W Centre, branch established on 2008/11/16. Info updated 2009/09/04: Bank assets: $204.8 mil, Deposits: $174.1 mil, headquarters in Kalamazoo, MI, positive income , Commercial Lending Specialization, 3 total offices , Holding Company: First National Bancorp, Inc.
4 other banks with 4 local branches
For population 15 years and over in Portage:
Never married: 32.8%Now married: 52.5%Separated: 0.7%Widowed: 4.9%Divorced: 9.2% For population 25 years and over in Portage:
High school or higher: 96.4%Bachelor's degree or higher: 47.6%Graduate or professional degree: 20.1%Unemployed: 3.7%Mean travel time to work (commute): 18.0 minutes
Education Gini index (Inequality in education) Here:
9.7Michigan average:
11.0
Religion statistics for Portage, MI (based on Kalamazoo County data)
Religion Adherents Congregations Evangelical Protestant 37,002 118 Mainline Protestant 24,155 60 Catholic 23,876 9 Other 6,306 28 Black Protestant 4,140 10 Orthodox 275 1 None 154,577 -
Source: Clifford Grammich, Kirk Hadaway, Richard Houseal, Dale E.Jones, Alexei Krindatch, Richie Stanley and Richard H.Taylor. 2012. 2010 U.S.Religion Census: Religious Congregations & Membership Study. Association of Statisticians of American Religious Bodies. Jones, Dale E., et al. 2002. Congregations and Membership in the United States 2000. Nashville, TN: Glenmary Research Center. Graphs represent county-level data
Food Environment Statistics: Number of grocery stores : 41Kalamazoo County :
1.68 / 10,000 pop.Michigan :
2.34 / 10,000 pop.
Number of supercenters and club stores : 5This county :
0.20 / 10,000 pop.Michigan :
0.18 / 10,000 pop.
Number of convenience stores (no gas) : 45Kalamazoo County :
1.84 / 10,000 pop.Michigan :
1.52 / 10,000 pop.
Number of convenience stores (with gas) : 64Kalamazoo County :
2.62 / 10,000 pop.Michigan :
2.99 / 10,000 pop.
Number of full-service restaurants : 177Kalamazoo County :
7.24 / 10,000 pop.Michigan :
6.80 / 10,000 pop.
Adult diabetes rate : This county :
8.9%Michigan :
9.7%
Low-income preschool obesity rate : Health and Nutrition: Healthy diet rate : Portage:
53.7%Michigan:
50.3%
Average overall health of teeth and gums : Portage:
53.4%Michigan:
47.9%
Average BMI : Portage:
28.3Michigan:
28.7
People feeling badly about themselves : People not drinking alcohol at all : Portage:
8.9%Michigan:
10.4%
Average hours sleeping at night : General health condition : This city:
60.7%Michigan:
57.0%
Average condition of hearing : This city:
80.7%Michigan:
79.6%
More about Health and Nutrition of Portage, MI Residents
Local government employment and payroll (March 2022)
Function
Full-time employees
Monthly full-time payroll
Average yearly full-time wage
Part-time employees
Monthly part-time payroll
Police Protection - Officers
58 $410,821 $84,997 1 $3,782 Streets and Highways
36 $188,066 $62,689 1 $1,656 Firefighters
32 $179,295 $67,236 6 $4,566 Financial Administration
20 $99,483 $59,690 0 $0 Other and Unallocable
14 $74,551 $63,901 1 $2,083 Police - Other
14 $42,800 $36,686 4 $7,898 Housing and Community Development (Local)
12 $69,591 $69,591 1 $2,155 Parks and Recreation
10 $47,753 $57,304 20 $32,295 Other Government Administration
9 $62,053 $82,737 7 $5,036 Fire - Other
5 $35,247 $84,593 1 $1,643
Totals for Government
210 $1,209,660 $69,123 42 $61,115
Portage government finances - Expenditure in 2021 (per resident):
Current Operations - Sewerage: $10,430,000 ($212.95)
Police Protection: $9,267,000 ($189.21)Regular Highways: $5,752,000 ($117.44)Local Fire Protection: $5,312,000 ($108.46)General - Other: $3,690,000 ($75.34)Parks and Recreation: $2,022,000 ($41.28)Central Staff Services: $1,634,000 ($33.36)General Public Buildings: $1,526,000 ($31.16)Financial Administration: $1,228,000 ($25.07)Health - Other: $511,000 ($10.43)Judicial and Legal Services: $226,000 ($4.61)General - Interest on Debt: $1,020,000 ($20.83)
Other Capital Outlay - Regular Highways: $3,837,000 ($78.34)
Local Fire Protection: $3,115,000 ($63.60)Health - Other: $3,068,000 ($62.64)Water Utilities: $2,779,000 ($56.74)General - Other: $1,800,000 ($36.75)Police Protection: $1,065,000 ($21.74)Parks and Recreation: $531,000 ($10.84)Sewerage: $144,000 ($2.94)Total Salaries and Wages: $15,377,000 ($313.96)
Water Utilities - Interest on Debt: $325,000 ($6.64)
Portage government finances - Revenue in 2021 (per resident):
Charges - Other: $17,311,000 ($353.44)
Federal Intergovernmental - Other: $1,184,000 ($24.17)
Housing and Community Development: $427,000 ($8.72)Local Intergovernmental - Other: $196,000 ($4.00)
Miscellaneous - General Revenue - Other: $1,522,000 ($31.08)
Interest Earnings: $233,000 ($4.76)Rents: $173,000 ($3.53)Special Assessments: $84,000 ($1.72)Sale of Property: $61,000 ($1.25)State Intergovernmental - Highways: $6,969,000 ($142.29)
Other: $4,677,000 ($95.49)General Local Government Support: $4,567,000 ($93.25)Tax - Property: $24,844,000 ($507.25)
Occupation and Business License - Other: $1,602,000 ($32.71)
Portage government finances - Debt in 2021 (per resident):
Long Term Debt - Outstanding Unspecified Public Purpose: $52,179,000 ($1065.36)
Beginning Outstanding - Unspecified Public Purpose: $42,119,000 ($859.96)Issue, Unspecified Public Purpose: $16,925,000 ($345.56)Retired Unspecified Public Purpose: $6,865,000 ($140.16)
Portage government finances - Cash and Securities in 2021 (per resident):
Other Funds - Cash and Securities: $59,314,000 ($1211.03)
Businesses in Portage, MI
Name Count Name Count
ALDO 1 Lane Bryant 1 AT&T 3 Lane Furniture 3 Abercrombie & Fitch 1 Little Caesars Pizza 2 Aeropostale 1 Long John Silver's 1 American Eagle Outfitters 1 Lowe's 1 Ann Taylor 1 Macy's 1 Applebee's 1 MasterBrand Cabinets 10 Arby's 1 Maurices 1 AutoZone 1 McDonald's 4 Banana Republic 1 Meijer 2 Barnes & Noble 1 Men's Wearhouse 2 Bath & Body Works 1 Menards 1 Bed Bath & Beyond 1 Motherhood Maternity 2 Burger King 2 New Balance 1 Burlington Coat Factory 1 Nike 3 Casual Male XL 1 OfficeMax 1 Catherines 1 Old Navy 1 Charlotte Russe 1 Olive Garden 1 Chico's 1 Pac Sun 1 Chuck E. Cheese's 1 Panera Bread 1 Circle K 2 Papa John's Pizza 2 Cold Stone Creamery 1 Payless 2 Coldwater Creek 1 Penske 1 Curves 1 Pizza Hut 2 DHL 1 Plato's Closet 1 Dairy Queen 1 Qdoba Mexican Grill 1 Deb 1 Quiznos 1 Decora Cabinetry 2 RadioShack 1 Domino's Pizza 1 Red Lobster 1 DressBarn 1 Red Robin 1 Dressbarn 1 Rite Aid 1 Eddie Bauer 1 SAS Shoes 1 Express 1 SONIC Drive-In 1 Famous Footwear 1 Sam's Club 1 FedEx 15 Sears 2 Finish Line 1 Spencer Gifts 1 Firestone Complete Auto Care 1 Sprint Nextel 3 Foot Locker 1 Starbucks 1 Forever 21 1 Steak 'n Shake 1 Fredericks Of Hollywood 1 Subway 6 GNC 1 T-Mobile 3 GameStop 2 T.J.Maxx 1 Gap 1 Taco Bell 1 H&R Block 4 Talbots 1 Hollister Co. 1 Target 1 Home Depot 1 The Limited 1 Hot Topic 1 Toys"R"Us 2 IHOP 1 U-Haul 2 J. Jill 1 UPS 19 JCPenney 1 Vans 2 Jimmy John's 1 Verizon Wireless 1 JoS. A. Bank 1 Victoria's Secret 2 Jones New York 1 Walgreens 2 Journeys 1 Walmart 1 Kincaid 2 Wendy's 1 Kohl's 1 Wet Seal 1 Kroger 1 YMCA 1 La-Z-Boy 2
Strongest AM radio stations in Portage:
WKLZ (1470 AM; 10 kW; KALAMAZOO, MI; Owner: FAIRFIELD BROADCASTING COMPANY)
WQSN (1660 AM; 10 kW; KALAMAZOO, MI; Owner: FAIRFIELD BROADCASTING COMPANY)
WNWN (1560 AM; daytime; 4 kW; PORTAGE, MI; Owner: MIDWEST COMMUNICATIONS, INC)
WKZO (590 AM; 5 kW; KALAMAZOO, MI; Owner: FAIRFIELD BROADCASTING COMPANY)
WKMI (1360 AM; 5 kW; KALAMAZOO, MI)
WKPR (1420 AM; 1 kW; KALAMAZOO, MI)
WBCK (930 AM; 5 kW; BATTLE CREEK, MI; Owner: CAPSTAR TX LIMITED PARTNERSHIP)
WOOD (1300 AM; 20 kW; GRAND RAPIDS, MI; Owner: CLEAR CHANNEL BROADCASTING LICENSES, INC.)
WOWO (1190 AM; 50 kW; FORT WAYNE, IN; Owner: PATHFINDER COMMUNICATIONS CORPORATION)
WOAP (1080 AM; 50 kW; OWOSSO, MI)
WMSH-FM (99 AM; 1 kW; STURGIS, MI; Owner: LAKE CITIES BROADCASTING CORPORATION)
WTMJ (620 AM; 50 kW; MILWAUKEE, WI; Owner: JOURNAL BROADCAST CORPORATION)
WJR (760 AM; 50 kW; DETROIT, MI; Owner: ABC, INC.)
Strongest FM radio stations in Portage:
WFAT (96.5 FM; PORTAGE, MI; Owner: MIDWEST COMMUNICATIONS, INC)
WKDS (89.9 FM; KALAMAZOO, MI; Owner: BD OF EDUC SCHOOL DISTR OF CITY)
W247AM (97.3 FM; KALAMAZOO, MI; Owner: CSN INTERNATIONAL)
WAYK (88.3 FM; KALAMAZOO, MI; Owner: CORNERSTONE UNIVERSITY)
W258AH (99.5 FM; KALAMAZOO, MI; Owner: SPRING ARBOR UNIVERSITY COMMUNICATIONS, INC.)
WIDR (89.1 FM; KALAMAZOO, MI; Owner: WESTERN MICHIGAN UNIVERSITY)
W262AF (100.3 FM; PARCHMENT, MI; Owner: FRIENDS OF CHRISTIAN RADIO, INC.)
WRKR (107.7 FM; PORTAGE, MI; Owner: CUMULUS LICENSING CORP.)
WMUK (102.1 FM; KALAMAZOO, MI; Owner: WESTERN MICHIGAN UNIVERSITY)
WKFR-FM (103.3 FM; BATTLE CREEK, MI; Owner: CUMULUS LICENSING CORP.)
WQLR (106.5 FM; KALAMAZOO, MI; Owner: FAIRFIELD BROADCASTING COMPANY)
WOFR (89.5 FM; SCHOOLCRAFT, MI; Owner: FAMILY STATIONS, INC.)
WBCT (93.7 FM; GRAND RAPIDS, MI; Owner: CLEAR CHANNEL BROADCASTING LICENSES, INC.)
WZUU (92.3 FM; ALLEGAN, MI; Owner: FORUM COMMUNICATIONS, INC.)
WVGR (104.1 FM; GRAND RAPIDS, MI; Owner: REGENTS OF THE UNIVERSITY OF MICHIGAN)
WLKM-FM (95.9 FM; THREE RIVERS, MI; Owner: IMPACT RADIO, LLC)
WQXC-FM (100.9 FM; OTSEGO, MI; Owner: FORUM COMMUNICATIONS, INC.)
WBXX (95.3 FM; BATTLE CREEK, MI; Owner: CASPTAR TX LIMITED PARTNERSHIP)
W219CA (91.7 FM; KALAMAZOO, MI; Owner: PENSACOLA CHRISTIAN COLLEGE, INC.)
TV broadcast stations around Portage:
WGVK (Channel 52; KALAMAZOO, MI; Owner: GRAND VALLEY STATE UNIVERSITY)
WWMT (Channel 3; KALAMAZOO, MI; Owner: FREEDOM BROADCASTING OF MICHIGAN, INC.)
WLLA (Channel 64; KALAMAZOO, MI; Owner: CHRISTIAN FAITH BROADCAST, INC.)
W26BX (Channel 26; KALAMAZOO, MI; Owner: TCT OF MICHIGAN, INC.)
WOTV (Channel 41; BATTLE CREEK, MI; Owner: WOOD LICENSE COMPANY, LLC)
WOKZ-CA (Channel 50; KALAMAZOO, MI; Owner: WOOD LICENSE COMPANY, LLC)
WXMI (Channel 17; GRAND RAPIDS, MI; Owner: TRIBUNE TELEVISION HOLDINGS, INC.)
WOOD-TV (Channel 8; GRAND RAPIDS, MI; Owner: WOOD LICENSE COMPANY, LLC)
WZPX (Channel 43; BATTLE CREEK, MI; Owner: PAXSON BATTLE CREEK LICENSE, INC.)
WRDY-LP (Channel 69; SOUTH BEND, IN; Owner: WEIGEL BROADCASTING COMPANY)
WOBC-CA (Channel 20; BATTLE CREEK, MI; Owner: WOOD LICENSE COMPANY, LLC)
W21BS (Channel 21; HOUGHTON LAKE, MI; Owner: MS COMMUNICATIONS, LLC)
National Bridge Inventory (NBI) Statistics 43 Number of bridges315ft / 96.2m Total length1,044,739 Total average daily traffic113,592 Total average daily truck traffic
New bridges - historical statistics
1 1950-1959 2 1960-1969 1 1970-1979 6 1990-1999 24 2000-2009 9 2010-2019
See full National Bridge Inventory statistics for Portage, MI
Home Mortgage Disclosure Act Aggregated Statistics For Year 2009(Based on 11 full and 1 partial tracts) A) FHA, FSA/RHS & VA B) Conventional C) Refinancings D) Home Improvement Loans E) Loans on Dwellings For 5+ Families F) Non-occupant Loans on G) Loans On Manufactured Number Average Value Number Average Value Number Average Value Number Average Value Number Average Value Number Average Value Number Average Value
LOANS ORIGINATED 273 $125,517 221 $146,737 1,063 $144,536 51 $69,911 0 $0 47 $110,647 8 $37,631 APPLICATIONS APPROVED, NOT ACCEPTED 13 $144,077 18 $160,298 97 $150,805 5 $31,640 0 $0 3 $230,120 1 $27,020 APPLICATIONS DENIED 20 $130,231 17 $115,098 233 $145,132 25 $62,286 0 $0 14 $102,171 3 $49,667 APPLICATIONS WITHDRAWN 25 $108,990 20 $144,670 223 $155,528 6 $32,567 1 $1,950,000 6 $146,067 1 $3,000 FILES CLOSED FOR INCOMPLETENESS 5 $168,400 2 $64,500 36 $164,396 1 $4,000 0 $0 1 $30,000 0 $0
Aggregated Statistics For Year 2008(Based on 11 full and 1 partial tracts) A) FHA, FSA/RHS & VA B) Conventional C) Refinancings D) Home Improvement Loans E) Loans on Dwellings For 5+ Families F) Non-occupant Loans on G) Loans On Manufactured Number Average Value Number Average Value Number Average Value Number Average Value Number Average Value Number Average Value Number Average Value
LOANS ORIGINATED 184 $128,103 320 $150,274 495 $141,647 50 $36,785 4 $514,462 51 $125,255 4 $31,750 APPLICATIONS APPROVED, NOT ACCEPTED 15 $139,133 28 $198,013 88 $119,342 9 $57,673 1 $242,310 4 $79,568 0 $0 APPLICATIONS DENIED 25 $112,444 32 $91,582 229 $136,510 42 $39,195 0 $0 10 $81,737 6 $34,667 APPLICATIONS WITHDRAWN 16 $90,216 25 $159,456 134 $147,088 6 $74,013 0 $0 7 $157,286 0 $0 FILES CLOSED FOR INCOMPLETENESS 1 $122,000 6 $71,333 43 $154,428 0 $0 0 $0 3 $114,333 0 $0
Aggregated Statistics For Year 2007(Based on 11 full and 1 partial tracts) A) FHA, FSA/RHS & VA B) Conventional C) Refinancings D) Home Improvement Loans E) Loans on Dwellings For 5+ Families F) Non-occupant Loans on G) Loans On Manufactured Number Average Value Number Average Value Number Average Value Number Average Value Number Average Value Number Average Value Number Average Value
LOANS ORIGINATED 57 $128,274 619 $128,281 647 $120,611 109 $57,406 0 $0 90 $125,252 5 $62,400 APPLICATIONS APPROVED, NOT ACCEPTED 3 $125,333 69 $127,522 154 $132,910 16 $44,128 0 $0 12 $130,279 5 $18,600 APPLICATIONS DENIED 14 $136,214 74 $111,833 481 $121,684 88 $47,632 1 $919,000 22 $149,880 6 $46,858 APPLICATIONS WITHDRAWN 4 $147,582 38 $110,772 191 $142,232 23 $86,260 1 $280,000 13 $121,231 0 $0 FILES CLOSED FOR INCOMPLETENESS 2 $114,000 17 $156,017 45 $115,297 6 $78,167 0 $0 3 $116,667 0 $0
Aggregated Statistics For Year 2006(Based on 11 full and 1 partial tracts) A) FHA, FSA/RHS & VA B) Conventional C) Refinancings D) Home Improvement Loans E) Loans on Dwellings For 5+ Families F) Non-occupant Loans on G) Loans On Manufactured Number Average Value Number Average Value Number Average Value Number Average Value Number Average Value Number Average Value Number Average Value
LOANS ORIGINATED 92 $131,204 902 $121,659 751 $111,126 187 $48,185 2 $6,165,460 104 $101,362 7 $67,286 APPLICATIONS APPROVED, NOT ACCEPTED 5 $113,600 85 $119,489 161 $112,352 20 $37,450 0 $0 14 $91,714 3 $45,713 APPLICATIONS DENIED 5 $135,776 116 $128,546 444 $116,861 110 $58,593 0 $0 28 $117,966 9 $55,000 APPLICATIONS WITHDRAWN 9 $109,556 74 $110,431 258 $122,701 34 $105,498 0 $0 16 $110,236 6 $82,500 FILES CLOSED FOR INCOMPLETENESS 1 $112,000 15 $104,687 105 $126,132 4 $38,750 0 $0 4 $201,750 1 $7,000
Aggregated Statistics For Year 2005(Based on 11 full and 1 partial tracts) A) FHA, FSA/RHS & VA B) Conventional C) Refinancings D) Home Improvement Loans E) Loans on Dwellings For 5+ Families F) Non-occupant Loans on G) Loans On Manufactured Number Average Value Number Average Value Number Average Value Number Average Value Number Average Value Number Average Value Number Average Value
LOANS ORIGINATED 102 $128,580 947 $124,368 982 $120,398 156 $55,663 3 $657,000 100 $106,020 9 $52,388 APPLICATIONS APPROVED, NOT ACCEPTED 6 $109,333 92 $118,637 155 $111,445 20 $40,470 0 $0 7 $127,857 16 $42,938 APPLICATIONS DENIED 5 $91,200 133 $86,444 633 $123,367 102 $40,758 0 $0 20 $117,380 13 $38,176 APPLICATIONS WITHDRAWN 7 $103,143 108 $125,539 371 $124,475 30 $104,382 0 $0 21 $112,429 2 $155,000 FILES CLOSED FOR INCOMPLETENESS 1 $127,000 21 $121,840 200 $138,438 7 $46,869 0 $0 4 $108,750 0 $0
Aggregated Statistics For Year 2004(Based on 11 full and 1 partial tracts) A) FHA, FSA/RHS & VA B) Conventional C) Refinancings D) Home Improvement Loans E) Loans on Dwellings For 5+ Families F) Non-occupant Loans on G) Loans On Manufactured Number Average Value Number Average Value Number Average Value Number Average Value Number Average Value Number Average Value Number Average Value
LOANS ORIGINATED 140 $124,707 905 $133,468 1,263 $118,909 133 $52,220 1 $155,000 131 $105,248 10 $50,200 APPLICATIONS APPROVED, NOT ACCEPTED 6 $110,893 99 $122,699 220 $117,817 13 $32,923 0 $0 14 $91,011 7 $32,857 APPLICATIONS DENIED 18 $102,961 84 $109,575 535 $121,393 79 $33,001 0 $0 18 $95,501 16 $40,892 APPLICATIONS WITHDRAWN 5 $102,880 40 $111,344 276 $120,732 31 $68,581 0 $0 8 $91,000 3 $86,667 FILES CLOSED FOR INCOMPLETENESS 1 $114,000 14 $122,716 127 $134,744 6 $53,333 0 $0 6 $68,015 0 $0
Aggregated Statistics For Year 2003(Based on 11 full and 1 partial tracts) A) FHA, FSA/RHS & VA B) Conventional C) Refinancings D) Home Improvement Loans E) Loans on Dwellings For 5+ Families F) Non-occupant Loans on Number Average Value Number Average Value Number Average Value Number Average Value Number Average Value Number Average Value
LOANS ORIGINATED 150 $120,669 917 $140,127 3,186 $119,398 110 $33,332 2 $96,500 152 $104,426 APPLICATIONS APPROVED, NOT ACCEPTED 7 $119,286 83 $150,235 436 $118,677 18 $20,280 0 $0 19 $85,526 APPLICATIONS DENIED 12 $111,222 77 $112,871 629 $109,804 61 $22,974 0 $0 30 $104,661 APPLICATIONS WITHDRAWN 5 $125,468 70 $141,646 447 $122,460 4 $25,750 0 $0 13 $115,366 FILES CLOSED FOR INCOMPLETENESS 0 $0 14 $115,977 77 $133,722 8 $22,250 0 $0 2 $64,190
Aggregated Statistics For Year 2002(Based on 8 full and 1 partial tracts) A) FHA, FSA/RHS & VA B) Conventional C) Refinancings D) Home Improvement Loans E) Loans on Dwellings For 5+ Families F) Non-occupant Loans on Number Average Value Number Average Value Number Average Value Number Average Value Number Average Value Number Average Value
LOANS ORIGINATED 122 $109,131 527 $120,217 1,435 $105,982 109 $26,546 2 $279,000 79 $96,968 APPLICATIONS APPROVED, NOT ACCEPTED 1 $80,350 54 $114,471 237 $108,219 19 $11,586 0 $0 6 $142,797 APPLICATIONS DENIED 5 $91,916 67 $76,893 315 $95,090 44 $15,956 0 $0 13 $69,082 APPLICATIONS WITHDRAWN 8 $106,275 28 $133,998 207 $103,717 8 $38,625 0 $0 13 $110,945 FILES CLOSED FOR INCOMPLETENESS 2 $83,500 10 $143,766 111 $109,047 0 $0 0 $0 0 $0
Aggregated Statistics For Year 2001(Based on 8 full and 1 partial tracts) A) FHA, FSA/RHS & VA B) Conventional C) Refinancings D) Home Improvement Loans E) Loans on Dwellings For 5+ Families F) Non-occupant Loans on Number Average Value Number Average Value Number Average Value Number Average Value Number Average Value Number Average Value
LOANS ORIGINATED 111 $106,471 536 $117,773 1,110 $94,876 167 $22,861 7 $166,143 56 $82,420 APPLICATIONS APPROVED, NOT ACCEPTED 6 $123,333 46 $106,060 168 $83,106 28 $17,008 0 $0 3 $48,970 APPLICATIONS DENIED 7 $92,040 113 $64,121 310 $74,716 61 $14,891 0 $0 22 $105,500 APPLICATIONS WITHDRAWN 7 $115,041 30 $128,281 202 $84,895 5 $29,014 0 $0 11 $110,273 FILES CLOSED FOR INCOMPLETENESS 1 $74,000 10 $119,915 43 $101,377 1 $3,000 0 $0 1 $70,000
Aggregated Statistics For Year 2000(Based on 8 full and 1 partial tracts) A) FHA, FSA/RHS & VA B) Conventional C) Refinancings D) Home Improvement Loans E) Loans on Dwellings For 5+ Families F) Non-occupant Loans on Number Average Value Number Average Value Number Average Value Number Average Value Number Average Value Number Average Value
LOANS ORIGINATED 120 $96,259 438 $113,456 370 $68,285 153 $19,562 8 $191,744 52 $80,571 APPLICATIONS APPROVED, NOT ACCEPTED 4 $73,000 43 $73,189 98 $70,600 47 $23,480 0 $0 9 $71,598 APPLICATIONS DENIED 11 $89,411 131 $62,744 227 $70,327 93 $21,778 0 $0 8 $60,875 APPLICATIONS WITHDRAWN 5 $98,280 22 $93,796 104 $67,107 9 $36,586 0 $0 4 $82,308 FILES CLOSED FOR INCOMPLETENESS 1 $89,000 1 $138,000 17 $86,372 0 $0 0 $0 0 $0
Aggregated Statistics For Year 1999(Based on 9 full and 1 partial tracts) A) FHA, FSA/RHS & VA B) Conventional C) Refinancings D) Home Improvement Loans E) Loans on Dwellings For 5+ Families F) Non-occupant Loans on Number Average Value Number Average Value Number Average Value Number Average Value Number Average Value Number Average Value
LOANS ORIGINATED 180 $91,539 800 $124,060 948 $87,610 191 $19,820 1 $415,620 57 $84,290 APPLICATIONS APPROVED, NOT ACCEPTED 4 $87,742 81 $88,385 148 $83,822 50 $16,346 0 $0 12 $70,572 APPLICATIONS DENIED 7 $71,361 194 $59,348 201 $79,659 81 $20,378 0 $0 18 $93,016 APPLICATIONS WITHDRAWN 12 $93,250 37 $97,715 204 $73,521 18 $51,954 0 $0 4 $41,860 FILES CLOSED FOR INCOMPLETENESS 2 $79,410 7 $109,509 46 $94,512 3 $41,570 0 $0 0 $0
Detailed mortgage data for all 12 tracts in Portage, MI
Private Mortgage Insurance Companies Aggregated Statistics For Year 2009(Based on 11 full and 1 partial tracts) A) Conventional B) Refinancings C) Non-occupant Loans on Number Average Value Number Average Value Number Average Value
LOANS ORIGINATED 59 $171,329 33 $162,588 1 $115,000 APPLICATIONS APPROVED, NOT ACCEPTED 10 $161,000 10 $159,035 0 $0 APPLICATIONS DENIED 6 $212,260 7 $171,286 0 $0 APPLICATIONS WITHDRAWN 2 $204,500 1 $101,000 0 $0 FILES CLOSED FOR INCOMPLETENESS 0 $0 0 $0 0 $0
Aggregated Statistics For Year 2008(Based on 11 full and 1 partial tracts) A) Conventional B) Refinancings C) Non-occupant Loans on Number Average Value Number Average Value Number Average Value
LOANS ORIGINATED 118 $145,975 36 $141,153 9 $76,147 APPLICATIONS APPROVED, NOT ACCEPTED 41 $159,522 25 $172,132 5 $72,200 APPLICATIONS DENIED 4 $112,000 1 $665,640 3 $297,213 APPLICATIONS WITHDRAWN 3 $104,333 1 $410,000 0 $0 FILES CLOSED FOR INCOMPLETENESS 1 $141,000 0 $0 0 $0
Aggregated Statistics For Year 2007(Based on 11 full and 1 partial tracts) A) Conventional B) Refinancings C) Non-occupant Loans on Number Average Value Number Average Value Number Average Value
LOANS ORIGINATED 186 $133,890 67 $166,885 13 $73,456 APPLICATIONS APPROVED, NOT ACCEPTED 15 $228,907 17 $172,960 2 $107,500 APPLICATIONS DENIED 1 $92,250 0 $0 0 $0 APPLICATIONS WITHDRAWN 2 $165,000 1 $405,000 0 $0 FILES CLOSED FOR INCOMPLETENESS 1 $100,000 2 $203,645 0 $0
Aggregated Statistics For Year 2006(Based on 11 full and 1 partial tracts) A) Conventional B) Refinancings C) Non-occupant Loans on D) Loans On Manufactured Number Average Value Number Average Value Number Average Value Number Average Value
LOANS ORIGINATED 114 $149,706 49 $147,996 10 $92,538 1 $69,000 APPLICATIONS APPROVED, NOT ACCEPTED 12 $171,032 10 $152,068 1 $74,000 0 $0 APPLICATIONS DENIED 0 $0 1 $144,000 0 $0 0 $0 APPLICATIONS WITHDRAWN 2 $80,000 1 $129,000 1 $59,000 0 $0 FILES CLOSED FOR INCOMPLETENESS 1 $118,000 0 $0 0 $0 0 $0
Aggregated Statistics For Year 2005(Based on 11 full and 1 partial tracts) A) Conventional B) Refinancings C) Non-occupant Loans on D) Loans On Manufactured Number Average Value Number Average Value Number Average Value Number Average Value
LOANS ORIGINATED 133 $145,437 48 $144,338 14 $98,041 0 $0 APPLICATIONS APPROVED, NOT ACCEPTED 21 $173,429 19 $154,458 5 $106,600 1 $244,000 APPLICATIONS DENIED 3 $81,667 2 $94,000 0 $0 0 $0 APPLICATIONS WITHDRAWN 9 $149,599 4 $152,500 1 $61,000 0 $0 FILES CLOSED FOR INCOMPLETENESS 0 $0 0 $0 0 $0 0 $0
Aggregated Statistics For Year 2004(Based on 11 full and 1 partial tracts) A) Conventional B) Refinancings C) Non-occupant Loans on Number Average Value Number Average Value Number Average Value
LOANS ORIGINATED 153 $141,052 76 $145,248 19 $104,981 APPLICATIONS APPROVED, NOT ACCEPTED 21 $149,102 27 $135,664 1 $164,000 APPLICATIONS DENIED 0 $0 1 $279,000 0 $0 APPLICATIONS WITHDRAWN 9 $124,889 7 $148,857 0 $0 FILES CLOSED FOR INCOMPLETENESS 0 $0 0 $0 0 $0
Aggregated Statistics For Year 2003(Based on 11 full and 1 partial tracts) A) Conventional B) Refinancings C) Non-occupant Loans on Number Average Value Number Average Value Number Average Value
LOANS ORIGINATED 215 $140,231 198 $139,971 21 $108,935 APPLICATIONS APPROVED, NOT ACCEPTED 20 $143,584 58 $129,348 3 $134,380 APPLICATIONS DENIED 4 $139,000 3 $77,333 4 $106,500 APPLICATIONS WITHDRAWN 6 $158,333 8 $166,401 0 $0 FILES CLOSED FOR INCOMPLETENESS 1 $89,000 0 $0 0 $0
Aggregated Statistics For Year 2002(Based on 8 full and 1 partial tracts) A) Conventional B) Refinancings C) Non-occupant Loans on Number Average Value Number Average Value Number Average Value
LOANS ORIGINATED 119 $130,153 110 $119,198 9 $102,267 APPLICATIONS APPROVED, NOT ACCEPTED 20 $125,006 36 $114,993 3 $101,333 APPLICATIONS DENIED 4 $91,000 1 $79,000 3 $69,000 APPLICATIONS WITHDRAWN 2 $102,180 3 $113,000 1 $90,000 FILES CLOSED FOR INCOMPLETENESS 0 $0 0 $0 0 $0
Aggregated Statistics For Year 2001(Based on 8 full and 1 partial tracts) A) Conventional B) Refinancings C) Non-occupant Loans on Number Average Value Number Average Value Number Average Value
LOANS ORIGINATED 146 $124,496 109 $125,354 9 $70,822 APPLICATIONS APPROVED, NOT ACCEPTED 15 $124,676 21 $125,630 1 $134,000 APPLICATIONS DENIED 4 $155,500 2 $134,500 1 $107,000 APPLICATIONS WITHDRAWN 2 $276,000 0 $0 0 $0 FILES CLOSED FOR INCOMPLETENESS 0 $0 1 $88,000 0 $0
Aggregated Statistics For Year 2000(Based on 8 full and 1 partial tracts) A) Conventional B) Refinancings C) Non-occupant Loans on Number Average Value Number Average Value Number Average Value
LOANS ORIGINATED 168 $119,201 30 $105,377 11 $76,818 APPLICATIONS APPROVED, NOT ACCEPTED 8 $117,788 4 $98,405 1 $52,000 APPLICATIONS DENIED 3 $90,667 1 $144,000 0 $0 APPLICATIONS WITHDRAWN 1 $182,290 2 $146,000 0 $0 FILES CLOSED FOR INCOMPLETENESS 0 $0 0 $0 0 $0
Aggregated Statistics For Year 1999(Based on 9 full and 1 partial tracts) A) Conventional B) Refinancings C) Non-occupant Loans on Number Average Value Number Average Value Number Average Value
LOANS ORIGINATED 272 $122,882 62 $109,863 7 $76,841 APPLICATIONS APPROVED, NOT ACCEPTED 6 $112,713 12 $139,303 0 $0 APPLICATIONS DENIED 1 $94,820 3 $64,403 0 $0 APPLICATIONS WITHDRAWN 3 $158,860 2 $99,145 0 $0 FILES CLOSED FOR INCOMPLETENESS 0 $0 1 $72,760 0 $0
Fire-safe hotels and motels in Portage, Michigan:
Courtyard By Marriott, 400 Trade Ctr Way, Portage, Michigan 49002 Phone: (269) 382-5808, Fax: (269) 382-5801
Homewood Suites by Hilton, 500 Trade Ctr Way, Portage, Michigan 49002 Phone: (269) 382-5817, Fax: (269) 382-5818
All 2 fire-safe hotels and motels in Portage, Michigan
Most common first names in Portage, MI among deceased individuals Name Count Lived (average)
John 205 74.4 years Robert 187 71.1 years Mary 157 79.0 years William 147 74.9 years James 124 68.3 years Helen 99 81.8 years Richard 94 68.6 years Margaret 94 81.0 years Dorothy 85 80.4 years George 84 76.1 years
Most common last names in Portage, MI among deceased individuals Last name Count Lived (average)
Smith 75 74.9 years Johnson 60 76.9 years Miller 42 73.9 years Williams 35 74.1 years Martin 32 72.1 years Brown 30 76.9 years Allen 25 76.5 years Adams 23 73.9 years Thompson 21 75.3 years Clark 21 75.1 years
Portage compared to Michigan state average:
Unemployed percentage significantly below state average. Black race population percentage below state average. Length of stay since moving in significantly above state average. Percentage of population with a bachelor's degree or higher above state average.
Top Patent Applicants
Richard A. Derenne (32)
Harry M. Gilbert (24)
Anish Paul (18)
Kurosh Nahavandi (15)
Timothy J. Morscheck (14)
Robert C. Gadwood (13)
Clifford Edwin Lambarth (13)
Marko N. Kostic (12)
Krishna Sandeep Bhimavarapu (11)
Christopher Ryan Sweeney (10)
Total of 712 patent applications in 2008-2024.


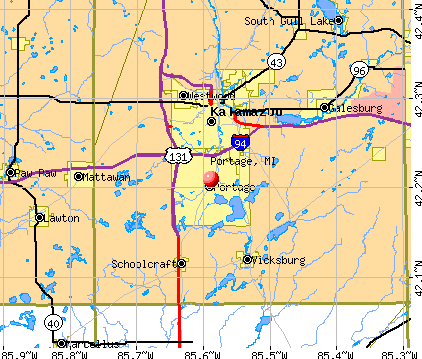


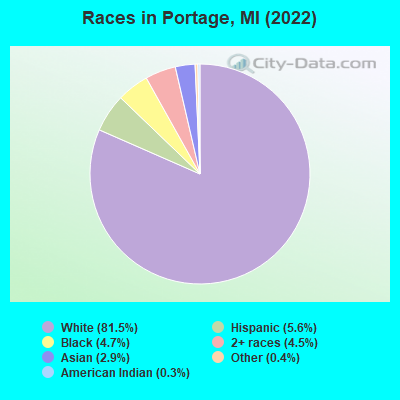

 Recent articles from our blog. Our writers, many of them Ph.D. graduates or candidates, create easy-to-read articles on a wide variety of topics.

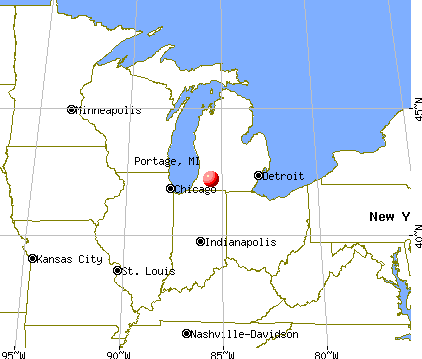
 (4.8 miles
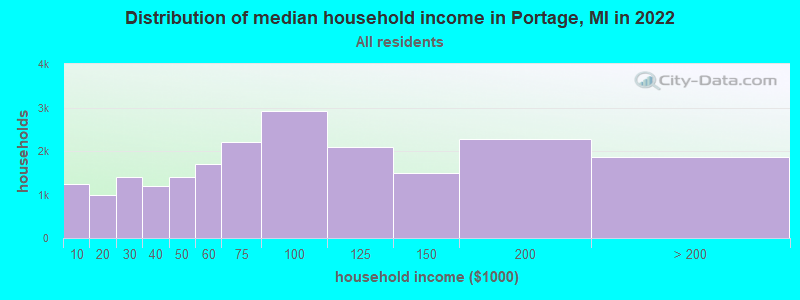
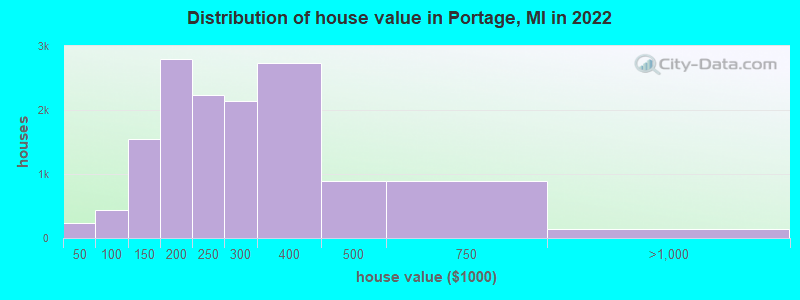

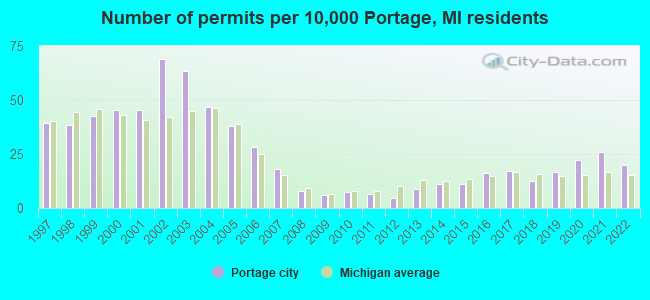
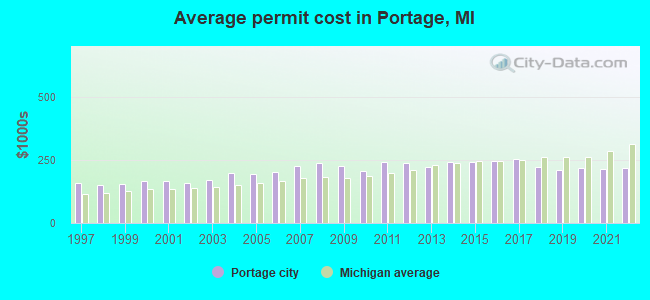
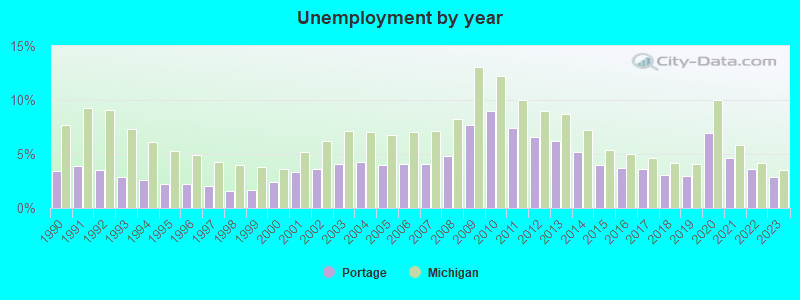

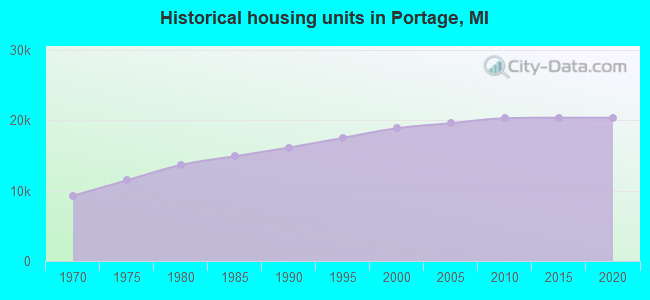
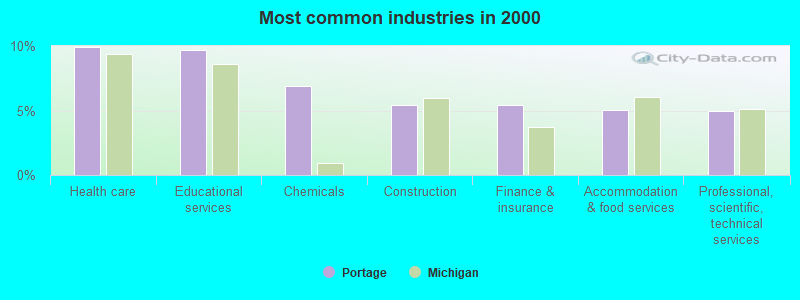
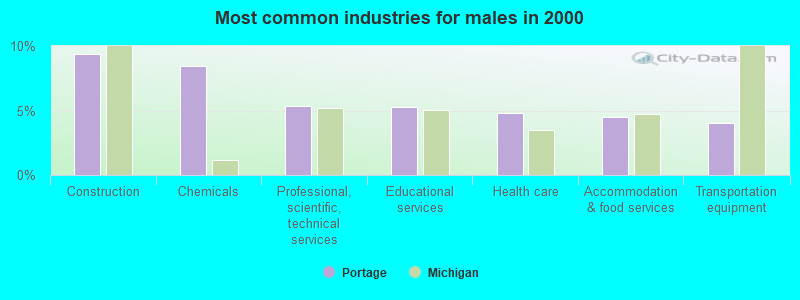
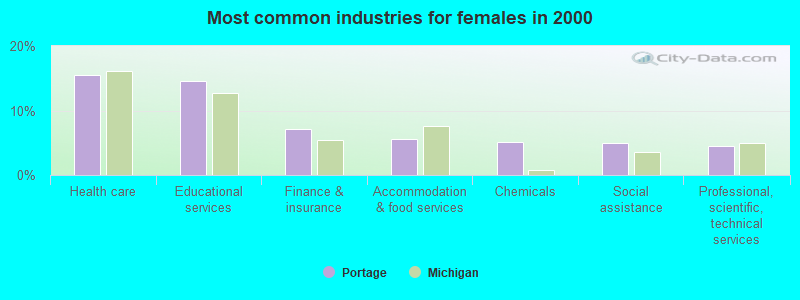
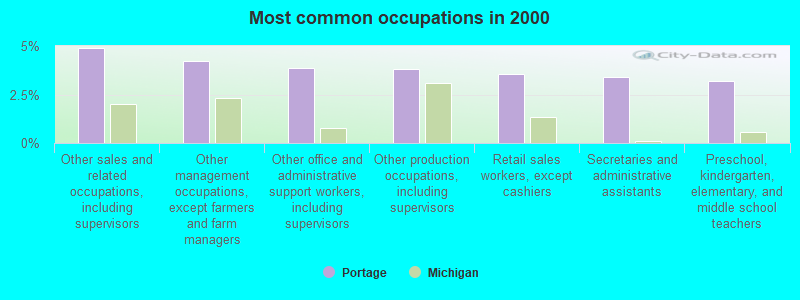
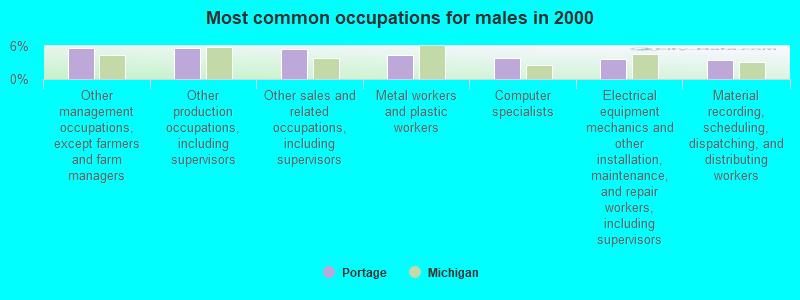
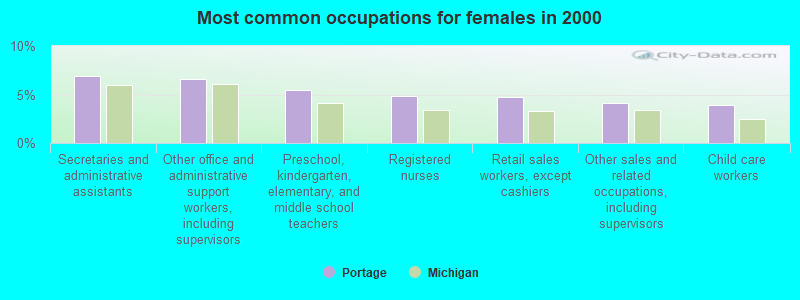


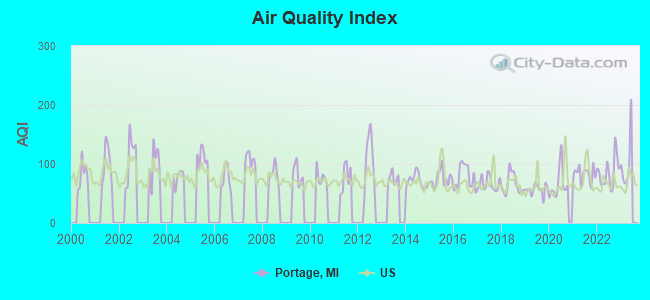
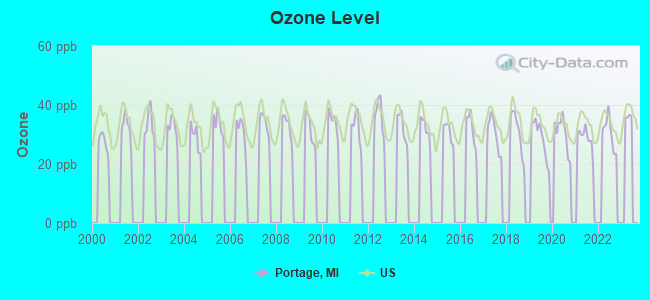
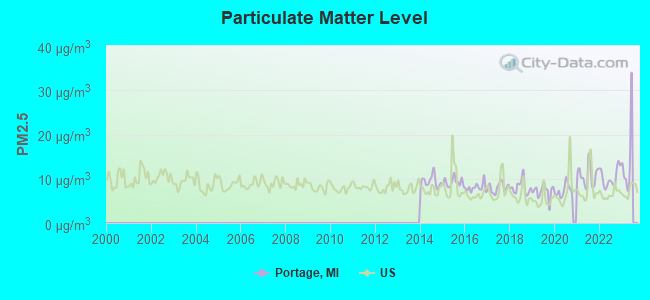

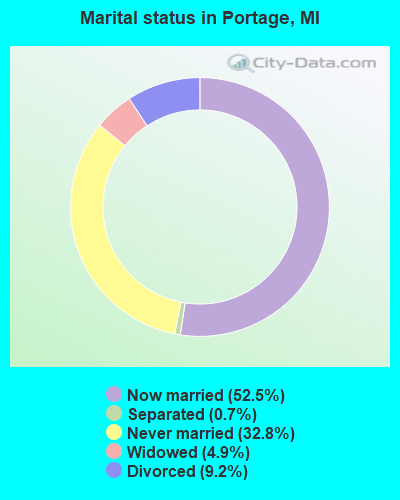
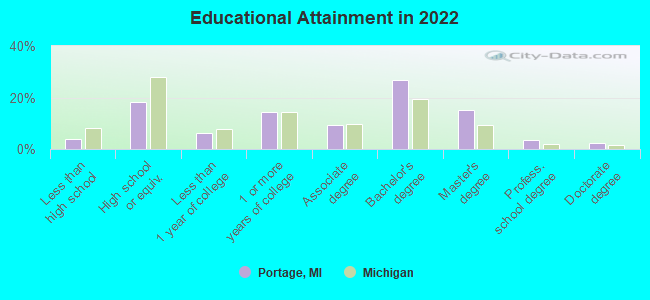
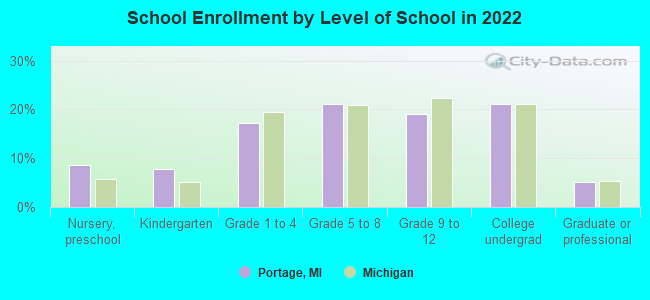
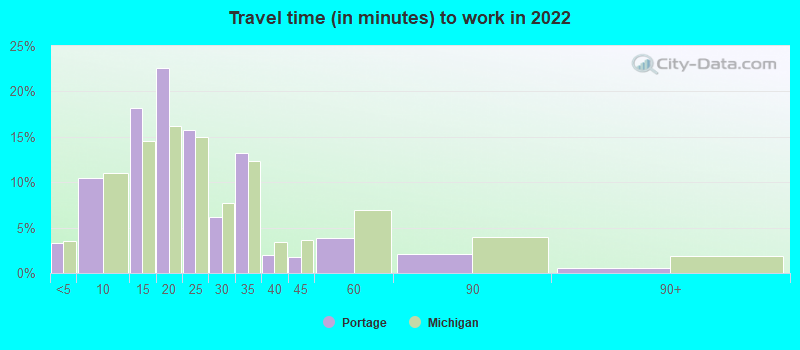
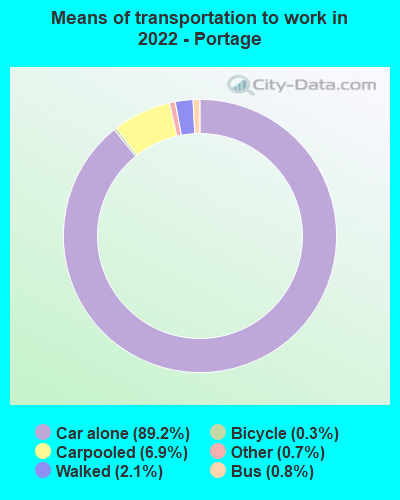
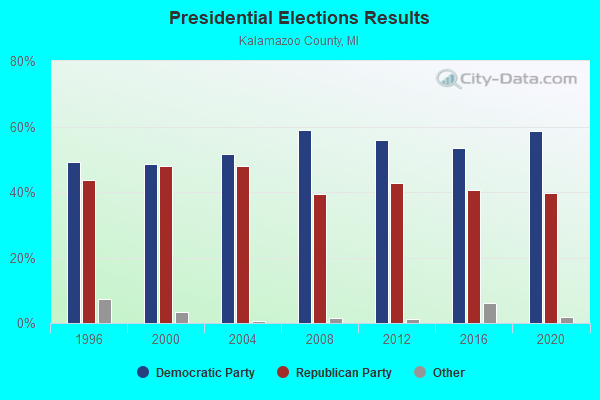
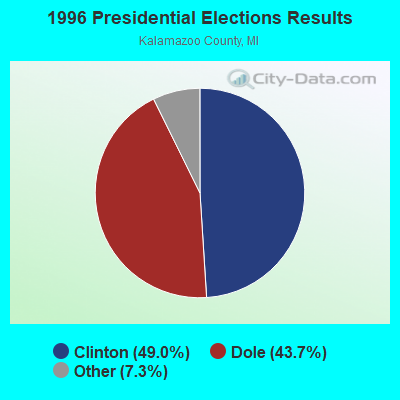
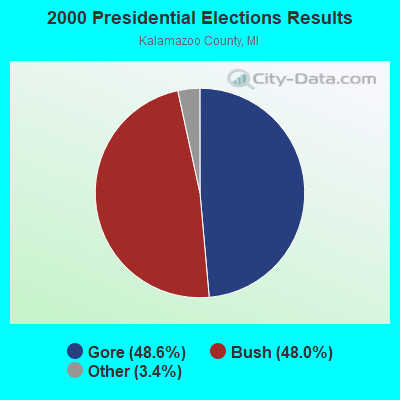
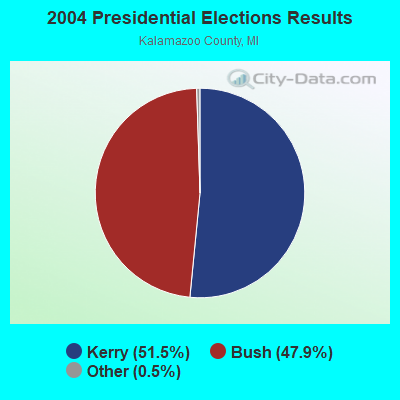

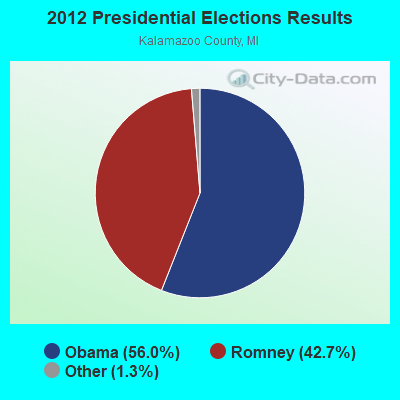
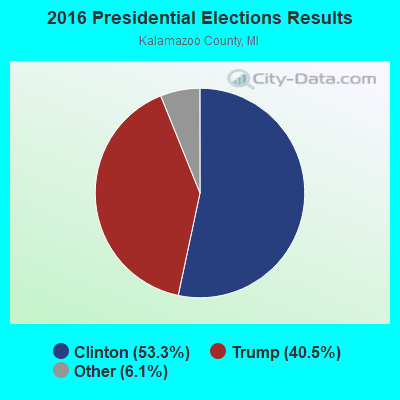
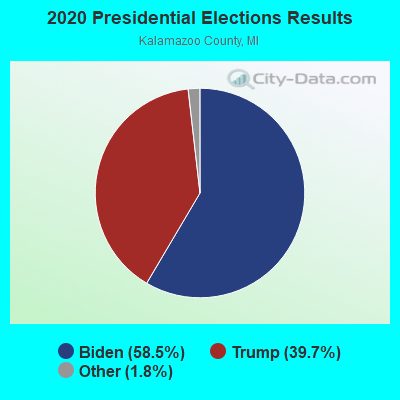
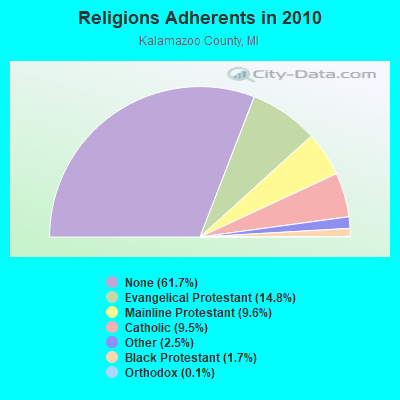
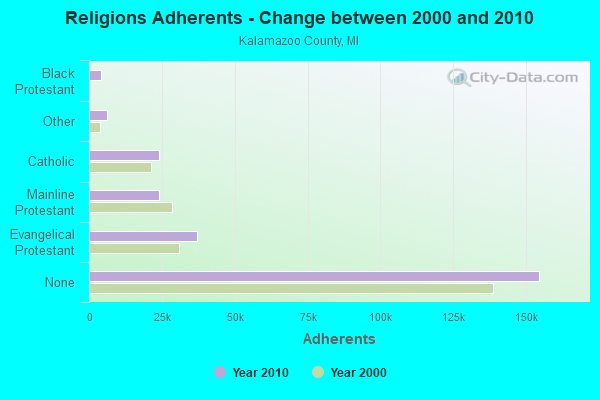
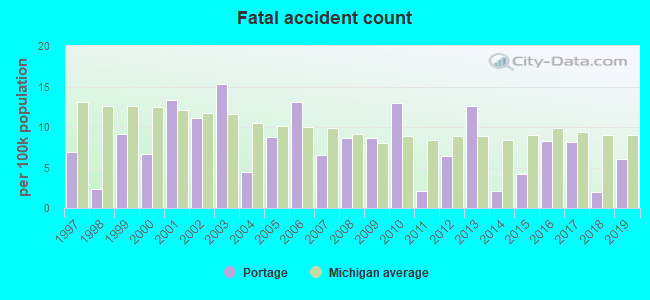
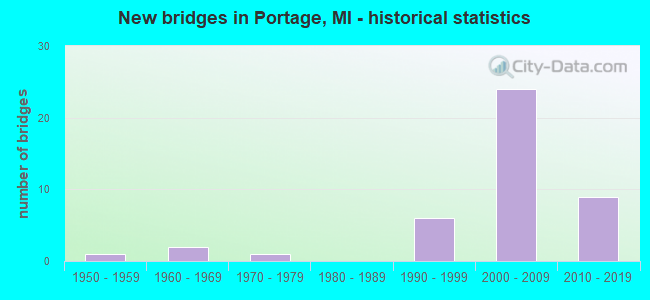
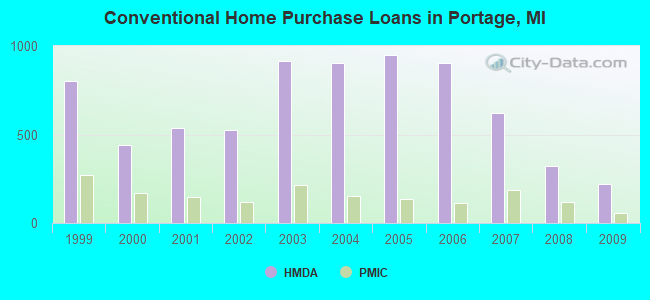
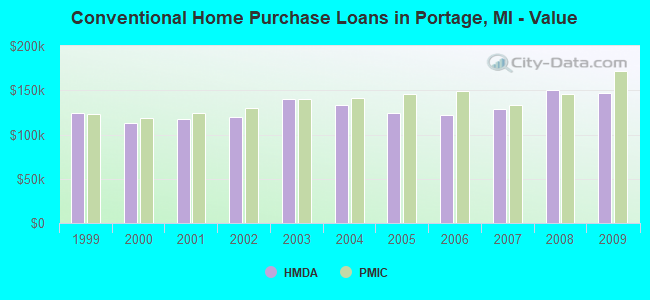
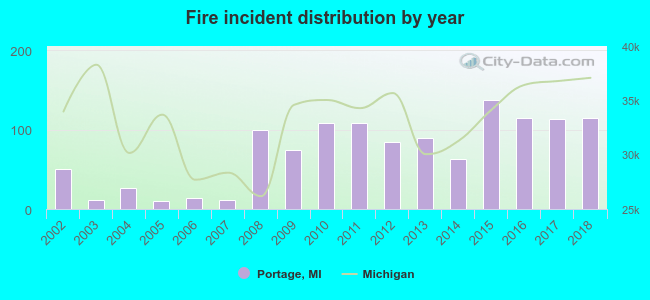 Based on the data from the years 2002 - 2018 the average number of fires per year is 72. The highest number of fires - 137 took place in 2015, and the least - 10 in 2005. The data has an increasing trend.
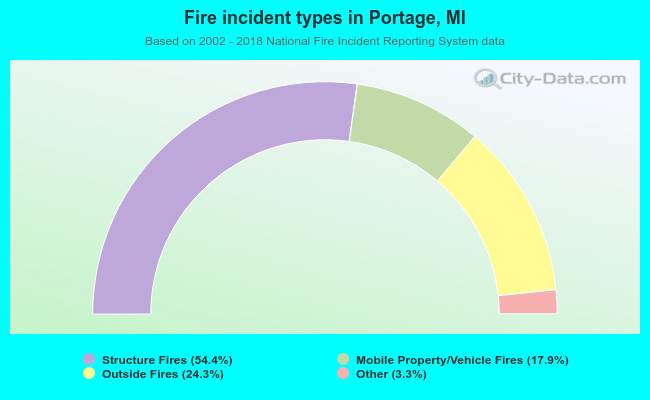 When looking into fire subcategories, the most reports belonged to: Structure Fires (54.4%), and Outside Fires (24.3%).