Estimated median house or condo value in 2022: $383,940 (it was $154,700 in 2000)
Prospect Park:
$383,940
NJ:
$428,900
Mean prices in 2022:all housing units: $452,665; detached houses: $472,210; townhouses or other attached units: $393,680; in 2-unit structures: $480,413; in 3-to-4-unit structures: $364,785; in 5-or-more-unit structures: $297,736; mobile homes: $421,964
Median gross rent in 2022: $1,712.
March 2022 cost of living index in Prospect Park: 123.3 (high, U.S. average is 100)
Percentage of residents living in poverty in 2022: 17.3%
(12.3% for White Non-Hispanic residents, 15.1% for Black residents, 17.5% for Hispanic or Latino residents, 23.9% for other race residents, 52.4% for two or more races residents)
According to our research of New Jersey and other state lists, there were 4 registered sex offenders living in Prospect Park, New Jersey as of June 16, 2024. The ratio of all residents to sex offenders in Prospect Park is 1,482 to 1. The ratio of registered sex offenders to all residents in this city is near the state average.
Crime rates in Prospect Park by year
Type
2009
2010
2011
2012
2013
2014
2015
2016
2017
2018
2019
2020
2021
2022
Murders (per 100,000)
0 (0.0)
0 (0.0)
0 (0.0)
0 (0.0)
1 (16.9)
0 (0.0)
0 (0.0)
0 (0.0)
0 (0.0)
0 (0.0)
0 (0.0)
0 (0.0)
0 (0.0)
0 (0.0)
Rapes (per 100,000)
0 (0.0)
0 (0.0)
0 (0.0)
0 (0.0)
1 (16.9)
0 (0.0)
0 (0.0)
0 (0.0)
0 (0.0)
1 (17.0)
2 (34.3)
1 (17.1)
0 (0.0)
0 (0.0)
Robberies (per 100,000)
9 (161.5)
7 (119.4)
5 (85.0)
3 (50.8)
5 (84.7)
6 (101.1)
0 (0.0)
3 (50.5)
1 (16.8)
3 (50.9)
1 (17.1)
3 (51.4)
0 (0.0)
2 (32.1)
Assaults (per 100,000)
16 (287.0)
6 (102.3)
8 (135.9)
5 (84.7)
4 (67.8)
3 (50.6)
5 (84.2)
11 (185.2)
2 (33.6)
1 (17.0)
2 (34.3)
2 (34.3)
0 (0.0)
0 (0.0)
Burglaries (per 100,000)
22 (394.7)
54 (920.7)
35 (594.7)
31 (525.2)
47 (796.2)
27 (455.1)
31 (522.1)
4 (67.3)
27 (454.2)
17 (288.5)
12 (205.8)
14 (240.0)
28 (462.2)
16 (257.0)
Thefts (per 100,000)
67 (1,202)
81 (1,381)
106 (1,801)
67 (1,135)
73 (1,237)
70 (1,180)
58 (976.9)
85 (1,431)
72 (1,211)
66 (1,120)
62 (1,063)
79 (1,354)
36 (594.3)
57 (915.7)
Auto thefts (per 100,000)
8 (143.5)
11 (187.6)
18 (305.9)
12 (203.3)
20 (338.8)
12 (202.3)
19 (320.0)
12 (202.0)
14 (235.5)
12 (203.6)
9 (154.3)
5 (85.7)
10 (165.1)
5 (80.3)
Arson (per 100,000)
1 (17.9)
1 (17.1)
1 (17.0)
0 (0.0)
0 (0.0)
0 (0.0)
0 (0.0)
0 (0.0)
0 (0.0)
0 (0.0)
0 (0.0)
0 (0.0)
0 (0.0)
1 (16.1)
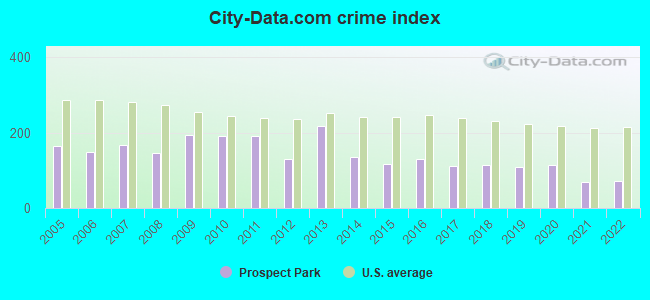
City-Data.com crime index
193.0
191.0
190.8
130.6
218.7
135.7
118.1
130.3
110.9
113.5
108.7
113.8
69.3
70.7
The City-Data.com crime index weighs serious crimes and violent crimes more heavily. Higher means more crime, U.S. average is 246.1. It adjusts for the number of visitors and daily workers commuting into cities.
Latest news from Prospect Park, NJ collected exclusively by city-data.com from local newspapers, TV, and radio stations
Ancestries: Italian (3.6%), Haitian (2.5%), Albanian (2.4%), American (2.3%), German (1.6%), African (1.4%).
Current Local Time: EST time zone
Incorporated in 1901
Land area: 0.48 square miles.
Population density: 13,015 people per square mile (very high).
2,434 residents are foreign born (31.7% Latin America, 4.5% Asia).
This borough:
39.1%
New Jersey:
23.2%
Median real estate property taxes paid for housing units with mortgages in 2022: $10,001 (2.4%) Median real estate property taxes paid for housing units with no mortgage in 2022: $10,001 (3.4%)
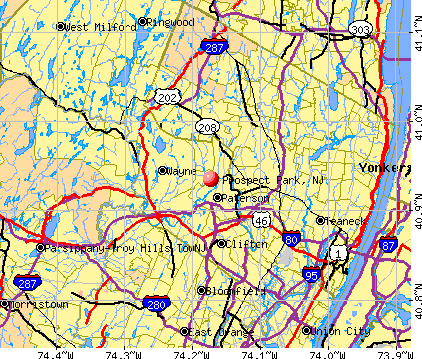
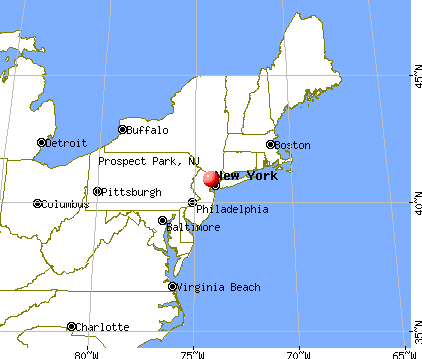
Nearest city with pop. 50,000+: Paterson, NJ (1.5 miles , pop. 149,222).
Nearest city with pop. 200,000+: Newark, NJ (13.9 miles , pop. 273,546).
Nearest city with pop. 1,000,000+: Manhattan, NY (15.5 miles , pop. 1,537,195).
Air Quality Index (AQI) level in 2023 was 113. This is significantly worse than average.
City:
113
U.S.:
73
Carbon Monoxide (CO) [ppm] level in 2023 was 0.330. This is worse than average.Closest monitor was 1.0 miles away from the city center.
City:
0.330
U.S.:
0.251
Nitrogen Dioxide (NO2) [ppb] level in 2023 was 15.1. This is significantly worse than average.Closest monitor was 1.7 miles away from the city center.
City:
15.1
U.S.:
5.1
Sulfur Dioxide (SO2) [ppb] level in 2023 was 0.470. This is significantly better than average.Closest monitor was 1.0 miles away from the city center.
City:
0.470
U.S.:
1.515
Ozone [ppb] level in 2023 was 30.1. This is about average.Closest monitor was 7.9 miles away from the city center.
City:
30.1
U.S.:
33.3
Particulate Matter (PM10) [µg/m3] level in 2003 was 26.9. This is worse than average.Closest monitor was 9.5 miles away from the city center.
City:
26.9
U.S.:
19.2
Particulate Matter (PM2.5) [µg/m3] level in 2023 was 9.07. This is about average.Closest monitor was 1.2 miles away from the city center.
City:
9.07
U.S.:
8.11
Lead (Pb) [µg/m3] level in 2008 was 0.0125. This is worse than average.Closest monitor was 1.2 miles away from the city center.
City:
0.0125
U.S.:
0.0093
Tornado activity:
Prospect Park-area historical tornado activity is near New Jersey state average. It is 35% smaller than the overall U.S. average.
On 5/28/1973, a category F3 (max. wind speeds 158-206 mph) tornado 19.5 miles away from the Prospect Park borough center causedbetween $50,000 and $500,000 in damages.
On 5/28/1973, a category F3 tornado 29.2 miles away from the borough center injured 12 peopleand causedbetween $50,000 and $500,000 in damages.
Earthquake activity:
Prospect Park-area historical earthquake activity is significantly above New Jersey state average. It is 68% smaller than the overall U.S. average.
On 8/23/2011 at 17:51:04, a magnitude 5.8 (5.8 MW, Depth: 3.7 mi, Class: Moderate, Intensity: VI - VII) earthquake occurred 290.2 miles away from the city center On 10/7/1983 at 10:18:46, a magnitude 5.3 (5.1 MB, 5.3 LG, 5.1 ML) earthquake occurred 208.9 miles away from the city center On 1/16/1994 at 01:49:16, a magnitude 4.6 (4.6 MB, 4.6 LG, Depth: 3.1 mi, Class: Light, Intensity: IV - V) earthquake occurred 106.4 miles away from Prospect Park center On 4/20/2002 at 10:50:47, a magnitude 5.3 (5.3 ML, Depth: 3.0 mi) earthquake occurred 248.6 miles away from Prospect Park center On 4/20/2002 at 10:50:47, a magnitude 5.2 (5.2 MB, 4.2 MS, 5.2 MW, 5.0 MW) earthquake occurred 246.7 miles away from Prospect Park center On 1/16/1994 at 00:42:43, a magnitude 4.2 (4.2 MB, 4.0 LG, Depth: 3.1 mi) earthquake occurred 105.1 miles away from the city center Magnitude types: regional Lg-wave magnitude (LG), body-wave magnitude (MB), local magnitude (ML), surface-wave magnitude (MS), moment magnitude (MW)
Natural disasters:
The number of natural disasters in Passaic County (27) is a lot greater than the US average (15). Major Disasters (Presidential) Declared: 16 Emergencies Declared: 10
Causes of natural disasters: Hurricanes: 7, Floods: 6, Storms: 5, Heavy Rains: 3, Snowstorms: 3, Blizzards: 2, Water Shortages: 2, Winter Storms: 2, Power Outage: 1, Tornado: 1, Tropical Storm: 1, Wind: 1, Other: 3 (Note: some incidents may be assigned to more than one category).
Hospitals and medical centers near Prospect Park:
DOCTORS SUBACUTE CARE (Nursing Home, about 2 miles away; PATERSON, NJ)
PREAKNESS HEALTHCARE CENTER (Nursing Home, about 2 miles away; WAYNE, NJ)
ST JOSEPH'S WAYNE HOSPITAL (Hospital, about 2 miles away; WAYNE, NJ)
REGENCY GARDENS NURSING CENTER (Nursing Home, about 2 miles away; WAYNE, NJ)
BARNERT HOSPITAL (Hospital, about 2 miles away; PATERSON, NJ)
BARNERT SUBACUTE REHABILITATION CENTER, LLC (Nursing Home, about 2 miles away; PATERSON, NJ)
ST JOSEPH'S HOME FOR ELDERLY (Nursing Home, about 3 miles away; TOTOWA, NJ)
Amtrak stations near Prospect Park:
14 miles: NEWARK (RAYMOND PLAZA WEST) . Services: ticket office, fully wheelchair accessible, enclosed waiting area, public restrooms, public payphones, snack bar, ATM, paid short-term parking, paid long-term parking, call for car rental service, taxi stand, intercity bus service, public transit connection.
15 miles: YONKERS (FOOT OF DOCK ST. & WELLS AVE.) . Services: fully wheelchair accessible, enclosed waiting area, public restrooms, public payphones, snack bar, paid short-term parking, paid long-term parking, call for car rental service, taxi stand, public transit connection.
16 miles: NEW YORK (PENN STA) (NEW YORK, 7TH AVE. & W. 32ND ST.) . Services: ticket office, fully wheelchair accessible, enclosed waiting area, public restrooms, public payphones, full-service food facilities, snack bar, vending machines, ATM, paid short-term parking, paid long-term parking, call for car rental service, taxi stand, public transit connection.
Colleges/universities with over 2000 students nearest to Prospect Park:
Passaic County Community College (about 2 miles; Paterson, NJ; Full-time enrollment: 6,351)
William Paterson University of New Jersey (about 2 miles; Wayne, NJ; FT enrollment: 10,198)
Berkeley College-Woodland Park (about 3 miles; Woodland Park, NJ; FT enrollment: 2,938)
Bergen Community College (about 5 miles; Paramus, NJ; FT enrollment: 11,826)
Montclair State University (about 6 miles; Montclair, NJ; FT enrollment: 16,277)
Ramapo College of New Jersey (about 6 miles; Mahwah, NJ; FT enrollment: 5,864)
Jersey College (about 8 miles; Teterboro, NJ; FT enrollment: 2,073)
Public elementary/middle school in Prospect Park:
PROSPECT PARK SCHOOL NO. 1 (Location: 94 BROWN AVENUE, Grades: PK-8)
Private elementary/middle school in Prospect Park:
AL-HIKMAH ELEMENTARY SCHOOL (Students: 273, Location: 278 N 8TH ST, Grades: PK-6)
Notable locations in Prospect Park: Prospect Park Volunteer Fire Department (A), Prospect Park Minicipal Building (B), Prospect Park Volunteer Fire Department Hose Company (C). Display/hide their locations on the map
Churches in Prospect Park include: Gospel Tabernacle (A), Prospect Park Baptist Church (B), Prospect Park Holland Christian Reformed Church (C), Saint Paul's Roman Catholic Church (D), Second Christian Reformed Church (E). Display/hide their locations on the map
MCL, Monthly (TCR) - Between JUL-2011 and SEP-2011, Contaminant: Coliform. Follow-up actions: St Tech Assistance Visit (AUG-05-2011), St Formal NOV issued (AUG-05-2011), St Public Notif requested (AUG-05-2011), St Boil Water Order (AUG-05-2011), St Compliance achieved (AUG-29-2011)
OCCT/SOWT Study/Recommendation - In MAR-01-2011, Contaminant: Lead and Copper Rule. Follow-up actions: St Formal NOV issued (APR-26-2011), St Compliance achieved (FEB-21-2012)
Public Education - In MAR-01-2011, Contaminant: Lead and Copper Rule. Follow-up actions: St Formal NOV issued (APR-26-2011), St Compliance achieved (FEB-21-2012)
Public Education - In JAN-01-2008, Contaminant: Lead and Copper Rule. Follow-up actions: St Public Notif requested (JAN-23-2008), St Formal NOV issued (JAN-23-2008), St Public Notif received (FEB-08-2008), St Compliance achieved (FEB-08-2008)
Public Education - In JAN-01-2007, Contaminant: Lead and Copper Rule
Past monitoring violations:
Water Quality Parameter M/R - Between JAN-2006 and DEC-2006, Contaminant: Lead and Copper Rule. Follow-up actions: St Public Notif requested (APR-30-2007), St Formal NOV issued (APR-30-2007), St Compliance achieved (FEB-09-2011)
One minor monitoring violation
Average household size:
This borough:
3.3 people
New Jersey:
2.7 people
Percentage of family households:
This borough:
81.0%
Whole state:
69.3%
Percentage of households with unmarried partners:
This borough:
7.1%
Whole state:
5.9%
Likely homosexual households (counted as self-reported same-sex unmarried-partner households)
Lesbian couples: 0.3% of all households
Gay men: 0.1% of all households
2 people in other noninstitutional facilities in 2010
5 people in homes for the mentally retarded in 2000
2 people in religious group quarters in 2000
For population 15 years and over in Prospect Park:
Never married: 47.9%
Now married: 35.6%
Separated: 4.4%
Widowed: 4.3%
Divorced: 7.8%
For population 25 years and over in Prospect Park:
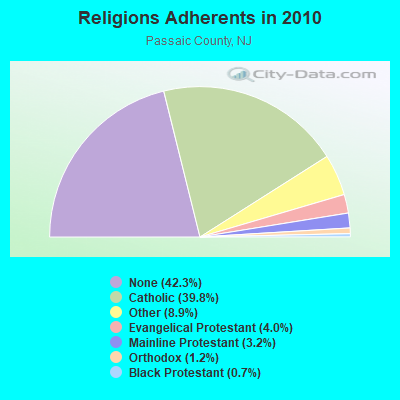
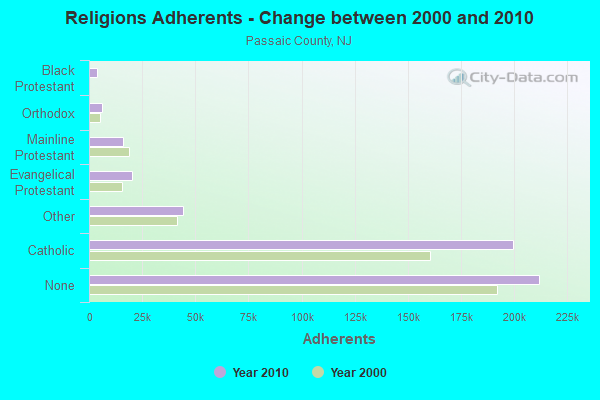
Religion statistics for Prospect Park, NJ (based on Passaic County data)
Religion
Adherents
Congregations
Catholic
199,315
56
Other
44,397
51
Evangelical Protestant
20,164
110
Mainline Protestant
15,796
83
Orthodox
5,990
14
Black Protestant
3,610
16
None
211,954
-
Source: Clifford Grammich, Kirk Hadaway, Richard Houseal, Dale E.Jones, Alexei Krindatch, Richie Stanley and Richard H.Taylor. 2012. 2010 U.S.Religion Census: Religious Congregations & Membership Study. Association of Statisticians of American Religious Bodies. Jones, Dale E., et al. 2002. Congregations and Membership in the United States 2000. Nashville, TN: Glenmary Research Center. Graphs represent county-level data
STATION, Prospect Park (Lat: 40.942861 Lon: -74.171250), Structure height: 18.3 m, Overall height: 21.3 m, Call Sign: WNTQ240, Assigned Frequencies: 952.143 MHz, 928.143 MHz, Grant Date: 09/10/2002, Expiration Date: 10/30/2012, Cancellation Date: 01/05/2013, Phone: (202) 331-9495
NJ-NNJ5946A, 162 North 13th Street (Lat: 40.937167 Lon: -74.175083), Type: Pole, Structure height: 45.7 m, Call Sign: WQLT532, Assigned Frequencies: 21825.0 MHz, 21975.0 MHz, Grant Date: 07/08/2020, Expiration Date: 04/21/2030, Cancellation Date: 04/05/2022, Certifier: Nadja S Sodos-Wallace, Registrant: T-Mobile Usa, Inc., 12920 Se 38th Street, Bellevue, WA 98006, Phone: (425) 383-8401, Fax: (425) 383-4840, Email:
NY5524, 162 North 13th Street (Lat: 40.937389 Lon: -74.174583), Type: Pole, Structure height: 45.7 m, Call Sign: WQQF994, Assigned Frequencies: 19645.0 MHz, 19645.0 MHz, 19645.0 MHz, 19645.0 MHz, 19645.0 MHz, Grant Date: 11/30/2012, Expiration Date: 11/30/2022, Cancellation Date: 04/25/2014, Certifier: Dan Menser, Registrant: T-Mobile License LLC, 12920 Se 38th Street, Bellevue, WA 98006, Phone: (425) 383-8401, Fax: (425) 383-4840, Email:
FCC Registered Amateur Radio Licenses:
7
Call Sign: KB2OCW, Licensee ID: L00254073, Grant Date: 11/06/2012, Expiration Date: 01/26/2023, Certifier: Donald R White, Registrant: Donald R White, 43 N 16th St, Prospect Park, NJ 07508
Call Sign: KB2PRY, Grant Date: 01/05/1993, Expiration Date: 01/05/2003, Cancellation Date: 01/06/2005, Registrant: William Greendyk, 123 Struyk Ave, Prospect Park, NJ 07508
Call Sign: KC2BVU, Grant Date: 06/02/1997, Expiration Date: 06/02/2007, Cancellation Date: 06/03/2009, Registrant: Juan Aguirre, 238 N 8th St, Prospect Park, NJ 07508
Call Sign: N2DTC, Grant Date: 09/14/1998, Expiration Date: 09/14/2008, Cancellation Date: 09/15/2010, Registrant: James V O Grayson, 40 N 17th St, Prospect Park, NJ 07508-1812
Call Sign: W2HUS, Grant Date: 05/03/1988, Expiration Date: 05/03/1998, Cancellation Date: 05/04/2000, Registrant: Herbert F Mucks, 399 N 8th St, Prospect Park, NJ 07508
Call Sign: WB2YSW, Grant Date: 04/05/1988, Expiration Date: 04/05/1998, Cancellation Date: 04/06/2000, Registrant: George Anema, 106 North 16th St, Prospect Park, NJ 07508
Call Sign: KC2MST, Licensee ID: L00834833, Grant Date: 03/22/2004, Expiration Date: 03/22/2014, Cancellation Date: 03/23/2016, Certifier: Gracielle R Cabungcal, Registrant: Gracielle R Cabungcal, 80 N 17th St, Prospect Park, NJ 07508
Home Mortgage Disclosure Act Aggregated Statistics For Year 2009 (Based on 1 full tract)
A) FHA, FSA/RHS & VA Home Purchase Loans
B) Conventional Home Purchase Loans
C) Refinancings
D) Home Improvement Loans
F) Non-occupant Loans on < 5 Family Dwellings (A B C & D)
Number
Average Value
Number
Average Value
Number
Average Value
Number
Average Value
Number
Average Value
LOANS ORIGINATED
24
$221,917
6
$157,167
50
$232,080
1
$134,000
3
$164,000
APPLICATIONS APPROVED, NOT ACCEPTED
2
$128,000
2
$153,000
4
$233,500
1
$23,000
0
$0
APPLICATIONS DENIED
5
$222,800
2
$191,500
37
$268,000
6
$128,833
4
$382,750
APPLICATIONS WITHDRAWN
3
$206,667
1
$127,000
14
$323,429
1
$193,000
1
$127,000
FILES CLOSED FOR INCOMPLETENESS
0
$0
1
$85,000
2
$187,500
0
$0
0
$0
Aggregated Statistics For Year 2008 (Based on 1 full tract)
A) FHA, FSA/RHS & VA Home Purchase Loans
B) Conventional Home Purchase Loans
C) Refinancings
D) Home Improvement Loans
E) Loans on Dwellings For 5+ Families
F) Non-occupant Loans on < 5 Family Dwellings (A B C & D)
G) Loans On Manufactured Home Dwelling (A B C & D)
Number
Average Value
Number
Average Value
Number
Average Value
Number
Average Value
Number
Average Value
Number
Average Value
Number
Average Value
LOANS ORIGINATED
12
$261,917
18
$199,778
30
$265,133
8
$39,250
2
$131,000
7
$215,714
1
$65,000
APPLICATIONS APPROVED, NOT ACCEPTED
2
$312,500
6
$260,167
15
$272,133
3
$67,667
0
$0
2
$264,500
0
$0
APPLICATIONS DENIED
1
$315,000
11
$211,455
45
$285,422
10
$88,100
0
$0
4
$210,000
0
$0
APPLICATIONS WITHDRAWN
3
$228,667
3
$315,000
10
$294,300
0
$0
0
$0
0
$0
0
$0
FILES CLOSED FOR INCOMPLETENESS
1
$197,000
0
$0
3
$416,667
0
$0
0
$0
0
$0
0
$0
Aggregated Statistics For Year 2007 (Based on 1 full tract)
A) FHA, FSA/RHS & VA Home Purchase Loans
B) Conventional Home Purchase Loans
C) Refinancings
D) Home Improvement Loans
F) Non-occupant Loans on < 5 Family Dwellings (A B C & D)
Number
Average Value
Number
Average Value
Number
Average Value
Number
Average Value
Number
Average Value
LOANS ORIGINATED
4
$335,250
45
$227,600
93
$277,946
15
$113,333
14
$204,643
APPLICATIONS APPROVED, NOT ACCEPTED
1
$330,000
8
$264,500
25
$290,640
4
$41,250
3
$298,333
APPLICATIONS DENIED
1
$297,000
21
$287,190
139
$296,561
19
$79,895
11
$280,909
APPLICATIONS WITHDRAWN
2
$320,000
22
$219,091
52
$266,173
1
$60,000
11
$380,636
FILES CLOSED FOR INCOMPLETENESS
0
$0
5
$301,000
14
$271,714
0
$0
0
$0
Aggregated Statistics For Year 2006 (Based on 1 full tract)
A) FHA, FSA/RHS & VA Home Purchase Loans
B) Conventional Home Purchase Loans
C) Refinancings
D) Home Improvement Loans
F) Non-occupant Loans on < 5 Family Dwellings (A B C & D)
G) Loans On Manufactured Home Dwelling (A B C & D)
Number
Average Value
Number
Average Value
Number
Average Value
Number
Average Value
Number
Average Value
Number
Average Value
LOANS ORIGINATED
0
$0
101
$232,564
188
$249,000
30
$90,933
30
$251,300
0
$0
APPLICATIONS APPROVED, NOT ACCEPTED
1
$376,000
18
$238,222
39
$206,615
13
$32,923
4
$240,000
0
$0
APPLICATIONS DENIED
1
$357,000
61
$257,148
100
$253,290
39
$100,308
28
$295,607
0
$0
APPLICATIONS WITHDRAWN
0
$0
26
$231,115
59
$272,085
6
$114,167
11
$245,000
1
$45,000
FILES CLOSED FOR INCOMPLETENESS
0
$0
11
$261,909
13
$278,231
0
$0
2
$296,500
0
$0
Aggregated Statistics For Year 2005 (Based on 1 full tract)
A) FHA, FSA/RHS & VA Home Purchase Loans
B) Conventional Home Purchase Loans
C) Refinancings
D) Home Improvement Loans
E) Loans on Dwellings For 5+ Families
F) Non-occupant Loans on < 5 Family Dwellings (A B C & D)
G) Loans On Manufactured Home Dwelling (A B C & D)
Number
Average Value
Number
Average Value
Number
Average Value
Number
Average Value
Number
Average Value
Number
Average Value
Number
Average Value
LOANS ORIGINATED
8
$304,750
140
$210,464
190
$237,916
24
$153,833
1
$228,000
37
$231,297
0
$0
APPLICATIONS APPROVED, NOT ACCEPTED
1
$371,000
14
$187,143
33
$190,758
5
$40,000
0
$0
5
$214,000
1
$183,000
APPLICATIONS DENIED
1
$438,000
45
$207,356
98
$223,122
24
$83,542
0
$0
9
$184,000
1
$256,000
APPLICATIONS WITHDRAWN
1
$276,000
21
$236,286
65
$211,585
12
$141,250
0
$0
13
$245,077
0
$0
FILES CLOSED FOR INCOMPLETENESS
0
$0
11
$176,636
32
$243,219
0
$0
0
$0
3
$210,667
0
$0
Aggregated Statistics For Year 2004 (Based on 1 full tract)
A) FHA, FSA/RHS & VA Home Purchase Loans
B) Conventional Home Purchase Loans
C) Refinancings
D) Home Improvement Loans
F) Non-occupant Loans on < 5 Family Dwellings (A B C & D)
G) Loans On Manufactured Home Dwelling (A B C & D)
Number
Average Value
Number
Average Value
Number
Average Value
Number
Average Value
Number
Average Value
Number
Average Value
LOANS ORIGINATED
17
$286,294
95
$224,726
176
$195,562
17
$59,824
25
$223,680
0
$0
APPLICATIONS APPROVED, NOT ACCEPTED
1
$345,000
19
$238,895
43
$185,256
5
$23,000
0
$0
0
$0
APPLICATIONS DENIED
1
$281,000
19
$224,000
95
$197,947
26
$39,000
8
$153,500
1
$35,000
APPLICATIONS WITHDRAWN
3
$306,667
22
$238,864
39
$210,231
3
$13,667
7
$212,714
0
$0
FILES CLOSED FOR INCOMPLETENESS
1
$347,000
4
$101,500
17
$232,824
1
$233,000
1
$74,000
0
$0
Aggregated Statistics For Year 2003 (Based on 1 full tract)
A) FHA, FSA/RHS & VA Home Purchase Loans
B) Conventional Home Purchase Loans
C) Refinancings
D) Home Improvement Loans
E) Loans on Dwellings For 5+ Families
F) Non-occupant Loans on < 5 Family Dwellings (A B C & D)
Number
Average Value
Number
Average Value
Number
Average Value
Number
Average Value
Number
Average Value
Number
Average Value
LOANS ORIGINATED
25
$240,480
43
$210,349
267
$163,929
16
$67,562
0
$0
31
$166,000
APPLICATIONS APPROVED, NOT ACCEPTED
1
$289,000
7
$187,429
62
$152,371
2
$12,500
0
$0
4
$211,250
APPLICATIONS DENIED
0
$0
9
$175,556
129
$166,566
18
$23,556
1
$25,000
6
$186,667
APPLICATIONS WITHDRAWN
3
$240,333
7
$208,857
68
$162,382
4
$26,500
0
$0
2
$260,000
FILES CLOSED FOR INCOMPLETENESS
0
$0
0
$0
12
$169,833
0
$0
0
$0
0
$0
Aggregated Statistics For Year 2002 (Based on 1 full tract)
A) FHA, FSA/RHS & VA Home Purchase Loans
B) Conventional Home Purchase Loans
C) Refinancings
D) Home Improvement Loans
F) Non-occupant Loans on < 5 Family Dwellings (A B C & D)
Number
Average Value
Number
Average Value
Number
Average Value
Number
Average Value
Number
Average Value
LOANS ORIGINATED
25
$210,560
55
$178,236
146
$144,596
25
$29,880
11
$149,273
APPLICATIONS APPROVED, NOT ACCEPTED
1
$218,000
8
$152,250
35
$139,829
11
$34,727
4
$202,500
APPLICATIONS DENIED
4
$199,500
9
$178,556
84
$124,524
33
$38,091
6
$110,667
APPLICATIONS WITHDRAWN
3
$198,000
6
$214,000
45
$131,311
5
$36,000
4
$134,500
FILES CLOSED FOR INCOMPLETENESS
0
$0
0
$0
25
$152,120
0
$0
0
$0
Aggregated Statistics For Year 2001 (Based on 1 full tract)
A) FHA, FSA/RHS & VA Home Purchase Loans
B) Conventional Home Purchase Loans
C) Refinancings
D) Home Improvement Loans
F) Non-occupant Loans on < 5 Family Dwellings (A B C & D)
Number
Average Value
Number
Average Value
Number
Average Value
Number
Average Value
Number
Average Value
LOANS ORIGINATED
27
$171,852
43
$142,581
97
$139,299
27
$27,259
9
$136,222
APPLICATIONS APPROVED, NOT ACCEPTED
3
$153,000
6
$114,500
18
$119,111
11
$25,091
3
$108,667
APPLICATIONS DENIED
2
$250,000
9
$161,778
88
$99,466
30
$23,733
3
$84,667
APPLICATIONS WITHDRAWN
2
$165,000
13
$148,154
35
$132,371
11
$20,182
2
$177,000
FILES CLOSED FOR INCOMPLETENESS
2
$167,000
2
$166,000
11
$124,636
1
$85,000
1
$105,000
Aggregated Statistics For Year 2000 (Based on 1 full tract)
A) FHA, FSA/RHS & VA Home Purchase Loans
B) Conventional Home Purchase Loans
C) Refinancings
D) Home Improvement Loans
F) Non-occupant Loans on < 5 Family Dwellings (A B C & D)
Number
Average Value
Number
Average Value
Number
Average Value
Number
Average Value
Number
Average Value
LOANS ORIGINATED
29
$166,862
42
$143,238
30
$90,767
18
$27,611
3
$111,000
APPLICATIONS APPROVED, NOT ACCEPTED
2
$139,500
4
$115,500
14
$79,429
7
$17,143
2
$92,000
APPLICATIONS DENIED
2
$128,500
13
$133,154
44
$75,591
31
$21,677
2
$27,500
APPLICATIONS WITHDRAWN
1
$217,000
5
$100,000
30
$91,700
4
$14,750
0
$0
FILES CLOSED FOR INCOMPLETENESS
2
$181,500
1
$109,000
17
$124,118
1
$30,000
1
$30,000
Aggregated Statistics For Year 1999 (Based on 1 partial tract)
A) FHA, FSA/RHS & VA Home Purchase Loans
B) Conventional Home Purchase Loans
C) Refinancings
D) Home Improvement Loans
F) Non-occupant Loans on < 5 Family Dwellings (A B C & D)
Detailed PMIC statistics for the following Tracts:2036.00
2004 - 2018 National Fire Incident Reporting System (NFIRS) incidents
According to the data from the years 2004 - 2018 the average number of fire incidents per year is 12. The highest number of reported fire incidents - 22 took place in 2012, and the least - 2 in 2011. The data has a growing trend.
When looking into fire subcategories, the most reports belonged to: Structure Fires (62.4%), and Outside Fires (28.1%).
Fire incident types reported to NFIRS in Prospect Park, NJ
#6 on the list of "Top 101 cities with the most residents born in Peru (population 500+)"
#7 on the list of "Top 101 cities with the most residents born in Syria (population 500+)"
#17 on the list of "Top 101 cities with the most residents born in Dominican Republic (population 500+)"
#27 on the list of "Top 101 cities with largest percentage of males in occupations: transportation occupations (population 5,000+)"
#41 on the list of "Top 101 cities with largest percentage of males in industries: wholesale trade (population 5,000+)"
#43 on the list of "Top 101 cities with the most residents born in South America (population 500+)"
#64 on the list of "Top 101 cities with largest percentage of females in industries: management of companies and enterprises (population 5,000+)"
#70 on the list of "Top 101 cities with the most residents born in Colombia (population 500+)"
#75 on the list of "Top 101 cities with the most residents born in Jamaica (population 500+)"
#77 on the list of "Top 101 cities with the most residents born in Other Caribbean (population 500+)"
#78 on the list of "Top 101 cities with the most residents born in Ecuador (population 500+)"
#84 on the list of "Top 100 cities with old houses but young residents (pop. 5,000+)"
#71 (07508) on the list of "Top 101 zip codes with the largest percentage of Dutch first ancestries (pop 5,000+)"
#19 on the list of "Top 101 counties with the lowest percentage of residents that exercised in the past month"
#22 on the list of "Top 101 counties with the largest number of people moving out compared to moving in (pop. 50,000+)"
#23 on the list of "Top 101 counties with the largest decrease in the number of infant deaths per 1000 residents 2000-2006 to 2007-2013 (pop. 50,000+)"
#24 on the list of "Top 101 counties with the highest surface withdrawal of fresh water for public supply (pop. 50,000+)"
#25 on the list of "Top 101 counties with the lowest percentage of residents that keep firearms around their homes"


 Recent articles from our blog. Our writers, many of them Ph.D. graduates or candidates, create easy-to-read articles on a wide variety of topics.

 (1.5 miles


 According to the data from the years 2004 - 2018 the average number of fire incidents per year is 12. The highest number of reported fire incidents - 22 took place in 2012, and the least - 2 in 2011. The data has a growing trend.
 When looking into fire subcategories, the most reports belonged to: Structure Fires (62.4%), and Outside Fires (28.1%).

