Shakopee, Minnesota Submit your own pictures of this city and show them to the world
OSM Map
General Map
Google Map
MSN Map
OSM Map
General Map
Google Map
MSN Map
OSM Map
General Map
Google Map
MSN Map
OSM Map
General Map
Google Map
MSN Map
Please wait while loading the map...
Population in 2022: 45,735 (96% urban, 4% rural). Population change since 2000: +122.4%Males: 22,068 Females: 23,667
March 2022 cost of living index in Shakopee: 113.9 (more than average, U.S. average is 100) Percentage of residents living in poverty in 2022: 6.8%for White Non-Hispanic residents , 22.4% for Black residents , 4.1% for Hispanic or Latino residents , 12.1% for American Indian residents , 7.3% for other race residents , 2.6% for two or more races residents )
Profiles of local businesses
Business Search - 14 Million verified businesses
Data:
Median household income ($)
Median household income (% change since 2000)
Household income diversity
Ratio of average income to average house value (%)
Ratio of average income to average rent
Median household income ($) - White
Median household income ($) - Black or African American
Median household income ($) - Asian
Median household income ($) - Hispanic or Latino
Median household income ($) - American Indian and Alaska Native
Median household income ($) - Multirace
Median household income ($) - Other Race
Median household income for houses/condos with a mortgage ($)
Median household income for apartments without a mortgage ($)
Races - White alone (%)
Races - White alone (% change since 2000)
Races - Black alone (%)
Races - Black alone (% change since 2000)
Races - American Indian alone (%)
Races - American Indian alone (% change since 2000)
Races - Asian alone (%)
Races - Asian alone (% change since 2000)
Races - Hispanic (%)
Races - Hispanic (% change since 2000)
Races - Native Hawaiian and Other Pacific Islander alone (%)
Races - Native Hawaiian and Other Pacific Islander alone (% change since 2000)
Races - Two or more races (%)
Races - Two or more races (% change since 2000)
Races - Other race alone (%)
Races - Other race alone (% change since 2000)
Racial diversity
Unemployment (%)
Unemployment (% change since 2000)
Unemployment (%) - White
Unemployment (%) - Black or African American
Unemployment (%) - Asian
Unemployment (%) - Hispanic or Latino
Unemployment (%) - American Indian and Alaska Native
Unemployment (%) - Multirace
Unemployment (%) - Other Race
Population density (people per square mile)
Population - Males (%)
Population - Females (%)
Population - Males (%) - White
Population - Males (%) - Black or African American
Population - Males (%) - Asian
Population - Males (%) - Hispanic or Latino
Population - Males (%) - American Indian and Alaska Native
Population - Males (%) - Multirace
Population - Males (%) - Other Race
Population - Females (%) - White
Population - Females (%) - Black or African American
Population - Females (%) - Asian
Population - Females (%) - Hispanic or Latino
Population - Females (%) - American Indian and Alaska Native
Population - Females (%) - Multirace
Population - Females (%) - Other Race
Coronavirus confirmed cases (Jun 16, 2024)
Deaths caused by coronavirus (Jun 16, 2024)
Coronavirus confirmed cases (per 100k population) (Jun 16, 2024)
Deaths caused by coronavirus (per 100k population) (Jun 16, 2024)
Daily increase in number of cases (Jun 16, 2024)
Weekly increase in number of cases (Jun 16, 2024)
Cases doubled (in days) (Jun 16, 2024)
Hospitalized patients (Apr 18, 2022)
Negative test results (Apr 18, 2022)
Total test results (Apr 18, 2022)
COVID Vaccine doses distributed (per 100k population) (Sep 19, 2023)
COVID Vaccine doses administered (per 100k population) (Sep 19, 2023)
COVID Vaccine doses distributed (Sep 19, 2023)
COVID Vaccine doses administered (Sep 19, 2023)
Likely homosexual households (%)
Likely homosexual households (% change since 2000)
Likely homosexual households - Lesbian couples (%)
Likely homosexual households - Lesbian couples (% change since 2000)
Likely homosexual households - Gay men (%)
Likely homosexual households - Gay men (% change since 2000)
Cost of living index
Median gross rent ($)
Median contract rent ($)
Median monthly housing costs ($)
Median house or condo value ($)
Median house or condo value ($ change since 2000)
Mean house or condo value by units in structure - 1, detached ($)
Mean house or condo value by units in structure - 1, attached ($)
Mean house or condo value by units in structure - 2 ($)
Mean house or condo value by units in structure by units in structure - 3 or 4 ($)
Mean house or condo value by units in structure - 5 or more ($)
Mean house or condo value by units in structure - Boat, RV, van, etc. ($)
Mean house or condo value by units in structure - Mobile home ($)
Median house or condo value ($) - White
Median house or condo value ($) - Black or African American
Median house or condo value ($) - Asian
Median house or condo value ($) - Hispanic or Latino
Median house or condo value ($) - American Indian and Alaska Native
Median house or condo value ($) - Multirace
Median house or condo value ($) - Other Race
Median resident age
Resident age diversity
Median resident age - Males
Median resident age - Females
Median resident age - White
Median resident age - Black or African American
Median resident age - Asian
Median resident age - Hispanic or Latino
Median resident age - American Indian and Alaska Native
Median resident age - Multirace
Median resident age - Other Race
Median resident age - Males - White
Median resident age - Males - Black or African American
Median resident age - Males - Asian
Median resident age - Males - Hispanic or Latino
Median resident age - Males - American Indian and Alaska Native
Median resident age - Males - Multirace
Median resident age - Males - Other Race
Median resident age - Females - White
Median resident age - Females - Black or African American
Median resident age - Females - Asian
Median resident age - Females - Hispanic or Latino
Median resident age - Females - American Indian and Alaska Native
Median resident age - Females - Multirace
Median resident age - Females - Other Race
Commute - mean travel time to work (minutes)
Travel time to work - Less than 5 minutes (%)
Travel time to work - Less than 5 minutes (% change since 2000)
Travel time to work - 5 to 9 minutes (%)
Travel time to work - 5 to 9 minutes (% change since 2000)
Travel time to work - 10 to 19 minutes (%)
Travel time to work - 10 to 19 minutes (% change since 2000)
Travel time to work - 20 to 29 minutes (%)
Travel time to work - 20 to 29 minutes (% change since 2000)
Travel time to work - 30 to 39 minutes (%)
Travel time to work - 30 to 39 minutes (% change since 2000)
Travel time to work - 40 to 59 minutes (%)
Travel time to work - 40 to 59 minutes (% change since 2000)
Travel time to work - 60 to 89 minutes (%)
Travel time to work - 60 to 89 minutes (% change since 2000)
Travel time to work - 90 or more minutes (%)
Travel time to work - 90 or more minutes (% change since 2000)
Marital status - Never married (%)
Marital status - Now married (%)
Marital status - Separated (%)
Marital status - Widowed (%)
Marital status - Divorced (%)
Median family income ($)
Median family income (% change since 2000)
Median non-family income ($)
Median non-family income (% change since 2000)
Median per capita income ($)
Median per capita income (% change since 2000)
Median family income ($) - White
Median family income ($) - Black or African American
Median family income ($) - Asian
Median family income ($) - Hispanic or Latino
Median family income ($) - American Indian and Alaska Native
Median family income ($) - Multirace
Median family income ($) - Other Race
Median year house/condo built
Median year apartment built
Year house built - Built 2005 or later (%)
Year house built - Built 2000 to 2004 (%)
Year house built - Built 1990 to 1999 (%)
Year house built - Built 1980 to 1989 (%)
Year house built - Built 1970 to 1979 (%)
Year house built - Built 1960 to 1969 (%)
Year house built - Built 1950 to 1959 (%)
Year house built - Built 1940 to 1949 (%)
Year house built - Built 1939 or earlier (%)
Average household size
Household density (households per square mile)
Average household size - White
Average household size - Black or African American
Average household size - Asian
Average household size - Hispanic or Latino
Average household size - American Indian and Alaska Native
Average household size - Multirace
Average household size - Other Race
Occupied housing units (%)
Vacant housing units (%)
Owner occupied housing units (%)
Renter occupied housing units (%)
Vacancy status - For rent (%)
Vacancy status - For sale only (%)
Vacancy status - Rented or sold, not occupied (%)
Vacancy status - For seasonal, recreational, or occasional use (%)
Vacancy status - For migrant workers (%)
Vacancy status - Other vacant (%)
Residents with income below the poverty level (%)
Residents with income below 50% of the poverty level (%)
Children below poverty level (%)
Poor families by family type - Married-couple family (%)
Poor families by family type - Male, no wife present (%)
Poor families by family type - Female, no husband present (%)
Poverty status for native-born residents (%)
Poverty status for foreign-born residents (%)
Poverty among high school graduates not in families (%)
Poverty among people who did not graduate high school not in families (%)
Residents with income below the poverty level (%) - White
Residents with income below the poverty level (%) - Black or African American
Residents with income below the poverty level (%) - Asian
Residents with income below the poverty level (%) - Hispanic or Latino
Residents with income below the poverty level (%) - American Indian and Alaska Native
Residents with income below the poverty level (%) - Multirace
Residents with income below the poverty level (%) - Other Race
Air pollution - Air Quality Index (AQI)
Air pollution - CO
Air pollution - NO2
Air pollution - SO2
Air pollution - Ozone
Air pollution - PM10
Air pollution - PM25
Air pollution - Pb
Crime - Murders per 100,000 population
Crime - Rapes per 100,000 population
Crime - Robberies per 100,000 population
Crime - Assaults per 100,000 population
Crime - Burglaries per 100,000 population
Crime - Thefts per 100,000 population
Crime - Auto thefts per 100,000 population
Crime - Arson per 100,000 population
Crime - City-data.com crime index
Crime - Violent crime index
Crime - Property crime index
Crime - Murders per 100,000 population (5 year average)
Crime - Rapes per 100,000 population (5 year average)
Crime - Robberies per 100,000 population (5 year average)
Crime - Assaults per 100,000 population (5 year average)
Crime - Burglaries per 100,000 population (5 year average)
Crime - Thefts per 100,000 population (5 year average)
Crime - Auto thefts per 100,000 population (5 year average)
Crime - Arson per 100,000 population (5 year average)
Crime - City-data.com crime index (5 year average)
Crime - Violent crime index (5 year average)
Crime - Property crime index (5 year average)
1996 Presidential Elections Results (%) - Democratic Party (Clinton)
1996 Presidential Elections Results (%) - Republican Party (Dole)
1996 Presidential Elections Results (%) - Other
2000 Presidential Elections Results (%) - Democratic Party (Gore)
2000 Presidential Elections Results (%) - Republican Party (Bush)
2000 Presidential Elections Results (%) - Other
2004 Presidential Elections Results (%) - Democratic Party (Kerry)
2004 Presidential Elections Results (%) - Republican Party (Bush)
2004 Presidential Elections Results (%) - Other
2008 Presidential Elections Results (%) - Democratic Party (Obama)
2008 Presidential Elections Results (%) - Republican Party (McCain)
2008 Presidential Elections Results (%) - Other
2012 Presidential Elections Results (%) - Democratic Party (Obama)
2012 Presidential Elections Results (%) - Republican Party (Romney)
2012 Presidential Elections Results (%) - Other
2016 Presidential Elections Results (%) - Democratic Party (Clinton)
2016 Presidential Elections Results (%) - Republican Party (Trump)
2016 Presidential Elections Results (%) - Other
2020 Presidential Elections Results (%) - Democratic Party (Biden)
2020 Presidential Elections Results (%) - Republican Party (Trump)
2020 Presidential Elections Results (%) - Other
Ancestries Reported - Arab (%)
Ancestries Reported - Czech (%)
Ancestries Reported - Danish (%)
Ancestries Reported - Dutch (%)
Ancestries Reported - English (%)
Ancestries Reported - French (%)
Ancestries Reported - French Canadian (%)
Ancestries Reported - German (%)
Ancestries Reported - Greek (%)
Ancestries Reported - Hungarian (%)
Ancestries Reported - Irish (%)
Ancestries Reported - Italian (%)
Ancestries Reported - Lithuanian (%)
Ancestries Reported - Norwegian (%)
Ancestries Reported - Polish (%)
Ancestries Reported - Portuguese (%)
Ancestries Reported - Russian (%)
Ancestries Reported - Scotch-Irish (%)
Ancestries Reported - Scottish (%)
Ancestries Reported - Slovak (%)
Ancestries Reported - Subsaharan African (%)
Ancestries Reported - Swedish (%)
Ancestries Reported - Swiss (%)
Ancestries Reported - Ukrainian (%)
Ancestries Reported - United States (%)
Ancestries Reported - Welsh (%)
Ancestries Reported - West Indian (%)
Ancestries Reported - Other (%)
Educational Attainment - No schooling completed (%)
Educational Attainment - Less than high school (%)
Educational Attainment - High school or equivalent (%)
Educational Attainment - Less than 1 year of college (%)
Educational Attainment - 1 or more years of college (%)
Educational Attainment - Associate degree (%)
Educational Attainment - Bachelor's degree (%)
Educational Attainment - Master's degree (%)
Educational Attainment - Professional school degree (%)
Educational Attainment - Doctorate degree (%)
School Enrollment - Nursery, preschool (%)
School Enrollment - Kindergarten (%)
School Enrollment - Grade 1 to 4 (%)
School Enrollment - Grade 5 to 8 (%)
School Enrollment - Grade 9 to 12 (%)
School Enrollment - College undergrad (%)
School Enrollment - Graduate or professional (%)
School Enrollment - Not enrolled in school (%)
School enrollment - Public schools (%)
School enrollment - Private schools (%)
School enrollment - Not enrolled (%)
Median number of rooms in houses and condos
Median number of rooms in apartments
Housing units lacking complete plumbing facilities (%)
Housing units lacking complete kitchen facilities (%)
Density of houses
Urban houses (%)
Rural houses (%)
Households with people 60 years and over (%)
Households with people 65 years and over (%)
Households with people 75 years and over (%)
Households with one or more nonrelatives (%)
Households with no nonrelatives (%)
Population in households (%)
Family households (%)
Nonfamily households (%)
Population in families (%)
Family households with own children (%)
Median number of bedrooms in owner occupied houses
Mean number of bedrooms in owner occupied houses
Median number of bedrooms in renter occupied houses
Mean number of bedrooms in renter occupied houses
Median number of vehichles in owner occupied houses
Mean number of vehichles in owner occupied houses
Median number of vehichles in renter occupied houses
Mean number of vehichles in renter occupied houses
Mortgage status - with mortgage (%)
Mortgage status - with second mortgage (%)
Mortgage status - with home equity loan (%)
Mortgage status - with both second mortgage and home equity loan (%)
Mortgage status - without a mortgage (%)
Average family size
Average family size - White
Average family size - Black or African American
Average family size - Asian
Average family size - Hispanic or Latino
Average family size - American Indian and Alaska Native
Average family size - Multirace
Average family size - Other Race
Geographical mobility - Same house 1 year ago (%)
Geographical mobility - Moved within same county (%)
Geographical mobility - Moved from different county within same state (%)
Geographical mobility - Moved from different state (%)
Geographical mobility - Moved from abroad (%)
Place of birth - Born in state of residence (%)
Place of birth - Born in other state (%)
Place of birth - Native, outside of US (%)
Place of birth - Foreign born (%)
Housing units in structures - 1, detached (%)
Housing units in structures - 1, attached (%)
Housing units in structures - 2 (%)
Housing units in structures - 3 or 4 (%)
Housing units in structures - 5 to 9 (%)
Housing units in structures - 10 to 19 (%)
Housing units in structures - 20 to 49 (%)
Housing units in structures - 50 or more (%)
Housing units in structures - Mobile home (%)
Housing units in structures - Boat, RV, van, etc. (%)
House/condo owner moved in on average (years ago)
Renter moved in on average (years ago)
Year householder moved into unit - Moved in 1999 to March 2000 (%)
Year householder moved into unit - Moved in 1995 to 1998 (%)
Year householder moved into unit - Moved in 1990 to 1994 (%)
Year householder moved into unit - Moved in 1980 to 1989 (%)
Year householder moved into unit - Moved in 1970 to 1979 (%)
Year householder moved into unit - Moved in 1969 or earlier (%)
Means of transportation to work - Drove car alone (%)
Means of transportation to work - Carpooled (%)
Means of transportation to work - Public transportation (%)
Means of transportation to work - Bus or trolley bus (%)
Means of transportation to work - Streetcar or trolley car (%)
Means of transportation to work - Subway or elevated (%)
Means of transportation to work - Railroad (%)
Means of transportation to work - Ferryboat (%)
Means of transportation to work - Taxicab (%)
Means of transportation to work - Motorcycle (%)
Means of transportation to work - Bicycle (%)
Means of transportation to work - Walked (%)
Means of transportation to work - Other means (%)
Working at home (%)
Industry diversity
Most Common Industries - Agriculture, forestry, fishing and hunting, and mining (%)
Most Common Industries - Agriculture, forestry, fishing and hunting (%)
Most Common Industries - Mining, quarrying, and oil and gas extraction (%)
Most Common Industries - Construction (%)
Most Common Industries - Manufacturing (%)
Most Common Industries - Wholesale trade (%)
Most Common Industries - Retail trade (%)
Most Common Industries - Transportation and warehousing, and utilities (%)
Most Common Industries - Transportation and warehousing (%)
Most Common Industries - Utilities (%)
Most Common Industries - Information (%)
Most Common Industries - Finance and insurance, and real estate and rental and leasing (%)
Most Common Industries - Finance and insurance (%)
Most Common Industries - Real estate and rental and leasing (%)
Most Common Industries - Professional, scientific, and management, and administrative and waste management services (%)
Most Common Industries - Professional, scientific, and technical services (%)
Most Common Industries - Management of companies and enterprises (%)
Most Common Industries - Administrative and support and waste management services (%)
Most Common Industries - Educational services, and health care and social assistance (%)
Most Common Industries - Educational services (%)
Most Common Industries - Health care and social assistance (%)
Most Common Industries - Arts, entertainment, and recreation, and accommodation and food services (%)
Most Common Industries - Arts, entertainment, and recreation (%)
Most Common Industries - Accommodation and food services (%)
Most Common Industries - Other services, except public administration (%)
Most Common Industries - Public administration (%)
Occupation diversity
Most Common Occupations - Management, business, science, and arts occupations (%)
Most Common Occupations - Management, business, and financial occupations (%)
Most Common Occupations - Management occupations (%)
Most Common Occupations - Business and financial operations occupations (%)
Most Common Occupations - Computer, engineering, and science occupations (%)
Most Common Occupations - Computer and mathematical occupations (%)
Most Common Occupations - Architecture and engineering occupations (%)
Most Common Occupations - Life, physical, and social science occupations (%)
Most Common Occupations - Education, legal, community service, arts, and media occupations (%)
Most Common Occupations - Community and social service occupations (%)
Most Common Occupations - Legal occupations (%)
Most Common Occupations - Education, training, and library occupations (%)
Most Common Occupations - Arts, design, entertainment, sports, and media occupations (%)
Most Common Occupations - Healthcare practitioners and technical occupations (%)
Most Common Occupations - Health diagnosing and treating practitioners and other technical occupations (%)
Most Common Occupations - Health technologists and technicians (%)
Most Common Occupations - Service occupations (%)
Most Common Occupations - Healthcare support occupations (%)
Most Common Occupations - Protective service occupations (%)
Most Common Occupations - Fire fighting and prevention, and other protective service workers including supervisors (%)
Most Common Occupations - Law enforcement workers including supervisors (%)
Most Common Occupations - Food preparation and serving related occupations (%)
Most Common Occupations - Building and grounds cleaning and maintenance occupations (%)
Most Common Occupations - Personal care and service occupations (%)
Most Common Occupations - Sales and office occupations (%)
Most Common Occupations - Sales and related occupations (%)
Most Common Occupations - Office and administrative support occupations (%)
Most Common Occupations - Natural resources, construction, and maintenance occupations (%)
Most Common Occupations - Farming, fishing, and forestry occupations (%)
Most Common Occupations - Construction and extraction occupations (%)
Most Common Occupations - Installation, maintenance, and repair occupations (%)
Most Common Occupations - Production, transportation, and material moving occupations (%)
Most Common Occupations - Production occupations (%)
Most Common Occupations - Transportation occupations (%)
Most Common Occupations - Material moving occupations (%)
People in Group quarters - Institutionalized population (%)
People in Group quarters - Correctional institutions (%)
People in Group quarters - Federal prisons and detention centers (%)
People in Group quarters - Halfway houses (%)
People in Group quarters - Local jails and other confinement facilities (including police lockups) (%)
People in Group quarters - Military disciplinary barracks (%)
People in Group quarters - State prisons (%)
People in Group quarters - Other types of correctional institutions (%)
People in Group quarters - Nursing homes (%)
People in Group quarters - Hospitals/wards, hospices, and schools for the handicapped (%)
People in Group quarters - Hospitals/wards and hospices for chronically ill (%)
People in Group quarters - Hospices or homes for chronically ill (%)
People in Group quarters - Military hospitals or wards for chronically ill (%)
People in Group quarters - Other hospitals or wards for chronically ill (%)
People in Group quarters - Hospitals or wards for drug/alcohol abuse (%)
People in Group quarters - Mental (Psychiatric) hospitals or wards (%)
People in Group quarters - Schools, hospitals, or wards for the mentally retarded (%)
People in Group quarters - Schools, hospitals, or wards for the physically handicapped (%)
People in Group quarters - Institutions for the deaf (%)
People in Group quarters - Institutions for the blind (%)
People in Group quarters - Orthopedic wards and institutions for the physically handicapped (%)
People in Group quarters - Wards in general hospitals for patients who have no usual home elsewhere (%)
People in Group quarters - Wards in military hospitals for patients who have no usual home elsewhere (%)
People in Group quarters - Juvenile institutions (%)
People in Group quarters - Long-term care (%)
People in Group quarters - Homes for abused, dependent, and neglected children (%)
People in Group quarters - Residential treatment centers for emotionally disturbed children (%)
People in Group quarters - Training schools for juvenile delinquents (%)
People in Group quarters - Short-term care, detention or diagnostic centers for delinquent children (%)
People in Group quarters - Type of juvenile institution unknown (%)
People in Group quarters - Noninstitutionalized population (%)
People in Group quarters - College dormitories (includes college quarters off campus) (%)
People in Group quarters - Military quarters (%)
People in Group quarters - On base (%)
People in Group quarters - Barracks, unaccompanied personnel housing (UPH), (Enlisted/Officer), ;and similar group living quarters for military personnel (%)
People in Group quarters - Transient quarters for temporary residents (%)
People in Group quarters - Military ships (%)
People in Group quarters - Group homes (%)
People in Group quarters - Homes or halfway houses for drug/alcohol abuse (%)
People in Group quarters - Homes for the mentally ill (%)
People in Group quarters - Homes for the mentally retarded (%)
People in Group quarters - Homes for the physically handicapped (%)
People in Group quarters - Other group homes (%)
People in Group quarters - Religious group quarters (%)
People in Group quarters - Dormitories (%)
People in Group quarters - Agriculture workers' dormitories on farms (%)
People in Group quarters - Job Corps and vocational training facilities (%)
People in Group quarters - Other workers' dormitories (%)
People in Group quarters - Crews of maritime vessels (%)
People in Group quarters - Other nonhousehold living situations (%)
People in Group quarters - Other noninstitutional group quarters (%)
Residents speaking English at home (%)
Residents speaking English at home - Born in the United States (%)
Residents speaking English at home - Native, born elsewhere (%)
Residents speaking English at home - Foreign born (%)
Residents speaking Spanish at home (%)
Residents speaking Spanish at home - Born in the United States (%)
Residents speaking Spanish at home - Native, born elsewhere (%)
Residents speaking Spanish at home - Foreign born (%)
Residents speaking other language at home (%)
Residents speaking other language at home - Born in the United States (%)
Residents speaking other language at home - Native, born elsewhere (%)
Residents speaking other language at home - Foreign born (%)
Class of Workers - Employee of private company (%)
Class of Workers - Self-employed in own incorporated business (%)
Class of Workers - Private not-for-profit wage and salary workers (%)
Class of Workers - Local government workers (%)
Class of Workers - State government workers (%)
Class of Workers - Federal government workers (%)
Class of Workers - Self-employed workers in own not incorporated business and Unpaid family workers (%)
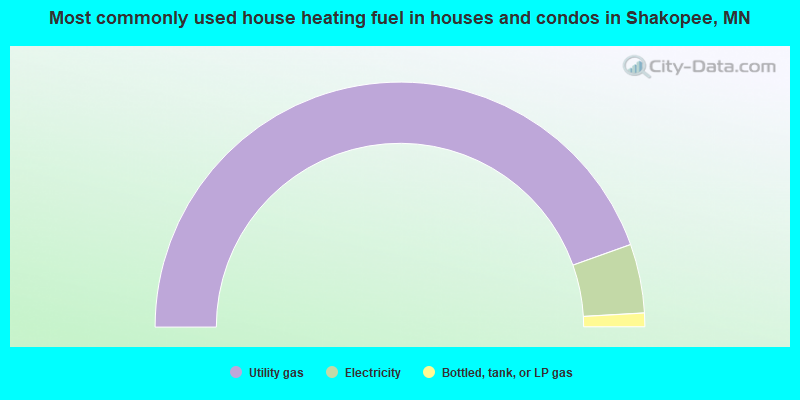
House heating fuel used in houses and condos - Utility gas (%)
House heating fuel used in houses and condos - Bottled, tank, or LP gas (%)
House heating fuel used in houses and condos - Electricity (%)
House heating fuel used in houses and condos - Fuel oil, kerosene, etc. (%)
House heating fuel used in houses and condos - Coal or coke (%)
House heating fuel used in houses and condos - Wood (%)
House heating fuel used in houses and condos - Solar energy (%)
House heating fuel used in houses and condos - Other fuel (%)
House heating fuel used in houses and condos - No fuel used (%)
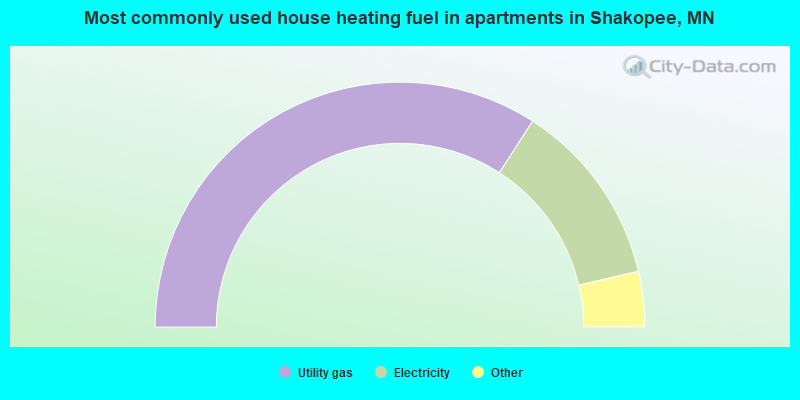
House heating fuel used in apartments - Utility gas (%)
House heating fuel used in apartments - Bottled, tank, or LP gas (%)
House heating fuel used in apartments - Electricity (%)
House heating fuel used in apartments - Fuel oil, kerosene, etc. (%)
House heating fuel used in apartments - Coal or coke (%)
House heating fuel used in apartments - Wood (%)
House heating fuel used in apartments - Solar energy (%)
House heating fuel used in apartments - Other fuel (%)
House heating fuel used in apartments - No fuel used (%)
Armed forces status - In Armed Forces (%)
Armed forces status - Civilian (%)
Armed forces status - Civilian - Veteran (%)
Armed forces status - Civilian - Nonveteran (%)
Fatal accidents locations in years 2005-2021
Fatal accidents locations in 2005
Fatal accidents locations in 2006
Fatal accidents locations in 2007
Fatal accidents locations in 2008
Fatal accidents locations in 2009
Fatal accidents locations in 2010
Fatal accidents locations in 2011
Fatal accidents locations in 2012
Fatal accidents locations in 2013
Fatal accidents locations in 2014
Fatal accidents locations in 2015
Fatal accidents locations in 2016
Fatal accidents locations in 2017
Fatal accidents locations in 2018
Fatal accidents locations in 2019
Fatal accidents locations in 2020
Fatal accidents locations in 2021
Alcohol use - People drinking some alcohol every month (%)
Alcohol use - People not drinking at all (%)
Alcohol use - Average days/month drinking alcohol
Alcohol use - Average drinks/week
Alcohol use - Average days/year people drink much
Audiometry - Average condition of hearing (%)
Audiometry - People that can hear a whisper from across a quiet room (%)
Audiometry - People that can hear normal voice from across a quiet room (%)
Audiometry - Ears ringing, roaring, buzzing (%)
Audiometry - Had a job exposure to loud noise (%)
Audiometry - Had off-work exposure to loud noise (%)
Blood Pressure & Cholesterol - Has high blood pressure (%)
Blood Pressure & Cholesterol - Checking blood pressure at home (%)
Blood Pressure & Cholesterol - Frequently checking blood cholesterol (%)
Blood Pressure & Cholesterol - Has high cholesterol level (%)
Consumer Behavior - Money monthly spent on food at supermarket/grocery store
Consumer Behavior - Money monthly spent on food at other stores
Consumer Behavior - Money monthly spent on eating out
Consumer Behavior - Money monthly spent on carryout/delivered foods
Consumer Behavior - Income spent on food at supermarket/grocery store (%)
Consumer Behavior - Income spent on food at other stores (%)
Consumer Behavior - Income spent on eating out (%)
Consumer Behavior - Income spent on carryout/delivered foods (%)
Current Health Status - General health condition (%)
Current Health Status - Blood donors (%)
Current Health Status - Has blood ever tested for HIV virus (%)
Current Health Status - Left-handed people (%)
Dermatology - People using sunscreen (%)
Diabetes - Diabetics (%)
Diabetes - Had a blood test for high blood sugar (%)
Diabetes - People taking insulin (%)
Diet Behavior & Nutrition - Diet health (%)
Diet Behavior & Nutrition - Milk product consumption (# of products/month)
Diet Behavior & Nutrition - Meals not home prepared (#/week)
Diet Behavior & Nutrition - Meals from fast food or pizza place (#/week)
Diet Behavior & Nutrition - Ready-to-eat foods (#/month)
Diet Behavior & Nutrition - Frozen meals/pizza (#/month)
Drug Use - People that ever used marijuana or hashish (%)
Drug Use - Ever used hard drugs (%)
Drug Use - Ever used any form of cocaine (%)
Drug Use - Ever used heroin (%)
Drug Use - Ever used methamphetamine (%)
Health Insurance - People covered by health insurance (%)
Kidney Conditions-Urology - Avg. # of times urinating at night
Medical Conditions - People with asthma (%)
Medical Conditions - People with anemia (%)
Medical Conditions - People with psoriasis (%)
Medical Conditions - People with overweight (%)
Medical Conditions - Elderly people having difficulties in thinking or remembering (%)
Medical Conditions - People who ever received blood transfusion (%)
Medical Conditions - People having trouble seeing even with glass/contacts (%)
Medical Conditions - People with arthritis (%)
Medical Conditions - People with gout (%)
Medical Conditions - People with congestive heart failure (%)
Medical Conditions - People with coronary heart disease (%)
Medical Conditions - People with angina pectoris (%)
Medical Conditions - People who ever had heart attack (%)
Medical Conditions - People who ever had stroke (%)
Medical Conditions - People with emphysema (%)
Medical Conditions - People with thyroid problem (%)
Medical Conditions - People with chronic bronchitis (%)
Medical Conditions - People with any liver condition (%)
Medical Conditions - People who ever had cancer or malignancy (%)
Mental Health - People who have little interest in doing things (%)
Mental Health - People feeling down, depressed, or hopeless (%)
Mental Health - People who have trouble sleeping or sleeping too much (%)
Mental Health - People feeling tired or having little energy (%)
Mental Health - People with poor appetite or overeating (%)
Mental Health - People feeling bad about themself (%)
Mental Health - People who have trouble concentrating on things (%)
Mental Health - People moving or speaking slowly or too fast (%)
Mental Health - People having thoughts they would be better off dead (%)
Oral Health - Average years since last visit a dentist
Oral Health - People embarrassed because of mouth (%)
Oral Health - People with gum disease (%)
Oral Health - General health of teeth and gums (%)
Oral Health - Average days a week using dental floss/device
Oral Health - Average days a week using mouthwash for dental problem
Oral Health - Average number of teeth
Pesticide Use - Households using pesticides to control insects (%)
Pesticide Use - Households using pesticides to kill weeds (%)
Physical Activity - People doing vigorous-intensity work activities (%)
Physical Activity - People doing moderate-intensity work activities (%)
Physical Activity - People walking or bicycling (%)
Physical Activity - People doing vigorous-intensity recreational activities (%)
Physical Activity - People doing moderate-intensity recreational activities (%)
Physical Activity - Average hours a day doing sedentary activities
Physical Activity - Average hours a day watching TV or videos
Physical Activity - Average hours a day using computer
Physical Functioning - People having limitations keeping them from working (%)
Physical Functioning - People limited in amount of work they can do (%)
Physical Functioning - People that need special equipment to walk (%)
Physical Functioning - People experiencing confusion/memory problems (%)
Physical Functioning - People requiring special healthcare equipment (%)
Prescription Medications - Average number of prescription medicines taking
Preventive Aspirin Use - Adults 40+ taking low-dose aspirin (%)
Reproductive Health - Vaginal deliveries (%)
Reproductive Health - Cesarean deliveries (%)
Reproductive Health - Deliveries resulted in a live birth (%)
Reproductive Health - Pregnancies resulted in a delivery (%)
Reproductive Health - Women breastfeeding newborns (%)
Reproductive Health - Women that had a hysterectomy (%)
Reproductive Health - Women that had both ovaries removed (%)
Reproductive Health - Women that have ever taken birth control pills (%)
Reproductive Health - Women taking birth control pills (%)
Reproductive Health - Women that have ever used Depo-Provera or injectables (%)
Reproductive Health - Women that have ever used female hormones (%)
Sexual Behavior - People 18+ that ever had sex (vaginal, anal, or oral) (%)
Sexual Behavior - Males 18+ that ever had vaginal sex with a woman (%)
Sexual Behavior - Males 18+ that ever performed oral sex on a woman (%)
Sexual Behavior - Males 18+ that ever had anal sex with a woman (%)
Sexual Behavior - Males 18+ that ever had any sex with a man (%)
Sexual Behavior - Females 18+ that ever had vaginal sex with a man (%)
Sexual Behavior - Females 18+ that ever performed oral sex on a man (%)
Sexual Behavior - Females 18+ that ever had anal sex with a man (%)
Sexual Behavior - Females 18+ that ever had any kind of sex with a woman (%)
Sexual Behavior - Average age people first had sex
Sexual Behavior - Average number of female sex partners in lifetime (males 18+)
Sexual Behavior - Average number of female vaginal sex partners in lifetime (males 18+)
Sexual Behavior - Average age people first performed oral sex on a woman (18+)
Sexual Behavior - Average number of woman performed oral sex on in lifetime (18+)
Sexual Behavior - Average number of male sex partners in lifetime (males 18+)
Sexual Behavior - Average number of male anal sex partners in lifetime (males 18+)
Sexual Behavior - Average age people first performed oral sex on a man (18+)
Sexual Behavior - Average number of male oral sex partners in lifetime (18+)
Sexual Behavior - People using protection when performing oral sex (%)
Sexual Behavior - Average number of times people have vaginal or anal sex a year
Sexual Behavior - People having sex without condom (%)
Sexual Behavior - Average number of male sex partners in lifetime (females 18+)
Sexual Behavior - Average number of male vaginal sex partners in lifetime (females 18+)
Sexual Behavior - Average number of female sex partners in lifetime (females 18+)
Sexual Behavior - Circumcised males 18+ (%)
Sleep Disorders - Average hours sleeping at night
Sleep Disorders - People that has trouble sleeping (%)
Smoking-Cigarette Use - People smoking cigarettes (%)
Taste & Smell - People 40+ having problems with smell (%)
Taste & Smell - People 40+ having problems with taste (%)
Taste & Smell - People 40+ that ever had wisdom teeth removed (%)
Taste & Smell - People 40+ that ever had tonsils teeth removed (%)
Taste & Smell - People 40+ that ever had a loss of consciousness because of a head injury (%)
Taste & Smell - People 40+ that ever had a broken nose or other serious injury to face or skull (%)
Taste & Smell - People 40+ that ever had two or more sinus infections (%)
Weight - Average height (inches)
Weight - Average weight (pounds)
Weight - Average BMI
Weight - People that are obese (%)
Weight - People that ever were obese (%)
Weight - People trying to lose weight (%)
According to our research of Minnesota and other state lists, there was 1 registered sex offender living in Shakopee, Minnesota as of June 16, 2024 . The ratio of all residents to sex offenders in Shakopee is 40,158 to 1.The ratio of registered sex offenders to all residents in this city is much lower than the state average.
Officers per 1,000 residents here:
1.10Minnesota average:
1.76
Latest news from Shakopee, MN collected exclusively by city-data.com from local newspapers, TV, and radio stations
Shakopee, MN City Guides: Ancestries: German (22.0%), Somali (6.8%), Scandinavian (5.7%), Norwegian (3.9%), Irish (3.2%), Ethiopian (2.7%).
Current Local Time:
Land area: 27.0 square miles.
Population density: 1,694 people per square mile (low).
8,287 residents are foreign born (6.9% Asia , 4.2% Latin America , 4.1% Africa , 2.9% Europe ).
This city:
18.4%Minnesota:
8.5%
Median real estate property taxes paid for housing units with mortgages in 2022: $3,592 (0.9%)Median real estate property taxes paid for housing units with no mortgage in 2022: $3,220 (1.0%)
Nearest city with pop. 50,000+: Eden Prairie, MN
Nearest city with pop. 200,000+: Minneapolis, MN
Nearest city with pop. 1,000,000+: Chicago, IL
Nearest cities:
Latitude: 44.79 N, Longitude: 93.50 W
Daytime population change due to commuting: +6,296 (+14.0%)Workers who live and work in this city: 12,880 (54.4%)
Area code commonly used in this area: 952
Shakopee tourist attractions:
Single-family new house construction building permits:
2022: 200 buildings , average cost: $461,4002021: 154 buildings , average cost: $398,0002020: 165 buildings , average cost: $368,8002019: 140 buildings , average cost: $376,7002018: 117 buildings , average cost: $327,2002017: 52 buildings , average cost: $310,8002016: 50 buildings , average cost: $337,7002015: 59 buildings , average cost: $313,0002014: 70 buildings , average cost: $313,2002013: 107 buildings , average cost: $238,1002012: 96 buildings , average cost: $258,8002011: 119 buildings , average cost: $270,3002010: 167 buildings , average cost: $243,6002009: 349 buildings , average cost: $204,4002008: 112 buildings , average cost: $238,4002007: 189 buildings , average cost: $250,8002006: 276 buildings , average cost: $251,4002005: 568 buildings , average cost: $198,7002004: 739 buildings , average cost: $177,2002003: 906 buildings , average cost: $148,9002002: 527 buildings , average cost: $155,5002001: 676 buildings , average cost: $156,0002000: 717 buildings , average cost: $148,5001999: 766 buildings , average cost: $116,6001998: 670 buildings , average cost: $87,2001997: 381 buildings , average cost: $97,700Unemployment in December 2023:
Population change in the 1990s: +8,656 (+72.7%).
Most common occupations in Shakopee, MN (%)
Both Males Females
Other production occupations, including supervisors (4.1%)
Other office and administrative support workers, including supervisors (3.8%)
Sales representatives, services, wholesale and manufacturing (3.5%)
Other management occupations, except farmers and farm managers (3.4%)
Computer specialists (3.2%)
Other sales and related occupations, including supervisors (3.1%)
Building and grounds cleaning and maintenance occupations (2.9%)
Other production occupations, including supervisors (5.8%)
Electrical equipment mechanics and other installation, maintenance, and repair workers, including supervisors (5.4%)
Sales representatives, services, wholesale and manufacturing (4.9%)
Metal workers and plastic workers (4.8%)
Computer specialists (4.2%)
Material recording, scheduling, dispatching, and distributing workers (3.7%)
Building and grounds cleaning and maintenance occupations (3.6%)
Other office and administrative support workers, including supervisors (6.3%)
Secretaries and administrative assistants (4.2%)
Information and record clerks, except customer service representatives (4.0%)
Customer service representatives (3.9%)
Preschool, kindergarten, elementary, and middle school teachers (3.8%)
Child care workers (3.6%)
Other management occupations, except farmers and farm managers (3.6%)
Tornado activity:
Shakopee-area historical tornado activity is slightly above Minnesota state average. It is 32% greater than the overall U.S. average.
On 5/6/1965, a category F4 (max. wind speeds 207-260 mph) tornado 4.6 miles away from the Shakopee city center caused between $5,000,000 and $50,000,000 in damages.
On 5/6/1965, a category F4 tornado 12.2 miles away from the city center killed 3 people and injured 175 people and caused between $5,000,000 and $50,000,000 in damages.
Earthquake activity:
Shakopee-area historical earthquake activity is significantly above Minnesota state average. It is 54% smaller than the overall U.S. average. On 7/9/1975 at 14:54:15, a magnitude 4.6 (4.6 MB, Class: Light, Intensity: IV - V) earthquake occurred 137.9 miles away from Shakopee center On 6/5/1993 at 01:24:53, a magnitude 4.1 (4.1 LG, Depth: 6.2 mi) earthquake occurred 149.1 miles away from Shakopee center On 3/4/1983 at 06:32:18, a magnitude 4.6 (4.4 MB, 4.6 LG, 4.4 ML) earthquake occurred 294.0 miles away from Shakopee center On 10/20/1995 at 15:57:18, a magnitude 3.7 (3.7 LG, Depth: 3.1 mi, Class: Light, Intensity: II - III) earthquake occurred 177.6 miles away from the city center On 2/9/1994 at 08:45:35, a magnitude 3.1 (3.1 LG, Depth: 3.1 mi) earthquake occurred 74.8 miles away from the city center On 11/3/2002 at 20:41:56, a magnitude 4.3 (4.3 MB, Depth: 3.1 mi) earthquake occurred 303.3 miles away from the city center Magnitude types: regional Lg-wave magnitude (LG), body-wave magnitude (MB), local magnitude (ML) Natural disasters: The number of natural disasters in Scott County (15) is near the US average (15).Major Disasters (Presidential) Declared: 10Emergencies Declared: 3Floods: 11, Storms: 6, Tornadoes: 3, Winds: 3, Drought: 1, Hurricane: 1, Landslide: 1, Mudslide: 1, Winter Storm: 1, Other: 1 (Note: some incidents may be assigned to more than one category). Main business address for: CANTERBURY PARK HOLDING CORP SERVICES-RACING, INCLUDING TRACK OPERATION ).
Hospitals and medical centers in Shakopee: DELPHI (1411 EAST SHAKOPEE AVENUE) ST FRANCIS REGIONAL MEDICAL CENTER (Voluntary non-profit - Church, 1455 ST FRANCIS AVENUE) SHAKOPEE FRIENDSHIP MANOR (1340 THIRD AVENUE WEST)
ST GERTRUDES HEALTH CENTER (1850 SARAZIN STREET)
FMS DIALYSIS - SHAKOPEE (1515 SAINT FRANCIS AVE STE 150)
Amtrak station near Shakopee: 20 miles: ST. PAUL/MINNEAPOLIS (ST. PAUL, 730 TRANSFER RD.) Services: ticket office, fully wheelchair accessible, enclosed waiting area, public restrooms, public payphones, vending machines, free short-term parking, free long-term parking, call for car rental service, taxi stand.
College/University in Shakopee: Minnesota School of Business-Shakopee Full-time enrollment: 175; Location: 1200 Shakopee Town Square; Private, for-profit; Website: www.msbcollege.edu/)
Colleges/universities with over 2000 students nearest to Shakopee:
Normandale Community College (about 9 miles; Bloomington, MN ; Full-time enrollment: 7,048)
Minneapolis Community and Technical College (about 17 miles; Minneapolis, MN ; FT enrollment: 6,726)
Capella University (about 18 miles; Minneapolis, MN ; FT enrollment: 21,718)
Walden University (about 18 miles; Minneapolis, MN ; FT enrollment: 62,473)
Augsburg College (about 18 miles; Minneapolis, MN ; FT enrollment: 2,954)
St Catherine University (about 19 miles; Saint Paul, MN ; FT enrollment: 3,771)
University of Minnesota-Twin Cities (about 19 miles; Minneapolis, MN ; FT enrollment: 43,506)
Biggest public high schools in Shakopee: MN CORRECTIONAL FACILITY-SHAKOPEE Location: 1010 W 6TH AVE, Grades: 9-12)
SWMETRO - CHASKA SPECIAL ED CENTER Location: 792 CANTERBURY RD S STE 211, Grades: KG-12)
SWMETRO ALC Location: 792 CANTERBURY RD S STE 211, Grades: 9-12)
SWMETRO CCJ Location: 792 CANTERBURY RD S STE 211, Grades: 6-12)
SWMETRO SEAT BASED Location: 792 CANTERBURY RD S STE 211, Grades: 7-12)
SWMETRO INDEPENDENT STUDY Location: 792 CANTERBURY RD S STE 211, Grades: 9-12)
SWMETRO ONLINE LEARNING Location: 792 CANTERBURY RD S STE 211, Grades: 7-12)
SWMETRO DAY TREATMENT Location: 792 CANTERBURY RD S STE 211, Grades: 6-12)SWMETRO JAF Location: 792 CANTERBURY RD S STE 211, Grades: 6-12)
SWMETRO SHAKOPEE SPEC ED Location: 792 CANTERBURY RD STE 211, Grades: KG-12)
Public elementary/middle schools in Shakopee:
Private elementary/middle schools in Shakopee:
See full list of schools located in Shakopee
Notable locations in Shakopee: (A) , Minnesota Renaissance Festival Site (B) , Blue Lake Water Treatment Facility (C) , Stonebrook Golf Club (D) , Valleyfair Amusement Park (E) , Canterbury Park (F) , Murphy's Landing (G) , Shakopee (H) , Shakopee Valley RV Park (I) , Shakopee Fire Department Station 2 (J) , Scott County Sheriff's Office (K) , Shakopee Public Library (L) , Scott County Courthouse (M) , Shakopee Police Department (N) , Shakopee City Hall (O) , Shakopee Fire Department Station 1 (P) , Shakopee Civic Center (Q) . Display/hide their locations on the map
Shopping Centers: (1) , Shakopee Commons Shopping Center (2) . Display/hide their locations on the map
Main business address in Shakopee: (A) . Display/hide its location on the map
Churches in Shakopee include: (A) , Saint Mark's Catholic Church (B) , Assemblies of God Church (C) , Saint John's Lutheran Church (D) , Russian Evangelical Christian Church (E) , Good News Lutheran Church (F) , Christ Lutheran Church (G) , Mount Olive Evangelical Lutheran Church (H) , River of Life Community Church (I) . Display/hide their locations on the map
Cemeteries: (1) , Saint Marks Cemetery (2) , Saint Marys Cemetery (3) , Valley Cemetery (4) . Display/hide their locations on the map
Lakes: (A) , Fisher Lake (B) , Deans Lake (C) , Blue Lake (D) . Display/hide their locations on the map
Parks in Shakopee include: (1) , Riverview Park (2) , James W Wilke Regional Park (3) , Lions Park (4) , Tahpah Park (5) , Huber Park (6) , Pond Mission Historical Marker (7) , Shakopee Wayside Park (8) . Display/hide their locations on the map
Tourist attractions: (1) , Scott County Historical Society (Cultural Attractions- Events- & Facilities; 235 Fuller Street South) (2) , Suburban Wildlife Control (Recreation Areas; 2080 Eaglewood Lane) (3) , Minnesota Valley Balloons (242 Minnesota Street South) (4) , Mid America Festivals (Tours & Charters; 1244 Canterbury Rd Ste 306) (5) . Display/hide their approximate locations on the map
Hotels: (1) , Hill View Motel (12826 Johnson Memorial Drive) (2) , Park Inn & Suite Shakopee (1244 Canterbury Road South) (3) , Country Inn & Suites by Carlson-Shakopee (1204 Ramsey Street) (4) , Hearthside Extended Stay Studios by Villager (3910 12th Avenue East) (5) , Americinn Lodge & Suites (4100 12th Avenue East) (6) . Display/hide their approximate locations on the map
Birthplace of: Eleanor Gates - Playwright, Mark Buesgens - Politician, Bill Barnes - Baseball player, Jamal Abu-Shamala - College basketball player (Minnesota Golden Gophers), Maurice Stans, Phillip Bartlett - Actor.
Scott County has a predicted average indoor radon screening level greater than 4 pCi/L (pico curies per liter) - Highest Potential Drinking water stations with addresses in Shakopee and their reported violations in the past:
ENGELHAVEN UTILITY ASSOCIATION, INC. (Population served: 130, Groundwater):
Past health violations:
MCL, Monthly (TCR) - Between JUL-2008 and SEP-2008, Contaminant: Coliform. Follow-up actions: St Formal NOV issued (JUL-31-2008), St Tech Assistance Visit (JUL-31-2008), St Compliance Meeting conducted (JUL-31-2008), St Public Notif requested (JUL-31-2008), St Public Notif received (AUG-13-2008), St Compliance achieved (AUG-18-2008)
Population served: 45, Groundwater):
Past health violations:
MCL, Average - Between MAY-08-2012 and AUG-21-2012, Contaminant: Nitrate. Follow-up actions: St Compliance Meeting conducted (MAY-22-2012), St Formal NOV issued (MAY-22-2012), St Public Notif requested (MAY-22-2012), St Public Notif received (MAY-29-2012), St Compliance achieved (AUG-21-2012)
Past monitoring violations:
Initial Tap Sampling for Pb and Cu - In JUL-01-1993, Contaminant: Lead and Copper Rule. Follow-up actions: St Violation/Reminder Notice (2 times from NOV-01-1993 to DEC-01-1993), St Formal NOV issued (FEB-11-1994), St Other (MAR-28-1994), St Compliance achieved (MAR-30-1994), Fed PAO issued (MAY-23-1994), Fed FAO issued (OCT-27-1994)
Drinking water stations with addresses in Shakopee that have no violations reported:
BONNEVISTA TERRACE MOBILE HOME PARK (Population served: 800, Primary Water Source Type: Groundwater)
Average household size: This city:
2.8 peopleMinnesota:
2.5 people
Percentage of family households: This city:
72.6%Whole state:
64.6%
Percentage of households with unmarried partners: This city:
7.2%Whole state:
6.9%
Likely homosexual households (counted as self-reported same-sex unmarried-partner households)
Lesbian couples: 0.3% of all households Gay men: 0.2% of all households
People in group quarters in Shakopee in 2010:
588 people in state prisons
167 people in nursing facilities/skilled-nursing facilities
88 people in local jails and other municipal confinement facilities
36 people in group homes intended for adults
5 people in emergency and transitional shelters (with sleeping facilities) for people experiencing homelessness
People in group quarters in Shakopee in 2000:
332 people in state prisons
103 people in nursing homes
22 people in local jails and other confinement facilities (including police lockups)
22 people in homes for the mentally retarded
9 people in other group homes
2 people in homes or halfway houses for drug/alcohol abuse
Banks with most branches in Shakopee (2011 data):
Wells Fargo Bank, National Association: Shakopee Vierling Branch at 1156 Vierling Drive East, branch established on 1998/12/21; Shakopee Downtown Branch at 380 Marschall Road, branch established on 1864/01/01. Info updated 2011/04/05: Bank assets: $1,161,490.0 mil, Deposits: $905,653.0 mil, headquarters in Sioux Falls, SD, positive income , 6395 total offices , Holding Company: Wells Fargo & Company
KleinBank: Shakopee Branch at 1407 Vierling Drive, branch established on 1998/07/06. Info updated 2010/11/22: Bank assets: $1,504.4 mil, Deposits: $1,255.9 mil, headquarters in Big Lake, MN, positive income , Commercial Lending Specialization, 22 total offices , Holding Company: Klein Financial, Inc.
BMO Harris Bank National Association: Shakopee Branch at 1341 Greenwood Court, branch established on 2005/09/26. Info updated 2011/07/14: Bank assets: $97,264.0 mil, Deposits: $75,624.6 mil, headquarters in Chicago, IL, positive income , 717 total offices , Holding Company: Bank Of Montreal
Citizens State Bank of Shakopee: Citizens State Bank Of Shakopee at 1100 East Fourth Avenue, branch established on 1978/04/10. Info updated 2011/03/31: Bank assets: $20.4 mil, Deposits: $18.8 mil, local headquarters , negative income in the last year , Commercial Lending Specialization, 1 total offices , Holding Company: Stonebridge Bancorporation
Guaranty Bank: Shakopee Mn Branch at 8101 Old Carriage Ct, branch established on 2005/11/02. Info updated 2011/07/21: Bank assets: $1,179.1 mil, Deposits: $1,102.7 mil, headquarters in Milwaukee, WI, negative income in the last year , Mortgage Lending Specialization, 166 total offices
TCF National Bank: Shakopee Cub Branch at 1198 Vierling Drive, branch established on 1998/10/16. Info updated 2009/11/23: Bank assets: $19,007.0 mil, Deposits: $12,377.0 mil, headquarters in Sioux Falls, SD, positive income , Commercial Lending Specialization, 441 total offices , Holding Company: Tcf Financial Corporation
Prime Security Bank: Shakopee Branch at 1305 Vierling Drive East, branch established on 1998/08/24. Info updated 2006/11/03: Bank assets: $68.8 mil, Deposits: $59.4 mil, headquarters in Karlstad, MN, negative income in the last year , Commercial Lending Specialization, 4 total offices , Holding Company: North State Bancshares, Inc.
Voyager Bank: 500 Marschal Road Branch at 500 Marschall Road, branch established on 1988/06/30. Info updated 2006/11/03: Bank assets: $378.9 mil, Deposits: $321.9 mil, headquarters in Eden Prairie, MN, negative income in the last year , Commercial Lending Specialization, 4 total offices , Holding Company: Voyager Financial Services Corporation
Paragon Bank: Shakopee Branch at 115 1st Avenue East, branch established on 2000/08/01. Info updated 2006/11/03: Bank assets: $31.0 mil, Deposits: $28.1 mil, headquarters in Wells, MN, positive income , Agricultural Specialization, 2 total offices , Holding Company: Southern Minnesota Bancshares, Inc.
For population 15 years and over in Shakopee:
Never married: 35.1%Now married: 48.3%Separated: 0.8%Widowed: 4.1%Divorced: 11.8% For population 25 years and over in Shakopee:
High school or higher: 92.6%Bachelor's degree or higher: 38.4%Graduate or professional degree: 11.5%Unemployed: 1.5%Mean travel time to work (commute): 16.2 minutes
Education Gini index (Inequality in education) Here:
12.2Minnesota average:
10.9
Religion statistics for Shakopee, MN (based on Scott County data)
Religion Adherents Congregations Catholic 39,912 12 Mainline Protestant 14,379 22 Evangelical Protestant 11,761 39 Other 8 2 None 63,868 -
Source: Clifford Grammich, Kirk Hadaway, Richard Houseal, Dale E.Jones, Alexei Krindatch, Richie Stanley and Richard H.Taylor. 2012. 2010 U.S.Religion Census: Religious Congregations & Membership Study. Association of Statisticians of American Religious Bodies. Jones, Dale E., et al. 2002. Congregations and Membership in the United States 2000. Nashville, TN: Glenmary Research Center. Graphs represent county-level data
Food Environment Statistics: Number of grocery stores : 16Scott County :
1.27 / 10,000 pop.Minnesota :
1.83 / 10,000 pop.
Number of supercenters and club stores : 1Here :
0.08 / 10,000 pop.State :
0.13 / 10,000 pop.
Number of convenience stores (no gas) : 4This county :
0.32 / 10,000 pop.Minnesota :
0.49 / 10,000 pop.
Number of convenience stores (with gas) : 40Scott County :
3.18 / 10,000 pop.Minnesota :
3.90 / 10,000 pop.
Number of full-service restaurants : 53This county :
4.21 / 10,000 pop.Minnesota :
6.98 / 10,000 pop.
Adult diabetes rate : Scott County :
5.0%Minnesota :
6.5%
Adult obesity rate : Scott County :
27.9%State :
25.9%
Low-income preschool obesity rate : Here :
13.3%Minnesota :
13.0%
Health and Nutrition: Healthy diet rate : This city:
47.4%State:
50.6%
Average overall health of teeth and gums : This city:
43.7%Minnesota:
48.4%
Average BMI : This city:
28.7Minnesota:
28.5
People feeling badly about themselves : This city:
21.3%State:
21.0%
People not drinking alcohol at all : Average hours sleeping at night : Overweight people : Shakopee:
31.8%Minnesota:
33.5%
General health condition : This city:
56.0%State:
57.7%
Average condition of hearing : This city:
79.8%State:
79.3%
More about Health and Nutrition of Shakopee, MN Residents
Local government employment and payroll (March 2022)
Function
Full-time employees
Monthly full-time payroll
Average yearly full-time wage
Part-time employees
Monthly part-time payroll
Police Protection - Officers
49 $428,251 $104,878 0 $0 Electric Power
36 $322,030 $107,343 4 $15,684 Water Supply
15 $141,136 $112,909 3 $8,443 Parks and Recreation
15 $94,332 $75,466 61 $40,100 Police - Other
13 $70,482 $65,060 0 $0 Streets and Highways
13 $91,610 $84,563 2 $826 Financial Administration
9 $73,002 $97,336 0 $0 Firefighters
4 $27,735 $83,205 41 $54,582 Fire - Other
4 $41,800 $125,400 0 $0 Sewerage
2 $16,643 $99,858 0 $0 Other Government Administration
0 $0 26 $21,608
Totals for Government
160 $1,307,022 $98,027 137 $141,244
Shakopee government finances - Expenditure in 2021 (per resident):
Construction - Regular Highways: $12,971,000 ($283.61)
Parks and Recreation: $493,000 ($10.78)Current Operations - Police Protection: $9,203,000 ($201.22)
Sewerage: $6,309,000 ($137.95)Parks and Recreation: $6,181,000 ($135.15)Regular Highways: $3,930,000 ($85.93)Central Staff Services: $3,446,000 ($75.35)Local Fire Protection: $3,075,000 ($67.24)Protective Inspection and Regulation - Other: $1,260,000 ($27.55)Financial Administration: $961,000 ($21.01)General Public Buildings: $618,000 ($13.51)General - Other: $534,000 ($11.68)Solid Waste Management: $117,000 ($2.56)Natural Resources - Other: $23,000 ($0.50)General - Interest on Debt: $1,214,000 ($26.54)
Other Capital Outlay - Sewerage: $2,740,000 ($59.91)
Parks and Recreation: $148,000 ($3.24)Central Staff Services: $18,000 ($0.39)Total Salaries and Wages: $14,990,000 ($327.76)
Shakopee government finances - Revenue in 2021 (per resident):
Charges - Sewerage: $4,162,000 ($91.00)
Other: $1,825,000 ($39.90)Parks and Recreation: $1,369,000 ($29.93)Solid Waste Management: $140,000 ($3.06)Federal Intergovernmental - Other: $3,234,000 ($70.71)
Local Intergovernmental - Other: $334,000 ($7.30)
General Local Government Support: $37,000 ($0.81)Miscellaneous - General Revenue - Other: $7,045,000 ($154.04)
Interest Earnings: $2,021,000 ($44.19)Sale of Property: $1,273,000 ($27.83)Special Assessments: $1,027,000 ($22.46)Fines and Forfeits: $21,000 ($0.46)State Intergovernmental - Highways: $1,497,000 ($32.73)
Other: $1,457,000 ($31.86)Tax - Property: $22,960,000 ($502.02)
Other License: $3,810,000 ($83.31)Public Utilities Sales: $3,416,000 ($74.69)Other Selective Sales: $216,000 ($4.72)Alcoholic Beverage License: $95,000 ($2.08)Occupation and Business License - Other: $19,000 ($0.42)
Shakopee government finances - Debt in 2021 (per resident):
Long Term Debt - Beginning Outstanding - Public Debt for Private Purpose: $105,300,000 ($2302.39)
Outstanding Nonguaranteed - Industrial Revenue: $102,051,000 ($2231.35)Outstanding Unspecified Public Purpose: $41,075,000 ($898.11)Beginning Outstanding - Unspecified Public Purpose: $34,660,000 ($757.84)Issue, Unspecified Public Purpose: $8,165,000 ($178.53)Retired Nonguaranteed - Public Debt for Private Purpose: $3,249,000 ($71.04)Retired Unspecified Public Purpose: $1,750,000 ($38.26)
Shakopee government finances - Cash and Securities in 2021 (per resident):
Bond Funds - Cash and Securities: $4,342,000 ($94.94)
Other Funds - Cash and Securities: $64,553,000 ($1411.46)
Sinking Funds - Cash and Securities: $106,377,000 ($2325.94)
Businesses in Shakopee, MN
Name Count Name Count
Ace Hardware 1 Kohl's 1 AmericInn 1 La-Z-Boy 1 Applebee's 1 Lane Furniture 3 Arby's 2 Lowe's 1 Ashley Furniture 1 McDonald's 2 AutoZone 1 New Balance 1 Ben & Jerry's 1 Nike 3 Best Western 1 OfficeMax 1 Blockbuster 1 Panda Express 1 Burger King 1 Panera Bread 1 CVS 1 Payless 1 Caribou Coffee 2 Penske 1 Chevrolet 1 Pier 1 Imports 1 Chipotle 1 Pizza Hut 1 Cinnabon 1 RadioShack 1 Dairy Queen 2 Ruby Tuesday 1 Discount Tire 1 Sam's Club 1 Domino's Pizza 1 Slumberland 1 Famous Footwear 1 Sprint Nextel 1 Fashion Bug 1 Subway 5 FedEx 4 Super 8 1 Ford 1 T-Mobile 3 GNC 2 Taco Bell 1 GameStop 1 Target 1 Goodwill 2 Travelodge 1 H&R Block 1 U-Haul 2 Haagen-Dazs 1 UPS 4 Hilton 1 Verizon Wireless 1 Home Depot 1 Walgreens 1 Jimmy John's 1 Walmart 1 Jones New York 1 White Castle 1 KFC 1
Strongest AM radio stations in Shakopee:
KSMM (1530 AM; 9 kW; SHAKOPEE, MN; Owner: STARBOARD BROADCASTING, INC.)
KFAN (1130 AM; 50 kW; MINNEAPOLIS, MN; Owner: AMFM RADIO LICENSES, L.L.C.)
WMNN (1330 AM; 10 kW; MINNEAPOLIS, MN; Owner: MINNESOTA PUBLIC RADIO.)
WCCO (830 AM; 50 kW; MINNEAPOLIS, MN; Owner: INFINITY MEDIA CORPORATION)
WCTS (1030 AM; 50 kW; MAPLEWOOD, MN; Owner: CNTL. BAPT. THEO/AL SEMI MINNEAPOLIS)
KSTP (1500 AM; 50 kW; ST. PAUL, MN; Owner: KSTP-AM, LLC (DELAWARE))
KTIS (900 AM; 25 kW; MINNEAPOLIS, MN; Owner: NORTHWESTERN COLLEGE)
KKMS (980 AM; 5 kW; RICHFIELD, MN)
KCCO (950 AM; 1 kW; ST. LOUIS PARK, MN; Owner: THE AUDIO HOUSE, INC.)
WWTC (1280 AM; 5 kW; MINNEAPOLIS, MN; Owner: SCA LICENSE CORPORATION)
KDIZ (1440 AM; 5 kW; GOLDEN VALLEY, MN; Owner: KQRS, INC.)
KUOM (770 AM; daytime; 5 kW; MINNEAPOLIS, MN)
KYCR (1570 AM; 4 kW; GOLDEN VALLEY, MN; Owner: COMMON GROUND BROADCASTING COMPANY,)
Strongest FM radio stations in Shakopee:
KTCZ-FM (97.1 FM; MINNEAPOLIS, MN; Owner: AMFM RADIO LICENSES, L.L.C.)
WGVZ (105.7 FM; EDEN PRAIRIE, MN; Owner: KQRS, INC.)
KNOW-FM (91.1 FM; MINNEAPOLIS-ST. PAUL, MN; Owner: MINNESOTA PUBLIC RADIO)
WLTE (102.9 FM; MINNEAPOLIS, MN; Owner: INFINITY MEDIA CORPORATION)
KSTP-FM (94.5 FM; ST. PAUL, MN; Owner: KSTP-FM, LLC, A DELAWARE LLC)
KEEY-FM (102.1 FM; ST. PAUL, MN; Owner: AMFM RADIO LICENSES, L.L.C.)
KTIS-FM (98.5 FM; MINNEAPOLIS, MN; Owner: NORTHWESTERN COLLEGE)
K214DF (90.7 FM; GOLDEN VALLEY, MN; Owner: EDUCATIONAL MEDIA FOUNDATION)
KDWB-FM (101.3 FM; RICHFIELD, MN; Owner: AMFM RADIO LICENSES, L.L.C.)
KQRS-FM (92.5 FM; GOLDEN VALLEY, MN; Owner: KQRS, Inc.)
KSJN (99.5 FM; MINNEAPOLIS, MN; Owner: MINNESOTA PUBLIC RADIO)
KXXR (93.7 FM; MINNEAPOLIS, MN; Owner: KQRS, INC.)
WCAL (89.3 FM; NORTHFIELD, MN; Owner: ST. OLAF COLLEGE)
KQQL (107.9 FM; ANOKA, MN; Owner: AMFM RADIO LICENSES, L.L.C.)
WGVX (105.1 FM; LAKEVILLE, MN; Owner: KQRS, INC.)
KFAI (90.3 FM; MINNEAPOLIS, MN; Owner: FRESH AIR, INC.)
KTTB (96.3 FM; GLENCOE, MN; Owner: BLUE CHIP BROADCASTING LICENSES II, LTD.)
KBEM-FM (88.5 FM; MINNEAPOLIS, MN; Owner: BD. OF EDUCATION, S.S.D. NO. 1)
KJZI (100.3 FM; MINNEAPOLIS, MN; Owner: AMFM RADIO LICENSES, L.L.C.)
WXPT (104.1 FM; ST. LOUIS PARK, MN; Owner: THE AUDIO HOUSE, INC.)
TV broadcast stations around Shakopee:
KMSP-TV (Channel 9; MINNEAPOLIS, MN; Owner: FOX TELEVISION STATIONS, INC.)
KARE (Channel 11; MINNEAPOLIS, MN; Owner: MULTIMEDIA HOLDINGS CORPORATION)
KSTP-TV (Channel 5; ST. PAUL, MN; Owner: HUBBARD BROADCASTING, INC.)
K07UI (Channel 7; MINNEAPOLIS, ETC., MN; Owner: WORD OF GOD FELLOWSHIP, INC.)
KTCA-TV (Channel 2; ST. PAUL, MN; Owner: TWIN CITIES PUBLIC TELEVISION, INC.)
K58BS (Channel 58; MINNEAPOLIS, MN; Owner: TRINITY BROADCASTING NETWORK)
K67HG (Channel 67; MINNEAPOLIS, MN; Owner: VENTANA TELEVISION, INC.)
K14KH (Channel 14; MINNEAPOLIS, MN; Owner: THREE ANGELS BROADCASTING NETWORK)
K19ER (Channel 19; ST. PAUL, MN; Owner: CATHOLIC VIEWS BROADCASTS, INC.)
WCCO-TV (Channel 4; MINNEAPOLIS, MN; Owner: CBS BROADCASTING INC.)
W62BD (Channel 62; MINNEAPOLIS, MN; Owner: WORD OF GOD FELLOWSHIP, INC.)
KSTC-TV (Channel 45; MINNEAPOLIS, MN; Owner: HUBBARD BROADCASTING, INC.)
KTCI-TV (Channel 17; ST. PAUL, MN; Owner: TWIN CITIES PUBLIC TELEVISION, INC.)
KMWB (Channel 23; MINNEAPOLIS, MN; Owner: KLGT LICENSEE, LLC)
WFTC (Channel 29; MINNEAPOLIS, MN; Owner: FOX TELEVISION STATIONS, INC.)
WBWX-CA (Channel 13; MINNEAPOLIS, MN; Owner: THE BOX WORLDWIDE LLC)
KPXM (Channel 41; ST. CLOUD, MN; Owner: PAXSON MINNEAPOLIS LICENSE, INC.)
Home Mortgage Disclosure Act Aggregated Statistics For Year 2009(Based on 5 full tracts) A) FHA, FSA/RHS & VA B) Conventional C) Refinancings D) Home Improvement Loans F) Non-occupant Loans on G) Loans On Manufactured Number Average Value Number Average Value Number Average Value Number Average Value Number Average Value Number Average Value
LOANS ORIGINATED 368 $180,419 235 $185,968 984 $213,003 29 $102,777 43 $117,564 0 $0 APPLICATIONS APPROVED, NOT ACCEPTED 12 $158,958 14 $142,857 84 $232,596 7 $75,857 7 $142,893 1 $25,000 APPLICATIONS DENIED 41 $173,196 26 $181,142 370 $228,783 32 $80,688 14 $153,929 0 $0 APPLICATIONS WITHDRAWN 38 $147,232 18 $147,591 247 $220,425 16 $96,062 8 $108,499 0 $0 FILES CLOSED FOR INCOMPLETENESS 7 $168,481 2 $150,500 67 $203,122 6 $256,500 2 $147,500 0 $0
Aggregated Statistics For Year 2008(Based on 5 full tracts) A) FHA, FSA/RHS & VA B) Conventional C) Refinancings D) Home Improvement Loans E) Loans on Dwellings For 5+ Families F) Non-occupant Loans on G) Loans On Manufactured Number Average Value Number Average Value Number Average Value Number Average Value Number Average Value Number Average Value Number Average Value
LOANS ORIGINATED 236 $203,576 321 $219,465 485 $205,217 50 $53,811 2 $644,525 60 $157,176 1 $3,000 APPLICATIONS APPROVED, NOT ACCEPTED 15 $198,286 50 $192,283 80 $211,386 8 $182,875 0 $0 11 $154,057 2 $33,000 APPLICATIONS DENIED 27 $211,828 58 $207,482 369 $221,739 48 $51,412 0 $0 17 $136,426 1 $27,000 APPLICATIONS WITHDRAWN 22 $209,500 42 $224,582 170 $241,720 16 $64,625 0 $0 6 $155,000 0 $0 FILES CLOSED FOR INCOMPLETENESS 4 $280,250 8 $204,000 40 $228,100 9 $52,000 0 $0 1 $240,000 0 $0
Aggregated Statistics For Year 2007(Based on 5 full tracts) A) FHA, FSA/RHS & VA B) Conventional C) Refinancings D) Home Improvement Loans F) Non-occupant Loans on G) Loans On Manufactured Number Average Value Number Average Value Number Average Value Number Average Value Number Average Value Number Average Value
LOANS ORIGINATED 47 $202,206 776 $188,949 616 $181,383 80 $62,449 113 $165,424 1 $27,000 APPLICATIONS APPROVED, NOT ACCEPTED 1 $275,000 97 $191,425 166 $170,441 25 $105,395 17 $132,972 2 $55,500 APPLICATIONS DENIED 5 $172,000 198 $162,680 596 $210,963 59 $110,934 62 $188,968 6 $34,833 APPLICATIONS WITHDRAWN 2 $278,500 97 $198,456 206 $209,008 20 $114,042 14 $171,000 0 $0 FILES CLOSED FOR INCOMPLETENESS 0 $0 22 $209,293 75 $242,798 7 $92,286 5 $204,602 0 $0
Aggregated Statistics For Year 2006(Based on 5 full tracts) A) FHA, FSA/RHS & VA B) Conventional C) Refinancings D) Home Improvement Loans E) Loans on Dwellings For 5+ Families F) Non-occupant Loans on G) Loans On Manufactured Number Average Value Number Average Value Number Average Value Number Average Value Number Average Value Number Average Value Number Average Value
LOANS ORIGINATED 59 $211,305 1,249 $175,583 858 $168,763 109 $68,617 4 $2,052,750 117 $153,408 2 $34,500 APPLICATIONS APPROVED, NOT ACCEPTED 1 $186,000 201 $165,093 188 $165,589 23 $61,949 0 $0 20 $132,960 4 $49,000 APPLICATIONS DENIED 1 $166,000 261 $161,265 493 $185,870 74 $103,578 2 $293,000 38 $162,674 5 $39,000 APPLICATIONS WITHDRAWN 5 $202,600 181 $178,743 376 $205,186 26 $104,088 0 $0 20 $119,097 0 $0 FILES CLOSED FOR INCOMPLETENESS 1 $278,000 42 $213,479 93 $190,262 4 $48,418 0 $0 1 $157,000 0 $0
Aggregated Statistics For Year 2005(Based on 5 full tracts) A) FHA, FSA/RHS & VA B) Conventional C) Refinancings D) Home Improvement Loans E) Loans on Dwellings For 5+ Families F) Non-occupant Loans on G) Loans On Manufactured Number Average Value Number Average Value Number Average Value Number Average Value Number Average Value Number Average Value Number Average Value
LOANS ORIGINATED 83 $197,710 1,661 $176,320 998 $186,264 107 $71,107 4 $377,475 137 $153,960 1 $29,000 APPLICATIONS APPROVED, NOT ACCEPTED 4 $190,998 183 $171,425 136 $154,961 21 $58,048 0 $0 17 $157,235 6 $37,833 APPLICATIONS DENIED 5 $202,400 261 $163,475 541 $191,352 76 $52,876 0 $0 32 $160,630 5 $27,600 APPLICATIONS WITHDRAWN 10 $189,200 227 $176,068 411 $202,455 38 $136,252 0 $0 31 $143,618 0 $0 FILES CLOSED FOR INCOMPLETENESS 0 $0 46 $140,326 172 $196,589 5 $94,000 0 $0 9 $117,228 0 $0
Aggregated Statistics For Year 2004(Based on 5 full tracts) A) FHA, FSA/RHS & VA B) Conventional C) Refinancings D) Home Improvement Loans E) Loans on Dwellings For 5+ Families F) Non-occupant Loans on G) Loans On Manufactured Number Average Value Number Average Value Number Average Value Number Average Value Number Average Value Number Average Value Number Average Value
LOANS ORIGINATED 147 $182,949 1,488 $185,138 1,127 $176,480 94 $70,668 1 $288,000 106 $152,002 1 $136,000 APPLICATIONS APPROVED, NOT ACCEPTED 9 $169,229 158 $192,487 194 $172,886 16 $76,000 0 $0 6 $194,198 2 $33,000 APPLICATIONS DENIED 8 $183,500 189 $172,662 459 $177,826 64 $48,354 0 $0 29 $134,559 7 $36,857 APPLICATIONS WITHDRAWN 9 $178,889 167 $198,362 361 $190,445 20 $58,058 0 $0 28 $169,624 1 $167,000 FILES CLOSED FOR INCOMPLETENESS 3 $185,667 30 $173,461 104 $187,293 3 $141,310 0 $0 3 $146,667 0 $0
Aggregated Statistics For Year 2003(Based on 5 full tracts) A) FHA, FSA/RHS & VA B) Conventional C) Refinancings D) Home Improvement Loans E) Loans on Dwellings For 5+ Families F) Non-occupant Loans on Number Average Value Number Average Value Number Average Value Number Average Value Number Average Value Number Average Value
LOANS ORIGINATED 229 $172,779 1,306 $175,000 2,756 $166,580 89 $41,035 3 $597,333 111 $147,702 APPLICATIONS APPROVED, NOT ACCEPTED 7 $173,429 96 $168,418 263 $152,106 19 $29,261 0 $0 8 $164,250 APPLICATIONS DENIED 16 $173,276 100 $137,723 500 $152,714 48 $35,303 0 $0 16 $131,500 APPLICATIONS WITHDRAWN 17 $164,765 123 $189,223 376 $157,582 8 $44,750 0 $0 18 $157,902 FILES CLOSED FOR INCOMPLETENESS 5 $180,400 27 $174,481 103 $174,130 3 $27,000 0 $0 2 $147,000
Aggregated Statistics For Year 2002(Based on 3 full tracts) A) FHA, FSA/RHS & VA B) Conventional C) Refinancings D) Home Improvement Loans E) Loans on Dwellings For 5+ Families F) Non-occupant Loans on Number Average Value Number Average Value Number Average Value Number Average Value Number Average Value Number Average Value
LOANS ORIGINATED 48 $161,416 136 $143,689 408 $122,985 24 $22,957 1 $206,960 21 $171,686 APPLICATIONS APPROVED, NOT ACCEPTED 1 $168,000 9 $119,286 60 $121,620 4 $8,992 0 $0 0 $0 APPLICATIONS DENIED 0 $0 11 $123,420 80 $106,322 13 $23,221 0 $0 1 $118,410 APPLICATIONS WITHDRAWN 0 $0 9 $150,142 92 $127,886 4 $30,250 0 $0 0 $0 FILES CLOSED FOR INCOMPLETENESS 1 $171,000 3 $184,443 44 $136,045 1 $40,000 0 $0 0 $0
Aggregated Statistics For Year 2001(Based on 3 full tracts) A) FHA, FSA/RHS & VA B) Conventional C) Refinancings D) Home Improvement Loans E) Loans on Dwellings For 5+ Families F) Non-occupant Loans on Number Average Value Number Average Value Number Average Value Number Average Value Number Average Value Number Average Value
LOANS ORIGINATED 44 $151,818 101 $120,358 353 $102,570 46 $25,298 2 $779,500 16 $116,552 APPLICATIONS APPROVED, NOT ACCEPTED 0 $0 10 $94,941 35 $90,647 7 $41,453 0 $0 0 $0 APPLICATIONS DENIED 1 $151,240 6 $95,000 90 $88,482 13 $16,903 0 $0 1 $130,000 APPLICATIONS WITHDRAWN 1 $158,000 6 $129,107 101 $119,137 4 $19,750 0 $0 5 $85,754 FILES CLOSED FOR INCOMPLETENESS 0 $0 2 $291,420 16 $124,015 1 $17,000 0 $0 0 $0
Aggregated Statistics For Year 2000(Based on 3 full tracts) A) FHA, FSA/RHS & VA B) Conventional C) Refinancings D) Home Improvement Loans E) Loans on Dwellings For 5+ Families F) Non-occupant Loans on Number Average Value Number Average Value Number Average Value Number Average Value Number Average Value Number Average Value
LOANS ORIGINATED 59 $128,700 111 $118,172 89 $85,384 59 $19,832 0 $0 7 $87,234 APPLICATIONS APPROVED, NOT ACCEPTED 2 $104,500 6 $104,808 14 $73,996 11 $21,347 0 $0 0 $0 APPLICATIONS DENIED 1 $151,240 19 $91,850 62 $77,092 14 $23,703 0 $0 6 $150,360 APPLICATIONS WITHDRAWN 1 $96,520 8 $123,360 54 $101,477 4 $16,222 1 $116,000 1 $97,510 FILES CLOSED FOR INCOMPLETENESS 2 $66,500 2 $121,500 29 $109,373 1 $20,000 0 $0 0 $0
Aggregated Statistics For Year 1999(Based on 4 full and 1 partial tracts) A) FHA, FSA/RHS & VA B) Conventional C) Refinancings D) Home Improvement Loans E) Loans on Dwellings For 5+ Families F) Non-occupant Loans on Number Average Value Number Average Value Number Average Value Number Average Value Number Average Value Number Average Value
LOANS ORIGINATED 351 $116,827 593 $123,446 410 $94,420 111 $20,511 2 $1,755,415 18 $98,318 APPLICATIONS APPROVED, NOT ACCEPTED 11 $106,191 34 $77,846 78 $82,522 12 $28,343 0 $0 2 $33,365 APPLICATIONS DENIED 20 $114,832 94 $78,967 154 $90,916 30 $17,355 0 $0 3 $49,060 APPLICATIONS WITHDRAWN 14 $106,587 42 $122,244 100 $105,776 14 $68,656 0 $0 2 $71,605 FILES CLOSED FOR INCOMPLETENESS 5 $114,400 16 $95,441 26 $108,667 2 $28,860 0 $0 0 $0
Detailed HMDA statistics for the following Tracts:
0803.01
, 0803.02 , 0804.00 , 0805.00 , 0806.00
Private Mortgage Insurance Companies Aggregated Statistics For Year 2009(Based on 5 full tracts) A) Conventional B) Refinancings C) Non-occupant Loans on Number Average Value Number Average Value Number Average Value
LOANS ORIGINATED 53 $228,725 33 $267,921 0 $0 APPLICATIONS APPROVED, NOT ACCEPTED 23 $261,984 17 $266,706 1 $180,000 APPLICATIONS DENIED 7 $162,143 5 $276,000 0 $0 APPLICATIONS WITHDRAWN 3 $217,000 3 $164,000 0 $0 FILES CLOSED FOR INCOMPLETENESS 3 $219,333 1 $276,000 0 $0
Aggregated Statistics For Year 2008(Based on 5 full tracts) A) Conventional B) Refinancings C) Non-occupant Loans on Number Average Value Number Average Value Number Average Value
LOANS ORIGINATED 131 $231,827 77 $245,391 9 $213,222 APPLICATIONS APPROVED, NOT ACCEPTED 31 $246,173 37 $266,458 1 $244,000 APPLICATIONS DENIED 9 $215,333 7 $226,857 2 $248,000 APPLICATIONS WITHDRAWN 7 $228,499 4 $458,250 0 $0 FILES CLOSED FOR INCOMPLETENESS 8 $205,125 3 $233,000 4 $177,000
Aggregated Statistics For Year 2007(Based on 5 full tracts) A) Conventional B) Refinancings C) Non-occupant Loans on Number Average Value Number Average Value Number Average Value
LOANS ORIGINATED 247 $211,790 86 $235,842 14 $208,156 APPLICATIONS APPROVED, NOT ACCEPTED 20 $235,650 14 $220,143 1 $175,000 APPLICATIONS DENIED 3 $209,000 3 $369,667 2 $162,000 APPLICATIONS WITHDRAWN 16 $213,107 9 $252,000 6 $175,118 FILES CLOSED FOR INCOMPLETENESS 2 $139,500 1 $260,000 0 $0
Aggregated Statistics For Year 2006(Based on 5 full tracts) A) Conventional B) Refinancings C) Non-occupant Loans on Number Average Value Number Average Value Number Average Value
LOANS ORIGINATED 121 $220,183 55 $217,701 2 $169,000 APPLICATIONS APPROVED, NOT ACCEPTED 13 $248,077 5 $250,600 0 $0 APPLICATIONS DENIED 3 $232,000 1 $156,000 0 $0 APPLICATIONS WITHDRAWN 3 $316,667 0 $0 0 $0 FILES CLOSED FOR INCOMPLETENESS 0 $0 0 $0 0 $0
Aggregated Statistics For Year 2005(Based on 5 full tracts) A) Conventional B) Refinancings C) Non-occupant Loans on Number Average Value Number Average Value Number Average Value
LOANS ORIGINATED 142 $222,167 68 $220,323 4 $185,750 APPLICATIONS APPROVED, NOT ACCEPTED 24 $211,951 9 $236,667 1 $133,000 APPLICATIONS DENIED 2 $177,000 0 $0 1 $171,000 APPLICATIONS WITHDRAWN 8 $197,000 6 $252,333 1 $158,000 FILES CLOSED FOR INCOMPLETENESS 3 $175,333 2 $200,000 0 $0
Aggregated Statistics For Year 2004(Based on 5 full tracts) A) Conventional B) Refinancings C) Non-occupant Loans on Number Average Value Number Average Value Number Average Value
LOANS ORIGINATED 290 $210,065 84 $197,090 12 $184,041 APPLICATIONS APPROVED, NOT ACCEPTED 48 $203,067 38 $220,585 4 $165,750 APPLICATIONS DENIED 8 $278,875 5 $289,600 2 $407,500 APPLICATIONS WITHDRAWN 25 $211,803 16 $209,312 7 $165,429 FILES CLOSED FOR INCOMPLETENESS 5 $226,600 0 $0 0 $0
Aggregated Statistics For Year 2003(Based on 5 full tracts) A) Conventional B) Refinancings C) Non-occupant Loans on Number Average Value Number Average Value Number Average Value
LOANS ORIGINATED 379 $198,350 332 $182,439 21 $160,985 APPLICATIONS APPROVED, NOT ACCEPTED 36 $176,683 66 $187,061 1 $153,000 APPLICATIONS DENIED 5 $233,252 1 $215,000 1 $323,000 APPLICATIONS WITHDRAWN 7 $206,529 18 $170,944 1 $132,340 FILES CLOSED FOR INCOMPLETENESS 1 $169,000 2 $186,500 0 $0
Aggregated Statistics For Year 2002(Based on 3 full tracts) A) Conventional B) Refinancings C) Non-occupant Loans on Number Average Value Number Average Value Number Average Value
LOANS ORIGINATED 42 $157,760 32 $158,447 4 $123,092 APPLICATIONS APPROVED, NOT ACCEPTED 7 $144,451 7 $148,134 1 $115,000 APPLICATIONS DENIED 1 $111,000 0 $0 0 $0 APPLICATIONS WITHDRAWN 1 $166,000 3 $136,333 0 $0 FILES CLOSED FOR INCOMPLETENESS 0 $0 0 $0 0 $0
Aggregated Statistics For Year 2001(Based on 3 full tracts) A) Conventional B) Refinancings C) Non-occupant Loans on Number Average Value Number Average Value Number Average Value
LOANS ORIGINATED 74 $154,219 62 $142,241 2 $154,000 APPLICATIONS APPROVED, NOT ACCEPTED 5 $120,702 8 $142,000 0 $0 APPLICATIONS DENIED 0 $0 2 $182,595 1 $161,190 APPLICATIONS WITHDRAWN 0 $0 3 $150,000 1 $136,000 FILES CLOSED FOR INCOMPLETENESS 0 $0 1 $145,000 0 $0
Aggregated Statistics For Year 2000(Based on 3 full tracts) A) Conventional B) Refinancings Number Average Value Number Average Value
LOANS ORIGINATED 36 $129,993 11 $136,091 APPLICATIONS APPROVED, NOT ACCEPTED 1 $67,660 1 $138,000 APPLICATIONS DENIED 0 $0 0 $0 APPLICATIONS WITHDRAWN 1 $121,000 0 $0 FILES CLOSED FOR INCOMPLETENESS 1 $193,000 0 $0
Aggregated Statistics For Year 1999(Based on 4 full and 1 partial tracts) A) Conventional B) Refinancings C) Non-occupant Loans on Number Average Value Number Average Value Number Average Value
LOANS ORIGINATED 210 $139,186 50 $133,693 6 $98,920 APPLICATIONS APPROVED, NOT ACCEPTED 12 $137,885 11 $126,757 0 $0 APPLICATIONS DENIED 8 $165,135 2 $106,005 1 $88,560 APPLICATIONS WITHDRAWN 5 $162,124 1 $138,100 0 $0 FILES CLOSED FOR INCOMPLETENESS 0 $0 0 $0 0 $0
Detailed PMIC statistics for the following Tracts:
0803.01
, 0803.02 , 0804.00 , 0805.00 , 0806.00 Fire-safe hotels and motels in Shakopee, Minnesota:
Hill View Motel, Hwy 169 & 41, Shakopee, Minnesota 55379 Phone: (952) 445-7111
Best Western Shakopee Inn, 511 S Marschall Rd, Shakopee, Minnesota 55379 Phone: (952) 445-9779, Fax: (952) 445-9725
Americinn Lodge & Suites, 4100 12th Ave E, Shakopee, Minnesota 55379 Phone: (952) 445-6775, Fax: (952) 277-1100
Hampton Inn Minneapolis/Shakopee, 4175 Dean Lakes Blvd, Shakopee, Minnesota 55379 Phone: (952) 641-3600, Fax: (952) 641-3601
Holiday Inn Express And Suites Shakopee, 4550 12th Ave E, Shakopee, Minnesota 55379 Phone: (952) 445-2244, Fax: (952) 445-0077
Americas Best Value Inn & Suites-Shakopee/Minneapolis (formerly Known As Canterbury Inn), 1244 Canterbury Rd, Shakopee, Minnesota 55379 Phone: (952) 445-3644, Fax: (952) 445-5710
All 6 fire-safe hotels and motels in Shakopee, Minnesota
Most common first names in Shakopee, MN among deceased individuals Name Count Lived (average)
Mary 77 80.6 years John 58 77.5 years William 53 74.2 years Joseph 47 74.3 years Robert 37 70.7 years James 37 66.9 years Anna 36 85.1 years George 35 75.4 years Margaret 33 80.1 years Donald 31 70.5 years
Most common last names in Shakopee, MN among deceased individuals Last name Count Lived (average)
Johnson 24 75.1 years Anderson 22 75.0 years Schmitt 20 74.4 years Smith 20 76.9 years Menden 19 81.8 years Theis 19 77.4 years Peterson 15 73.7 years Hennen 14 79.2 years Pink 14 78.2 years Marschall 13 80.1 years
Shakopee compared to Minnesota state average:
Unemployed percentage significantly below state average. Black race population percentage significantly above state average. Hispanic race population percentage significantly above state average. Median age significantly below state average. Foreign-born population percentage significantly above state average. House age significantly below state average. Institutionalized population percentage above state average.
#44 on the list of "Top 101 cities with largest percentage of females in occupations: business and financial operations occupations (population 5,000+)"
#49 on the list of "Top 101 cities with the most local government spending on highway construction per resident (population 10,000+)"
#18 on the list of "Top 101 counties with the lowest percentage of residents relocating to foreign countries in 2011"
#45 on the list of "Top 101 counties with the lowest number of deaths per 1000 residents 2007-2013"
#55 on the list of "Top 101 counties with the largest number of children under 18 without health insurance coverage in 2000"
Top Patent Applicants
Thomas Marcouiller (52)
Dean Zavadsky (39)
Jonathan R. Kaml (39)
Dennis Krampotich (34)
Vance D. Fiegel (29)
Sarbeswar Sahoo (22)
Roderick B. Wideman (20)
Venkateswara Rao Inturi (18)
David Scott Seekins (17)
Sumanth Jannyavula Venkata (13)
Total of 1018 patent applications in 2008-2024.
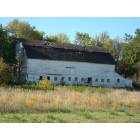


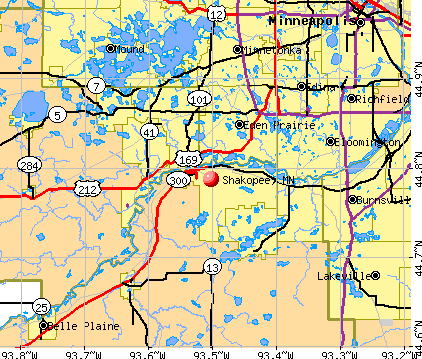


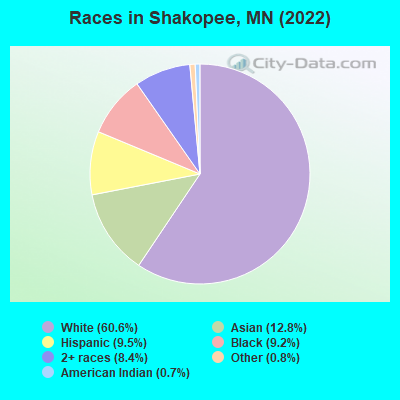
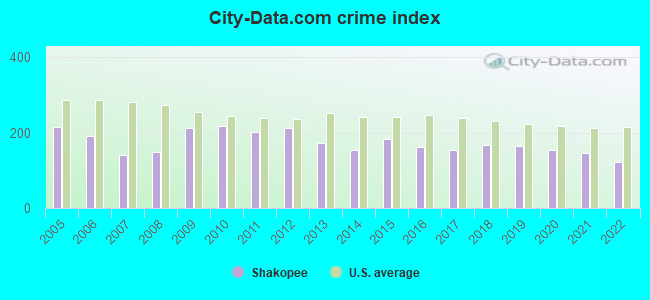
 Recent articles from our blog. Our writers, many of them Ph.D. graduates or candidates, create easy-to-read articles on a wide variety of topics.

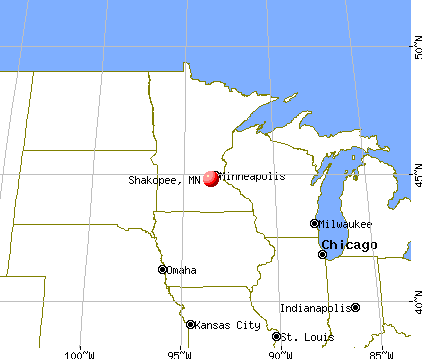
 (5.0 miles
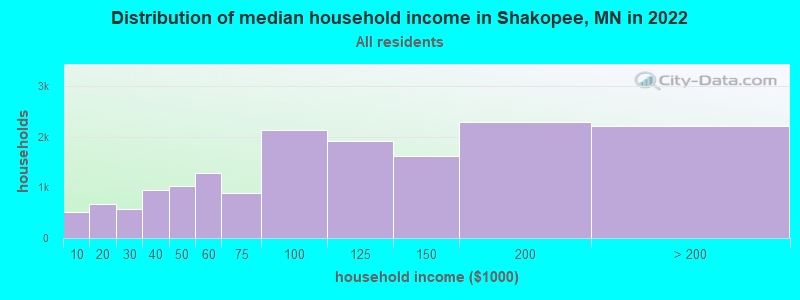
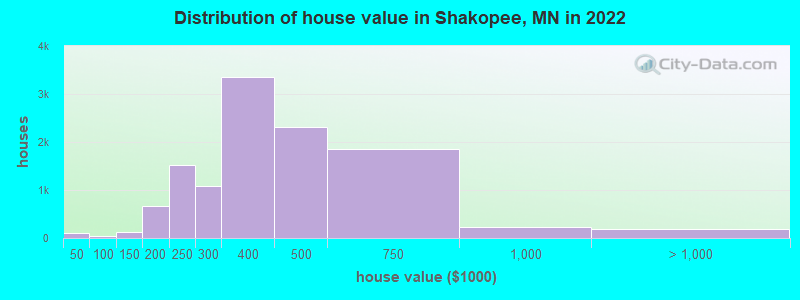

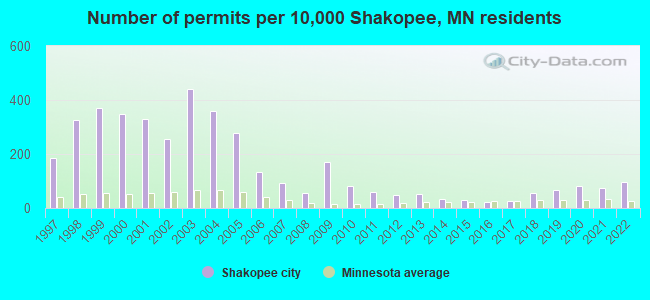
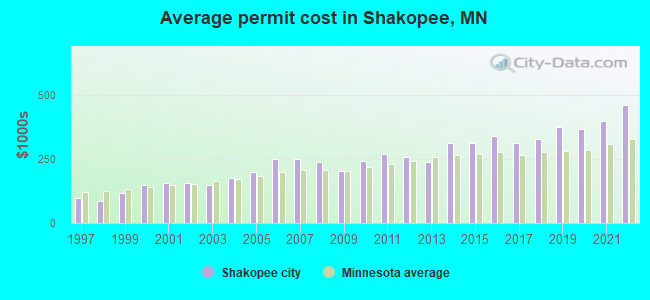
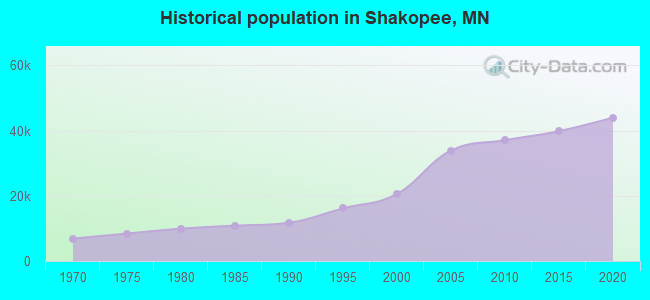
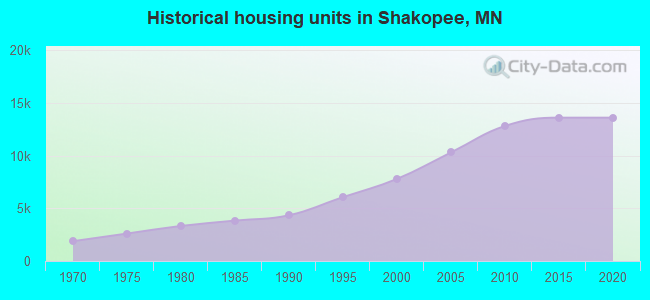
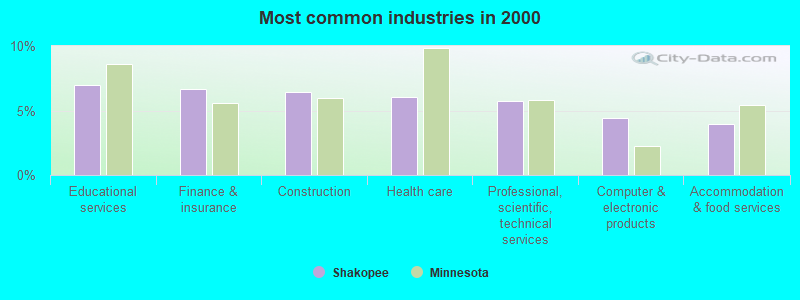
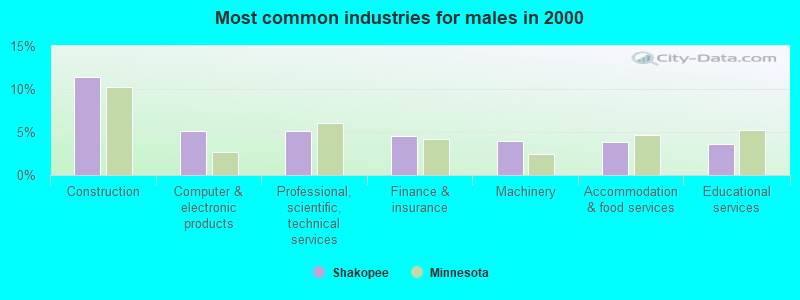
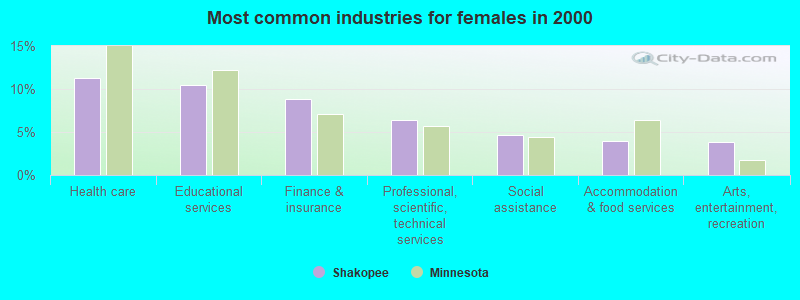
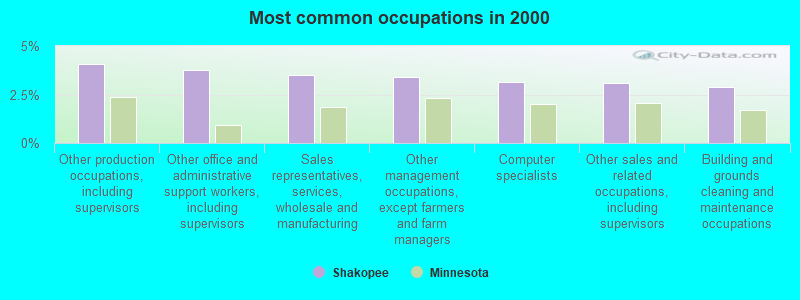
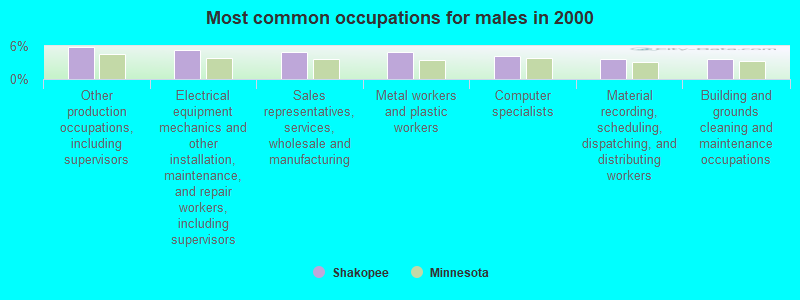
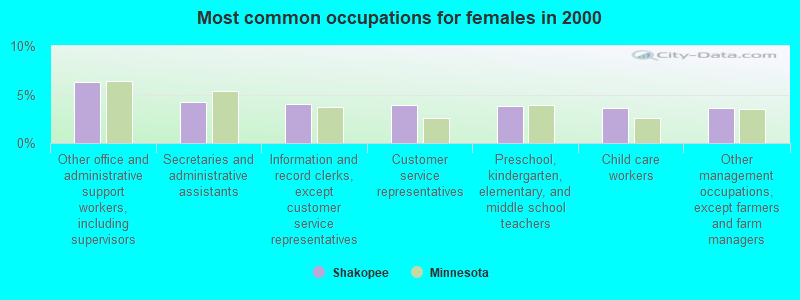


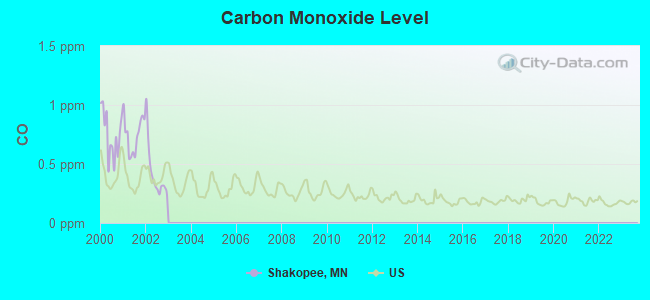
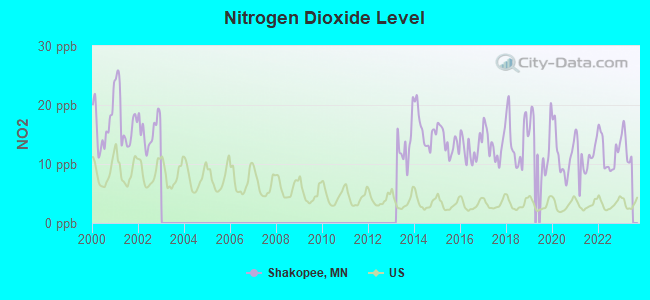
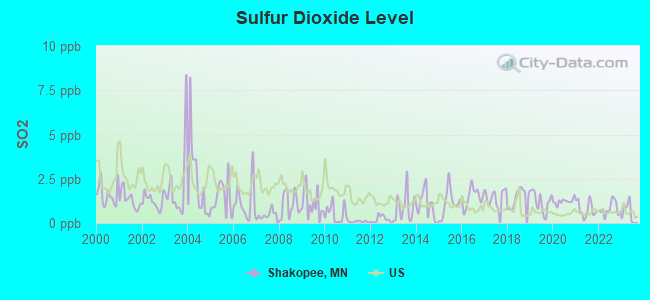
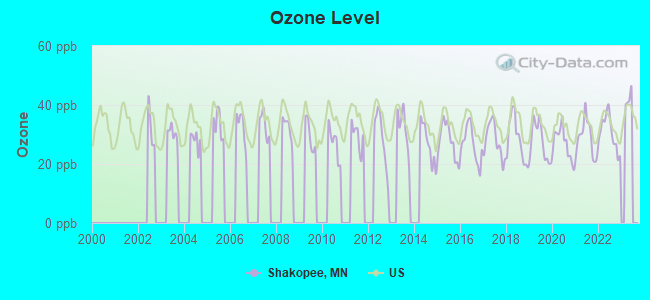
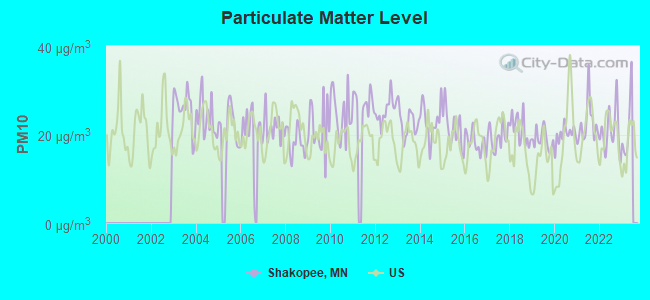
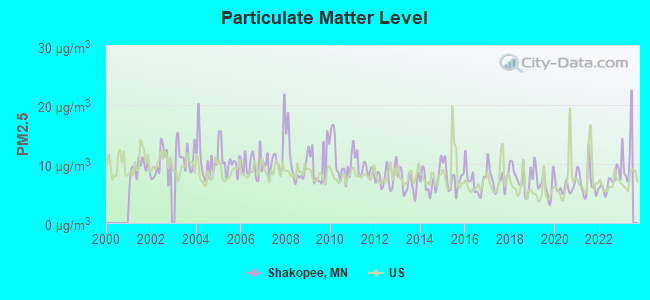
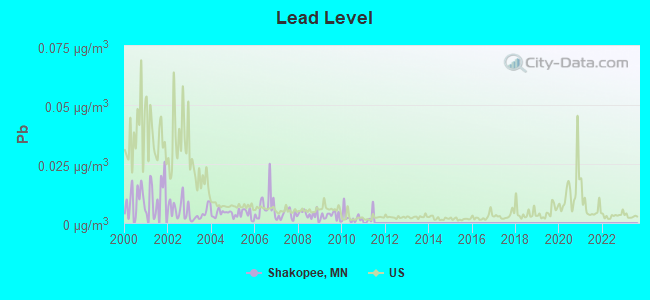
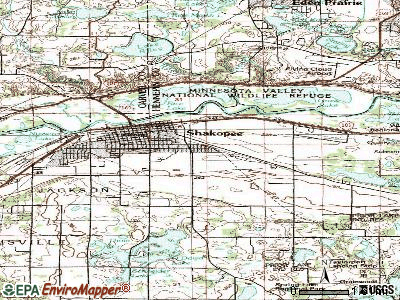
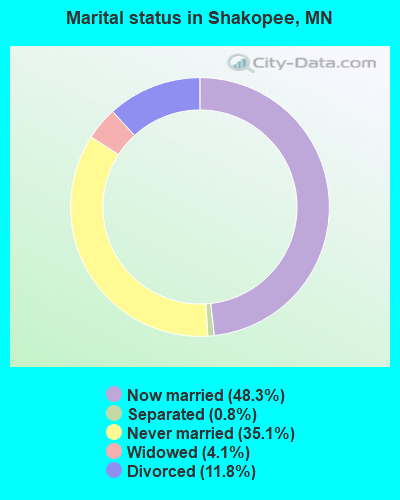
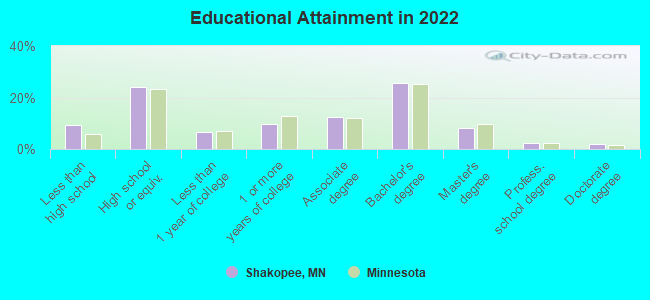
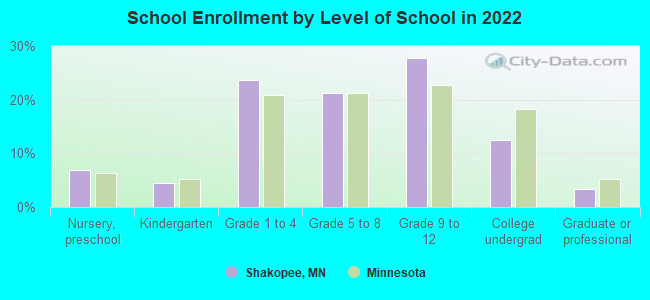
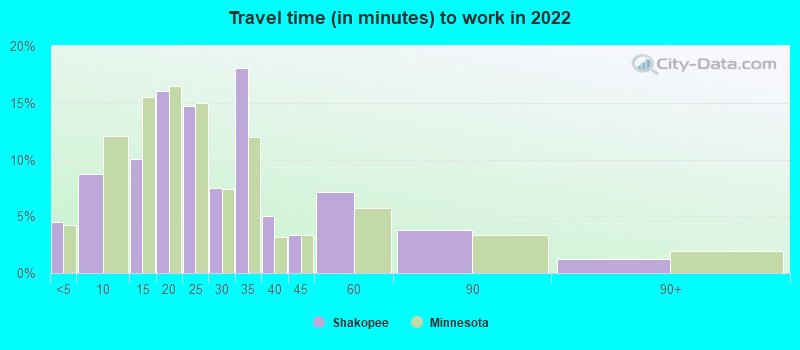
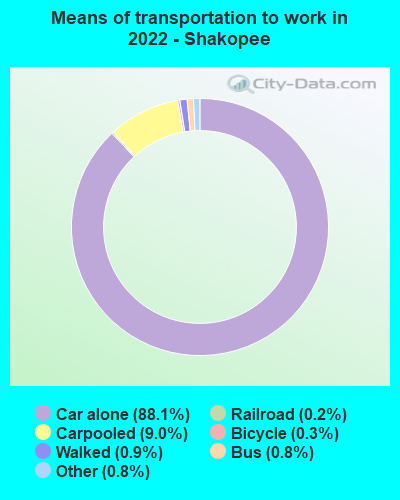
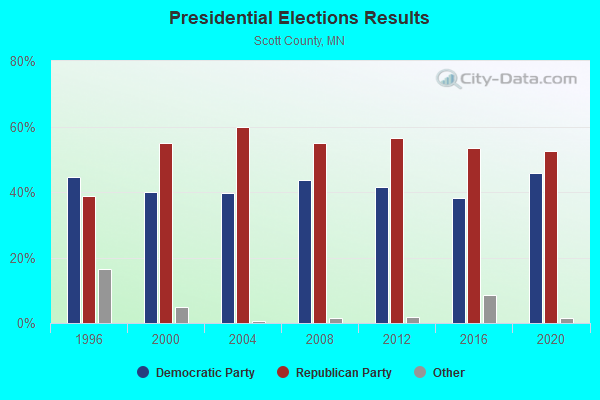
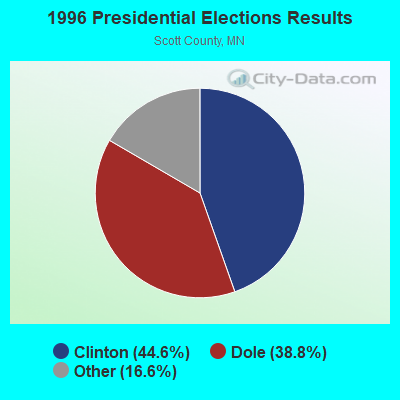
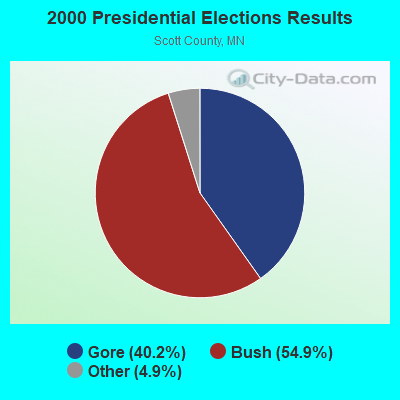
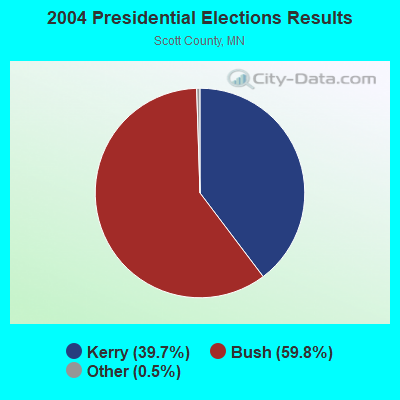
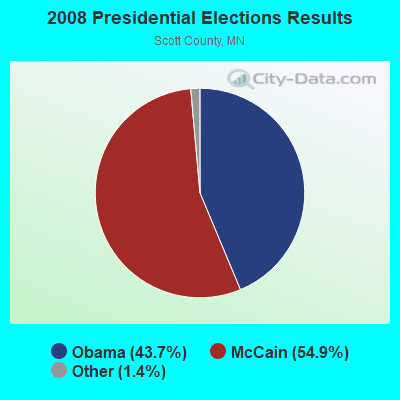
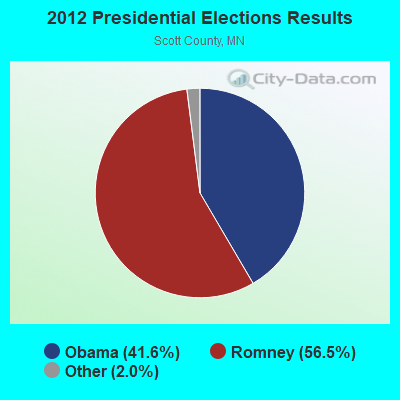
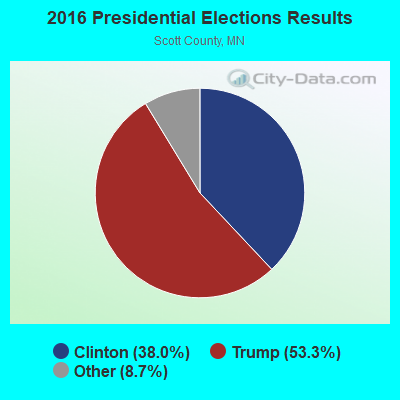
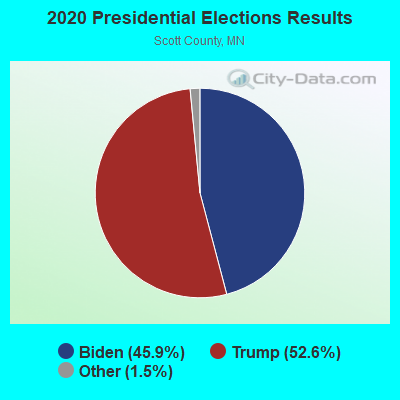
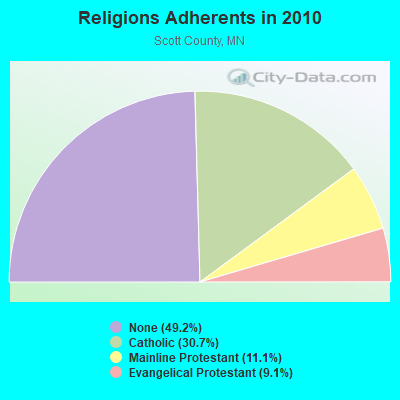
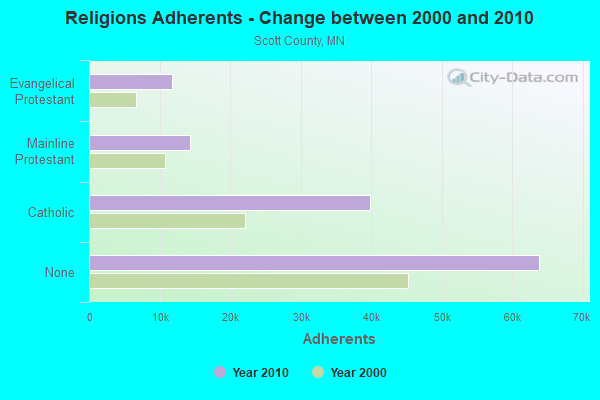
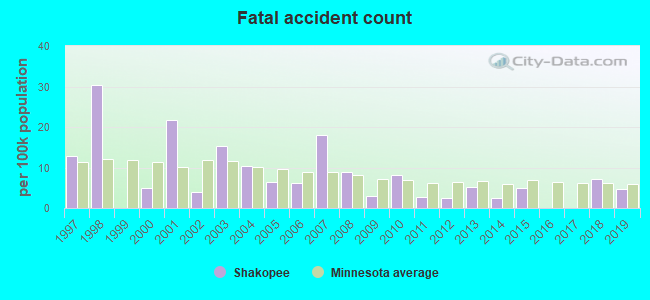
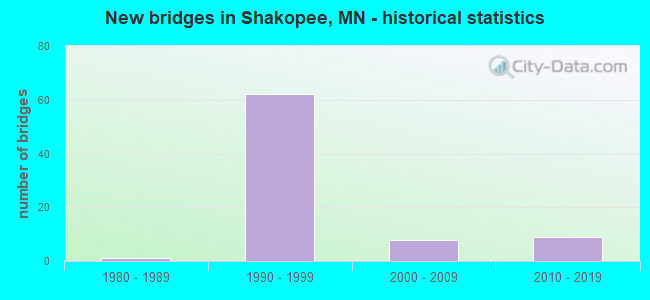
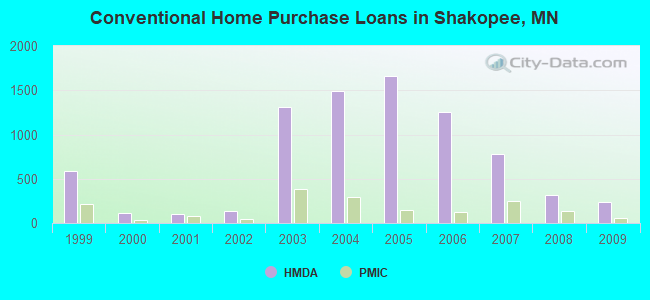

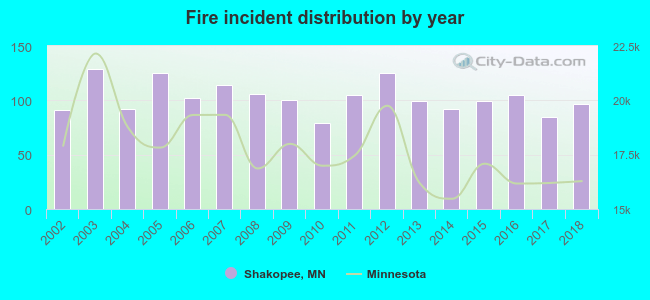 Based on the data from the years 2002 - 2018 the average number of fires per year is 103. The highest number of reported fire incidents - 129 took place in 2003, and the least - 79 in 2010. The data has a growing trend.
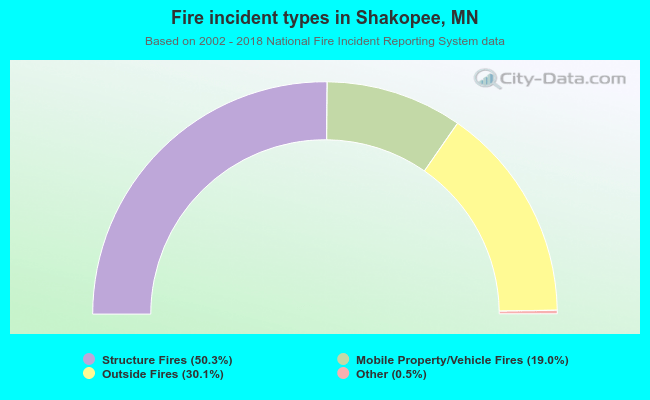 When looking into fire subcategories, the most reports belonged to: Structure Fires (50.3%), and Outside Fires (30.1%).