Sharonville, Ohio Submit your own pictures of this city and show them to the world
OSM Map
General Map
Google Map
MSN Map
OSM Map
General Map
Google Map
MSN Map
OSM Map
General Map
Google Map
MSN Map
OSM Map
General Map
Google Map
MSN Map
Please wait while loading the map...
Population in 2022: 13,899 (100% urban, 0% rural). Population change since 2000: +0.7%Males: 6,902 Females: 6,997
March 2022 cost of living index in Sharonville: 88.9 (less than average, U.S. average is 100) Percentage of residents living in poverty in 2022: 7.8%for White Non-Hispanic residents , 10.1% for Black residents , 9.9% for Hispanic or Latino residents , 15.1% for two or more races residents )Business Search - 14 Million verified businesses
Data:
Median household income ($)
Median household income (% change since 2000)
Household income diversity
Ratio of average income to average house value (%)
Ratio of average income to average rent
Median household income ($) - White
Median household income ($) - Black or African American
Median household income ($) - Asian
Median household income ($) - Hispanic or Latino
Median household income ($) - American Indian and Alaska Native
Median household income ($) - Multirace
Median household income ($) - Other Race
Median household income for houses/condos with a mortgage ($)
Median household income for apartments without a mortgage ($)
Races - White alone (%)
Races - White alone (% change since 2000)
Races - Black alone (%)
Races - Black alone (% change since 2000)
Races - American Indian alone (%)
Races - American Indian alone (% change since 2000)
Races - Asian alone (%)
Races - Asian alone (% change since 2000)
Races - Hispanic (%)
Races - Hispanic (% change since 2000)
Races - Native Hawaiian and Other Pacific Islander alone (%)
Races - Native Hawaiian and Other Pacific Islander alone (% change since 2000)
Races - Two or more races (%)
Races - Two or more races (% change since 2000)
Races - Other race alone (%)
Races - Other race alone (% change since 2000)
Racial diversity
Unemployment (%)
Unemployment (% change since 2000)
Unemployment (%) - White
Unemployment (%) - Black or African American
Unemployment (%) - Asian
Unemployment (%) - Hispanic or Latino
Unemployment (%) - American Indian and Alaska Native
Unemployment (%) - Multirace
Unemployment (%) - Other Race
Population density (people per square mile)
Population - Males (%)
Population - Females (%)
Population - Males (%) - White
Population - Males (%) - Black or African American
Population - Males (%) - Asian
Population - Males (%) - Hispanic or Latino
Population - Males (%) - American Indian and Alaska Native
Population - Males (%) - Multirace
Population - Males (%) - Other Race
Population - Females (%) - White
Population - Females (%) - Black or African American
Population - Females (%) - Asian
Population - Females (%) - Hispanic or Latino
Population - Females (%) - American Indian and Alaska Native
Population - Females (%) - Multirace
Population - Females (%) - Other Race
Coronavirus confirmed cases (Jun 16, 2024)
Deaths caused by coronavirus (Jun 16, 2024)
Coronavirus confirmed cases (per 100k population) (Jun 16, 2024)
Deaths caused by coronavirus (per 100k population) (Jun 16, 2024)
Daily increase in number of cases (Jun 16, 2024)
Weekly increase in number of cases (Jun 16, 2024)
Cases doubled (in days) (Jun 16, 2024)
Hospitalized patients (Apr 18, 2022)
Negative test results (Apr 18, 2022)
Total test results (Apr 18, 2022)
COVID Vaccine doses distributed (per 100k population) (Sep 19, 2023)
COVID Vaccine doses administered (per 100k population) (Sep 19, 2023)
COVID Vaccine doses distributed (Sep 19, 2023)
COVID Vaccine doses administered (Sep 19, 2023)
Likely homosexual households (%)
Likely homosexual households (% change since 2000)
Likely homosexual households - Lesbian couples (%)
Likely homosexual households - Lesbian couples (% change since 2000)
Likely homosexual households - Gay men (%)
Likely homosexual households - Gay men (% change since 2000)
Cost of living index
Median gross rent ($)
Median contract rent ($)
Median monthly housing costs ($)
Median house or condo value ($)
Median house or condo value ($ change since 2000)
Mean house or condo value by units in structure - 1, detached ($)
Mean house or condo value by units in structure - 1, attached ($)
Mean house or condo value by units in structure - 2 ($)
Mean house or condo value by units in structure by units in structure - 3 or 4 ($)
Mean house or condo value by units in structure - 5 or more ($)
Mean house or condo value by units in structure - Boat, RV, van, etc. ($)
Mean house or condo value by units in structure - Mobile home ($)
Median house or condo value ($) - White
Median house or condo value ($) - Black or African American
Median house or condo value ($) - Asian
Median house or condo value ($) - Hispanic or Latino
Median house or condo value ($) - American Indian and Alaska Native
Median house or condo value ($) - Multirace
Median house or condo value ($) - Other Race
Median resident age
Resident age diversity
Median resident age - Males
Median resident age - Females
Median resident age - White
Median resident age - Black or African American
Median resident age - Asian
Median resident age - Hispanic or Latino
Median resident age - American Indian and Alaska Native
Median resident age - Multirace
Median resident age - Other Race
Median resident age - Males - White
Median resident age - Males - Black or African American
Median resident age - Males - Asian
Median resident age - Males - Hispanic or Latino
Median resident age - Males - American Indian and Alaska Native
Median resident age - Males - Multirace
Median resident age - Males - Other Race
Median resident age - Females - White
Median resident age - Females - Black or African American
Median resident age - Females - Asian
Median resident age - Females - Hispanic or Latino
Median resident age - Females - American Indian and Alaska Native
Median resident age - Females - Multirace
Median resident age - Females - Other Race
Commute - mean travel time to work (minutes)
Travel time to work - Less than 5 minutes (%)
Travel time to work - Less than 5 minutes (% change since 2000)
Travel time to work - 5 to 9 minutes (%)
Travel time to work - 5 to 9 minutes (% change since 2000)
Travel time to work - 10 to 19 minutes (%)
Travel time to work - 10 to 19 minutes (% change since 2000)
Travel time to work - 20 to 29 minutes (%)
Travel time to work - 20 to 29 minutes (% change since 2000)
Travel time to work - 30 to 39 minutes (%)
Travel time to work - 30 to 39 minutes (% change since 2000)
Travel time to work - 40 to 59 minutes (%)
Travel time to work - 40 to 59 minutes (% change since 2000)
Travel time to work - 60 to 89 minutes (%)
Travel time to work - 60 to 89 minutes (% change since 2000)
Travel time to work - 90 or more minutes (%)
Travel time to work - 90 or more minutes (% change since 2000)
Marital status - Never married (%)
Marital status - Now married (%)
Marital status - Separated (%)
Marital status - Widowed (%)
Marital status - Divorced (%)
Median family income ($)
Median family income (% change since 2000)
Median non-family income ($)
Median non-family income (% change since 2000)
Median per capita income ($)
Median per capita income (% change since 2000)
Median family income ($) - White
Median family income ($) - Black or African American
Median family income ($) - Asian
Median family income ($) - Hispanic or Latino
Median family income ($) - American Indian and Alaska Native
Median family income ($) - Multirace
Median family income ($) - Other Race
Median year house/condo built
Median year apartment built
Year house built - Built 2005 or later (%)
Year house built - Built 2000 to 2004 (%)
Year house built - Built 1990 to 1999 (%)
Year house built - Built 1980 to 1989 (%)
Year house built - Built 1970 to 1979 (%)
Year house built - Built 1960 to 1969 (%)
Year house built - Built 1950 to 1959 (%)
Year house built - Built 1940 to 1949 (%)
Year house built - Built 1939 or earlier (%)
Average household size
Household density (households per square mile)
Average household size - White
Average household size - Black or African American
Average household size - Asian
Average household size - Hispanic or Latino
Average household size - American Indian and Alaska Native
Average household size - Multirace
Average household size - Other Race
Occupied housing units (%)
Vacant housing units (%)
Owner occupied housing units (%)
Renter occupied housing units (%)
Vacancy status - For rent (%)
Vacancy status - For sale only (%)
Vacancy status - Rented or sold, not occupied (%)
Vacancy status - For seasonal, recreational, or occasional use (%)
Vacancy status - For migrant workers (%)
Vacancy status - Other vacant (%)
Residents with income below the poverty level (%)
Residents with income below 50% of the poverty level (%)
Children below poverty level (%)
Poor families by family type - Married-couple family (%)
Poor families by family type - Male, no wife present (%)
Poor families by family type - Female, no husband present (%)
Poverty status for native-born residents (%)
Poverty status for foreign-born residents (%)
Poverty among high school graduates not in families (%)
Poverty among people who did not graduate high school not in families (%)
Residents with income below the poverty level (%) - White
Residents with income below the poverty level (%) - Black or African American
Residents with income below the poverty level (%) - Asian
Residents with income below the poverty level (%) - Hispanic or Latino
Residents with income below the poverty level (%) - American Indian and Alaska Native
Residents with income below the poverty level (%) - Multirace
Residents with income below the poverty level (%) - Other Race
Air pollution - Air Quality Index (AQI)
Air pollution - CO
Air pollution - NO2
Air pollution - SO2
Air pollution - Ozone
Air pollution - PM10
Air pollution - PM25
Air pollution - Pb
Crime - Murders per 100,000 population
Crime - Rapes per 100,000 population
Crime - Robberies per 100,000 population
Crime - Assaults per 100,000 population
Crime - Burglaries per 100,000 population
Crime - Thefts per 100,000 population
Crime - Auto thefts per 100,000 population
Crime - Arson per 100,000 population
Crime - City-data.com crime index
Crime - Violent crime index
Crime - Property crime index
Crime - Murders per 100,000 population (5 year average)
Crime - Rapes per 100,000 population (5 year average)
Crime - Robberies per 100,000 population (5 year average)
Crime - Assaults per 100,000 population (5 year average)
Crime - Burglaries per 100,000 population (5 year average)
Crime - Thefts per 100,000 population (5 year average)
Crime - Auto thefts per 100,000 population (5 year average)
Crime - Arson per 100,000 population (5 year average)
Crime - City-data.com crime index (5 year average)
Crime - Violent crime index (5 year average)
Crime - Property crime index (5 year average)
1996 Presidential Elections Results (%) - Democratic Party (Clinton)
1996 Presidential Elections Results (%) - Republican Party (Dole)
1996 Presidential Elections Results (%) - Other
2000 Presidential Elections Results (%) - Democratic Party (Gore)
2000 Presidential Elections Results (%) - Republican Party (Bush)
2000 Presidential Elections Results (%) - Other
2004 Presidential Elections Results (%) - Democratic Party (Kerry)
2004 Presidential Elections Results (%) - Republican Party (Bush)
2004 Presidential Elections Results (%) - Other
2008 Presidential Elections Results (%) - Democratic Party (Obama)
2008 Presidential Elections Results (%) - Republican Party (McCain)
2008 Presidential Elections Results (%) - Other
2012 Presidential Elections Results (%) - Democratic Party (Obama)
2012 Presidential Elections Results (%) - Republican Party (Romney)
2012 Presidential Elections Results (%) - Other
2016 Presidential Elections Results (%) - Democratic Party (Clinton)
2016 Presidential Elections Results (%) - Republican Party (Trump)
2016 Presidential Elections Results (%) - Other
2020 Presidential Elections Results (%) - Democratic Party (Biden)
2020 Presidential Elections Results (%) - Republican Party (Trump)
2020 Presidential Elections Results (%) - Other
Ancestries Reported - Arab (%)
Ancestries Reported - Czech (%)
Ancestries Reported - Danish (%)
Ancestries Reported - Dutch (%)
Ancestries Reported - English (%)
Ancestries Reported - French (%)
Ancestries Reported - French Canadian (%)
Ancestries Reported - German (%)
Ancestries Reported - Greek (%)
Ancestries Reported - Hungarian (%)
Ancestries Reported - Irish (%)
Ancestries Reported - Italian (%)
Ancestries Reported - Lithuanian (%)
Ancestries Reported - Norwegian (%)
Ancestries Reported - Polish (%)
Ancestries Reported - Portuguese (%)
Ancestries Reported - Russian (%)
Ancestries Reported - Scotch-Irish (%)
Ancestries Reported - Scottish (%)
Ancestries Reported - Slovak (%)
Ancestries Reported - Subsaharan African (%)
Ancestries Reported - Swedish (%)
Ancestries Reported - Swiss (%)
Ancestries Reported - Ukrainian (%)
Ancestries Reported - United States (%)
Ancestries Reported - Welsh (%)
Ancestries Reported - West Indian (%)
Ancestries Reported - Other (%)
Educational Attainment - No schooling completed (%)
Educational Attainment - Less than high school (%)
Educational Attainment - High school or equivalent (%)
Educational Attainment - Less than 1 year of college (%)
Educational Attainment - 1 or more years of college (%)
Educational Attainment - Associate degree (%)
Educational Attainment - Bachelor's degree (%)
Educational Attainment - Master's degree (%)
Educational Attainment - Professional school degree (%)
Educational Attainment - Doctorate degree (%)
School Enrollment - Nursery, preschool (%)
School Enrollment - Kindergarten (%)
School Enrollment - Grade 1 to 4 (%)
School Enrollment - Grade 5 to 8 (%)
School Enrollment - Grade 9 to 12 (%)
School Enrollment - College undergrad (%)
School Enrollment - Graduate or professional (%)
School Enrollment - Not enrolled in school (%)
School enrollment - Public schools (%)
School enrollment - Private schools (%)
School enrollment - Not enrolled (%)
Median number of rooms in houses and condos
Median number of rooms in apartments
Housing units lacking complete plumbing facilities (%)
Housing units lacking complete kitchen facilities (%)
Density of houses
Urban houses (%)
Rural houses (%)
Households with people 60 years and over (%)
Households with people 65 years and over (%)
Households with people 75 years and over (%)
Households with one or more nonrelatives (%)
Households with no nonrelatives (%)
Population in households (%)
Family households (%)
Nonfamily households (%)
Population in families (%)
Family households with own children (%)
Median number of bedrooms in owner occupied houses
Mean number of bedrooms in owner occupied houses
Median number of bedrooms in renter occupied houses
Mean number of bedrooms in renter occupied houses
Median number of vehichles in owner occupied houses
Mean number of vehichles in owner occupied houses
Median number of vehichles in renter occupied houses
Mean number of vehichles in renter occupied houses
Mortgage status - with mortgage (%)
Mortgage status - with second mortgage (%)
Mortgage status - with home equity loan (%)
Mortgage status - with both second mortgage and home equity loan (%)
Mortgage status - without a mortgage (%)
Average family size
Average family size - White
Average family size - Black or African American
Average family size - Asian
Average family size - Hispanic or Latino
Average family size - American Indian and Alaska Native
Average family size - Multirace
Average family size - Other Race
Geographical mobility - Same house 1 year ago (%)
Geographical mobility - Moved within same county (%)
Geographical mobility - Moved from different county within same state (%)
Geographical mobility - Moved from different state (%)
Geographical mobility - Moved from abroad (%)
Place of birth - Born in state of residence (%)
Place of birth - Born in other state (%)
Place of birth - Native, outside of US (%)
Place of birth - Foreign born (%)
Housing units in structures - 1, detached (%)
Housing units in structures - 1, attached (%)
Housing units in structures - 2 (%)
Housing units in structures - 3 or 4 (%)
Housing units in structures - 5 to 9 (%)
Housing units in structures - 10 to 19 (%)
Housing units in structures - 20 to 49 (%)
Housing units in structures - 50 or more (%)
Housing units in structures - Mobile home (%)
Housing units in structures - Boat, RV, van, etc. (%)
House/condo owner moved in on average (years ago)
Renter moved in on average (years ago)
Year householder moved into unit - Moved in 1999 to March 2000 (%)
Year householder moved into unit - Moved in 1995 to 1998 (%)
Year householder moved into unit - Moved in 1990 to 1994 (%)
Year householder moved into unit - Moved in 1980 to 1989 (%)
Year householder moved into unit - Moved in 1970 to 1979 (%)
Year householder moved into unit - Moved in 1969 or earlier (%)
Means of transportation to work - Drove car alone (%)
Means of transportation to work - Carpooled (%)
Means of transportation to work - Public transportation (%)
Means of transportation to work - Bus or trolley bus (%)
Means of transportation to work - Streetcar or trolley car (%)
Means of transportation to work - Subway or elevated (%)
Means of transportation to work - Railroad (%)
Means of transportation to work - Ferryboat (%)
Means of transportation to work - Taxicab (%)
Means of transportation to work - Motorcycle (%)
Means of transportation to work - Bicycle (%)
Means of transportation to work - Walked (%)
Means of transportation to work - Other means (%)
Working at home (%)
Industry diversity
Most Common Industries - Agriculture, forestry, fishing and hunting, and mining (%)
Most Common Industries - Agriculture, forestry, fishing and hunting (%)
Most Common Industries - Mining, quarrying, and oil and gas extraction (%)
Most Common Industries - Construction (%)
Most Common Industries - Manufacturing (%)
Most Common Industries - Wholesale trade (%)
Most Common Industries - Retail trade (%)
Most Common Industries - Transportation and warehousing, and utilities (%)
Most Common Industries - Transportation and warehousing (%)
Most Common Industries - Utilities (%)
Most Common Industries - Information (%)
Most Common Industries - Finance and insurance, and real estate and rental and leasing (%)
Most Common Industries - Finance and insurance (%)
Most Common Industries - Real estate and rental and leasing (%)
Most Common Industries - Professional, scientific, and management, and administrative and waste management services (%)
Most Common Industries - Professional, scientific, and technical services (%)
Most Common Industries - Management of companies and enterprises (%)
Most Common Industries - Administrative and support and waste management services (%)
Most Common Industries - Educational services, and health care and social assistance (%)
Most Common Industries - Educational services (%)
Most Common Industries - Health care and social assistance (%)
Most Common Industries - Arts, entertainment, and recreation, and accommodation and food services (%)
Most Common Industries - Arts, entertainment, and recreation (%)
Most Common Industries - Accommodation and food services (%)
Most Common Industries - Other services, except public administration (%)
Most Common Industries - Public administration (%)
Occupation diversity
Most Common Occupations - Management, business, science, and arts occupations (%)
Most Common Occupations - Management, business, and financial occupations (%)
Most Common Occupations - Management occupations (%)
Most Common Occupations - Business and financial operations occupations (%)
Most Common Occupations - Computer, engineering, and science occupations (%)
Most Common Occupations - Computer and mathematical occupations (%)
Most Common Occupations - Architecture and engineering occupations (%)
Most Common Occupations - Life, physical, and social science occupations (%)
Most Common Occupations - Education, legal, community service, arts, and media occupations (%)
Most Common Occupations - Community and social service occupations (%)
Most Common Occupations - Legal occupations (%)
Most Common Occupations - Education, training, and library occupations (%)
Most Common Occupations - Arts, design, entertainment, sports, and media occupations (%)
Most Common Occupations - Healthcare practitioners and technical occupations (%)
Most Common Occupations - Health diagnosing and treating practitioners and other technical occupations (%)
Most Common Occupations - Health technologists and technicians (%)
Most Common Occupations - Service occupations (%)
Most Common Occupations - Healthcare support occupations (%)
Most Common Occupations - Protective service occupations (%)
Most Common Occupations - Fire fighting and prevention, and other protective service workers including supervisors (%)
Most Common Occupations - Law enforcement workers including supervisors (%)
Most Common Occupations - Food preparation and serving related occupations (%)
Most Common Occupations - Building and grounds cleaning and maintenance occupations (%)
Most Common Occupations - Personal care and service occupations (%)
Most Common Occupations - Sales and office occupations (%)
Most Common Occupations - Sales and related occupations (%)
Most Common Occupations - Office and administrative support occupations (%)
Most Common Occupations - Natural resources, construction, and maintenance occupations (%)
Most Common Occupations - Farming, fishing, and forestry occupations (%)
Most Common Occupations - Construction and extraction occupations (%)
Most Common Occupations - Installation, maintenance, and repair occupations (%)
Most Common Occupations - Production, transportation, and material moving occupations (%)
Most Common Occupations - Production occupations (%)
Most Common Occupations - Transportation occupations (%)
Most Common Occupations - Material moving occupations (%)
People in Group quarters - Institutionalized population (%)
People in Group quarters - Correctional institutions (%)
People in Group quarters - Federal prisons and detention centers (%)
People in Group quarters - Halfway houses (%)
People in Group quarters - Local jails and other confinement facilities (including police lockups) (%)
People in Group quarters - Military disciplinary barracks (%)
People in Group quarters - State prisons (%)
People in Group quarters - Other types of correctional institutions (%)
People in Group quarters - Nursing homes (%)
People in Group quarters - Hospitals/wards, hospices, and schools for the handicapped (%)
People in Group quarters - Hospitals/wards and hospices for chronically ill (%)
People in Group quarters - Hospices or homes for chronically ill (%)
People in Group quarters - Military hospitals or wards for chronically ill (%)
People in Group quarters - Other hospitals or wards for chronically ill (%)
People in Group quarters - Hospitals or wards for drug/alcohol abuse (%)
People in Group quarters - Mental (Psychiatric) hospitals or wards (%)
People in Group quarters - Schools, hospitals, or wards for the mentally retarded (%)
People in Group quarters - Schools, hospitals, or wards for the physically handicapped (%)
People in Group quarters - Institutions for the deaf (%)
People in Group quarters - Institutions for the blind (%)
People in Group quarters - Orthopedic wards and institutions for the physically handicapped (%)
People in Group quarters - Wards in general hospitals for patients who have no usual home elsewhere (%)
People in Group quarters - Wards in military hospitals for patients who have no usual home elsewhere (%)
People in Group quarters - Juvenile institutions (%)
People in Group quarters - Long-term care (%)
People in Group quarters - Homes for abused, dependent, and neglected children (%)
People in Group quarters - Residential treatment centers for emotionally disturbed children (%)
People in Group quarters - Training schools for juvenile delinquents (%)
People in Group quarters - Short-term care, detention or diagnostic centers for delinquent children (%)
People in Group quarters - Type of juvenile institution unknown (%)
People in Group quarters - Noninstitutionalized population (%)
People in Group quarters - College dormitories (includes college quarters off campus) (%)
People in Group quarters - Military quarters (%)
People in Group quarters - On base (%)
People in Group quarters - Barracks, unaccompanied personnel housing (UPH), (Enlisted/Officer), ;and similar group living quarters for military personnel (%)
People in Group quarters - Transient quarters for temporary residents (%)
People in Group quarters - Military ships (%)
People in Group quarters - Group homes (%)
People in Group quarters - Homes or halfway houses for drug/alcohol abuse (%)
People in Group quarters - Homes for the mentally ill (%)
People in Group quarters - Homes for the mentally retarded (%)
People in Group quarters - Homes for the physically handicapped (%)
People in Group quarters - Other group homes (%)
People in Group quarters - Religious group quarters (%)
People in Group quarters - Dormitories (%)
People in Group quarters - Agriculture workers' dormitories on farms (%)
People in Group quarters - Job Corps and vocational training facilities (%)
People in Group quarters - Other workers' dormitories (%)
People in Group quarters - Crews of maritime vessels (%)
People in Group quarters - Other nonhousehold living situations (%)
People in Group quarters - Other noninstitutional group quarters (%)
Residents speaking English at home (%)
Residents speaking English at home - Born in the United States (%)
Residents speaking English at home - Native, born elsewhere (%)
Residents speaking English at home - Foreign born (%)
Residents speaking Spanish at home (%)
Residents speaking Spanish at home - Born in the United States (%)
Residents speaking Spanish at home - Native, born elsewhere (%)
Residents speaking Spanish at home - Foreign born (%)
Residents speaking other language at home (%)
Residents speaking other language at home - Born in the United States (%)
Residents speaking other language at home - Native, born elsewhere (%)
Residents speaking other language at home - Foreign born (%)
Class of Workers - Employee of private company (%)
Class of Workers - Self-employed in own incorporated business (%)
Class of Workers - Private not-for-profit wage and salary workers (%)
Class of Workers - Local government workers (%)
Class of Workers - State government workers (%)
Class of Workers - Federal government workers (%)
Class of Workers - Self-employed workers in own not incorporated business and Unpaid family workers (%)
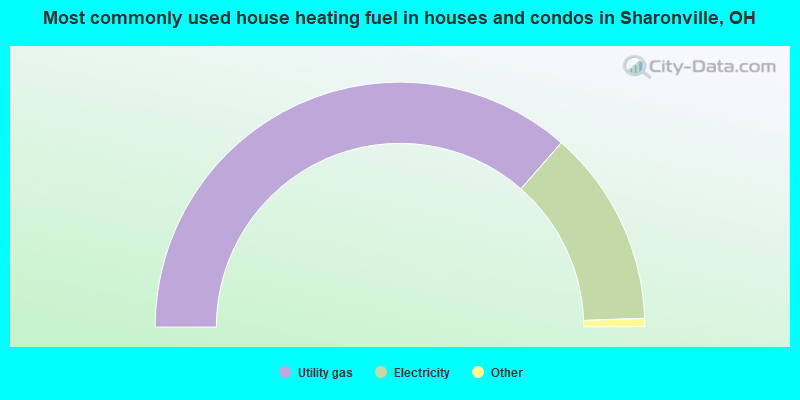
House heating fuel used in houses and condos - Utility gas (%)
House heating fuel used in houses and condos - Bottled, tank, or LP gas (%)
House heating fuel used in houses and condos - Electricity (%)
House heating fuel used in houses and condos - Fuel oil, kerosene, etc. (%)
House heating fuel used in houses and condos - Coal or coke (%)
House heating fuel used in houses and condos - Wood (%)
House heating fuel used in houses and condos - Solar energy (%)
House heating fuel used in houses and condos - Other fuel (%)
House heating fuel used in houses and condos - No fuel used (%)
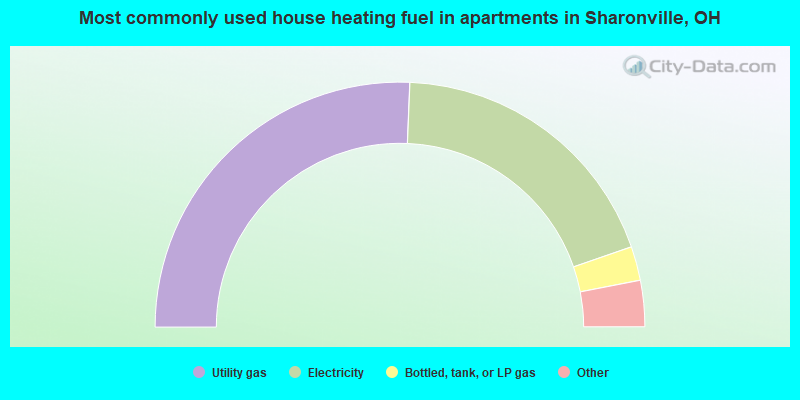
House heating fuel used in apartments - Utility gas (%)
House heating fuel used in apartments - Bottled, tank, or LP gas (%)
House heating fuel used in apartments - Electricity (%)
House heating fuel used in apartments - Fuel oil, kerosene, etc. (%)
House heating fuel used in apartments - Coal or coke (%)
House heating fuel used in apartments - Wood (%)
House heating fuel used in apartments - Solar energy (%)
House heating fuel used in apartments - Other fuel (%)
House heating fuel used in apartments - No fuel used (%)
Armed forces status - In Armed Forces (%)
Armed forces status - Civilian (%)
Armed forces status - Civilian - Veteran (%)
Armed forces status - Civilian - Nonveteran (%)
Fatal accidents locations in years 2005-2021
Fatal accidents locations in 2005
Fatal accidents locations in 2006
Fatal accidents locations in 2007
Fatal accidents locations in 2008
Fatal accidents locations in 2009
Fatal accidents locations in 2010
Fatal accidents locations in 2011
Fatal accidents locations in 2012
Fatal accidents locations in 2013
Fatal accidents locations in 2014
Fatal accidents locations in 2015
Fatal accidents locations in 2016
Fatal accidents locations in 2017
Fatal accidents locations in 2018
Fatal accidents locations in 2019
Fatal accidents locations in 2020
Fatal accidents locations in 2021
Alcohol use - People drinking some alcohol every month (%)
Alcohol use - People not drinking at all (%)
Alcohol use - Average days/month drinking alcohol
Alcohol use - Average drinks/week
Alcohol use - Average days/year people drink much
Audiometry - Average condition of hearing (%)
Audiometry - People that can hear a whisper from across a quiet room (%)
Audiometry - People that can hear normal voice from across a quiet room (%)
Audiometry - Ears ringing, roaring, buzzing (%)
Audiometry - Had a job exposure to loud noise (%)
Audiometry - Had off-work exposure to loud noise (%)
Blood Pressure & Cholesterol - Has high blood pressure (%)
Blood Pressure & Cholesterol - Checking blood pressure at home (%)
Blood Pressure & Cholesterol - Frequently checking blood cholesterol (%)
Blood Pressure & Cholesterol - Has high cholesterol level (%)
Consumer Behavior - Money monthly spent on food at supermarket/grocery store
Consumer Behavior - Money monthly spent on food at other stores
Consumer Behavior - Money monthly spent on eating out
Consumer Behavior - Money monthly spent on carryout/delivered foods
Consumer Behavior - Income spent on food at supermarket/grocery store (%)
Consumer Behavior - Income spent on food at other stores (%)
Consumer Behavior - Income spent on eating out (%)
Consumer Behavior - Income spent on carryout/delivered foods (%)
Current Health Status - General health condition (%)
Current Health Status - Blood donors (%)
Current Health Status - Has blood ever tested for HIV virus (%)
Current Health Status - Left-handed people (%)
Dermatology - People using sunscreen (%)
Diabetes - Diabetics (%)
Diabetes - Had a blood test for high blood sugar (%)
Diabetes - People taking insulin (%)
Diet Behavior & Nutrition - Diet health (%)
Diet Behavior & Nutrition - Milk product consumption (# of products/month)
Diet Behavior & Nutrition - Meals not home prepared (#/week)
Diet Behavior & Nutrition - Meals from fast food or pizza place (#/week)
Diet Behavior & Nutrition - Ready-to-eat foods (#/month)
Diet Behavior & Nutrition - Frozen meals/pizza (#/month)
Drug Use - People that ever used marijuana or hashish (%)
Drug Use - Ever used hard drugs (%)
Drug Use - Ever used any form of cocaine (%)
Drug Use - Ever used heroin (%)
Drug Use - Ever used methamphetamine (%)
Health Insurance - People covered by health insurance (%)
Kidney Conditions-Urology - Avg. # of times urinating at night
Medical Conditions - People with asthma (%)
Medical Conditions - People with anemia (%)
Medical Conditions - People with psoriasis (%)
Medical Conditions - People with overweight (%)
Medical Conditions - Elderly people having difficulties in thinking or remembering (%)
Medical Conditions - People who ever received blood transfusion (%)
Medical Conditions - People having trouble seeing even with glass/contacts (%)
Medical Conditions - People with arthritis (%)
Medical Conditions - People with gout (%)
Medical Conditions - People with congestive heart failure (%)
Medical Conditions - People with coronary heart disease (%)
Medical Conditions - People with angina pectoris (%)
Medical Conditions - People who ever had heart attack (%)
Medical Conditions - People who ever had stroke (%)
Medical Conditions - People with emphysema (%)
Medical Conditions - People with thyroid problem (%)
Medical Conditions - People with chronic bronchitis (%)
Medical Conditions - People with any liver condition (%)
Medical Conditions - People who ever had cancer or malignancy (%)
Mental Health - People who have little interest in doing things (%)
Mental Health - People feeling down, depressed, or hopeless (%)
Mental Health - People who have trouble sleeping or sleeping too much (%)
Mental Health - People feeling tired or having little energy (%)
Mental Health - People with poor appetite or overeating (%)
Mental Health - People feeling bad about themself (%)
Mental Health - People who have trouble concentrating on things (%)
Mental Health - People moving or speaking slowly or too fast (%)
Mental Health - People having thoughts they would be better off dead (%)
Oral Health - Average years since last visit a dentist
Oral Health - People embarrassed because of mouth (%)
Oral Health - People with gum disease (%)
Oral Health - General health of teeth and gums (%)
Oral Health - Average days a week using dental floss/device
Oral Health - Average days a week using mouthwash for dental problem
Oral Health - Average number of teeth
Pesticide Use - Households using pesticides to control insects (%)
Pesticide Use - Households using pesticides to kill weeds (%)
Physical Activity - People doing vigorous-intensity work activities (%)
Physical Activity - People doing moderate-intensity work activities (%)
Physical Activity - People walking or bicycling (%)
Physical Activity - People doing vigorous-intensity recreational activities (%)
Physical Activity - People doing moderate-intensity recreational activities (%)
Physical Activity - Average hours a day doing sedentary activities
Physical Activity - Average hours a day watching TV or videos
Physical Activity - Average hours a day using computer
Physical Functioning - People having limitations keeping them from working (%)
Physical Functioning - People limited in amount of work they can do (%)
Physical Functioning - People that need special equipment to walk (%)
Physical Functioning - People experiencing confusion/memory problems (%)
Physical Functioning - People requiring special healthcare equipment (%)
Prescription Medications - Average number of prescription medicines taking
Preventive Aspirin Use - Adults 40+ taking low-dose aspirin (%)
Reproductive Health - Vaginal deliveries (%)
Reproductive Health - Cesarean deliveries (%)
Reproductive Health - Deliveries resulted in a live birth (%)
Reproductive Health - Pregnancies resulted in a delivery (%)
Reproductive Health - Women breastfeeding newborns (%)
Reproductive Health - Women that had a hysterectomy (%)
Reproductive Health - Women that had both ovaries removed (%)
Reproductive Health - Women that have ever taken birth control pills (%)
Reproductive Health - Women taking birth control pills (%)
Reproductive Health - Women that have ever used Depo-Provera or injectables (%)
Reproductive Health - Women that have ever used female hormones (%)
Sexual Behavior - People 18+ that ever had sex (vaginal, anal, or oral) (%)
Sexual Behavior - Males 18+ that ever had vaginal sex with a woman (%)
Sexual Behavior - Males 18+ that ever performed oral sex on a woman (%)
Sexual Behavior - Males 18+ that ever had anal sex with a woman (%)
Sexual Behavior - Males 18+ that ever had any sex with a man (%)
Sexual Behavior - Females 18+ that ever had vaginal sex with a man (%)
Sexual Behavior - Females 18+ that ever performed oral sex on a man (%)
Sexual Behavior - Females 18+ that ever had anal sex with a man (%)
Sexual Behavior - Females 18+ that ever had any kind of sex with a woman (%)
Sexual Behavior - Average age people first had sex
Sexual Behavior - Average number of female sex partners in lifetime (males 18+)
Sexual Behavior - Average number of female vaginal sex partners in lifetime (males 18+)
Sexual Behavior - Average age people first performed oral sex on a woman (18+)
Sexual Behavior - Average number of woman performed oral sex on in lifetime (18+)
Sexual Behavior - Average number of male sex partners in lifetime (males 18+)
Sexual Behavior - Average number of male anal sex partners in lifetime (males 18+)
Sexual Behavior - Average age people first performed oral sex on a man (18+)
Sexual Behavior - Average number of male oral sex partners in lifetime (18+)
Sexual Behavior - People using protection when performing oral sex (%)
Sexual Behavior - Average number of times people have vaginal or anal sex a year
Sexual Behavior - People having sex without condom (%)
Sexual Behavior - Average number of male sex partners in lifetime (females 18+)
Sexual Behavior - Average number of male vaginal sex partners in lifetime (females 18+)
Sexual Behavior - Average number of female sex partners in lifetime (females 18+)
Sexual Behavior - Circumcised males 18+ (%)
Sleep Disorders - Average hours sleeping at night
Sleep Disorders - People that has trouble sleeping (%)
Smoking-Cigarette Use - People smoking cigarettes (%)
Taste & Smell - People 40+ having problems with smell (%)
Taste & Smell - People 40+ having problems with taste (%)
Taste & Smell - People 40+ that ever had wisdom teeth removed (%)
Taste & Smell - People 40+ that ever had tonsils teeth removed (%)
Taste & Smell - People 40+ that ever had a loss of consciousness because of a head injury (%)
Taste & Smell - People 40+ that ever had a broken nose or other serious injury to face or skull (%)
Taste & Smell - People 40+ that ever had two or more sinus infections (%)
Weight - Average height (inches)
Weight - Average weight (pounds)
Weight - Average BMI
Weight - People that are obese (%)
Weight - People that ever were obese (%)
Weight - People trying to lose weight (%)
According to our research of Ohio and other state lists, there was 1 registered sex offender living in Sharonville, Ohio as of June 16, 2024 . The ratio of all residents to sex offenders in Sharonville is 13,835 to 1.The ratio of registered sex offenders to all residents in this city is much lower than the state average.
Officers per 1,000 residents here:
2.70Ohio average:
2.31
Latest news from Sharonville, OH collected exclusively by city-data.com from local newspapers, TV, and radio stations
Ancestries: German (26.8%), American (8.4%), English (6.9%), Irish (4.6%), European (3.9%), Italian (2.6%).
Current Local Time:
Land area: 9.81 square miles.
Population density: 1,417 people per square mile (low).
1,508 residents are foreign born (4.8% Asia , 3.9% Latin America , 1.3% Africa ).
Median real estate property taxes paid for housing units with mortgages in 2022: $2,849 (1.3%)Median real estate property taxes paid for housing units with no mortgage in 2022: $2,942 (1.3%)
Nearest city with pop. 50,000+: Cincinnati, OH
Nearest city with pop. 1,000,000+: Chicago, IL
Nearest cities:
Latitude: 39.28 N, Longitude: 84.40 W
Daytime population change due to commuting: +15,650 (+112.0%)Workers who live and work in this city: 1,722 (23.1%)
Property values in Sharonville, OH
Single-family new house construction building permits:
2022: 2 buildings , average cost: $250,0002021: 1 building , cost: $900,0002020: 1 building , cost: $400,0002019: 3 buildings , average cost: $188,3002018: 2 buildings , average cost: $144,4002017: 3 buildings , average cost: $191,5002016: 3 buildings , average cost: $198,7002015: 2 buildings , average cost: $294,2002014: 1 building , cost: $300,0002008: 3 buildings , average cost: $582,0002006: 5 buildings , average cost: $431,0002005: 9 buildings , average cost: $353,0002003: 7 buildings , average cost: $280,7002002: 18 buildings , average cost: $293,6002001: 31 buildings , average cost: $126,2002000: 11 buildings , average cost: $150,5001999: 3 buildings , average cost: $113,2001998: 5 buildings , average cost: $105,3001997: 1 building , cost: $150,000Unemployment in December 2023:
Population change in the 1990s: +588 (+4.4%).
Most common occupations in Sharonville, OH (%)
Both Males Females
Other management occupations, except farmers and farm managers (5.3%)
Computer specialists (5.2%)
Material recording, scheduling, dispatching, and distributing workers (3.7%)
Other office and administrative support workers, including supervisors (3.7%)
Preschool, kindergarten, elementary, and middle school teachers (3.5%)
Sales representatives, services, wholesale and manufacturing (3.3%)
Other sales and related occupations, including supervisors (3.3%)
Computer specialists (7.6%)
Other management occupations, except farmers and farm managers (5.1%)
Material recording, scheduling, dispatching, and distributing workers (4.6%)
Engineers (4.4%)
Other production occupations, including supervisors (4.3%)
Sales representatives, services, wholesale and manufacturing (4.1%)
Other sales and related occupations, including supervisors (3.8%)
Preschool, kindergarten, elementary, and middle school teachers (7.1%)
Other office and administrative support workers, including supervisors (6.6%)
Secretaries and administrative assistants (6.5%)
Other management occupations, except farmers and farm managers (5.5%)
Retail sales workers, except cashiers (3.9%)
Information and record clerks, except customer service representatives (3.8%)
Registered nurses (3.5%)
Tornado activity:
Sharonville-area historical tornado activity is slightly above Ohio state average. It is 64% greater than the overall U.S. average.
On 4/3/1974, a category F5 (max. wind speeds 261-318 mph) tornado 13.2 miles away from the Sharonville city center killed 3 people and injured 210 people .
On 4/9/1999, a category F4 (max. wind speeds 207-260 mph) tornado 3.8 miles away from the city center killed 4 people and injured 65 people and caused $85 million in damages.
Earthquake activity:
Sharonville-area historical earthquake activity is significantly above Ohio state average. It is 42% greater than the overall U.S. average. On 7/27/1980 at 18:52:21, a magnitude 5.2 (5.1 MB, 4.7 MS, 5.0 UK, 5.2 UK, Class: Moderate, Intensity: VI - VII) earthquake occurred 78.4 miles away from Sharonville center On 4/18/2008 at 09:36:59, a magnitude 5.4 (5.1 MB, 4.8 MS, 5.4 MW, 5.2 MW) earthquake occurred 196.4 miles away from Sharonville center On 4/18/2008 at 09:36:59, a magnitude 5.2 (5.2 MW, Depth: 8.9 mi) earthquake occurred 196.4 miles away from Sharonville center On 9/7/1988 at 02:28:09, a magnitude 4.6 (4.5 MB, 4.6 LG, Class: Light, Intensity: IV - V) earthquake occurred 83.6 miles away from the city center On 6/10/1987 at 23:48:54, a magnitude 5.1 (4.9 MB, 4.4 MS, 4.6 MS, 5.1 LG) earthquake occurred 190.0 miles away from Sharonville center On 7/12/1986 at 08:19:37, a magnitude 4.5 (4.5 MB) earthquake occurred 86.9 miles away from the city center Magnitude types: regional Lg-wave magnitude (LG), body-wave magnitude (MB), surface-wave magnitude (MS), moment magnitude (MW) Natural disasters: The number of natural disasters in Hamilton County (15) is near the US average (15).Major Disasters (Presidential) Declared: 10Emergencies Declared: 3Floods: 7, Storms: 7, Mudslides: 2, Tornadoes: 2, Blizzard: 1, Heavy Rain: 1, Hurricane: 1, Landslide: 1, Snow: 1, Snowstorm: 1, Tropical Depression: 1, Wind: 1, Other: 1 (Note: some incidents may be assigned to more than one category). Hospitals and medical centers near Sharonville: COTTINGHAM RETIREMENT COMMUNITY (Nursing Home, about 2 miles away; CINCINNATI, OH)
BLESSING HOME HEALTH CARE, LLC (Home Health Center, about 2 miles away; CINCINNATI, OH)
STAY WELL HOME HEALTH, LLC (Home Health Center, about 2 miles away; CINCINNATI, OH)
BROOKWOOD RETIREMENT COMMUNITY (Nursing Home, about 2 miles away; CINCINNATI, OH)
ST JOSEPH HOME OF CINCINNATI (Hospital, about 2 miles away; CINCINNATI, OH)
MERCY HOSPICE (Hospital, about 2 miles away; CINCINNATI, OH)
HEARTSPRING HOME HEALTH CARE, LLC (Home Health Center, about 3 miles away; BLUE ASH, OH)
Heliports located in Sharonville: Amtrak stations near Sharonville: 12 miles: HAMILTON (M. L. KING BLVD AT HENRY ST.) Services: public payphones, free short-term parking, call for taxi service, public transit connection.
15 miles: CINCINNATI (1301 WESTERN AVE.) Services: ticket office, fully wheelchair accessible, enclosed waiting area, public restrooms, public payphones, full-service food facilities, free short-term parking, paid long-term parking, taxi stand.
College/University in Sharonville: Miami-Jacobs Career College-Sharonville Full-time enrollment: 160; Location: Two Crowne Point Court, Suite 100; Private, for-profit; Website: www.miamijacobs.edu)
Colleges/universities with over 2000 students nearest to Sharonville:
University of Cincinnati-Blue Ash College (about 4 miles; Blue Ash, OH ; Full-time enrollment: 3,711)
Xavier University (about 11 miles; Cincinnati, OH ; FT enrollment: 6,143)
Miami University-Hamilton (about 12 miles; Hamilton, OH ; FT enrollment: 2,906)
Cincinnati State Technical and Community College (about 12 miles; Cincinnati, OH ; FT enrollment: 8,757)
University of Cincinnati-Main Campus (about 13 miles; Cincinnati, OH ; FT enrollment: 28,747)
University of Cincinnati-Clermont College (about 18 miles; Batavia, OH ; FT enrollment: 2,739)
Northern Kentucky University (about 18 miles; Highland Heights, KY ; FT enrollment: 12,059)
Private school in Sharonville: PARK MONTESSORI Students: 43, Location: 3317 CREEK RD, Grades: PK-KG)
Notable locations in Sharonville: (A) , Champion Business Park (B) , Enterprise Business Park (C) , Lazarus Distribution Center (D) , Park 42 Business Park (E) , Perimeter Park North (F) , Triangle Office Park (G) , Atkinson Square Office Park (H) , Prince Road Industrial Park (I) , Sharonville Commerce Center (J) , Sharon Industrial Park (K) , Executive Park (L) , Sharon Woods Golf Course (M) , Sharonville Municipal Building (N) , Sharonville Branch Public Library (O) , Sharonville Fire Department Station 86 (P) , Sharonville Fire Department Station 87 (Q) , Sharonville Fire Department Station 88 (R) . Display/hide their locations on the map
Shopping Centers: (1) , Home Center Mall Shopping Center (2) . Display/hide their locations on the map
Churches in Sharonville include: (A) , Sharonville Presbyterian Church (B) , Sharonville Church of Christ (C) , Saint Gertrude the Great Roman Catholic Church (D) , Free Holiness Church of God (E) , Saint Michael Catholic Church (F) , Sharonville United Methodist Church (G) . Display/hide their locations on the map
Cemeteries: (1) , Coleman Cemetery (2) , Cummins Cemetery (3) , Runyan Cemetery (4) . Display/hide their locations on the map
Reservoirs: (A) , Sharon Lake (B) . Display/hide their locations on the map
Creek: (A) . Display/hide its location on the map
Hotels:
Birthplace of: Carmen Electra - Model.
Hamilton County has a predicted average indoor radon screening level greater than 4 pCi/L (pico curies per liter) - Highest Potential Drinking water stations with addresses in Sharonville and their reported violations in the past:
THE ROOT BEER STAND (Population served: 225, Groundwater):
Past monitoring violations:
3 routine major monitoring violations
One minor monitoring violation
3 regular monitoring violations
Average household size: This city:
2.2 peopleOhio:
2.4 people
Percentage of family households: This city:
55.4%Whole state:
65.0%
Percentage of households with unmarried partners: This city:
6.6%Whole state:
6.8%
Likely homosexual households (counted as self-reported same-sex unmarried-partner households)
Lesbian couples: 0.4% of all households Gay men: 0.2% of all households
103 people in nursing facilities/skilled-nursing facilities in 2010people in other noninstitutional facilities in 2010People in group quarters in Sharonville in 2000:
251 people in nursing homes
47 people in schools, hospitals, or wards for the intellectually disabled
17 people in religious group quarters
Banks with branches in Sharonville (2011 data):
The Huntington National Bank: Sharonville Branch at 12122 Lebanon Road, branch established on 1990/10/13. Info updated 2012/04/02: Bank assets: $54,183.4 mil, Deposits: $44,300.3 mil, headquarters in Columbus, OH, positive income , Commercial Lending Specialization, 878 total offices , Holding Company: Huntington Bancshares Incorporated
PNC Bank, National Association: Sharonville Branch at 12075 Lebanon Road, branch established on 1978/10/30. Info updated 2012/03/20: Bank assets: $263,309.6 mil, Deposits: $197,343.0 mil, headquarters in Wilmington, DE, positive income , Commercial Lending Specialization, 3085 total offices , Holding Company: Pnc Financial Services Group, Inc., The
For population 15 years and over in Sharonville:
Never married: 29.2%Now married: 49.3%Separated: 1.8%Widowed: 8.8%Divorced: 10.9% For population 25 years and over in Sharonville:
High school or higher: 91.7%Bachelor's degree or higher: 34.6%Graduate or professional degree: 16.0%Unemployed: 3.2%Mean travel time to work (commute): 17.9 minutes
Education Gini index (Inequality in education) Here:
11.9Ohio average:
11.0
Religion statistics for Sharonville, OH (based on Hamilton County data)
Religion Adherents Congregations Catholic 205,094 83 Evangelical Protestant 93,166 269 Mainline Protestant 76,354 188 Other 21,699 64 Black Protestant 20,814 55 Orthodox 3,879 7 None 381,368 -
Source: Clifford Grammich, Kirk Hadaway, Richard Houseal, Dale E.Jones, Alexei Krindatch, Richie Stanley and Richard H.Taylor. 2012. 2010 U.S.Religion Census: Religious Congregations & Membership Study. Association of Statisticians of American Religious Bodies. Jones, Dale E., et al. 2002. Congregations and Membership in the United States 2000. Nashville, TN: Glenmary Research Center. Graphs represent county-level data
Food Environment Statistics: Number of grocery stores : 155Hamilton County :
1.82 / 10,000 pop.State :
1.89 / 10,000 pop.
Number of supercenters and club stores : 10Hamilton County :
0.12 / 10,000 pop.Ohio :
0.13 / 10,000 pop.
Number of convenience stores (no gas) : 127Hamilton County :
1.49 / 10,000 pop.Ohio :
1.25 / 10,000 pop.
Number of convenience stores (with gas) : 227This county :
2.66 / 10,000 pop.Ohio :
2.93 / 10,000 pop.
Number of full-service restaurants : 639Here :
7.48 / 10,000 pop.Ohio :
6.25 / 10,000 pop.
Adult diabetes rate : This county :
9.8%State :
10.3%
Adult obesity rate : Hamilton County :
26.6%State :
29.1%
Low-income preschool obesity rate : Hamilton County :
11.7%State :
11.9%
Health and Nutrition: Healthy diet rate : This city:
49.7%Ohio:
50.4%
Average overall health of teeth and gums : Sharonville:
45.2%Ohio:
47.8%
Average BMI : Sharonville:
28.8Ohio:
28.7
People feeling badly about themselves : Sharonville:
19.8%State:
20.6%
People not drinking alcohol at all : Average hours sleeping at night : General health condition : This city:
55.3%Ohio:
57.0%
Average condition of hearing : This city:
77.3%Ohio:
79.1%
More about Health and Nutrition of Sharonville, OH Residents
Local government employment and payroll (March 2022)
Function
Full-time employees
Monthly full-time payroll
Average yearly full-time wage
Part-time employees
Monthly part-time payroll
Police Protection - Officers
38 $321,337 $101,475 0 $0 Firefighters
37 $315,978 $102,479 24 $46,390 Streets and Highways
20 $123,306 $73,984 2 $5,594 Parks and Recreation
18 $102,891 $68,594 15 $19,677 Police - Other
11 $68,533 $74,763 1 $2,110 Financial Administration
9 $50,725 $67,633 3 $10,285 Other Government Administration
7 $48,872 $83,781 15 $15,712 Housing and Community Development (Local)
3 $17,996 $71,984 1 $1,913 Fire - Other
3 $27,379 $109,516 0 $0 Judicial and Legal
2 $8,361 $50,166 0 $0
Totals for Government
148 $1,085,378 $88,004 61 $101,682
Sharonville government finances - Expenditure in 2018 (per resident):
Construction - Regular Highways: $951,000 ($68.42)
Current Operations - Local Fire Protection: $5,919,000 ($425.86)
Police Protection: $5,750,000 ($413.70)General - Other: $3,230,000 ($232.39)Parks and Recreation: $2,472,000 ($177.85)Miscellaneous Commercial Activities - Other: $1,930,000 ($138.86)Regular Highways: $1,732,000 ($124.61)Financial Administration: $945,000 ($67.99)Central Staff Services: $708,000 ($50.94)Protective Inspection and Regulation - Other: $522,000 ($37.56)General Public Buildings: $60,000 ($4.32)Judicial and Legal Services: $31,000 ($2.23)Natural Resources - Other: $24,000 ($1.73)General - Interest on Debt: $1,822,000 ($131.09)
Other Capital Outlay - Local Fire Protection: $1,213,000 ($87.27)
Parks and Recreation: $125,000 ($8.99)Regular Highways: $104,000 ($7.48)Police Protection: $80,000 ($5.76)Miscellaneous Commercial Activities - Other: $59,000 ($4.24)General Public Building: $38,000 ($2.73)Total Salaries and Wages: $11,801,000 ($849.05)
Sharonville government finances - Revenue in 2018 (per resident):
Charges - Miscellaneous Commercial Activities: $2,004,000 ($144.18)
Other: $332,000 ($23.89)Local Intergovernmental - General Local Government Support: $256,000 ($18.42)
Other: $49,000 ($3.53)Miscellaneous - General Revenue - Other: $972,000 ($69.93)
Fines and Forfeits: $507,000 ($36.48)Special Assessments: $476,000 ($34.25)Interest Earnings: $245,000 ($17.63)Sale of Property: $6,000 ($0.43)State Intergovernmental - Highways: $3,314,000 ($238.43)
Other: $73,000 ($5.25)Education: $5,000 ($0.36)Health and Hospitals: $3,000 ($0.22)Tax - Individual Income: $27,898,000 ($2007.19)
Other: $1,288,000 ($92.67)Motor Vehicle License: $900,000 ($64.75)Alcoholic Beverage License: $41,000 ($2.95)Other License: $10,000 ($0.72)
Sharonville government finances - Debt in 2018 (per resident):
Long Term Debt - Beginning Outstanding - Public Debt for Private Purpose: $27,740,000 ($1995.83)
Outstanding Nonguaranteed - Industrial Revenue: $27,727,000 ($1994.89)Beginning Outstanding - Unspecified Public Purpose: $2,678,000 ($192.68)Retired Unspecified Public Purpose: $1,437,000 ($103.39)Outstanding Unspecified Public Purpose: $1,241,000 ($89.29)Retired Nonguaranteed - Public Debt for Private Purpose: $13,000 ($0.94)
Sharonville government finances - Cash and Securities in 2018 (per resident):
Bond Funds - Cash and Securities: $292,000 ($21.01)
Other Funds - Cash and Securities: $21,444,000 ($1542.84)
Sinking Funds - Cash and Securities: $35,175,000 ($2530.76)
5.24% of this county's 2021 resident taxpayers lived in other counties in 2020 ($68,039 average adjusted gross income )
Here:
5.24%Ohio average:
5.68%
0.01% of residents moved from foreign countries ($43 average AGI )Hamilton County:
0.01%Ohio average:
0.01%
Top counties from which taxpayers relocated into this county between 2020 and 2021:
6.26% of this county's 2020 resident taxpayers moved to other counties in 2021 ($83,260 average adjusted gross income )
Here:
6.26%Ohio average:
5.79%
0.01% of residents moved to foreign countries ($86 average AGI )Hamilton County:
0.01%Ohio average:
0.01%
Top counties to which taxpayers relocated from this county between 2020 and 2021:
Businesses in Sharonville, OH
Name Count Name Count
Advance Auto Parts 1 Kroger 1 Arby's 1 McDonald's 2 CVS 1 Motel 6 1 Chipotle 1 Red Roof Inn 1 Chuck E. Cheese's 1 Ruby Tuesday 1 Cracker Barrel 1 Ryder Rental & Truck Leasing 1 Curves 1 Starbucks 1 Days Inn 1 Subway 3 Dunkin Donuts 1 Taco Bell 1 Econo Lodge 1 The Room Place 1 Extended Stay America 1 Waffle House 1 Hilton 2 Wendy's 1 Holiday Inn 1 White Castle 1
Strongest AM radio stations in Sharonville:
WLW (700 AM; 50 kW; CINCINNATI, OH; Owner: JACOR BROADCASTING CORPORATION)
WSAI (1530 AM; 50 kW; CINCINNATI, OH; Owner: JACOR BROADCASTING CORPORATION)
WCIN (1480 AM; 5 kW; CINCINNATI, OH)
WCKY (1360 AM; 5 kW; CINCINNATI, OH; Owner: JACOR BROADCASTING CORPORATION)
WCNW (1560 AM; daytime; 5 kW; FAIRFIELD, OH)
WKRC (550 AM; 5 kW; CINCINNATI, OH; Owner: JACOR BROADCASTING CORPORATION)
WTVN (610 AM; 50 kW; COLUMBUS, OH; Owner: CITICASTERS LICENSES, L.P.)
WHAS (840 AM; 50 kW; LOUISVILLE, KY; Owner: CLEAR CHANNEL BROADCASTING LICENSES, INC.)
WBOB (1160 AM; 5 kW; FLORENCE, KY; Owner: CARON BROADCASTING, INC.)
WONE (980 AM; 5 kW; DAYTON, OH; Owner: CITICASTERS LICENSES, L.P.)
WMOH (1450 AM; 1 kW; HAMILTON, OH; Owner: THE MIAMI RIVER BROADCASTING COMPANY)
WDBZ (1230 AM; 1 kW; CINCINNATI, OH; Owner: BLUE CHIP COMMUNICATIONS, INC.)
WNOP (740 AM; 1 kW; NEWPORT, KY; Owner: SACRED HEART RADIO, INC.)
Strongest FM radio stations in Sharonville:
WJVS (88.3 FM; CINCINNATI, OH; Owner: GREAT OAKS JOINT VOC. SCH. DIST.)
WMOJ (94.9 FM; FAIRFIELD, OH; Owner: WVAE LICO, INC.)
WLHS (89.9 FM; WEST CHESTER, OH; Owner: LAKOTA LOCAL SCHOOL DISTRICT)
WYGY (96.5 FM; LEBANON, OH; Owner: WVAE LICO, INC.)
WGRR (103.5 FM; HAMILTON, OH; Owner: INFINITY RADIO OPERATIONS INC.)
WRRM (98.5 FM; CINCINNATI, OH; Owner: WRRM LICO, INC)
WUBE-FM (105.1 FM; CINCINNATI, OH; Owner: INFINITY RADIO OPERATIONS INC.)
WMKV (89.3 FM; READING, OH; Owner: LIFESPHERE)
WGUC (90.9 FM; CINCINNATI, OH; Owner: CINCINNATI CLASSICAL PUBLIC RADIO, INC.)
WKRQ (101.9 FM; CINCINNATI, OH; Owner: INFINITY RADIO OPERATIONS INC.)
WKFS (107.1 FM; MILFORD, OH; Owner: JACOR BROADCASTING CORPORATION)
WOFX-FM (92.5 FM; CINCINNATI, OH; Owner: JACOR BROADCASTING CORPORATION)
WVXU (91.7 FM; CINCINNATI, OH; Owner: XAVIER UNIVERSITY)
WVMX (94.1 FM; CINCINNATI, OH; Owner: CITICASTERS LICENSES, L.P.)
WEBN (102.7 FM; CINCINNATI, OH; Owner: JACOR BROADCASTING CORPORATION)
WAKW (93.3 FM; CINCINNATI, OH; Owner: PILLAR OF FIRE)
WAQZ (97.3 FM; FORT THOMAS, KY; Owner: INFINITY RADIO OPERATIONS INC.)
WAIF (88.3 FM; CINCINNATI, OH; Owner: STEPCHILD RADIO OF CINCINNATI, INC.)
WPFB-FM (105.9 FM; MIDDLETOWN, OH; Owner: RADIO STATIONS WPAY/WPFB, INC.)
WIZF (100.9 FM; ERLANGER, KY; Owner: BLUE CHIP BROADCASTING LICENSES II, LTD.)
TV broadcast stations around Sharonville:
WLWT (Channel 5; CINCINNATI, OH; Owner: OHIO/OKLAHOMA HEARST-ARGYLE TV, INC)
WCPO-TV (Channel 9; CINCINNATI, OH; Owner: SCRIPPS HOWARD BROADCASTING COMPANY)
WKRC-TV (Channel 12; CINCINNATI, OH; Owner: CITICASTERS CO.)
WSTR-TV (Channel 64; CINCINNATI, OH; Owner: WSTR LICENSEE, INC.)
WCET (Channel 48; CINCINNATI, OH; Owner: THE GREATER CINCINNATI TV EDUC'L. FOUNDATION)
WXIX-TV (Channel 19; NEWPORT, KY; Owner: RAYCOM NATIONAL, INC.)
WBQC-CA (Channel 25; CINCINNATI, OH; Owner: ELLIOTT B. BLOCK)
WOTH-LP (Channel 35; CINCINNATI, OH; Owner: ELLIOTT B. BLOCK)
WKOI (Channel 43; RICHMOND, IN; Owner: TRINITY BROADCASTING OF INDIANA, INC.)
WPTO (Channel 14; OXFORD, OH; Owner: GREATER DAYTON PUBLIC TELEVISION, INC.)
WHIO-TV (Channel 7; DAYTON, OH; Owner: WHIO-TV HOLDINGS, INC.)
WDTN (Channel 2; DAYTON, OH; Owner: WDTN BROADCASTING, LLC)
WPTD (Channel 16; DAYTON, OH; Owner: GREATER DAYTON PUBLIC TV, INC.)
WKEF (Channel 22; DAYTON, OH; Owner: WKEF LICENSEE L.P.)
WRGT-TV (Channel 45; DAYTON, OH; Owner: WRGT LICENSEE, LLC)
W61DE (Channel 61; CINCINNATI, OH; Owner: TRINITY BROADCASTING NETWORK)
WCVN-TV (Channel 54; COVINGTON, KY; Owner: KENTUCKY AUTHORITY FOR EDUCATIONAL TV)
WWRD-LP (Channel 55; CENTERVILLE, OH; Owner: LIFE BROADCASTING NETWORK)
National Bridge Inventory (NBI) Statistics 75 Number of bridges994ft / 303m Total length3,207,117 Total average daily traffic327,884 Total average daily truck traffic
New bridges - historical statistics
1 1900-1909 1 1920-1929 2 1930-1939 6 1950-1959 45 1960-1969 7 1970-1979 4 1990-1999 9 2000-2009
See full National Bridge Inventory statistics for Sharonville, OH
FCC Registered Antenna Towers: 26 (
See the full list of FCC Registered Antenna Towers in Sharonville )
FCC Registered Broadcast Land Mobile Towers: 18 (
See the full list of FCC Registered Broadcast Land Mobile Towers in Sharonville, OH )
FCC Registered Microwave Towers: 5
3655 HAUK RD, 3655 Hauck Rd (Lat: 39.288111 Lon: -84.402694), Overall height: 45.7 m, Call Sign: WMK881, Assigned Frequencies: 2168.40 MHz, Grant Date: 12/12/2000, Expiration Date: 02/01/2011, Cancellation Date: 02/22/2002, Certifier: Paul H Kuzia, Registrant: Wilkinson Barker Knauer, LLP, 2300 N Street, N.W., Suite 700, Washington, DC 20037-1128, Phone: (202) 783-4141, Fax: (202) 783-5851, Email:
OH-CIN1069A, 11417 Lippleman Rd (Lat: 39.280806 Lon: -84.448778), Type: Pole, Structure height: 30 m, Call Sign: WQNB298, Assigned Frequencies: 23025.0 MHz, 17865.0 MHz, 23025.0 MHz, Grant Date: 03/04/2021, Expiration Date: 12/01/2030, Cancellation Date: 09/15/2021, Certifier: Nadja S Sodos-Wallace, Registrant: T-Mobile Usa, Inc., 12920 Se 38th Street, Bellevue, WA 98006, Phone: (425) 383-8402, Fax: (425) 383-4840, Email:
OH-CIN1066A, 2490 Commerce Blvd (Lat: 39.288250 Lon: -84.425806), Type: Pole, Structure height: 36.6 m, Call Sign: WQNB765, Assigned Frequencies: 18015.0 MHz, 18015.0 MHz, 21825.0 MHz, 18115.0 MHz, 18115.0 MHz, Grant Date: 03/08/2021, Expiration Date: 12/07/2030, Cancellation Date: 09/21/2021, Certifier: Nadja S Sodos-Wallace, Registrant: T-Mobile Usa, Inc., 12920 Se 38th Street, Bellevue, WA 98006, Phone: (425) 383-8402, Fax: (425) 383-4840, Email:
Sharonville, Sharonville, Oh (Lat: 39.267917 Lon: -84.419111), Type: Ltower, Structure height: 71.6 m, Call Sign: WREN253, Assigned Frequencies: 6345.49 MHz, 6345.49 MHz, 6345.49 MHz, Grant Date: 11/12/2019, Expiration Date: 11/12/2029, Certifier: Brian S Smith, Registrant: Norfolk Southern, 650 West Peachtree St Nw, Atlanta, GA 30308, Phone: (404) 582-6244, Email:
Pisgah, 9394 Sterling Drive (Lat: 39.316111 Lon: -84.369694), Type: Ltower, Structure height: 60.7 m, Call Sign: WRYC403, Assigned Frequencies: 6093.45 MHz, 6093.45 MHz, 6093.45 MHz, 6093.45 MHz, 6093.45 MHz, 6093.45 MHz, 6093.45 MHz, 6093.45 MHz, 6093.45 MHz, 6093.45 MHz, 6093.45 MHz, Grant Date: 07/24/2023, Expiration Date: 07/24/2033, Certifier: Charles Young, Registrant: Micronet Communications, Inc., 812 Lexington Dr, Plano, TX 75075, Phone: (972) 422-7200, Email:
FCC Registered Paging Towers: 1
Sharonville # 2/ 12095 Runyan Dr. (Lat: 39.293944 Lon: -84.401583), Overall height: 89 m, Call Sign: KNKM698, Licensee ID: L00001229, Assigned Frequencies: 931.837 MHz, Grant Date: 04/23/2019, Expiration Date: 04/01/2029, Certifier: J. Roy Pottle, Registrant: Ams Spectrum Holdings, LLC FCC Registered Amateur Radio Licenses: 18 (
See the full list of FCC Registered Amateur Radio Licenses in Sharonville )
FAA Registered Aircraft: 1
Aircraft: PIPER PA-32R-300 (Category: Land, Seats: 7, Weight: Up to 12,499 Pounds, Speed: 126 mph), Engine: LYCOMING TI0-540 SER (310 HP) (Reciprocating)N-Number: 9226K, N9226K, N-9226K, Serial Number: 32R-7680199, Year manufactured: 1976, Airworthiness Date: 03/22/1976, Certificate Issue Date: 11/03/2020Registrant (Individual): Nicholas C Alatis, 11099 Zaring Ct, Sharonville, OH 45241
Home Mortgage Disclosure Act Aggregated Statistics For Year 2009(Based on 2 full and 2 partial tracts) A) FHA, FSA/RHS & VA B) Conventional C) Refinancings D) Home Improvement Loans F) Non-occupant Loans on G) Loans On Manufactured Number Average Value Number Average Value Number Average Value Number Average Value Number Average Value Number Average Value
LOANS ORIGINATED 54 $130,998 49 $116,533 317 $156,756 18 $37,754 15 $84,910 1 $1,320 APPLICATIONS APPROVED, NOT ACCEPTED 2 $153,355 2 $150,215 20 $167,494 4 $9,522 1 $210,910 0 $0 APPLICATIONS DENIED 3 $128,110 5 $127,948 89 $163,964 11 $54,281 6 $100,433 1 $12,000 APPLICATIONS WITHDRAWN 2 $109,225 4 $95,758 55 $154,475 1 $188,140 0 $0 0 $0 FILES CLOSED FOR INCOMPLETENESS 1 $116,000 2 $136,000 14 $175,029 0 $0 0 $0 0 $0
Aggregated Statistics For Year 2008(Based on 2 full and 2 partial tracts) A) FHA, FSA/RHS & VA B) Conventional C) Refinancings D) Home Improvement Loans F) Non-occupant Loans on G) Loans On Manufactured Number Average Value Number Average Value Number Average Value Number Average Value Number Average Value Number Average Value
LOANS ORIGINATED 43 $144,493 73 $153,644 147 $150,620 17 $38,210 15 $128,232 1 $34,370 APPLICATIONS APPROVED, NOT ACCEPTED 2 $143,560 12 $74,634 18 $129,399 7 $31,724 1 $60,000 3 $21,773 APPLICATIONS DENIED 3 $118,710 3 $163,940 54 $153,849 11 $44,325 3 $87,577 0 $0 APPLICATIONS WITHDRAWN 4 $168,930 8 $119,246 27 $148,481 3 $87,553 2 $107,940 0 $0 FILES CLOSED FOR INCOMPLETENESS 0 $0 1 $138,000 8 $140,634 1 $55,620 0 $0 0 $0
Aggregated Statistics For Year 2007(Based on 2 full and 2 partial tracts) A) FHA, FSA/RHS & VA B) Conventional C) Refinancings D) Home Improvement Loans F) Non-occupant Loans on G) Loans On Manufactured Number Average Value Number Average Value Number Average Value Number Average Value Number Average Value Number Average Value
LOANS ORIGINATED 12 $136,832 147 $138,978 148 $122,352 26 $37,922 25 $104,923 0 $0 APPLICATIONS APPROVED, NOT ACCEPTED 0 $0 11 $114,747 28 $103,076 3 $37,927 4 $97,145 1 $34,400 APPLICATIONS DENIED 1 $160,630 14 $126,314 96 $147,568 15 $40,302 7 $142,189 1 $18,660 APPLICATIONS WITHDRAWN 2 $156,820 14 $150,999 40 $144,175 5 $72,780 8 $100,835 0 $0 FILES CLOSED FOR INCOMPLETENESS 0 $0 3 $126,933 15 $158,050 3 $18,193 0 $0 0 $0
Aggregated Statistics For Year 2006(Based on 2 full and 2 partial tracts) A) FHA, FSA/RHS & VA B) Conventional C) Refinancings D) Home Improvement Loans E) Loans on Dwellings For 5+ Families F) Non-occupant Loans on G) Loans On Manufactured Number Average Value Number Average Value Number Average Value Number Average Value Number Average Value Number Average Value Number Average Value
LOANS ORIGINATED 14 $121,932 188 $123,211 190 $115,069 40 $45,724 1 $3,300,000 27 $96,550 1 $8,800 APPLICATIONS APPROVED, NOT ACCEPTED 0 $0 22 $108,080 37 $125,191 6 $27,192 0 $0 3 $134,350 0 $0 APPLICATIONS DENIED 5 $128,800 25 $90,861 93 $136,522 21 $42,377 0 $0 7 $88,860 2 $31,015 APPLICATIONS WITHDRAWN 1 $223,770 24 $104,358 54 $141,322 5 $63,704 0 $0 5 $105,586 0 $0 FILES CLOSED FOR INCOMPLETENESS 0 $0 2 $179,785 23 $126,305 0 $0 0 $0 1 $105,390 0 $0
Aggregated Statistics For Year 2005(Based on 2 full and 2 partial tracts) A) FHA, FSA/RHS & VA B) Conventional C) Refinancings D) Home Improvement Loans F) Non-occupant Loans on G) Loans On Manufactured Number Average Value Number Average Value Number Average Value Number Average Value Number Average Value Number Average Value
LOANS ORIGINATED 16 $125,379 231 $127,600 222 $121,631 26 $43,172 26 $96,762 0 $0 APPLICATIONS APPROVED, NOT ACCEPTED 0 $0 29 $113,333 34 $115,903 9 $54,177 0 $0 0 $0 APPLICATIONS DENIED 4 $104,828 22 $91,733 142 $127,934 28 $34,886 9 $80,516 3 $14,753 APPLICATIONS WITHDRAWN 4 $113,000 25 $133,885 78 $128,436 11 $115,545 7 $64,514 1 $41,000 FILES CLOSED FOR INCOMPLETENESS 0 $0 9 $100,418 26 $138,870 3 $156,623 2 $99,965 0 $0
Aggregated Statistics For Year 2004(Based on 2 full and 2 partial tracts) A) FHA, FSA/RHS & VA B) Conventional C) Refinancings D) Home Improvement Loans E) Loans on Dwellings For 5+ Families F) Non-occupant Loans on G) Loans On Manufactured Number Average Value Number Average Value Number Average Value Number Average Value Number Average Value Number Average Value Number Average Value
LOANS ORIGINATED 17 $128,774 160 $130,329 305 $117,798 36 $61,938 1 $2,880,000 28 $109,520 0 $0 APPLICATIONS APPROVED, NOT ACCEPTED 2 $136,500 16 $106,361 49 $124,674 11 $44,004 0 $0 4 $88,980 0 $0 APPLICATIONS DENIED 3 $120,667 25 $112,464 125 $126,962 25 $25,335 0 $0 6 $89,340 3 $55,060 APPLICATIONS WITHDRAWN 3 $126,690 29 $139,164 93 $128,816 7 $52,627 0 $0 8 $91,785 1 $75,000 FILES CLOSED FOR INCOMPLETENESS 2 $131,000 8 $118,015 26 $121,610 1 $155,300 0 $0 4 $86,902 0 $0
Aggregated Statistics For Year 2003(Based on 2 full and 2 partial tracts) A) FHA, FSA/RHS & VA B) Conventional C) Refinancings D) Home Improvement Loans E) Loans on Dwellings For 5+ Families F) Non-occupant Loans on Number Average Value Number Average Value Number Average Value Number Average Value Number Average Value Number Average Value
LOANS ORIGINATED 35 $116,961 176 $133,753 798 $128,641 42 $27,829 3 $302,000 34 $102,790 APPLICATIONS APPROVED, NOT ACCEPTED 1 $171,810 22 $148,678 83 $118,015 7 $14,771 1 $120,000 3 $88,827 APPLICATIONS DENIED 8 $103,269 24 $94,331 129 $114,668 20 $12,523 0 $0 3 $80,037 APPLICATIONS WITHDRAWN 1 $73,340 18 $121,155 95 $127,692 5 $25,376 0 $0 1 $168,530 FILES CLOSED FOR INCOMPLETENESS 2 $112,000 3 $90,903 37 $125,668 2 $42,775 0 $0 1 $35,970
Aggregated Statistics For Year 2002(Based on 2 full and 2 partial tracts) A) FHA, FSA/RHS & VA B) Conventional C) Refinancings D) Home Improvement Loans F) Non-occupant Loans on Number Average Value Number Average Value Number Average Value Number Average Value Number Average Value
LOANS ORIGINATED 36 $111,637 160 $128,449 561 $128,064 42 $23,148 18 $93,850 APPLICATIONS APPROVED, NOT ACCEPTED 0 $0 20 $114,340 86 $126,394 11 $27,146 7 $94,564 APPLICATIONS DENIED 4 $105,585 10 $79,097 106 $148,611 24 $12,503 5 $79,110 APPLICATIONS WITHDRAWN 1 $102,140 14 $171,825 84 $134,773 4 $44,262 1 $111,090 FILES CLOSED FOR INCOMPLETENESS 1 $95,000 5 $127,496 26 $114,938 0 $0 0 $0
Aggregated Statistics For Year 2001(Based on 2 full and 2 partial tracts) A) FHA, FSA/RHS & VA B) Conventional C) Refinancings D) Home Improvement Loans E) Loans on Dwellings For 5+ Families F) Non-occupant Loans on Number Average Value Number Average Value Number Average Value Number Average Value Number Average Value Number Average Value
LOANS ORIGINATED 35 $108,773 162 $135,588 459 $119,111 41 $28,556 1 $3,980,000 18 $101,838 APPLICATIONS APPROVED, NOT ACCEPTED 1 $87,000 19 $141,103 54 $110,502 10 $12,319 0 $0 1 $272,220 APPLICATIONS DENIED 3 $74,237 22 $78,233 106 $103,419 25 $13,368 1 $300,000 2 $94,060 APPLICATIONS WITHDRAWN 6 $98,335 20 $151,124 79 $116,470 6 $17,485 0 $0 4 $151,292 FILES CLOSED FOR INCOMPLETENESS 0 $0 2 $106,090 21 $113,800 2 $47,505 0 $0 1 $78,680
Aggregated Statistics For Year 2000(Based on 2 full and 2 partial tracts) A) FHA, FSA/RHS & VA B) Conventional C) Refinancings D) Home Improvement Loans E) Loans on Dwellings For 5+ Families F) Non-occupant Loans on Number Average Value Number Average Value Number Average Value Number Average Value Number Average Value Number Average Value
LOANS ORIGINATED 35 $99,563 133 $124,064 114 $100,302 51 $18,506 1 $1,280,000 13 $83,121 APPLICATIONS APPROVED, NOT ACCEPTED 2 $81,500 21 $87,832 38 $90,210 22 $14,301 1 $3,000,000 4 $78,500 APPLICATIONS DENIED 3 $82,960 43 $53,001 60 $90,078 35 $12,659 0 $0 3 $66,220 APPLICATIONS WITHDRAWN 3 $122,670 12 $118,322 25 $84,318 1 $30,030 0 $0 0 $0 FILES CLOSED FOR INCOMPLETENESS 0 $0 0 $0 10 $94,506 0 $0 0 $0 1 $77,000
Aggregated Statistics For Year 1999(Based on 2 full and 2 partial tracts) A) FHA, FSA/RHS & VA B) Conventional C) Refinancings D) Home Improvement Loans E) Loans on Dwellings For 5+ Families F) Non-occupant Loans on Number Average Value Number Average Value Number Average Value Number Average Value Number Average Value Number Average Value
LOANS ORIGINATED 39 $110,545 183 $110,458 251 $100,590 46 $17,774 1 $61,350 20 $80,303 APPLICATIONS APPROVED, NOT ACCEPTED 1 $107,740 26 $97,935 52 $90,823 12 $14,425 0 $0 3 $86,727 APPLICATIONS DENIED 5 $115,896 41 $67,076 61 $107,708 37 $9,959 0 $0 5 $67,434 APPLICATIONS WITHDRAWN 1 $112,760 20 $100,598 42 $86,798 10 $55,689 0 $0 2 $47,885 FILES CLOSED FOR INCOMPLETENESS 0 $0 6 $76,825 18 $97,751 0 $0 0 $0 0 $0
Detailed HMDA statistics for the following Tracts:
0111.04
, 0223.02 , 0230.01 , 0230.02
Private Mortgage Insurance Companies Aggregated Statistics For Year 2009(Based on 2 full and 2 partial tracts) A) Conventional B) Refinancings Number Average Value Number Average Value
LOANS ORIGINATED 6 $178,243 10 $147,082 APPLICATIONS APPROVED, NOT ACCEPTED 2 $108,835 4 $175,438 APPLICATIONS DENIED 1 $224,310 2 $153,075 APPLICATIONS WITHDRAWN 0 $0 0 $0 FILES CLOSED FOR INCOMPLETENESS 0 $0 0 $0
Aggregated Statistics For Year 2008(Based on 2 full and 2 partial tracts) A) Conventional B) Refinancings C) Non-occupant Loans on Number Average Value Number Average Value Number Average Value
LOANS ORIGINATED 26 $152,888 10 $164,791 0 $0 APPLICATIONS APPROVED, NOT ACCEPTED 7 $134,776 3 $123,903 1 $86,000 APPLICATIONS DENIED 2 $175,485 1 $382,310 0 $0 APPLICATIONS WITHDRAWN 1 $188,970 0 $0 0 $0 FILES CLOSED FOR INCOMPLETENESS 0 $0 0 $0 0 $0
Aggregated Statistics For Year 2007(Based on 2 full and 2 partial tracts) A) Conventional B) Refinancings C) Non-occupant Loans on Number Average Value Number Average Value Number Average Value
LOANS ORIGINATED 42 $132,439 17 $179,838 2 $115,450 APPLICATIONS APPROVED, NOT ACCEPTED 6 $118,378 1 $200,110 1 $65,000 APPLICATIONS DENIED 1 $104,000 0 $0 0 $0 APPLICATIONS WITHDRAWN 0 $0 1 $188,740 0 $0 FILES CLOSED FOR INCOMPLETENESS 0 $0 0 $0 0 $0
Aggregated Statistics For Year 2006(Based on 2 full and 2 partial tracts) A) Conventional B) Refinancings C) Non-occupant Loans on Number Average Value Number Average Value Number Average Value
LOANS ORIGINATED 38 $137,710 9 $173,924 2 $149,850 APPLICATIONS APPROVED, NOT ACCEPTED 2 $151,355 4 $135,072 0 $0 APPLICATIONS DENIED 0 $0 0 $0 0 $0 APPLICATIONS WITHDRAWN 2 $199,075 1 $195,810 1 $65,000 FILES CLOSED FOR INCOMPLETENESS 0 $0 0 $0 0 $0
Aggregated Statistics For Year 2005(Based on 2 full and 2 partial tracts) A) Conventional B) Refinancings C) Non-occupant Loans on Number Average Value Number Average Value Number Average Value
LOANS ORIGINATED 30 $137,405 16 $140,602 0 $0 APPLICATIONS APPROVED, NOT ACCEPTED 5 $128,114 10 $146,989 1 $144,000 APPLICATIONS DENIED 0 $0 0 $0 0 $0 APPLICATIONS WITHDRAWN 3 $103,000 0 $0 1 $85,000 FILES CLOSED FOR INCOMPLETENESS 0 $0 0 $0 0 $0
Aggregated Statistics For Year 2004(Based on 2 full and 2 partial tracts) A) Conventional B) Refinancings C) Non-occupant Loans on Number Average Value Number Average Value Number Average Value
LOANS ORIGINATED 23 $140,899 16 $132,482 3 $72,840 APPLICATIONS APPROVED, NOT ACCEPTED 8 $162,184 14 $140,607 1 $65,000 APPLICATIONS DENIED 1 $127,000 0 $0 0 $0 APPLICATIONS WITHDRAWN 0 $0 4 $155,815 0 $0 FILES CLOSED FOR INCOMPLETENESS 0 $0 0 $0 0 $0
Aggregated Statistics For Year 2003(Based on 2 full and 2 partial tracts) A) Conventional B) Refinancings C) Non-occupant Loans on Number Average Value Number Average Value Number Average Value
LOANS ORIGINATED 37 $127,596 67 $137,007 1 $80,370 APPLICATIONS APPROVED, NOT ACCEPTED 8 $123,634 20 $147,908 2 $88,340 APPLICATIONS DENIED 0 $0 4 $126,542 1 $112,730 APPLICATIONS WITHDRAWN 3 $112,360 3 $175,963 0 $0 FILES CLOSED FOR INCOMPLETENESS 0 $0 2 $105,500 0 $0
Aggregated Statistics For Year 2002(Based on 2 full and 2 partial tracts) A) Conventional B) Refinancings C) Non-occupant Loans on Number Average Value Number Average Value Number Average Value
LOANS ORIGINATED 38 $143,511 39 $151,856 4 $88,102 APPLICATIONS APPROVED, NOT ACCEPTED 8 $185,102 14 $133,224 0 $0 APPLICATIONS DENIED 0 $0 0 $0 0 $0 APPLICATIONS WITHDRAWN 4 $148,065 5 $166,024 2 $126,180 FILES CLOSED FOR INCOMPLETENESS 0 $0 0 $0 0 $0
Aggregated Statistics For Year 2001(Based on 2 full and 2 partial tracts) A) Conventional B) Refinancings C) Non-occupant Loans on Number Average Value Number Average Value Number Average Value
LOANS ORIGINATED 48 $135,399 44 $138,533 4 $100,630 APPLICATIONS APPROVED, NOT ACCEPTED 8 $158,331 11 $124,985 0 $0 APPLICATIONS DENIED 0 $0 1 $151,040 0 $0 APPLICATIONS WITHDRAWN 1 $119,410 0 $0 0 $0 FILES CLOSED FOR INCOMPLETENESS 0 $0 0 $0 0 $0
Aggregated Statistics For Year 2000(Based on 2 full and 2 partial tracts) A) Conventional B) Refinancings C) Non-occupant Loans on Number Average Value Number Average Value Number Average Value
LOANS ORIGINATED 37 $122,786 5 $129,598 2 $94,350 APPLICATIONS APPROVED, NOT ACCEPTED 6 $98,357 1 $172,580 0 $0 APPLICATIONS DENIED 0 $0 1 $94,000 0 $0 APPLICATIONS WITHDRAWN 3 $138,533 0 $0 0 $0 FILES CLOSED FOR INCOMPLETENESS 0 $0 2 $128,000 0 $0
Aggregated Statistics For Year 1999(Based on 2 full and 2 partial tracts) A) Conventional B) Refinancings C) Non-occupant Loans on Number Average Value Number Average Value Number Average Value
LOANS ORIGINATED 53 $118,337 30 $110,104 0 $0 APPLICATIONS APPROVED, NOT ACCEPTED 5 $116,384 4 $156,498 1 $90,980 APPLICATIONS DENIED 2 $105,160 0 $0 0 $0 APPLICATIONS WITHDRAWN 1 $135,570 1 $103,530 0 $0 FILES CLOSED FOR INCOMPLETENESS 0 $0 0 $0 0 $0
Detailed PMIC statistics for the following Tracts:
0111.04
, 0223.02 , 0230.01 , 0230.02 Fire-safe hotels and motels in Sharonville, Ohio:
Travelodge, 11171 Dowlin Dr, Sharonville, Ohio 45241 Phone: (513) 772-4114, Fax: (513) 772-8092
Ramada Plaza Cincinnati Sharonville, 11320 Chester Rd, Sharonville, Ohio 45246 Phone: (513) 771-2080, Fax: (513) 771-2312
Extended Stay America - Cincinnati - Sharonville, 11457 Chester Rd, Sharonville, Ohio 45246 Phone: (513) 771-7829, Fax: (513) 772-7829
Doubletree Suites by Hilton - Cincinnati Blue Ash, 6300 E Kemper Rd, Sharonville, Ohio 90838 Phone: (513) 489-3636, Fax: (513) 489-8231
Drury Inn & Suites Cincinnati Sharonville, 2265 E Sharon Rd, Sharonville, Ohio 45241 Phone: (513) 771-5601
All 5 fire-safe hotels and motels in Sharonville, Ohio Sharonville compared to Ohio state average:
Unemployed percentage significantly below state average. Hispanic race population percentage above state average. Foreign-born population percentage above state average. Length of stay since moving in significantly above state average. Percentage of population with a bachelor's degree or higher above state average. Sharonville on our top lists :
#35 on the list of "Top 101 cities with the most local government spending on current operations of parks and recreation per resident (population 10,000+)"
#58 on the list of "Top 101 cities that people commute into (largest positive percentage daily daytime population change due to commuting) (population 5,000+)"
#9 on the list of "Top 101 counties with the highest number of infant deaths per 1000 residents 2007-2013 (pop. 50,000+)"
#13 on the list of "Top 101 counties with the highest Sulfur Oxides Annual air pollution readings in 2012 (µg/m3 )"
#22 on the list of "Top 101 counties with the most Catholic congregations"
#25 on the list of "Top 101 counties with the most Mainline Protestant congregations"
#32 on the list of "Top 101 counties with the most Mainline Protestant adherents (pop. 50,000+)"
Top Patent Applicants
Paul Thomas Weisman (5)
Jonathan Paul Brennan (5)
Timothy Francis Andrews (5)
Michael Paul Hausfeld (4)
Catherine Cornick Davis (4)
Randy M. Vondrell (3)
Robert Thomas Hinkle (2)
Steven Carl Burgess (2)
Brian Joseph Loughnane (2)
John Kuhn (2)
Total of 62 patent applications in 2008-2024.


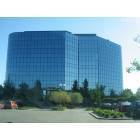
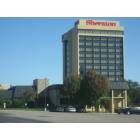
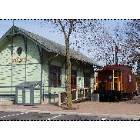
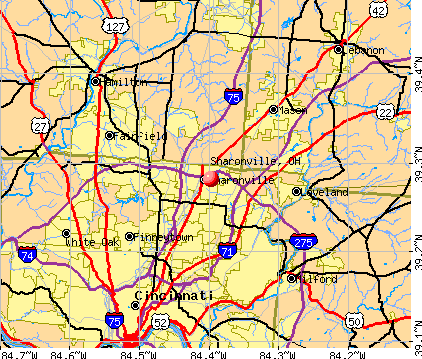


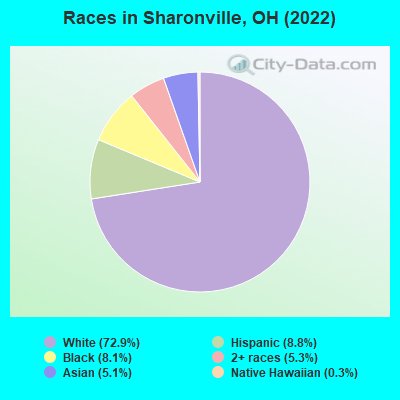
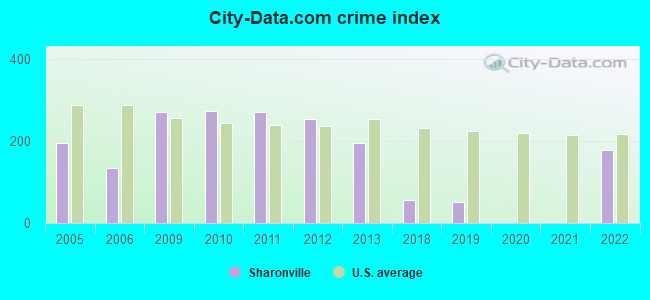
 Recent articles from our blog. Our writers, many of them Ph.D. graduates or candidates, create easy-to-read articles on a wide variety of topics.


 (11.5 miles
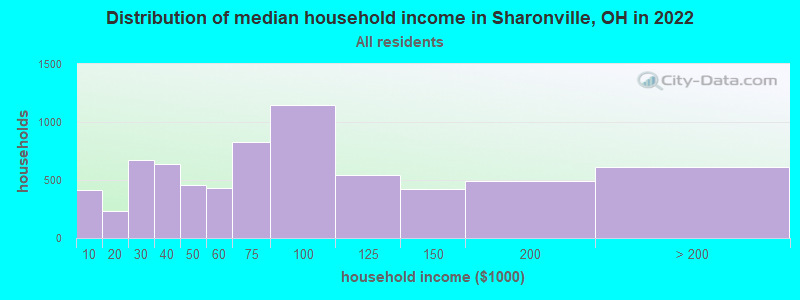
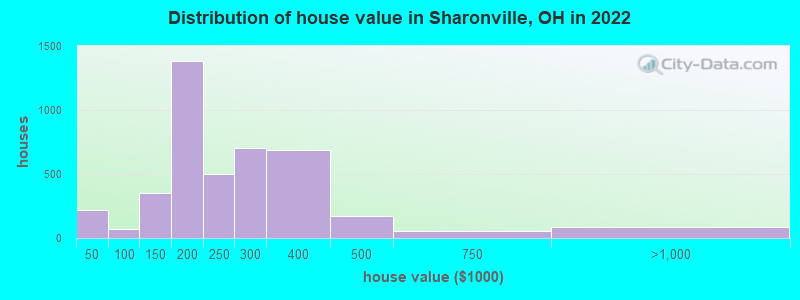

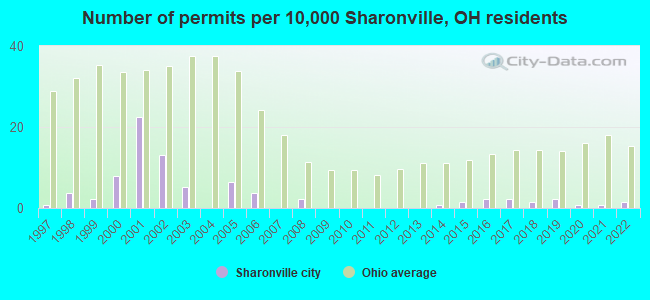
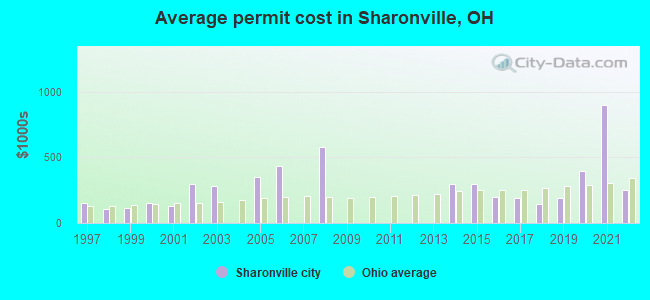
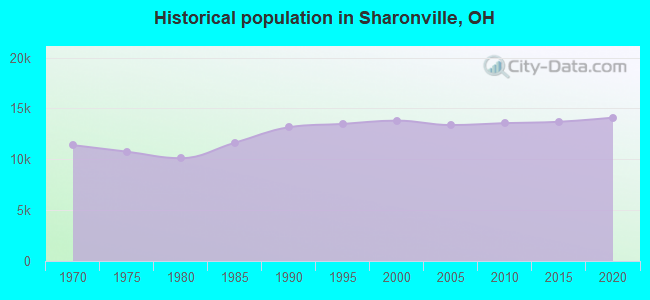
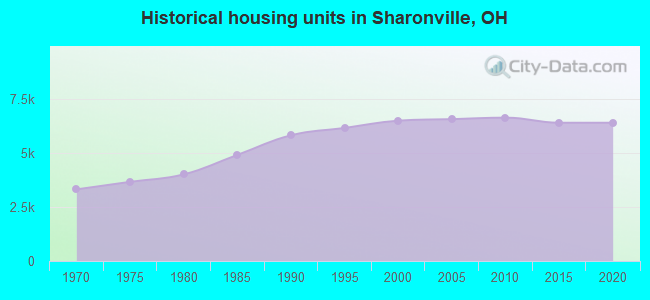
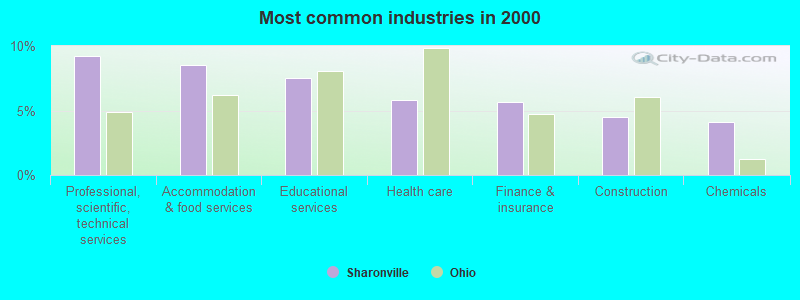
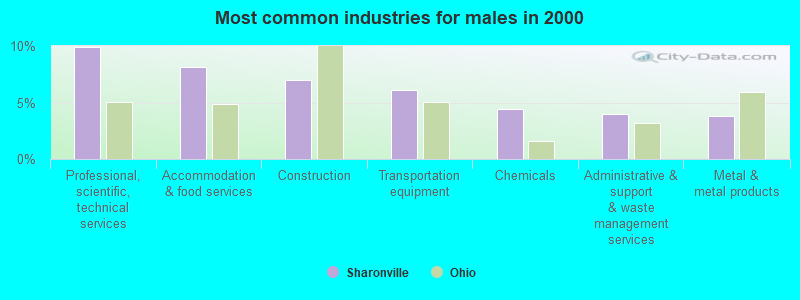
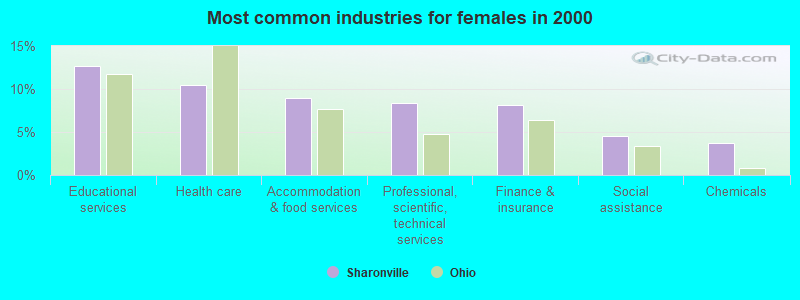
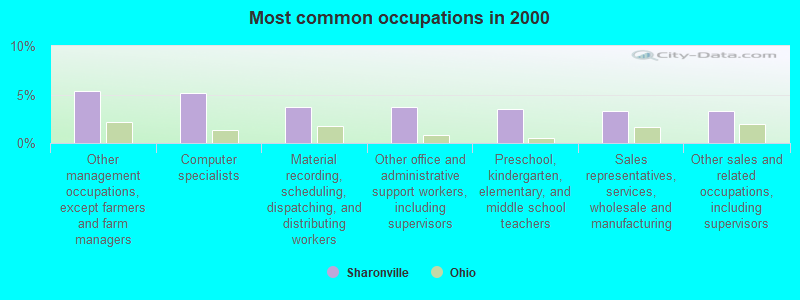
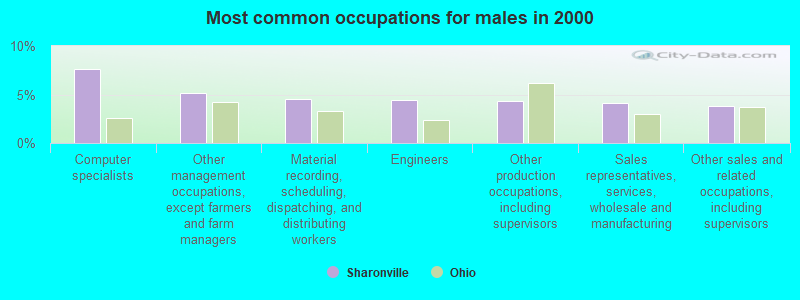
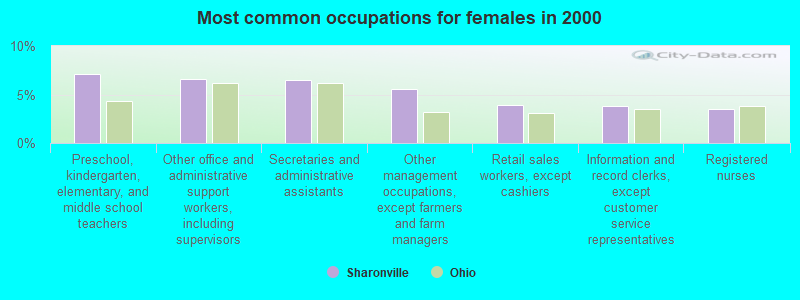


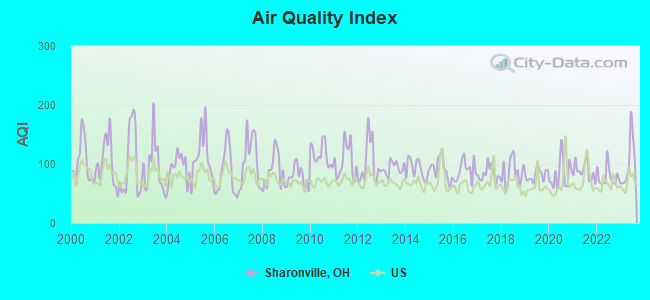
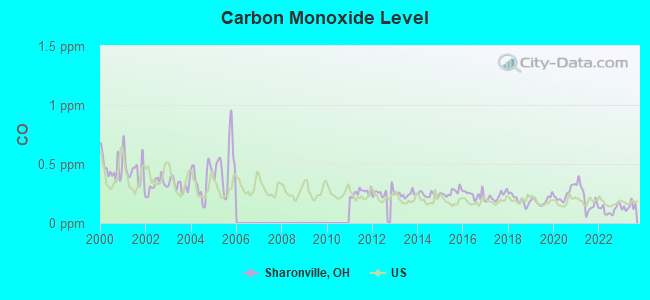
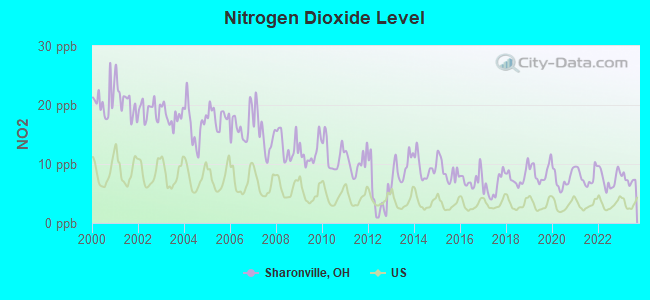
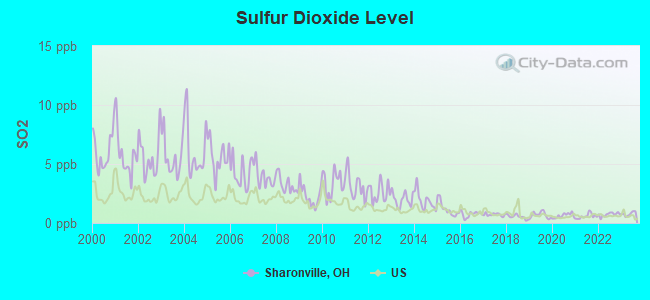
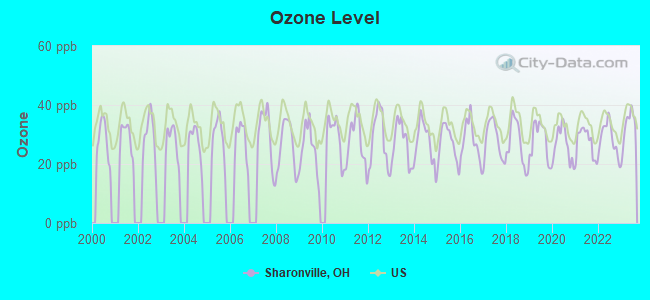
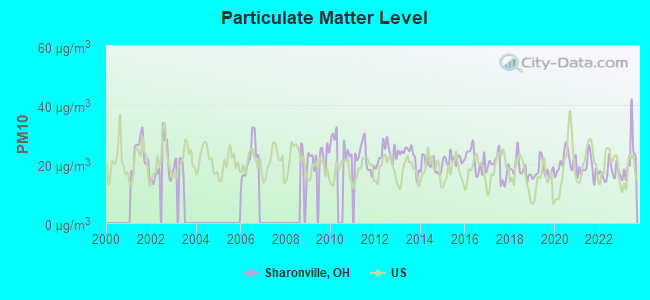
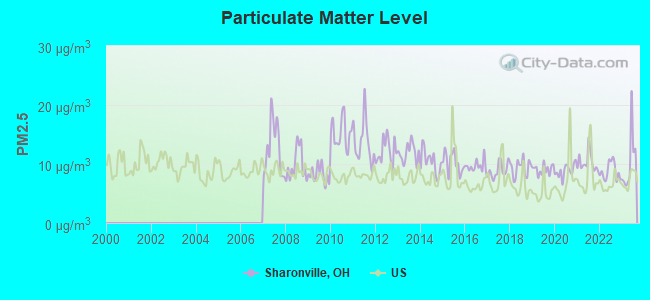
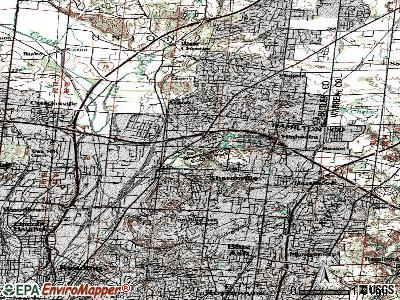
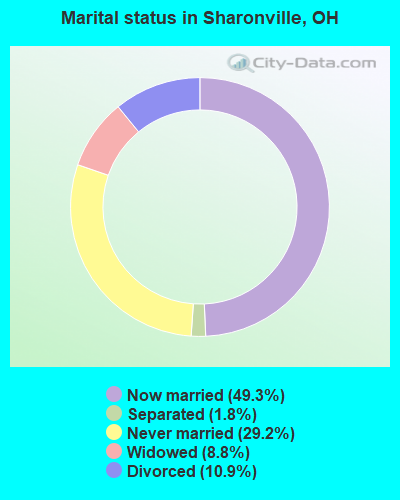
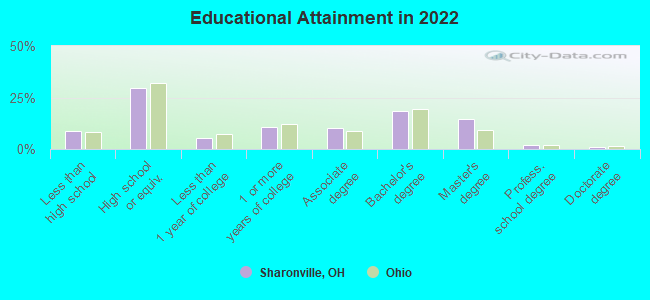
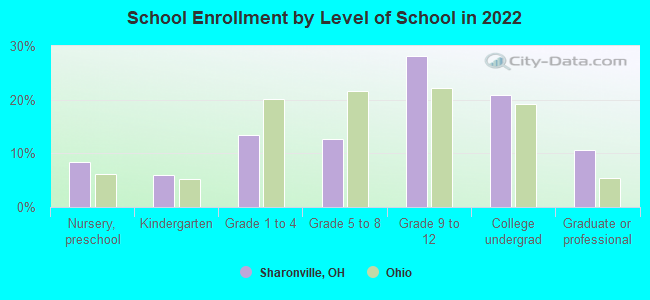
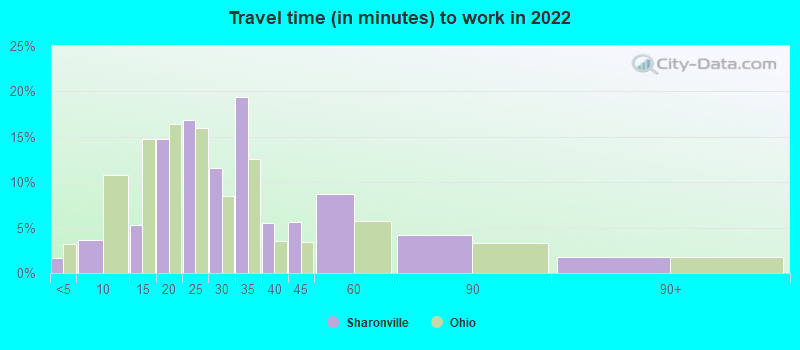
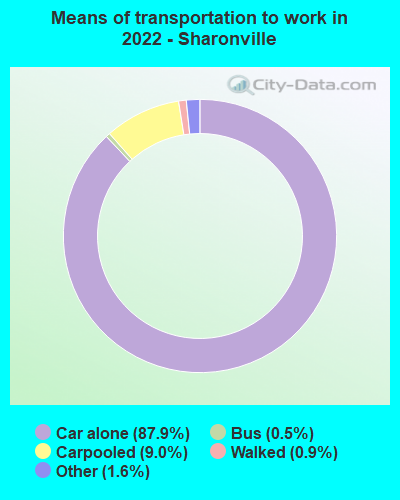
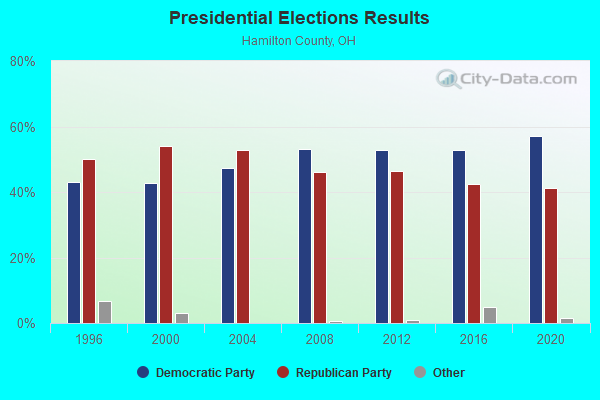
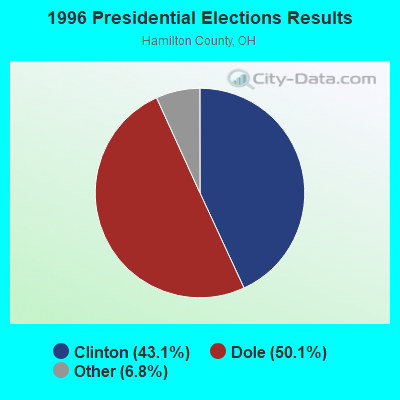
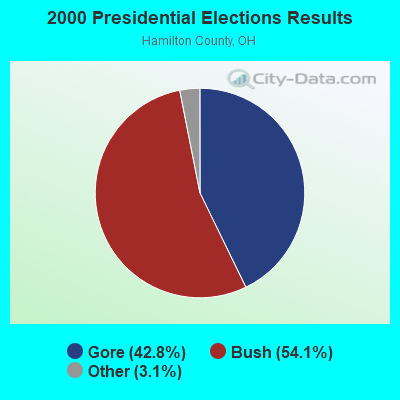
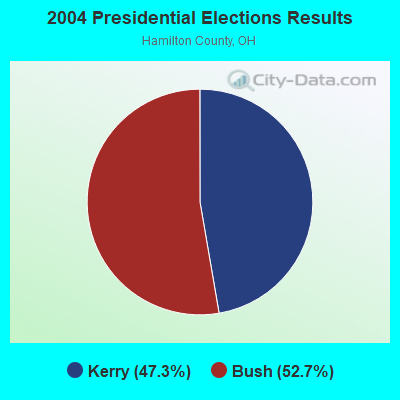
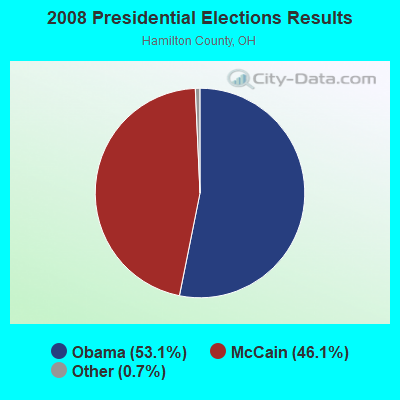
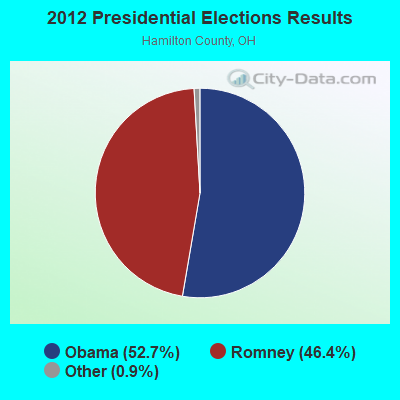
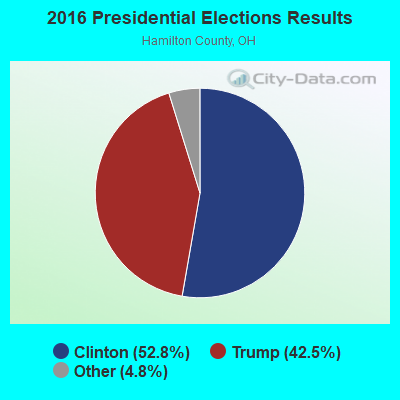
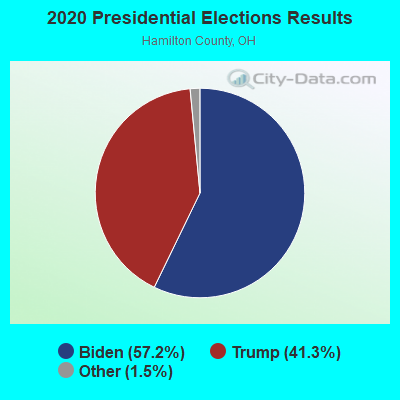
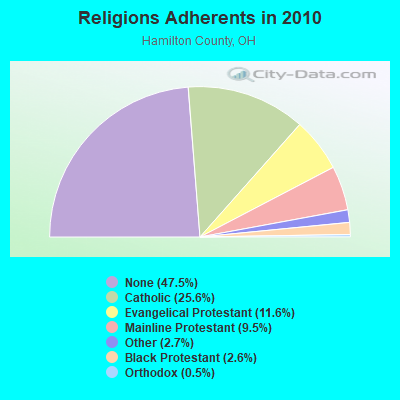
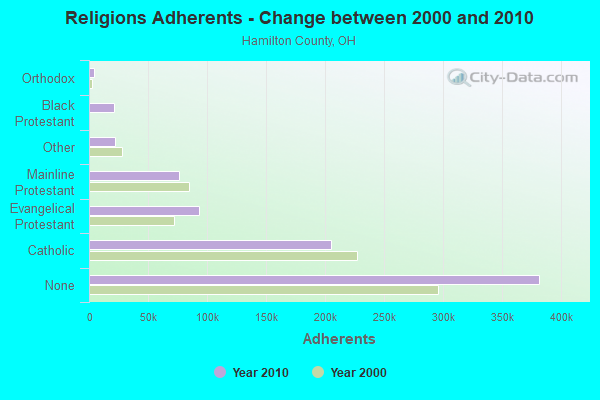
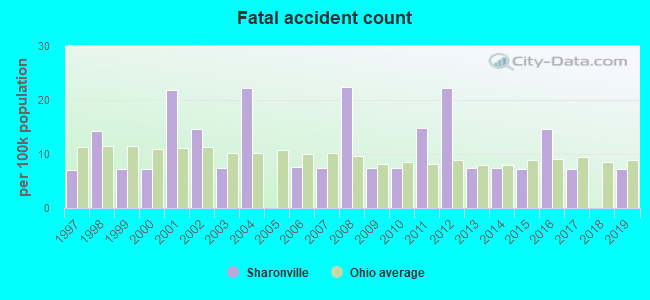
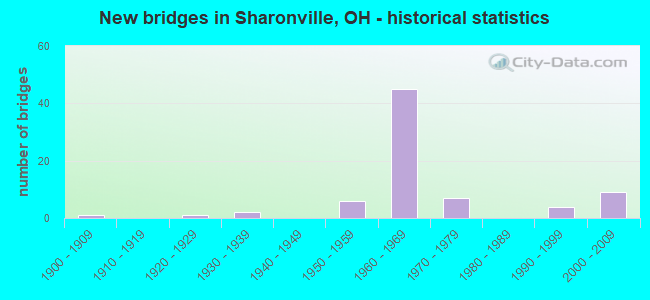
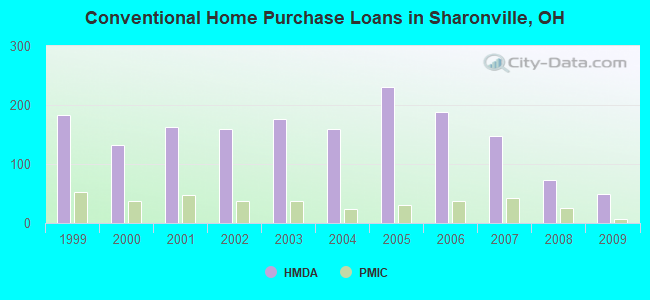
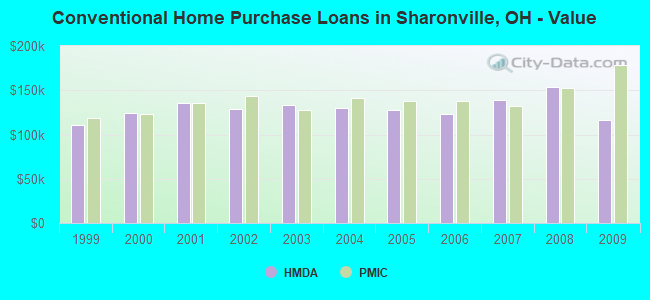
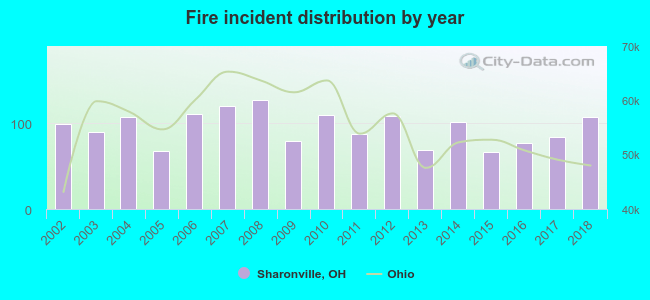 Based on the data from the years 2002 - 2018 the average number of fire incidents per year is 95. The highest number of reported fires - 127 took place in 2008, and the least - 67 in 2015. The data has a rising trend.
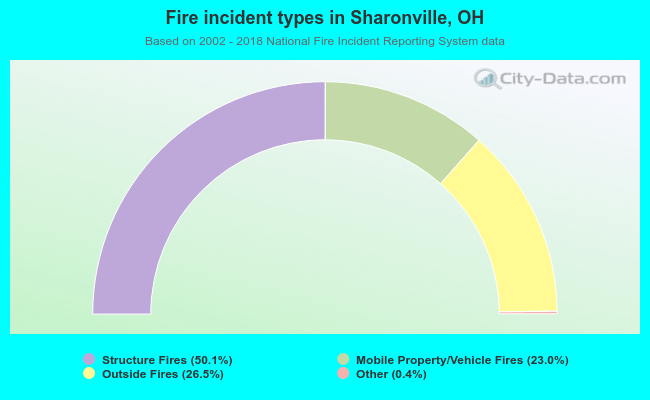 When looking into fire subcategories, the most incidents belonged to: Structure Fires (50.1%), and Outside Fires (26.5%).