Shelby, Michigan Submit your own pictures of this place and show them to the world
OSM Map
General Map
Google Map
MSN Map
OSM Map
General Map
Google Map
MSN Map
OSM Map
General Map
Google Map
MSN Map
OSM Map
General Map
Google Map
MSN Map
Please wait while loading the map...
Population in July 2007: 68,294.Males: 34,076 Females: 34,218
March 2022 cost of living index in Shelby: 102.7 (near average, U.S. average is 100)
Profiles of local businesses
Business Search - 14 Million verified businesses
Data:
Median household income ($)
Median household income (% change since 2000)
Household income diversity
Ratio of average income to average house value (%)
Ratio of average income to average rent
Median household income ($) - White
Median household income ($) - Black or African American
Median household income ($) - Asian
Median household income ($) - Hispanic or Latino
Median household income ($) - American Indian and Alaska Native
Median household income ($) - Multirace
Median household income ($) - Other Race
Median household income for houses/condos with a mortgage ($)
Median household income for apartments without a mortgage ($)
Races - White alone (%)
Races - White alone (% change since 2000)
Races - Black alone (%)
Races - Black alone (% change since 2000)
Races - American Indian alone (%)
Races - American Indian alone (% change since 2000)
Races - Asian alone (%)
Races - Asian alone (% change since 2000)
Races - Hispanic (%)
Races - Hispanic (% change since 2000)
Races - Native Hawaiian and Other Pacific Islander alone (%)
Races - Native Hawaiian and Other Pacific Islander alone (% change since 2000)
Races - Two or more races (%)
Races - Two or more races (% change since 2000)
Races - Other race alone (%)
Races - Other race alone (% change since 2000)
Racial diversity
Unemployment (%)
Unemployment (% change since 2000)
Unemployment (%) - White
Unemployment (%) - Black or African American
Unemployment (%) - Asian
Unemployment (%) - Hispanic or Latino
Unemployment (%) - American Indian and Alaska Native
Unemployment (%) - Multirace
Unemployment (%) - Other Race
Population density (people per square mile)
Population - Males (%)
Population - Females (%)
Population - Males (%) - White
Population - Males (%) - Black or African American
Population - Males (%) - Asian
Population - Males (%) - Hispanic or Latino
Population - Males (%) - American Indian and Alaska Native
Population - Males (%) - Multirace
Population - Males (%) - Other Race
Population - Females (%) - White
Population - Females (%) - Black or African American
Population - Females (%) - Asian
Population - Females (%) - Hispanic or Latino
Population - Females (%) - American Indian and Alaska Native
Population - Females (%) - Multirace
Population - Females (%) - Other Race
Coronavirus confirmed cases (Jun 16, 2024)
Deaths caused by coronavirus (Jun 16, 2024)
Coronavirus confirmed cases (per 100k population) (Jun 16, 2024)
Deaths caused by coronavirus (per 100k population) (Jun 16, 2024)
Daily increase in number of cases (Jun 16, 2024)
Weekly increase in number of cases (Jun 16, 2024)
Cases doubled (in days) (Jun 16, 2024)
Hospitalized patients (Apr 18, 2022)
Negative test results (Apr 18, 2022)
Total test results (Apr 18, 2022)
COVID Vaccine doses distributed (per 100k population) (Sep 19, 2023)
COVID Vaccine doses administered (per 100k population) (Sep 19, 2023)
COVID Vaccine doses distributed (Sep 19, 2023)
COVID Vaccine doses administered (Sep 19, 2023)
Likely homosexual households (%)
Likely homosexual households (% change since 2000)
Likely homosexual households - Lesbian couples (%)
Likely homosexual households - Lesbian couples (% change since 2000)
Likely homosexual households - Gay men (%)
Likely homosexual households - Gay men (% change since 2000)
Cost of living index
Median gross rent ($)
Median contract rent ($)
Median monthly housing costs ($)
Median house or condo value ($)
Median house or condo value ($ change since 2000)
Mean house or condo value by units in structure - 1, detached ($)
Mean house or condo value by units in structure - 1, attached ($)
Mean house or condo value by units in structure - 2 ($)
Mean house or condo value by units in structure by units in structure - 3 or 4 ($)
Mean house or condo value by units in structure - 5 or more ($)
Mean house or condo value by units in structure - Boat, RV, van, etc. ($)
Mean house or condo value by units in structure - Mobile home ($)
Median house or condo value ($) - White
Median house or condo value ($) - Black or African American
Median house or condo value ($) - Asian
Median house or condo value ($) - Hispanic or Latino
Median house or condo value ($) - American Indian and Alaska Native
Median house or condo value ($) - Multirace
Median house or condo value ($) - Other Race
Median resident age
Resident age diversity
Median resident age - Males
Median resident age - Females
Median resident age - White
Median resident age - Black or African American
Median resident age - Asian
Median resident age - Hispanic or Latino
Median resident age - American Indian and Alaska Native
Median resident age - Multirace
Median resident age - Other Race
Median resident age - Males - White
Median resident age - Males - Black or African American
Median resident age - Males - Asian
Median resident age - Males - Hispanic or Latino
Median resident age - Males - American Indian and Alaska Native
Median resident age - Males - Multirace
Median resident age - Males - Other Race
Median resident age - Females - White
Median resident age - Females - Black or African American
Median resident age - Females - Asian
Median resident age - Females - Hispanic or Latino
Median resident age - Females - American Indian and Alaska Native
Median resident age - Females - Multirace
Median resident age - Females - Other Race
Commute - mean travel time to work (minutes)
Travel time to work - Less than 5 minutes (%)
Travel time to work - Less than 5 minutes (% change since 2000)
Travel time to work - 5 to 9 minutes (%)
Travel time to work - 5 to 9 minutes (% change since 2000)
Travel time to work - 10 to 19 minutes (%)
Travel time to work - 10 to 19 minutes (% change since 2000)
Travel time to work - 20 to 29 minutes (%)
Travel time to work - 20 to 29 minutes (% change since 2000)
Travel time to work - 30 to 39 minutes (%)
Travel time to work - 30 to 39 minutes (% change since 2000)
Travel time to work - 40 to 59 minutes (%)
Travel time to work - 40 to 59 minutes (% change since 2000)
Travel time to work - 60 to 89 minutes (%)
Travel time to work - 60 to 89 minutes (% change since 2000)
Travel time to work - 90 or more minutes (%)
Travel time to work - 90 or more minutes (% change since 2000)
Marital status - Never married (%)
Marital status - Now married (%)
Marital status - Separated (%)
Marital status - Widowed (%)
Marital status - Divorced (%)
Median family income ($)
Median family income (% change since 2000)
Median non-family income ($)
Median non-family income (% change since 2000)
Median per capita income ($)
Median per capita income (% change since 2000)
Median family income ($) - White
Median family income ($) - Black or African American
Median family income ($) - Asian
Median family income ($) - Hispanic or Latino
Median family income ($) - American Indian and Alaska Native
Median family income ($) - Multirace
Median family income ($) - Other Race
Median year house/condo built
Median year apartment built
Year house built - Built 2005 or later (%)
Year house built - Built 2000 to 2004 (%)
Year house built - Built 1990 to 1999 (%)
Year house built - Built 1980 to 1989 (%)
Year house built - Built 1970 to 1979 (%)
Year house built - Built 1960 to 1969 (%)
Year house built - Built 1950 to 1959 (%)
Year house built - Built 1940 to 1949 (%)
Year house built - Built 1939 or earlier (%)
Average household size
Household density (households per square mile)
Average household size - White
Average household size - Black or African American
Average household size - Asian
Average household size - Hispanic or Latino
Average household size - American Indian and Alaska Native
Average household size - Multirace
Average household size - Other Race
Occupied housing units (%)
Vacant housing units (%)
Owner occupied housing units (%)
Renter occupied housing units (%)
Vacancy status - For rent (%)
Vacancy status - For sale only (%)
Vacancy status - Rented or sold, not occupied (%)
Vacancy status - For seasonal, recreational, or occasional use (%)
Vacancy status - For migrant workers (%)
Vacancy status - Other vacant (%)
Residents with income below the poverty level (%)
Residents with income below 50% of the poverty level (%)
Children below poverty level (%)
Poor families by family type - Married-couple family (%)
Poor families by family type - Male, no wife present (%)
Poor families by family type - Female, no husband present (%)
Poverty status for native-born residents (%)
Poverty status for foreign-born residents (%)
Poverty among high school graduates not in families (%)
Poverty among people who did not graduate high school not in families (%)
Residents with income below the poverty level (%) - White
Residents with income below the poverty level (%) - Black or African American
Residents with income below the poverty level (%) - Asian
Residents with income below the poverty level (%) - Hispanic or Latino
Residents with income below the poverty level (%) - American Indian and Alaska Native
Residents with income below the poverty level (%) - Multirace
Residents with income below the poverty level (%) - Other Race
Air pollution - Air Quality Index (AQI)
Air pollution - CO
Air pollution - NO2
Air pollution - SO2
Air pollution - Ozone
Air pollution - PM10
Air pollution - PM25
Air pollution - Pb
Crime - Murders per 100,000 population
Crime - Rapes per 100,000 population
Crime - Robberies per 100,000 population
Crime - Assaults per 100,000 population
Crime - Burglaries per 100,000 population
Crime - Thefts per 100,000 population
Crime - Auto thefts per 100,000 population
Crime - Arson per 100,000 population
Crime - City-data.com crime index
Crime - Violent crime index
Crime - Property crime index
Crime - Murders per 100,000 population (5 year average)
Crime - Rapes per 100,000 population (5 year average)
Crime - Robberies per 100,000 population (5 year average)
Crime - Assaults per 100,000 population (5 year average)
Crime - Burglaries per 100,000 population (5 year average)
Crime - Thefts per 100,000 population (5 year average)
Crime - Auto thefts per 100,000 population (5 year average)
Crime - Arson per 100,000 population (5 year average)
Crime - City-data.com crime index (5 year average)
Crime - Violent crime index (5 year average)
Crime - Property crime index (5 year average)
1996 Presidential Elections Results (%) - Democratic Party (Clinton)
1996 Presidential Elections Results (%) - Republican Party (Dole)
1996 Presidential Elections Results (%) - Other
2000 Presidential Elections Results (%) - Democratic Party (Gore)
2000 Presidential Elections Results (%) - Republican Party (Bush)
2000 Presidential Elections Results (%) - Other
2004 Presidential Elections Results (%) - Democratic Party (Kerry)
2004 Presidential Elections Results (%) - Republican Party (Bush)
2004 Presidential Elections Results (%) - Other
2008 Presidential Elections Results (%) - Democratic Party (Obama)
2008 Presidential Elections Results (%) - Republican Party (McCain)
2008 Presidential Elections Results (%) - Other
2012 Presidential Elections Results (%) - Democratic Party (Obama)
2012 Presidential Elections Results (%) - Republican Party (Romney)
2012 Presidential Elections Results (%) - Other
2016 Presidential Elections Results (%) - Democratic Party (Clinton)
2016 Presidential Elections Results (%) - Republican Party (Trump)
2016 Presidential Elections Results (%) - Other
2020 Presidential Elections Results (%) - Democratic Party (Biden)
2020 Presidential Elections Results (%) - Republican Party (Trump)
2020 Presidential Elections Results (%) - Other
Ancestries Reported - Arab (%)
Ancestries Reported - Czech (%)
Ancestries Reported - Danish (%)
Ancestries Reported - Dutch (%)
Ancestries Reported - English (%)
Ancestries Reported - French (%)
Ancestries Reported - French Canadian (%)
Ancestries Reported - German (%)
Ancestries Reported - Greek (%)
Ancestries Reported - Hungarian (%)
Ancestries Reported - Irish (%)
Ancestries Reported - Italian (%)
Ancestries Reported - Lithuanian (%)
Ancestries Reported - Norwegian (%)
Ancestries Reported - Polish (%)
Ancestries Reported - Portuguese (%)
Ancestries Reported - Russian (%)
Ancestries Reported - Scotch-Irish (%)
Ancestries Reported - Scottish (%)
Ancestries Reported - Slovak (%)
Ancestries Reported - Subsaharan African (%)
Ancestries Reported - Swedish (%)
Ancestries Reported - Swiss (%)
Ancestries Reported - Ukrainian (%)
Ancestries Reported - United States (%)
Ancestries Reported - Welsh (%)
Ancestries Reported - West Indian (%)
Ancestries Reported - Other (%)
Educational Attainment - No schooling completed (%)
Educational Attainment - Less than high school (%)
Educational Attainment - High school or equivalent (%)
Educational Attainment - Less than 1 year of college (%)
Educational Attainment - 1 or more years of college (%)
Educational Attainment - Associate degree (%)
Educational Attainment - Bachelor's degree (%)
Educational Attainment - Master's degree (%)
Educational Attainment - Professional school degree (%)
Educational Attainment - Doctorate degree (%)
School Enrollment - Nursery, preschool (%)
School Enrollment - Kindergarten (%)
School Enrollment - Grade 1 to 4 (%)
School Enrollment - Grade 5 to 8 (%)
School Enrollment - Grade 9 to 12 (%)
School Enrollment - College undergrad (%)
School Enrollment - Graduate or professional (%)
School Enrollment - Not enrolled in school (%)
School enrollment - Public schools (%)
School enrollment - Private schools (%)
School enrollment - Not enrolled (%)
Median number of rooms in houses and condos
Median number of rooms in apartments
Housing units lacking complete plumbing facilities (%)
Housing units lacking complete kitchen facilities (%)
Density of houses
Urban houses (%)
Rural houses (%)
Households with people 60 years and over (%)
Households with people 65 years and over (%)
Households with people 75 years and over (%)
Households with one or more nonrelatives (%)
Households with no nonrelatives (%)
Population in households (%)
Family households (%)
Nonfamily households (%)
Population in families (%)
Family households with own children (%)
Median number of bedrooms in owner occupied houses
Mean number of bedrooms in owner occupied houses
Median number of bedrooms in renter occupied houses
Mean number of bedrooms in renter occupied houses
Median number of vehichles in owner occupied houses
Mean number of vehichles in owner occupied houses
Median number of vehichles in renter occupied houses
Mean number of vehichles in renter occupied houses
Mortgage status - with mortgage (%)
Mortgage status - with second mortgage (%)
Mortgage status - with home equity loan (%)
Mortgage status - with both second mortgage and home equity loan (%)
Mortgage status - without a mortgage (%)
Average family size
Average family size - White
Average family size - Black or African American
Average family size - Asian
Average family size - Hispanic or Latino
Average family size - American Indian and Alaska Native
Average family size - Multirace
Average family size - Other Race
Geographical mobility - Same house 1 year ago (%)
Geographical mobility - Moved within same county (%)
Geographical mobility - Moved from different county within same state (%)
Geographical mobility - Moved from different state (%)
Geographical mobility - Moved from abroad (%)
Place of birth - Born in state of residence (%)
Place of birth - Born in other state (%)
Place of birth - Native, outside of US (%)
Place of birth - Foreign born (%)
Housing units in structures - 1, detached (%)
Housing units in structures - 1, attached (%)
Housing units in structures - 2 (%)
Housing units in structures - 3 or 4 (%)
Housing units in structures - 5 to 9 (%)
Housing units in structures - 10 to 19 (%)
Housing units in structures - 20 to 49 (%)
Housing units in structures - 50 or more (%)
Housing units in structures - Mobile home (%)
Housing units in structures - Boat, RV, van, etc. (%)
House/condo owner moved in on average (years ago)
Renter moved in on average (years ago)
Year householder moved into unit - Moved in 1999 to March 2000 (%)
Year householder moved into unit - Moved in 1995 to 1998 (%)
Year householder moved into unit - Moved in 1990 to 1994 (%)
Year householder moved into unit - Moved in 1980 to 1989 (%)
Year householder moved into unit - Moved in 1970 to 1979 (%)
Year householder moved into unit - Moved in 1969 or earlier (%)
Means of transportation to work - Drove car alone (%)
Means of transportation to work - Carpooled (%)
Means of transportation to work - Public transportation (%)
Means of transportation to work - Bus or trolley bus (%)
Means of transportation to work - Streetcar or trolley car (%)
Means of transportation to work - Subway or elevated (%)
Means of transportation to work - Railroad (%)
Means of transportation to work - Ferryboat (%)
Means of transportation to work - Taxicab (%)
Means of transportation to work - Motorcycle (%)
Means of transportation to work - Bicycle (%)
Means of transportation to work - Walked (%)
Means of transportation to work - Other means (%)
Working at home (%)
Industry diversity
Most Common Industries - Agriculture, forestry, fishing and hunting, and mining (%)
Most Common Industries - Agriculture, forestry, fishing and hunting (%)
Most Common Industries - Mining, quarrying, and oil and gas extraction (%)
Most Common Industries - Construction (%)
Most Common Industries - Manufacturing (%)
Most Common Industries - Wholesale trade (%)
Most Common Industries - Retail trade (%)
Most Common Industries - Transportation and warehousing, and utilities (%)
Most Common Industries - Transportation and warehousing (%)
Most Common Industries - Utilities (%)
Most Common Industries - Information (%)
Most Common Industries - Finance and insurance, and real estate and rental and leasing (%)
Most Common Industries - Finance and insurance (%)
Most Common Industries - Real estate and rental and leasing (%)
Most Common Industries - Professional, scientific, and management, and administrative and waste management services (%)
Most Common Industries - Professional, scientific, and technical services (%)
Most Common Industries - Management of companies and enterprises (%)
Most Common Industries - Administrative and support and waste management services (%)
Most Common Industries - Educational services, and health care and social assistance (%)
Most Common Industries - Educational services (%)
Most Common Industries - Health care and social assistance (%)
Most Common Industries - Arts, entertainment, and recreation, and accommodation and food services (%)
Most Common Industries - Arts, entertainment, and recreation (%)
Most Common Industries - Accommodation and food services (%)
Most Common Industries - Other services, except public administration (%)
Most Common Industries - Public administration (%)
Occupation diversity
Most Common Occupations - Management, business, science, and arts occupations (%)
Most Common Occupations - Management, business, and financial occupations (%)
Most Common Occupations - Management occupations (%)
Most Common Occupations - Business and financial operations occupations (%)
Most Common Occupations - Computer, engineering, and science occupations (%)
Most Common Occupations - Computer and mathematical occupations (%)
Most Common Occupations - Architecture and engineering occupations (%)
Most Common Occupations - Life, physical, and social science occupations (%)
Most Common Occupations - Education, legal, community service, arts, and media occupations (%)
Most Common Occupations - Community and social service occupations (%)
Most Common Occupations - Legal occupations (%)
Most Common Occupations - Education, training, and library occupations (%)
Most Common Occupations - Arts, design, entertainment, sports, and media occupations (%)
Most Common Occupations - Healthcare practitioners and technical occupations (%)
Most Common Occupations - Health diagnosing and treating practitioners and other technical occupations (%)
Most Common Occupations - Health technologists and technicians (%)
Most Common Occupations - Service occupations (%)
Most Common Occupations - Healthcare support occupations (%)
Most Common Occupations - Protective service occupations (%)
Most Common Occupations - Fire fighting and prevention, and other protective service workers including supervisors (%)
Most Common Occupations - Law enforcement workers including supervisors (%)
Most Common Occupations - Food preparation and serving related occupations (%)
Most Common Occupations - Building and grounds cleaning and maintenance occupations (%)
Most Common Occupations - Personal care and service occupations (%)
Most Common Occupations - Sales and office occupations (%)
Most Common Occupations - Sales and related occupations (%)
Most Common Occupations - Office and administrative support occupations (%)
Most Common Occupations - Natural resources, construction, and maintenance occupations (%)
Most Common Occupations - Farming, fishing, and forestry occupations (%)
Most Common Occupations - Construction and extraction occupations (%)
Most Common Occupations - Installation, maintenance, and repair occupations (%)
Most Common Occupations - Production, transportation, and material moving occupations (%)
Most Common Occupations - Production occupations (%)
Most Common Occupations - Transportation occupations (%)
Most Common Occupations - Material moving occupations (%)
People in Group quarters - Institutionalized population (%)
People in Group quarters - Correctional institutions (%)
People in Group quarters - Federal prisons and detention centers (%)
People in Group quarters - Halfway houses (%)
People in Group quarters - Local jails and other confinement facilities (including police lockups) (%)
People in Group quarters - Military disciplinary barracks (%)
People in Group quarters - State prisons (%)
People in Group quarters - Other types of correctional institutions (%)
People in Group quarters - Nursing homes (%)
People in Group quarters - Hospitals/wards, hospices, and schools for the handicapped (%)
People in Group quarters - Hospitals/wards and hospices for chronically ill (%)
People in Group quarters - Hospices or homes for chronically ill (%)
People in Group quarters - Military hospitals or wards for chronically ill (%)
People in Group quarters - Other hospitals or wards for chronically ill (%)
People in Group quarters - Hospitals or wards for drug/alcohol abuse (%)
People in Group quarters - Mental (Psychiatric) hospitals or wards (%)
People in Group quarters - Schools, hospitals, or wards for the mentally retarded (%)
People in Group quarters - Schools, hospitals, or wards for the physically handicapped (%)
People in Group quarters - Institutions for the deaf (%)
People in Group quarters - Institutions for the blind (%)
People in Group quarters - Orthopedic wards and institutions for the physically handicapped (%)
People in Group quarters - Wards in general hospitals for patients who have no usual home elsewhere (%)
People in Group quarters - Wards in military hospitals for patients who have no usual home elsewhere (%)
People in Group quarters - Juvenile institutions (%)
People in Group quarters - Long-term care (%)
People in Group quarters - Homes for abused, dependent, and neglected children (%)
People in Group quarters - Residential treatment centers for emotionally disturbed children (%)
People in Group quarters - Training schools for juvenile delinquents (%)
People in Group quarters - Short-term care, detention or diagnostic centers for delinquent children (%)
People in Group quarters - Type of juvenile institution unknown (%)
People in Group quarters - Noninstitutionalized population (%)
People in Group quarters - College dormitories (includes college quarters off campus) (%)
People in Group quarters - Military quarters (%)
People in Group quarters - On base (%)
People in Group quarters - Barracks, unaccompanied personnel housing (UPH), (Enlisted/Officer), ;and similar group living quarters for military personnel (%)
People in Group quarters - Transient quarters for temporary residents (%)
People in Group quarters - Military ships (%)
People in Group quarters - Group homes (%)
People in Group quarters - Homes or halfway houses for drug/alcohol abuse (%)
People in Group quarters - Homes for the mentally ill (%)
People in Group quarters - Homes for the mentally retarded (%)
People in Group quarters - Homes for the physically handicapped (%)
People in Group quarters - Other group homes (%)
People in Group quarters - Religious group quarters (%)
People in Group quarters - Dormitories (%)
People in Group quarters - Agriculture workers' dormitories on farms (%)
People in Group quarters - Job Corps and vocational training facilities (%)
People in Group quarters - Other workers' dormitories (%)
People in Group quarters - Crews of maritime vessels (%)
People in Group quarters - Other nonhousehold living situations (%)
People in Group quarters - Other noninstitutional group quarters (%)
Residents speaking English at home (%)
Residents speaking English at home - Born in the United States (%)
Residents speaking English at home - Native, born elsewhere (%)
Residents speaking English at home - Foreign born (%)
Residents speaking Spanish at home (%)
Residents speaking Spanish at home - Born in the United States (%)
Residents speaking Spanish at home - Native, born elsewhere (%)
Residents speaking Spanish at home - Foreign born (%)
Residents speaking other language at home (%)
Residents speaking other language at home - Born in the United States (%)
Residents speaking other language at home - Native, born elsewhere (%)
Residents speaking other language at home - Foreign born (%)
Class of Workers - Employee of private company (%)
Class of Workers - Self-employed in own incorporated business (%)
Class of Workers - Private not-for-profit wage and salary workers (%)
Class of Workers - Local government workers (%)
Class of Workers - State government workers (%)
Class of Workers - Federal government workers (%)
Class of Workers - Self-employed workers in own not incorporated business and Unpaid family workers (%)
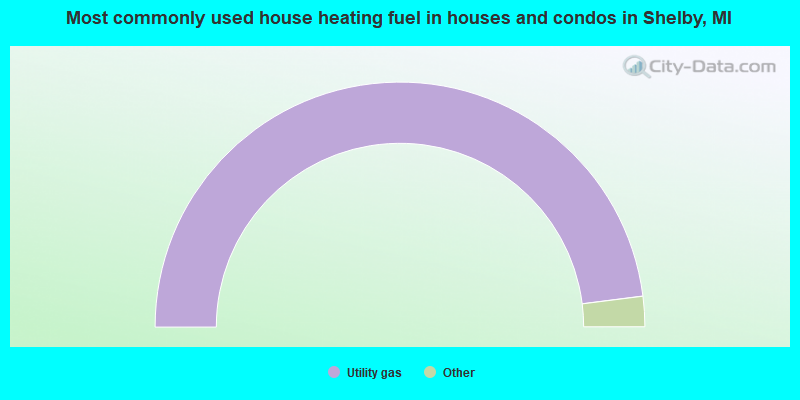
House heating fuel used in houses and condos - Utility gas (%)
House heating fuel used in houses and condos - Bottled, tank, or LP gas (%)
House heating fuel used in houses and condos - Electricity (%)
House heating fuel used in houses and condos - Fuel oil, kerosene, etc. (%)
House heating fuel used in houses and condos - Coal or coke (%)
House heating fuel used in houses and condos - Wood (%)
House heating fuel used in houses and condos - Solar energy (%)
House heating fuel used in houses and condos - Other fuel (%)
House heating fuel used in houses and condos - No fuel used (%)
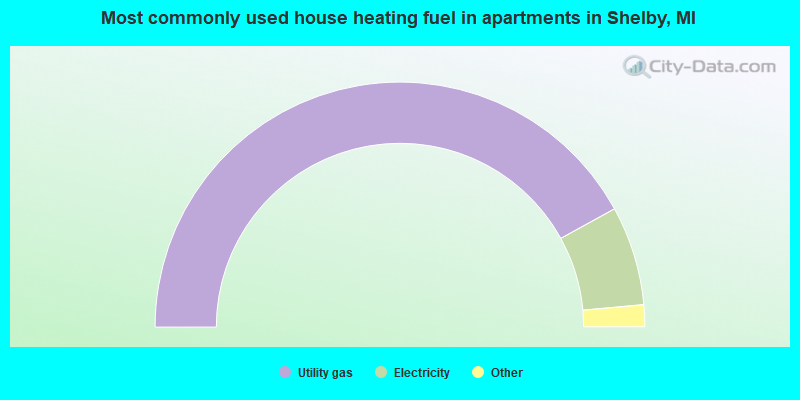
House heating fuel used in apartments - Utility gas (%)
House heating fuel used in apartments - Bottled, tank, or LP gas (%)
House heating fuel used in apartments - Electricity (%)
House heating fuel used in apartments - Fuel oil, kerosene, etc. (%)
House heating fuel used in apartments - Coal or coke (%)
House heating fuel used in apartments - Wood (%)
House heating fuel used in apartments - Solar energy (%)
House heating fuel used in apartments - Other fuel (%)
House heating fuel used in apartments - No fuel used (%)
Armed forces status - In Armed Forces (%)
Armed forces status - Civilian (%)
Armed forces status - Civilian - Veteran (%)
Armed forces status - Civilian - Nonveteran (%)
Fatal accidents locations in years 2005-2021
Fatal accidents locations in 2005
Fatal accidents locations in 2006
Fatal accidents locations in 2007
Fatal accidents locations in 2008
Fatal accidents locations in 2009
Fatal accidents locations in 2010
Fatal accidents locations in 2011
Fatal accidents locations in 2012
Fatal accidents locations in 2013
Fatal accidents locations in 2014
Fatal accidents locations in 2015
Fatal accidents locations in 2016
Fatal accidents locations in 2017
Fatal accidents locations in 2018
Fatal accidents locations in 2019
Fatal accidents locations in 2020
Fatal accidents locations in 2021
Alcohol use - People drinking some alcohol every month (%)
Alcohol use - People not drinking at all (%)
Alcohol use - Average days/month drinking alcohol
Alcohol use - Average drinks/week
Alcohol use - Average days/year people drink much
Audiometry - Average condition of hearing (%)
Audiometry - People that can hear a whisper from across a quiet room (%)
Audiometry - People that can hear normal voice from across a quiet room (%)
Audiometry - Ears ringing, roaring, buzzing (%)
Audiometry - Had a job exposure to loud noise (%)
Audiometry - Had off-work exposure to loud noise (%)
Blood Pressure & Cholesterol - Has high blood pressure (%)
Blood Pressure & Cholesterol - Checking blood pressure at home (%)
Blood Pressure & Cholesterol - Frequently checking blood cholesterol (%)
Blood Pressure & Cholesterol - Has high cholesterol level (%)
Consumer Behavior - Money monthly spent on food at supermarket/grocery store
Consumer Behavior - Money monthly spent on food at other stores
Consumer Behavior - Money monthly spent on eating out
Consumer Behavior - Money monthly spent on carryout/delivered foods
Consumer Behavior - Income spent on food at supermarket/grocery store (%)
Consumer Behavior - Income spent on food at other stores (%)
Consumer Behavior - Income spent on eating out (%)
Consumer Behavior - Income spent on carryout/delivered foods (%)
Current Health Status - General health condition (%)
Current Health Status - Blood donors (%)
Current Health Status - Has blood ever tested for HIV virus (%)
Current Health Status - Left-handed people (%)
Dermatology - People using sunscreen (%)
Diabetes - Diabetics (%)
Diabetes - Had a blood test for high blood sugar (%)
Diabetes - People taking insulin (%)
Diet Behavior & Nutrition - Diet health (%)
Diet Behavior & Nutrition - Milk product consumption (# of products/month)
Diet Behavior & Nutrition - Meals not home prepared (#/week)
Diet Behavior & Nutrition - Meals from fast food or pizza place (#/week)
Diet Behavior & Nutrition - Ready-to-eat foods (#/month)
Diet Behavior & Nutrition - Frozen meals/pizza (#/month)
Drug Use - People that ever used marijuana or hashish (%)
Drug Use - Ever used hard drugs (%)
Drug Use - Ever used any form of cocaine (%)
Drug Use - Ever used heroin (%)
Drug Use - Ever used methamphetamine (%)
Health Insurance - People covered by health insurance (%)
Kidney Conditions-Urology - Avg. # of times urinating at night
Medical Conditions - People with asthma (%)
Medical Conditions - People with anemia (%)
Medical Conditions - People with psoriasis (%)
Medical Conditions - People with overweight (%)
Medical Conditions - Elderly people having difficulties in thinking or remembering (%)
Medical Conditions - People who ever received blood transfusion (%)
Medical Conditions - People having trouble seeing even with glass/contacts (%)
Medical Conditions - People with arthritis (%)
Medical Conditions - People with gout (%)
Medical Conditions - People with congestive heart failure (%)
Medical Conditions - People with coronary heart disease (%)
Medical Conditions - People with angina pectoris (%)
Medical Conditions - People who ever had heart attack (%)
Medical Conditions - People who ever had stroke (%)
Medical Conditions - People with emphysema (%)
Medical Conditions - People with thyroid problem (%)
Medical Conditions - People with chronic bronchitis (%)
Medical Conditions - People with any liver condition (%)
Medical Conditions - People who ever had cancer or malignancy (%)
Mental Health - People who have little interest in doing things (%)
Mental Health - People feeling down, depressed, or hopeless (%)
Mental Health - People who have trouble sleeping or sleeping too much (%)
Mental Health - People feeling tired or having little energy (%)
Mental Health - People with poor appetite or overeating (%)
Mental Health - People feeling bad about themself (%)
Mental Health - People who have trouble concentrating on things (%)
Mental Health - People moving or speaking slowly or too fast (%)
Mental Health - People having thoughts they would be better off dead (%)
Oral Health - Average years since last visit a dentist
Oral Health - People embarrassed because of mouth (%)
Oral Health - People with gum disease (%)
Oral Health - General health of teeth and gums (%)
Oral Health - Average days a week using dental floss/device
Oral Health - Average days a week using mouthwash for dental problem
Oral Health - Average number of teeth
Pesticide Use - Households using pesticides to control insects (%)
Pesticide Use - Households using pesticides to kill weeds (%)
Physical Activity - People doing vigorous-intensity work activities (%)
Physical Activity - People doing moderate-intensity work activities (%)
Physical Activity - People walking or bicycling (%)
Physical Activity - People doing vigorous-intensity recreational activities (%)
Physical Activity - People doing moderate-intensity recreational activities (%)
Physical Activity - Average hours a day doing sedentary activities
Physical Activity - Average hours a day watching TV or videos
Physical Activity - Average hours a day using computer
Physical Functioning - People having limitations keeping them from working (%)
Physical Functioning - People limited in amount of work they can do (%)
Physical Functioning - People that need special equipment to walk (%)
Physical Functioning - People experiencing confusion/memory problems (%)
Physical Functioning - People requiring special healthcare equipment (%)
Prescription Medications - Average number of prescription medicines taking
Preventive Aspirin Use - Adults 40+ taking low-dose aspirin (%)
Reproductive Health - Vaginal deliveries (%)
Reproductive Health - Cesarean deliveries (%)
Reproductive Health - Deliveries resulted in a live birth (%)
Reproductive Health - Pregnancies resulted in a delivery (%)
Reproductive Health - Women breastfeeding newborns (%)
Reproductive Health - Women that had a hysterectomy (%)
Reproductive Health - Women that had both ovaries removed (%)
Reproductive Health - Women that have ever taken birth control pills (%)
Reproductive Health - Women taking birth control pills (%)
Reproductive Health - Women that have ever used Depo-Provera or injectables (%)
Reproductive Health - Women that have ever used female hormones (%)
Sexual Behavior - People 18+ that ever had sex (vaginal, anal, or oral) (%)
Sexual Behavior - Males 18+ that ever had vaginal sex with a woman (%)
Sexual Behavior - Males 18+ that ever performed oral sex on a woman (%)
Sexual Behavior - Males 18+ that ever had anal sex with a woman (%)
Sexual Behavior - Males 18+ that ever had any sex with a man (%)
Sexual Behavior - Females 18+ that ever had vaginal sex with a man (%)
Sexual Behavior - Females 18+ that ever performed oral sex on a man (%)
Sexual Behavior - Females 18+ that ever had anal sex with a man (%)
Sexual Behavior - Females 18+ that ever had any kind of sex with a woman (%)
Sexual Behavior - Average age people first had sex
Sexual Behavior - Average number of female sex partners in lifetime (males 18+)
Sexual Behavior - Average number of female vaginal sex partners in lifetime (males 18+)
Sexual Behavior - Average age people first performed oral sex on a woman (18+)
Sexual Behavior - Average number of woman performed oral sex on in lifetime (18+)
Sexual Behavior - Average number of male sex partners in lifetime (males 18+)
Sexual Behavior - Average number of male anal sex partners in lifetime (males 18+)
Sexual Behavior - Average age people first performed oral sex on a man (18+)
Sexual Behavior - Average number of male oral sex partners in lifetime (18+)
Sexual Behavior - People using protection when performing oral sex (%)
Sexual Behavior - Average number of times people have vaginal or anal sex a year
Sexual Behavior - People having sex without condom (%)
Sexual Behavior - Average number of male sex partners in lifetime (females 18+)
Sexual Behavior - Average number of male vaginal sex partners in lifetime (females 18+)
Sexual Behavior - Average number of female sex partners in lifetime (females 18+)
Sexual Behavior - Circumcised males 18+ (%)
Sleep Disorders - Average hours sleeping at night
Sleep Disorders - People that has trouble sleeping (%)
Smoking-Cigarette Use - People smoking cigarettes (%)
Taste & Smell - People 40+ having problems with smell (%)
Taste & Smell - People 40+ having problems with taste (%)
Taste & Smell - People 40+ that ever had wisdom teeth removed (%)
Taste & Smell - People 40+ that ever had tonsils teeth removed (%)
Taste & Smell - People 40+ that ever had a loss of consciousness because of a head injury (%)
Taste & Smell - People 40+ that ever had a broken nose or other serious injury to face or skull (%)
Taste & Smell - People 40+ that ever had two or more sinus infections (%)
Weight - Average height (inches)
Weight - Average weight (pounds)
Weight - Average BMI
Weight - People that are obese (%)
Weight - People that ever were obese (%)
Weight - People trying to lose weight (%)
According to our research of Michigan and other state lists, there were 107 registered sex offenders living in Shelby, Michigan as of June 16, 2024 . The ratio of all residents to sex offenders in Shelby is 638 to 1.The ratio of registered sex offenders to all residents in this city is lower than the state average.
Officers per 1,000 residents here:
0.89Michigan average:
1.86
Latest news from Shelby, MI collected exclusively by city-data.com from local newspapers, TV, and radio stations
Ancestries: German (24.8%), Polish (19.1%), Italian (14.5%), Irish (11.0%), English (9.4%), French (4.9%).
Current Local Time:
Land area: 34.7 square miles.
Population density: 1,969 people per square mile (low).
6,295 residents are foreign born (5.7% Europe , 2.5% Asia ).
This place:
9.7%Michigan:
5.3%
Median real estate property taxes paid for housing units in 2000: Shelby CDP:
1.3% ($2,311)Michigan:
1.3% ($1,461)
Nearest city with pop. 200,000+: Detroit, MI
Nearest city with pop. 1,000,000+: Chicago, IL
Nearest cities:
Latitude: 42.67 N, Longitude: 83.03 W
Daytime population change due to commuting: -12,687 (-19.5%)Workers who live and work in this place: 5,226 (15.8%)
Unemployment in December 2023:
Most common occupations in Shelby, MI (%)
Both Males Females
Engineers (6.0%)
Other management occupations, except farmers and farm managers (4.9%)
Metal workers and plastic workers (3.9%)
Other sales and related occupations, including supervisors (3.9%)
Other office and administrative support workers, including supervisors (3.6%)
Secretaries and administrative assistants (3.5%)
Other production occupations, including supervisors (3.4%)
Engineers (9.4%)
Other management occupations, except farmers and farm managers (6.4%)
Metal workers and plastic workers (6.1%)
Electrical equipment mechanics and other installation, maintenance, and repair workers, including supervisors (4.6%)
Other production occupations, including supervisors (4.4%)
Other sales and related occupations, including supervisors (4.2%)
Computer specialists (3.7%)
Secretaries and administrative assistants (7.7%)
Other office and administrative support workers, including supervisors (6.1%)
Preschool, kindergarten, elementary, and middle school teachers (4.3%)
Retail sales workers, except cashiers (3.9%)
Registered nurses (3.7%)
Information and record clerks, except customer service representatives (3.6%)
Other sales and related occupations, including supervisors (3.5%)
Tornado activity:
Shelby-area historical tornado activity is slightly above Michigan state average. It is 20% greater than the overall U.S. average.
On 5/8/1964, a category F4 (max. wind speeds 207-260 mph) tornado 10.3 miles away from the Shelby place center killed 11 people and injured 224 people and caused between $500,000 and $5,000,000 in damages.
On 7/4/1957, a category F4 tornado 11.3 miles away from the place center injured 6 people and caused between $50,000 and $500,000 in damages.
Earthquake activity:
Shelby-area historical earthquake activity is significantly above Michigan state average. It is 51% smaller than the overall U.S. average. On 9/25/1998 at 19:52:52, a magnitude 5.2 (4.8 MB, 4.3 MS, 5.2 LG, 4.5 MW, Depth: 3.1 mi, Class: Moderate, Intensity: VI - VII) earthquake occurred 158.1 miles away from Shelby center On 1/31/1986 at 16:46:43, a magnitude 5.0 (5.0 MB) earthquake occurred 121.2 miles away from Shelby center On 7/12/1986 at 08:19:37, a magnitude 4.5 (4.5 MB, Class: Light, Intensity: IV - V) earthquake occurred 163.0 miles away from the city center On 7/27/1980 at 18:52:21, a magnitude 5.2 (5.1 MB, 4.7 MS, 5.0 UK, 5.2 UK) earthquake occurred 312.6 miles away from the city center On 5/2/2015 at 16:23:07, a magnitude 4.2 (4.2 MW, Depth: 2.8 mi) earthquake occurred 125.9 miles away from Shelby center On 8/23/2011 at 17:51:04, a magnitude 5.8 (5.8 MW, Depth: 3.7 mi) earthquake occurred 425.0 miles away from Shelby center Magnitude types: regional Lg-wave magnitude (LG), body-wave magnitude (MB), surface-wave magnitude (MS), moment magnitude (MW) Natural disasters: The number of natural disasters in Macomb County (15) is near the US average (15).Major Disasters (Presidential) Declared: 9Emergencies Declared: 5Storms: 9, Floods: 7, Tornadoes: 3, Winter Storms: 2, Blizzard: 1, Hurricane: 1, Power Outage: 1, Snowstorm: 1, Wind: 1, Other: 1 (Note: some incidents may be assigned to more than one category). Hospitals and medical centers in Shelby: HACKLEY LAKESHORE HOSPITAL (72 S STATE ST) MERCY HEALTH PARTNERS, LAKESHORE CAMPUS (Voluntary non-profit - Other, 72 SOUTH STATE STREET) Other hospitals and medical centers near Shelby: IDEAL HOME HEALTH SERVICES (Home Health Center, about 2 miles away; SHELBY TOWNSHIP, MI)
FMC - SHELBY (Dialysis Facility, about 3 miles away; SHELBY TOWNSHIP, MI)
REGENCY MANOR NURSING AND REHABILITATION CENTER (Nursing Home, about 3 miles away; UTICA, MI)
SHELBY NURSING CENTER (Nursing Home, about 4 miles away; SHELBY TOWNSHIP, MI)
MCLAREN VISITING NURSES AND HOSPICE (Home Health Center, about 4 miles away; ST HEIGHTS, MI)
REGENCY HOMECARE, INC (Home Health Center, about 4 miles away; STERLING HEIGHTS, MI)
ASSOCIATES IN HOME CARE, INC (Home Health Center, about 4 miles away; STERLING HEIGHTS, MI)
Airports located in Shelby: Amtrak stations near Shelby: 12 miles: BIRMINGHAM (449 S. ETON ST.) Services: public payphones, free short-term parking, free long-term parking, call for taxi service, public transit connection.
14 miles: PONTIAC (1600 WIDE TRACK DR.) Services: partially wheelchair accessible, enclosed waiting area, public payphones, vending machines, free short-term parking, free long-term parking, call for taxi service, intercity bus service, public transit connection.
14 miles: ROYAL OAK (201 S. SHERMAN DR.) Services: enclosed waiting area, public payphones, vending machines, paid short-term parking, taxi stand, intercity bus service, public transit connection.
Colleges/universities with over 2000 students nearest to Shelby:
Oakland University (about 10 miles; Rochester Hills, MI ; Full-time enrollment: 16,449)
Baker College of Clinton Township (about 11 miles; Clinton Township, MI ; FT enrollment: 3,413)
Baker College of Auburn Hills (about 12 miles; Auburn Hills, MI ; FT enrollment: 2,284)
Macomb Community College (about 12 miles; Warren, MI ; FT enrollment: 15,669)
Lawrence Technological University (about 18 miles; Southfield, MI ; FT enrollment: 2,430)
University of Detroit Mercy (about 19 miles; Detroit, MI ; FT enrollment: 3,406)
Oakland Community College (about 21 miles; Bloomfield Hills, MI ; FT enrollment: 18,956)
Public high school in Shelby:
Public elementary/middle schools in Shelby:
See full list of schools located in Shelby Library in Shelby: SHELBY AREA DISTRICT LIBRARY Operating income: $290,109; Location: 189 MAPLE STREET; 38,580 books ; 2,423 audio materials ; 2,169 video materials ; 1 local licensed databases ; 95 print serial subscriptions )
User-submitted facts and corrections:
Shelby, Michigan is actually on the west side of the state, north of Muskegon. The map on the web page shows it over by Detroit.
Notable locations in Shelby: (A) , Oceana County Emergency Ambulance Services Station 2 (B) , Shelby Township Hall (C) , Shelby Public Library (D) , Shelby Village Hall (E) , Macomb County District Court House (F) , Shelby Township Fire Department Station 1 Headquarters (G) , Shelby Township Fire Department Station 2 (H) , Shelby Township Fire Department Station 3 (I) , Shelby Township Fire Department Station 4 (J) . Display/hide their locations on the map
Shopping Centers: (1) , Shelby Town Center Shopping Center (2) , Shelby Square Shopping Center (3) . Display/hide their locations on the map
Churches in Shelby include: (A) , Seventh Day Adventist Church (B) , United Methodist Church (C) , Congregational Church (D) , Spanish Pentecostal Church (E) , Saint Kieran Church (F) . Display/hide their locations on the map
Cemeteries: (1) , Prestonville Cemetery (2) , Saint Lawrence Cemetery (3) , Connor-Price Cemetery (4) , Utica Cemetery (5) , Saint John's Cemetery (6) , Ewell and Moore Cemetery (7) . Display/hide their locations on the map
Lake: (A) . Display/hide its location on the map
Streams, rivers, and creeks: (A) , Hawald Drain (B) , Wilcox Drain (C) , Lawson Drain (D) , Shooke Drain (E) , Shoemaker Drain (F) , Caflic Drain (G) , Cannon Drain (H) , Decker Drain (I) . Display/hide their locations on the map
Parks in Shelby include: (1) , Shelby Fractional District Number One Schoolhouse Historical Marker (2) , Utica Cemetery Historical Marker (3) , Utica Nike Base Historical Marker (4) , Spring Hill Farm Historical Marker (5) , Rochester-Utica State Recreation Area (6) . Display/hide their locations on the map
Birthplace of: Paul Griffin (basketball) - Basketball player.
Macomb County has a predicted average indoor radon screening level less than 2 pCi/L (pico curies per liter) - Low Potential Drinking water stations with addresses in Shelby and their reported violations in the past:
SHELBY ROAD BAPTIST CHURCH (Population served: 550, Groundwater):
Past monitoring violations:
2 routine major monitoring violations
2 regular monitoring violations
Population served: 25, Groundwater):
Past health violations:
MCL, Monthly (TCR) - In JUL-2010, Contaminant: Coliform. Follow-up actions: St Public Notif issued (JUL-13-2010), St Public Notif requested (JUL-13-2010), St Violation/Reminder Notice (JUL-13-2010), St Tech Assistance Visit (JUL-13-2010), St Public Notif received (JUL-13-2010), St Compliance achieved (AUG-09-2010)
Past monitoring violations:
3 routine major monitoring violations
One minor monitoring violation
Population served: 25, Groundwater):
Past monitoring violations:
3 routine major monitoring violations
Population served: 25, Groundwater):
Past monitoring violations:
2 routine major monitoring violations
One regular monitoring violation
Drinking water stations with addresses in Shelby that have no violations reported:
OCEANA GOLF CLUB (Population served: 125, Primary Water Source Type: Groundwater)
OCEANA GOLF CLUB (Population served: 125, Primary Water Source Type: Groundwater)
OCEANA GOLF CLUB (Population served: 125, Primary Water Source Type: Groundwater)
PETERSON FARMS #2 CHERRY PLANT (Population served: 100, Primary Water Source Type: Groundwater)
SEVEN ELEVEN CONVIENCE STORE (Population served: 75, Primary Water Source Type: Groundwater)
WOODLAND FARM MARKET (Population served: 50, Primary Water Source Type: Groundwater)
LAKESHORE FARMS INC 64-0014 (Population served: 35, Primary Water Source Type: Groundwater)
Average household size: This place:
2.6 peopleMichigan:
2.6 people
Percentage of family households: This place:
73.2%Whole state:
68.5%
Percentage of households with unmarried partners: This place:
4.2%Whole state:
5.3%
Likely homosexual households (counted as self-reported same-sex unmarried-partner households)
Lesbian couples: 0.2% of all households Gay men: 0.1% of all households
Residents with income below the poverty level in 2009: This place:
3.7%Whole state:
10.5%
Residents with income below 50% of the poverty level in 2009: This place:
1.8%Whole state:
4.8%
People in group quarters in Shelby in 2000:
204 people in nursing homes
29 people in other noninstitutional group quarters
12 people in homes for the mentally retarded
10 people in other group homes
8 people in homes for the mentally ill
6 people in hospitals/wards and hospices for chronically ill
6 people in hospices or homes for chronically ill
Banks with branches in Shelby (2011 data):
The Shelby State Bank: at 242 North Michigan, branch established on 1910/03/02. Info updated 2006/11/03: Bank assets: $206.2 mil, Deposits: $177.4 mil, local headquarters , positive income , Commercial Lending Specialization, 8 total offices , Holding Company: Shelby Financial Corporation
For population 15 years and over in Shelby:
Never married: 24.4%Now married: 61.8%Separated: 0.7%Widowed: 5.2%Divorced: 7.9% For population 25 years and over in Shelby:
High school or higher: 87.4%Bachelor's degree or higher: 26.3%Graduate or professional degree: 9.2%Unemployed: 3.1%Mean travel time to work (commute): 27.4 minutes
Education Gini index (Inequality in education) Here:
10.8Michigan average:
11.3
Religion statistics for Shelby, MI (based on Macomb County data)
Religion Adherents Congregations Catholic 249,439 57 Evangelical Protestant 72,383 188 Mainline Protestant 21,221 65 Orthodox 8,925 6 Other 7,482 28 Black Protestant 2,670 12 None 478,858 -
Source: Clifford Grammich, Kirk Hadaway, Richard Houseal, Dale E.Jones, Alexei Krindatch, Richie Stanley and Richard H.Taylor. 2012. 2010 U.S.Religion Census: Religious Congregations & Membership Study. Association of Statisticians of American Religious Bodies. Jones, Dale E., et al. 2002. Congregations and Membership in the United States 2000. Nashville, TN: Glenmary Research Center. Graphs represent county-level data
Food Environment Statistics: Number of grocery stores : 174This county :
2.10 / 10,000 pop.State :
2.34 / 10,000 pop.
Number of supercenters and club stores : 13Here :
0.16 / 10,000 pop.Michigan :
0.18 / 10,000 pop.
Number of convenience stores (no gas) : 134Here :
1.62 / 10,000 pop.Michigan :
1.52 / 10,000 pop.
Number of convenience stores (with gas) : 189Here :
2.28 / 10,000 pop.Michigan :
2.99 / 10,000 pop.
Number of full-service restaurants : 593This county :
7.15 / 10,000 pop.State :
6.80 / 10,000 pop.
Adult diabetes rate : This county :
8.9%Michigan :
9.7%
Adult obesity rate : Macomb County :
29.4%State :
29.7%
Low-income preschool obesity rate : Macomb County :
13.1%Michigan :
13.4%
4.68% of this county's 2021 resident taxpayers lived in other counties in 2020 ($51,473 average adjusted gross income )
Here:
4.68%Michigan average:
5.83%
0.01% of residents moved from foreign countries ($94 average AGI )Macomb County:
0.01%Michigan average:
0.00%
Top counties from which taxpayers relocated into this county between 2020 and 2021:
5.03% of this county's 2020 resident taxpayers moved to other counties in 2021 ($66,583 average adjusted gross income )
Here:
5.03%Michigan average:
5.95%
0.01% of residents moved to foreign countries ($76 average AGI )Macomb County:
0.01%Michigan average:
0.00%
Top counties to which taxpayers relocated from this county between 2020 and 2021:
Businesses in Shelby, MI
Name Count Name Count
Arby's 1 RadioShack 1 CVS 1 True Value 1
Strongest AM radio stations in Shelby:
WWJ (950 AM; 50 kW; DETROIT, MI; Owner: INFINITY BROADCASTING OPERATIONS, INC.)
WXYT (1270 AM; 50 kW; DETROIT, MI; Owner: INFINITY BROADCASTING CORP. OF DETROIT)
WUFL (1030 AM; daytime; 5 kW; STERLING HEIGHTS, MI; Owner: FAMILY LIFE BROADCASTING SYSTEM)
WJR (760 AM; 50 kW; DETROIT, MI; Owner: ABC, INC.)
WDFN (1130 AM; 50 kW; DETROIT, MI; Owner: AMFM RADIO LICENSES, L.L.C.)
WCHB (1200 AM; 50 kW; TAYLOR, MI; Owner: RADIO ONE OF DETROIT, LLC)
WFDF (910 AM; 50 kW; FLINT, MI; Owner: ABC, INC.)
WOAP (1080 AM; 50 kW; OWOSSO, MI)
WDEO (990 AM; 9 kW; YPSILANTI, MI; Owner: WORD BROADCASTERS, INC.)
WLSP (1530 AM; daytime; 5 kW; LAPEER, MI; Owner: REGENT BROADCASTING OF FLINT INC.)
WKNR (850 AM; 50 kW; CLEVELAND, OH; Owner: CARON BROADCASTING, INC.)
WXDX (1310 AM; 5 kW; DEARBORN, MI; Owner: AMFM RADIO LICENSES, L.L.C.)
WTKA (1050 AM; 10 kW; ANN ARBOR, MI; Owner: CAPSTAR TX LIMITED PARTNERSHIP)
Strongest FM radio stations in Shelby:
WMGC-FM (105.1 FM; DETROIT, MI; Owner: GREATER BOSTON RADIO, INC.)
WCSX (94.7 FM; BIRMINGHAM, MI; Owner: GREATER BOSTON RADIO, INC.)
WKRK-FM (97.1 FM; DETROIT, MI; Owner: INFINITY BROADCASTING OPERATIONS, INC.)
WRIF (101.1 FM; DETROIT, MI; Owner: GREATER BOSTON RADIO, INC.)
WDMK (102.7 FM; MOUNT CLEMENS, MI; Owner: RADIO ONE OF DETROIT, LLC)
WYCD (99.5 FM; DETROIT, MI; Owner: INFINITY BROADCASTING CORPORATION OF MICHIGAN)
WDVD (96.3 FM; DETROIT, MI; Owner: ABC, INC.)
WDTJ (105.9 FM; DETROIT, MI; Owner: RADIO ONE OF DETROIT, LLC)
WDRQ (93.1 FM; DETROIT, MI; Owner: ABC, INC.)
WXOU (88.3 FM; AUBURN HILLS, MI; Owner: OAKLAND UNIVERSITY)
WMXD (92.3 FM; DETROIT, MI; Owner: AMFM RADIO LICENSES, L.L.C.)
WDTW (106.7 FM; DETROIT, MI; Owner: AMFM RADIO LICENSES, L.L.C.)
WNIC (100.3 FM; DEARBORN, MI; Owner: AMFM RADIO LICENSES, L.L.C.)
WKQI (95.5 FM; DETROIT, MI; Owner: AMFM RADIO LICENSES, L.L.C.)
WOMC (104.3 FM; DETROIT, MI; Owner: INFINITY BROADCASTING CORPORATION OF MICHIGAN)
WJLB (97.9 FM; DETROIT, MI; Owner: AMFM RADIO LICENSES, L.L.C.)
WDTR-FM (90.9 FM; DETROIT, MI; Owner: BOARD OF EDUCATION, CITY OF DETROIT)
WDET-FM (101.9 FM; DETROIT, MI; Owner: WAYNE STATE UNIVERSITY)
WVMV (98.7 FM; DETROIT, MI; Owner: INFINITY BROADCASTING OPERATIONS, INC.)
WMUZ (103.5 FM; DETROIT, MI; Owner: WMUZ RADIO, INC.)
TV broadcast stations around Shelby:
WJBK (Channel 2; DETROIT, MI; Owner: FOX TELEVISION STATIONS, INC.)
WXYZ-TV (Channel 7; DETROIT, MI; Owner: CHANNEL 7 OF DETROIT, INC.)
WDIV-TV (Channel 4; DETROIT, MI; Owner: POST-NEWSWEEK STATIONS, MICHIGAN, INC.)
WADL (Channel 38; MOUNT CLEMENS, MI; Owner: ADELL BROADCASTING CORPORATION)
WWJ-TV (Channel 62; DETROIT, MI; Owner: CBS BROADCASTING INC.)
WDWB (Channel 20; DETROIT, MI; Owner: WXON LICENSE, INC.)
WTVS (Channel 56; DETROIT, MI; Owner: DETROIT EDUC. TV FOUNDATION)
WBXD-CA (Channel 5; DETROIT, MI; Owner: THE BOX WORLDWIDE LLC)
WKBD (Channel 50; DETROIT, MI; Owner: VIACOM STATIONS GROUP OF DETROIT INC.)
WFUM (Channel 28; FLINT, MI; Owner: UNIVERSITY OF MICHIGAN)
W48AV (Channel 48; DETROIT, MI; Owner: PAXSON COMMUNICATIONS LICENSE COMPANY, LLC)
WLPC-LP (Channel 26; DETROIT, MI; Owner: GLENN R. AND KARIN A. PLUMMER)
WDWO-CA (Channel 18; DETROIT, MI; Owner: TCT OF MICHIGAN, INC.)
W33BY (Channel 68; DETROIT, MI; Owner: HIGHLAND PARK BROADCASTING, L.P.)
National Bridge Inventory (NBI) Statistics 29 Number of bridges174ft / 53.2m Total length $405,000 Total costs662,870 Total average daily traffic25,933 Total average daily truck traffic
New bridges - historical statistics
2 1950-1959 20 1960-1969 2 1970-1979 1 1980-1989 3 2000-2009 1 2010-2019
See full National Bridge Inventory statistics for Shelby, MI
Home Mortgage Disclosure Act Aggregated Statistics For Year 2009(Based on 14 full tracts) A) FHA, FSA/RHS & VA B) Conventional C) Refinancings D) Home Improvement Loans F) Non-occupant Loans on G) Loans On Manufactured Number Average Value Number Average Value Number Average Value Number Average Value Number Average Value Number Average Value
LOANS ORIGINATED 258 $144,697 291 $168,254 1,307 $183,166 37 $36,000 31 $116,225 10 $18,000 APPLICATIONS APPROVED, NOT ACCEPTED 24 $138,208 18 $191,167 139 $199,475 9 $5,778 4 $99,250 3 $13,667 APPLICATIONS DENIED 71 $155,957 58 $123,896 436 $209,873 45 $37,378 16 $81,436 13 $33,231 APPLICATIONS WITHDRAWN 37 $154,865 34 $173,000 235 $197,902 8 $52,875 8 $137,125 1 $17,000 FILES CLOSED FOR INCOMPLETENESS 9 $189,222 8 $166,000 62 $212,032 0 $0 2 $77,000 0 $0
Aggregated Statistics For Year 2008(Based on 14 full tracts) A) FHA, FSA/RHS & VA B) Conventional C) Refinancings D) Home Improvement Loans E) Loans on Dwellings For 5+ Families F) Non-occupant Loans on G) Loans On Manufactured Number Average Value Number Average Value Number Average Value Number Average Value Number Average Value Number Average Value Number Average Value
LOANS ORIGINATED 182 $157,752 522 $173,658 784 $189,815 63 $42,222 2 $4,584,000 47 $112,127 32 $26,094 APPLICATIONS APPROVED, NOT ACCEPTED 10 $160,200 61 $178,409 138 $207,884 18 $29,556 0 $0 7 $162,857 13 $34,231 APPLICATIONS DENIED 39 $155,460 166 $163,674 465 $213,711 85 $35,070 0 $0 27 $149,110 41 $29,756 APPLICATIONS WITHDRAWN 13 $155,689 58 $195,671 171 $236,204 12 $85,917 1 $8,625,000 7 $170,856 2 $23,500 FILES CLOSED FOR INCOMPLETENESS 2 $171,990 23 $221,826 66 $235,984 0 $0 0 $0 1 $370,000 0 $0
Aggregated Statistics For Year 2007(Based on 14 full tracts) A) FHA, FSA/RHS & VA B) Conventional C) Refinancings D) Home Improvement Loans E) Loans on Dwellings For 5+ Families F) Non-occupant Loans on G) Loans On Manufactured Number Average Value Number Average Value Number Average Value Number Average Value Number Average Value Number Average Value Number Average Value
LOANS ORIGINATED 28 $176,857 933 $160,770 1,288 $182,590 136 $51,845 1 $9,400,000 89 $152,650 34 $25,000 APPLICATIONS APPROVED, NOT ACCEPTED 1 $162,000 111 $188,954 305 $196,167 43 $55,767 0 $0 22 $155,453 14 $43,429 APPLICATIONS DENIED 8 $164,494 316 $207,689 721 $193,638 105 $63,619 0 $0 50 $185,379 76 $35,683 APPLICATIONS WITHDRAWN 5 $204,000 77 $204,856 280 $197,442 14 $121,569 0 $0 16 $206,561 4 $41,000 FILES CLOSED FOR INCOMPLETENESS 1 $169,000 37 $252,919 101 $223,396 8 $21,250 0 $0 6 $277,167 0 $0
Aggregated Statistics For Year 2006(Based on 14 full tracts) A) FHA, FSA/RHS & VA B) Conventional C) Refinancings D) Home Improvement Loans E) Loans on Dwellings For 5+ Families F) Non-occupant Loans on G) Loans On Manufactured Number Average Value Number Average Value Number Average Value Number Average Value Number Average Value Number Average Value Number Average Value
LOANS ORIGINATED 29 $167,413 1,215 $168,959 1,593 $171,902 173 $53,549 3 $1,175,000 91 $168,746 38 $32,289 APPLICATIONS APPROVED, NOT ACCEPTED 6 $186,830 159 $169,402 334 $172,844 33 $61,333 0 $0 20 $161,398 19 $34,263 APPLICATIONS DENIED 9 $137,552 271 $182,461 909 $198,987 119 $74,529 0 $0 52 $162,461 48 $31,750 APPLICATIONS WITHDRAWN 1 $234,000 127 $182,534 426 $210,480 26 $113,191 0 $0 16 $173,750 1 $152,000 FILES CLOSED FOR INCOMPLETENESS 1 $138,000 36 $179,499 175 $228,438 6 $82,665 0 $0 5 $139,200 0 $0
Aggregated Statistics For Year 2005(Based on 14 full tracts) A) FHA, FSA/RHS & VA B) Conventional C) Refinancings D) Home Improvement Loans E) Loans on Dwellings For 5+ Families F) Non-occupant Loans on G) Loans On Manufactured Number Average Value Number Average Value Number Average Value Number Average Value Number Average Value Number Average Value Number Average Value
LOANS ORIGINATED 35 $169,085 1,725 $188,991 2,113 $186,426 149 $75,718 3 $6,046,117 76 $139,459 42 $36,548 APPLICATIONS APPROVED, NOT ACCEPTED 7 $106,851 250 $185,411 292 $192,444 45 $89,422 0 $0 19 $195,893 22 $31,636 APPLICATIONS DENIED 14 $99,000 306 $200,192 881 $205,620 96 $70,999 0 $0 26 $162,036 62 $33,532 APPLICATIONS WITHDRAWN 1 $149,000 160 $204,980 532 $202,467 48 $155,792 1 $189,000 14 $181,355 3 $39,333 FILES CLOSED FOR INCOMPLETENESS 0 $0 58 $169,947 294 $222,928 7 $108,429 0 $0 4 $159,242 0 $0
Aggregated Statistics For Year 2004(Based on 14 full tracts) A) FHA, FSA/RHS & VA B) Conventional C) Refinancings D) Home Improvement Loans F) Non-occupant Loans on G) Loans On Manufactured Number Average Value Number Average Value Number Average Value Number Average Value Number Average Value Number Average Value
LOANS ORIGINATED 71 $156,772 1,524 $196,800 2,589 $189,006 162 $82,055 86 $133,835 32 $34,656 APPLICATIONS APPROVED, NOT ACCEPTED 25 $139,360 215 $186,710 374 $194,873 16 $56,875 21 $139,761 30 $40,233 APPLICATIONS DENIED 23 $149,086 214 $193,279 728 $192,256 79 $50,708 41 $127,388 51 $34,706 APPLICATIONS WITHDRAWN 1 $174,000 122 $212,655 398 $202,481 17 $95,412 10 $131,998 1 $10,000 FILES CLOSED FOR INCOMPLETENESS 4 $141,742 34 $200,497 281 $210,796 7 $71,000 6 $263,163 0 $0
Aggregated Statistics For Year 2003(Based on 14 full tracts) A) FHA, FSA/RHS & VA B) Conventional C) Refinancings D) Home Improvement Loans F) Non-occupant Loans on Number Average Value Number Average Value Number Average Value Number Average Value Number Average Value
LOANS ORIGINATED 65 $147,798 1,229 $190,868 7,371 $169,766 123 $42,642 115 $138,616 APPLICATIONS APPROVED, NOT ACCEPTED 5 $145,398 187 $165,914 824 $167,598 42 $25,214 11 $117,726 APPLICATIONS DENIED 12 $140,581 223 $129,775 948 $171,093 105 $43,647 32 $129,874 APPLICATIONS WITHDRAWN 5 $145,398 100 $202,808 546 $182,704 15 $73,333 15 $132,733 FILES CLOSED FOR INCOMPLETENESS 1 $135,000 18 $199,056 163 $179,778 4 $31,248 5 $284,400
Aggregated Statistics For Year 2002(Based on 9 full tracts) A) FHA, FSA/RHS & VA B) Conventional C) Refinancings D) Home Improvement Loans E) Loans on Dwellings For 5+ Families F) Non-occupant Loans on Number Average Value Number Average Value Number Average Value Number Average Value Number Average Value Number Average Value
LOANS ORIGINATED 82 $142,995 772 $172,591 3,311 $158,811 142 $32,000 2 $1,412,500 65 $145,984 APPLICATIONS APPROVED, NOT ACCEPTED 4 $130,745 82 $147,291 348 $161,543 26 $23,884 0 $0 6 $89,500 APPLICATIONS DENIED 3 $104,663 127 $91,511 405 $141,167 44 $16,409 0 $0 11 $71,726 APPLICATIONS WITHDRAWN 1 $120,000 41 $165,219 283 $167,822 7 $32,429 0 $0 7 $162,571 FILES CLOSED FOR INCOMPLETENESS 3 $142,667 18 $168,884 150 $148,259 4 $31,250 0 $0 1 $104,000
Aggregated Statistics For Year 2001(Based on 9 full tracts) A) FHA, FSA/RHS & VA B) Conventional C) Refinancings D) Home Improvement Loans F) Non-occupant Loans on Number Average Value Number Average Value Number Average Value Number Average Value Number Average Value
LOANS ORIGINATED 98 $139,803 802 $172,992 2,603 $149,879 206 $29,267 43 $117,394 APPLICATIONS APPROVED, NOT ACCEPTED 3 $135,660 99 $137,666 281 $139,988 39 $32,589 13 $101,383 APPLICATIONS DENIED 14 $133,638 152 $82,466 339 $139,087 82 $22,097 14 $85,283 APPLICATIONS WITHDRAWN 9 $128,442 36 $153,304 239 $141,145 11 $42,182 3 $80,667 FILES CLOSED FOR INCOMPLETENESS 4 $147,998 11 $184,182 124 $170,184 3 $17,667 0 $0
Aggregated Statistics For Year 2000(Based on 9 full tracts) A) FHA, FSA/RHS & VA B) Conventional C) Refinancings D) Home Improvement Loans E) Loans on Dwellings For 5+ Families F) Non-occupant Loans on Number Average Value Number Average Value Number Average Value Number Average Value Number Average Value Number Average Value
LOANS ORIGINATED 78 $134,370 792 $165,331 525 $120,689 231 $24,727 0 $0 25 $97,478 APPLICATIONS APPROVED, NOT ACCEPTED 10 $94,796 97 $115,834 96 $105,322 73 $24,164 0 $0 6 $71,500 APPLICATIONS DENIED 15 $112,866 207 $73,448 190 $105,088 80 $32,875 1 $182,000 14 $76,500 APPLICATIONS WITHDRAWN 7 $127,426 48 $187,206 115 $97,634 44 $83,726 0 $0 2 $50,000 FILES CLOSED FOR INCOMPLETENESS 2 $130,000 14 $164,641 53 $132,301 2 $45,000 0 $0 0 $0
Aggregated Statistics For Year 1999(Based on 10 full and 1 partial tracts) A) FHA, FSA/RHS & VA B) Conventional C) Refinancings D) Home Improvement Loans F) Non-occupant Loans on Number Average Value Number Average Value Number Average Value Number Average Value Number Average Value
LOANS ORIGINATED 125 $129,286 1,532 $152,334 1,553 $133,160 289 $26,578 55 $98,685 APPLICATIONS APPROVED, NOT ACCEPTED 4 $99,075 221 $87,149 242 $101,032 83 $21,726 14 $38,616 APPLICATIONS DENIED 11 $119,458 342 $69,378 295 $125,096 99 $34,828 14 $93,386 APPLICATIONS WITHDRAWN 6 $129,727 76 $138,620 227 $123,752 28 $89,612 7 $59,034 FILES CLOSED FOR INCOMPLETENESS 2 $131,335 25 $123,203 82 $149,036 1 $135,510 4 $83,368
Detailed mortgage data for all 14 tracts in Shelby, MI
Private Mortgage Insurance Companies Aggregated Statistics For Year 2009(Based on 13 full tracts) A) Conventional B) Refinancings Number Average Value Number Average Value
LOANS ORIGINATED 45 $202,400 27 $229,146 APPLICATIONS APPROVED, NOT ACCEPTED 19 $290,316 20 $227,400 APPLICATIONS DENIED 10 $163,000 12 $221,999 APPLICATIONS WITHDRAWN 3 $218,000 2 $220,000 FILES CLOSED FOR INCOMPLETENESS 5 $262,200 1 $257,000
Aggregated Statistics For Year 2008(Based on 14 full tracts) A) Conventional B) Refinancings C) Non-occupant Loans on Number Average Value Number Average Value Number Average Value
LOANS ORIGINATED 175 $185,359 60 $230,450 7 $124,569 APPLICATIONS APPROVED, NOT ACCEPTED 72 $196,027 49 $246,673 9 $149,222 APPLICATIONS DENIED 27 $244,110 3 $185,000 4 $160,245 APPLICATIONS WITHDRAWN 13 $223,846 5 $276,600 0 $0 FILES CLOSED FOR INCOMPLETENESS 5 $214,794 3 $301,667 3 $252,990
Aggregated Statistics For Year 2007(Based on 14 full tracts) A) Conventional B) Refinancings C) Non-occupant Loans on Number Average Value Number Average Value Number Average Value
LOANS ORIGINATED 222 $181,270 110 $242,245 10 $177,399 APPLICATIONS APPROVED, NOT ACCEPTED 37 $198,594 26 $271,962 3 $143,663 APPLICATIONS DENIED 6 $165,665 2 $329,000 0 $0 APPLICATIONS WITHDRAWN 11 $216,182 10 $207,699 0 $0 FILES CLOSED FOR INCOMPLETENESS 2 $207,500 1 $203,000 0 $0
Aggregated Statistics For Year 2006(Based on 14 full tracts) A) Conventional B) Refinancings C) Non-occupant Loans on Number Average Value Number Average Value Number Average Value
LOANS ORIGINATED 120 $185,416 70 $234,727 2 $110,995 APPLICATIONS APPROVED, NOT ACCEPTED 27 $213,554 20 $219,550 0 $0 APPLICATIONS DENIED 1 $134,000 2 $440,000 0 $0 APPLICATIONS WITHDRAWN 5 $205,400 5 $287,600 0 $0 FILES CLOSED FOR INCOMPLETENESS 2 $223,500 0 $0 0 $0
Aggregated Statistics For Year 2005(Based on 14 full tracts) A) Conventional B) Refinancings C) Non-occupant Loans on Number Average Value Number Average Value Number Average Value
LOANS ORIGINATED 163 $210,864 92 $229,868 7 $163,284 APPLICATIONS APPROVED, NOT ACCEPTED 37 $238,594 26 $221,420 2 $187,995 APPLICATIONS DENIED 4 $276,250 1 $440,000 0 $0 APPLICATIONS WITHDRAWN 3 $185,667 7 $246,857 0 $0 FILES CLOSED FOR INCOMPLETENESS 1 $317,000 1 $405,000 0 $0
Aggregated Statistics For Year 2004(Based on 14 full tracts) A) Conventional B) Refinancings C) Non-occupant Loans on Number Average Value Number Average Value Number Average Value
LOANS ORIGINATED 175 $200,147 84 $183,938 14 $143,142 APPLICATIONS APPROVED, NOT ACCEPTED 44 $203,680 44 $181,908 2 $111,500 APPLICATIONS DENIED 2 $230,500 4 $381,250 1 $143,000 APPLICATIONS WITHDRAWN 11 $260,818 8 $172,625 1 $60,000 FILES CLOSED FOR INCOMPLETENESS 2 $238,000 1 $221,000 0 $0
Aggregated Statistics For Year 2003(Based on 14 full tracts) A) Conventional B) Refinancings C) Non-occupant Loans on Number Average Value Number Average Value Number Average Value
LOANS ORIGINATED 234 $189,054 305 $180,762 11 $143,815 APPLICATIONS APPROVED, NOT ACCEPTED 41 $196,803 77 $183,180 5 $158,200 APPLICATIONS DENIED 4 $224,738 7 $187,571 0 $0 APPLICATIONS WITHDRAWN 11 $204,909 21 $195,047 1 $66,000 FILES CLOSED FOR INCOMPLETENESS 1 $132,000 2 $177,990 0 $0
Aggregated Statistics For Year 2002(Based on 9 full tracts) A) Conventional B) Refinancings C) Non-occupant Loans on Number Average Value Number Average Value Number Average Value
LOANS ORIGINATED 206 $173,158 190 $164,382 4 $126,500 APPLICATIONS APPROVED, NOT ACCEPTED 27 $219,924 40 $175,948 1 $125,990 APPLICATIONS DENIED 2 $128,500 7 $175,854 2 $185,500 APPLICATIONS WITHDRAWN 9 $190,220 15 $186,665 0 $0 FILES CLOSED FOR INCOMPLETENESS 0 $0 3 $157,667 0 $0
Aggregated Statistics For Year 2001(Based on 9 full tracts) A) Conventional B) Refinancings C) Non-occupant Loans on Number Average Value Number Average Value Number Average Value
LOANS ORIGINATED 182 $166,059 219 $157,880 4 $134,245 APPLICATIONS APPROVED, NOT ACCEPTED 30 $155,999 43 $157,928 1 $94,000 APPLICATIONS DENIED 14 $168,500 4 $156,000 4 $133,000 APPLICATIONS WITHDRAWN 4 $199,500 9 $165,667 0 $0 FILES CLOSED FOR INCOMPLETENESS 0 $0 0 $0 0 $0
Aggregated Statistics For Year 2000(Based on 9 full tracts) A) Conventional B) Refinancings C) Non-occupant Loans on Number Average Value Number Average Value Number Average Value
LOANS ORIGINATED 171 $162,168 36 $152,221 3 $128,667 APPLICATIONS APPROVED, NOT ACCEPTED 24 $174,124 12 $137,998 1 $80,000 APPLICATIONS DENIED 5 $118,794 2 $147,495 0 $0 APPLICATIONS WITHDRAWN 8 $177,624 1 $99,990 0 $0 FILES CLOSED FOR INCOMPLETENESS 0 $0 1 $125,000 0 $0
Aggregated Statistics For Year 1999(Based on 10 full and 1 partial tracts) A) Conventional B) Refinancings C) Non-occupant Loans on Number Average Value Number Average Value Number Average Value
LOANS ORIGINATED 308 $154,023 100 $152,457 15 $91,697 APPLICATIONS APPROVED, NOT ACCEPTED 26 $174,252 24 $163,552 0 $0 APPLICATIONS DENIED 4 $196,982 8 $161,192 0 $0 APPLICATIONS WITHDRAWN 3 $180,790 2 $117,875 0 $0 FILES CLOSED FOR INCOMPLETENESS 2 $127,290 0 $0 0 $0
Shelby compared to Michigan state average:
Unemployed percentage significantly below state average. Black race population percentage significantly below state average. Hispanic race population percentage significantly below state average. Median age below state average. Renting percentage significantly below state average. Length of stay since moving in significantly above state average. Number of rooms per house significantly below state average. House age significantly below state average. Institutionalized population percentage significantly above state average.
#1 on the list of "Top 101 cities with largest percentage of females in industries: plastics and rubber products (population 50,000+)"
#1 on the list of "Top 101 cities with largest percentage of males in occupations: metal workers and plastic workers (population 50,000+)"
#1 on the list of "Top 101 cities with largest percentage of males in industries: machinery (population 50,000+)"
#1 on the list of "Top 101 cities with largest percentage of females in industries: music stores (population 50,000+)"
#1 on the list of "Top 101 cities with largest percentage of females in industries: transportation equipment (population 50,000+)"
#1 on the list of "Top 101 cities with largest percentage of females in industries: sewing, needlework, and piece goods stores (population 50,000+)"
#2 on the list of "Top 101 cities with largest percentage of females in occupations: metal workers and plastic workers (population 50,000+)"
#2 on the list of "Top 101 cities with the smallest percentage of likely homosexual households (counted as self-reported same-sex unmarried-partner households) (population 50,000+)"
#2 on the list of "Top 101 cities with largest percentage of males in occupations: occupational and physical therapist assistants and aides (population 50,000+)"
#2 on the list of "Top 101 cities with largest percentage of females in industries: machinery (population 50,000+)"
#2 on the list of "Top 101 cities with largest percentage of males in occupations: assemblers and fabricators (population 50,000+)"
#2 on the list of "Top 101 cities with largest percentage of males in industries: transportation equipment (population 50,000+)"
#3 on the list of "Top 101 cities with largest percentage of males in industries: metal and metal products (population 50,000+)"
#3 on the list of "Top 101 cities with largest percentage of females in occupations: engineers (population 50,000+)"
#3 on the list of "Top 101 cities with largest percentage of males in occupations: engineers (population 50,000+)"
#3 on the list of "Top 101 cities with largest percentage of females in industries: office supplies and stationery stores (population 50,000+)"
#4 on the list of "Top 101 cities with largest percentage of females in industries: lumber and other construction materials merchant wholesalers (population 50,000+)"
#4 on the list of "Top 101 cities with largest percentage of females in industries: vending machine operators (population 50,000+)"
#5 on the list of "Top 101 cities with largest percentage of females in industries: book stores and news dealers (population 50,000+)"
#5 on the list of "Top 101 cities with largest percentage of males in occupations: art and design workers (population 50,000+)"
#8 on the list of "Top 101 counties with the largest increase in the number of infant deaths per 1000 residents 2000-2006 to 2007-2013 (pop. 50,000+)"
#23 on the list of "Top 101 counties with the highest percentage of residents that visited a dentist within the past year"
#28 on the list of "Top 101 counties with the most Orthodox adherents"
#46 on the list of "Top 101 counties with the most Catholic congregations"
#50 on the list of "Top 101 counties with the highest percentage of residents that smoked 100+ cigarettes in their lives"
Top Patent Applicants
Lorin A. Mazur (7)
David Michael Mitteer (4)
Ameil A. Kapadia (3)
David K. Platner (2)
Jeffrey W. Johnston (1)
David M. Mitteer (1)
James I. Holcomb, Jr. (1)
Warren Winslow Walborn (1)
Craig Fester (1)
Hawken Energy, Inc. (1)
Total of 28 patent applications in 2008-2024.

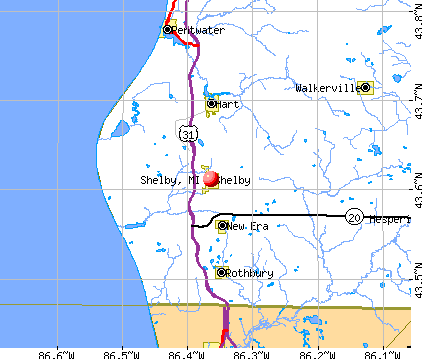


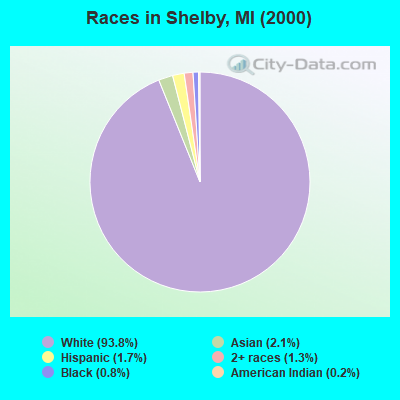
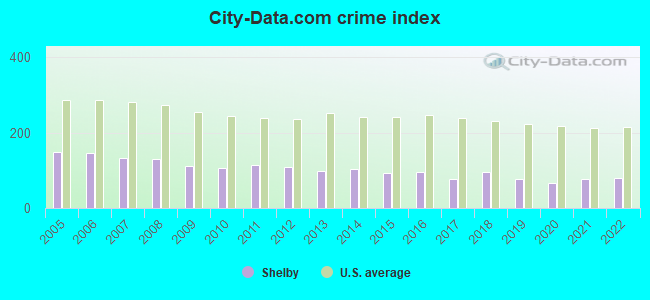
 Recent articles from our blog. Our writers, many of them Ph.D. graduates or candidates, create easy-to-read articles on a wide variety of topics.

 (19.9 miles
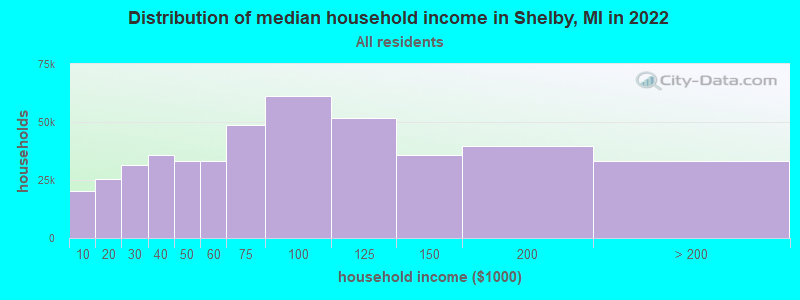

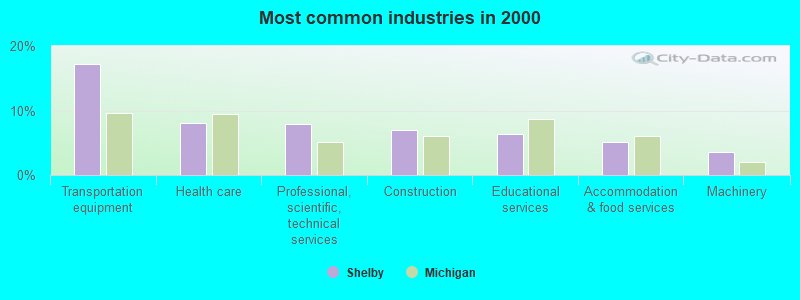
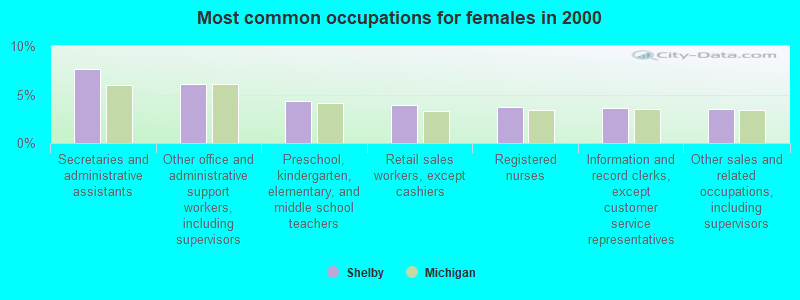


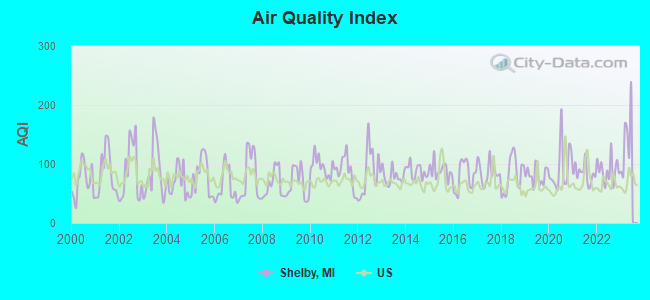
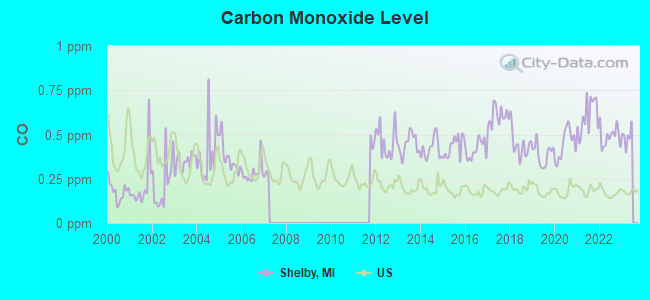
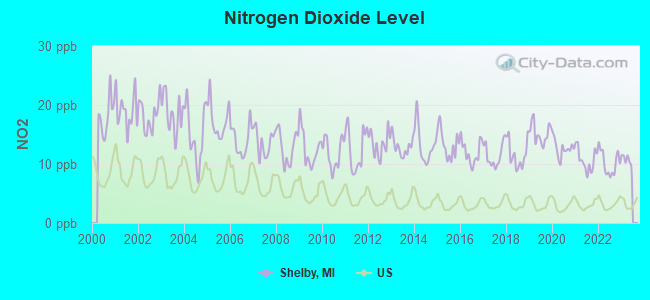
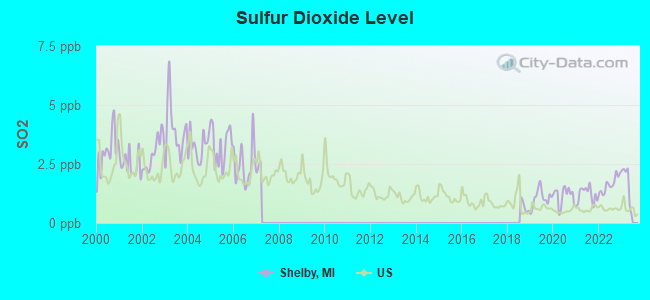
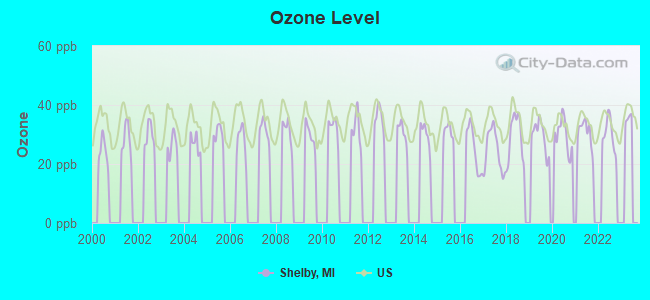
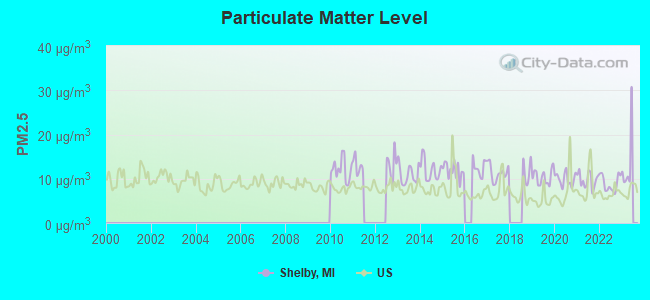
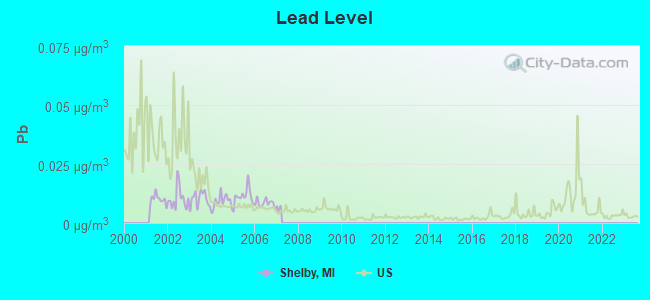

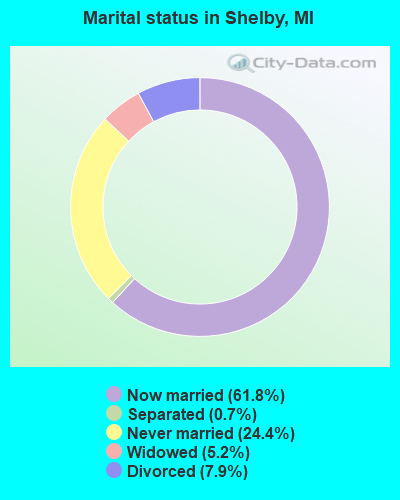
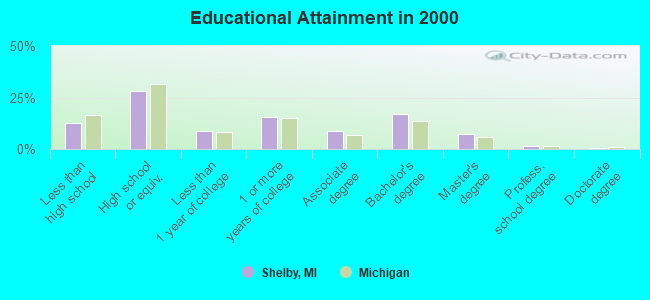
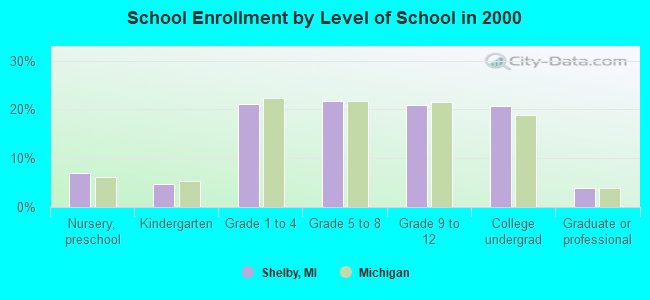
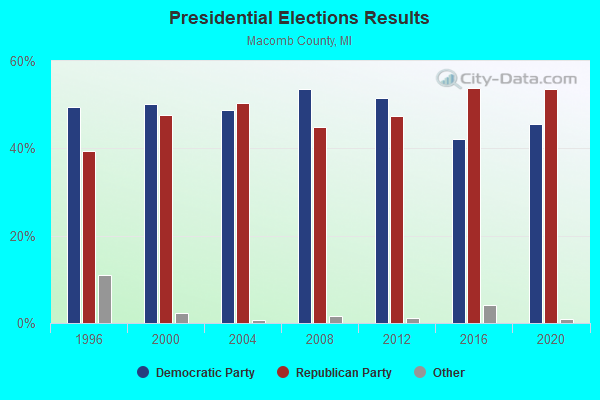
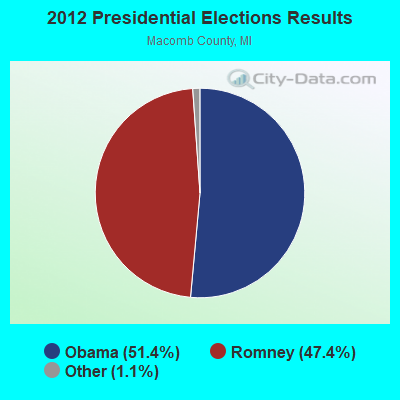
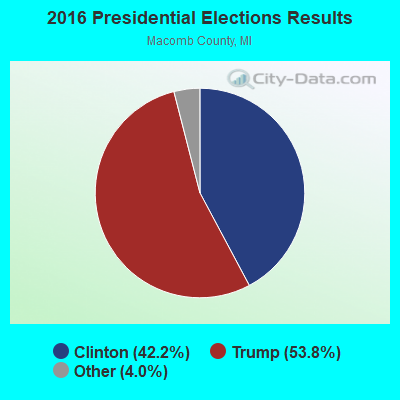
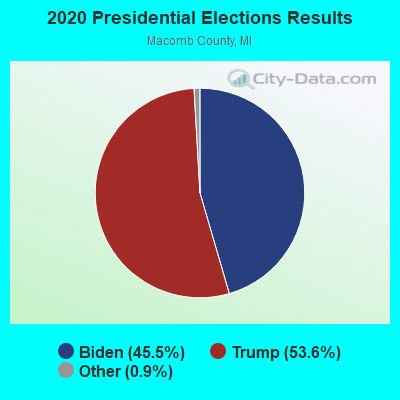
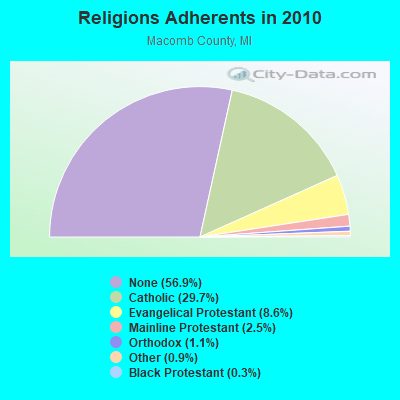
 Based on the data from the years 2002 - 2018 the average number of fire incidents per year is 29. The highest number of fires - 51 took place in 2012, and the least - 7 in 2008. The data has a rising trend.
 When looking into fire subcategories, the most reports belonged to: Structure Fires (46.5%), and Outside Fires (30.3%).