Shepherdsville, Kentucky Submit your own pictures of this city and show them to the world
OSM Map
General Map
Google Map
MSN Map
OSM Map
General Map
Google Map
MSN Map
OSM Map
General Map
Google Map
MSN Map
OSM Map
General Map
Google Map
MSN Map
Please wait while loading the map...
Population in 2022: 14,486 (97% urban, 3% rural). Population change since 2000: +73.8%Males: 6,893 Females: 7,593
March 2022 cost of living index in Shepherdsville: 86.9 (less than average, U.S. average is 100) Percentage of residents living in poverty in 2022: 24.4%for White Non-Hispanic residents , 35.4% for Black residents , 11.3% for Hispanic or Latino residents , 20.6% for other race residents , 59.3% for two or more races residents )
Profiles of local businesses
Business Search - 14 Million verified businesses
Data:
Median household income ($)
Median household income (% change since 2000)
Household income diversity
Ratio of average income to average house value (%)
Ratio of average income to average rent
Median household income ($) - White
Median household income ($) - Black or African American
Median household income ($) - Asian
Median household income ($) - Hispanic or Latino
Median household income ($) - American Indian and Alaska Native
Median household income ($) - Multirace
Median household income ($) - Other Race
Median household income for houses/condos with a mortgage ($)
Median household income for apartments without a mortgage ($)
Races - White alone (%)
Races - White alone (% change since 2000)
Races - Black alone (%)
Races - Black alone (% change since 2000)
Races - American Indian alone (%)
Races - American Indian alone (% change since 2000)
Races - Asian alone (%)
Races - Asian alone (% change since 2000)
Races - Hispanic (%)
Races - Hispanic (% change since 2000)
Races - Native Hawaiian and Other Pacific Islander alone (%)
Races - Native Hawaiian and Other Pacific Islander alone (% change since 2000)
Races - Two or more races (%)
Races - Two or more races (% change since 2000)
Races - Other race alone (%)
Races - Other race alone (% change since 2000)
Racial diversity
Unemployment (%)
Unemployment (% change since 2000)
Unemployment (%) - White
Unemployment (%) - Black or African American
Unemployment (%) - Asian
Unemployment (%) - Hispanic or Latino
Unemployment (%) - American Indian and Alaska Native
Unemployment (%) - Multirace
Unemployment (%) - Other Race
Population density (people per square mile)
Population - Males (%)
Population - Females (%)
Population - Males (%) - White
Population - Males (%) - Black or African American
Population - Males (%) - Asian
Population - Males (%) - Hispanic or Latino
Population - Males (%) - American Indian and Alaska Native
Population - Males (%) - Multirace
Population - Males (%) - Other Race
Population - Females (%) - White
Population - Females (%) - Black or African American
Population - Females (%) - Asian
Population - Females (%) - Hispanic or Latino
Population - Females (%) - American Indian and Alaska Native
Population - Females (%) - Multirace
Population - Females (%) - Other Race
Coronavirus confirmed cases (Jun 16, 2024)
Deaths caused by coronavirus (Jun 16, 2024)
Coronavirus confirmed cases (per 100k population) (Jun 16, 2024)
Deaths caused by coronavirus (per 100k population) (Jun 16, 2024)
Daily increase in number of cases (Jun 16, 2024)
Weekly increase in number of cases (Jun 16, 2024)
Cases doubled (in days) (Jun 16, 2024)
Hospitalized patients (Apr 18, 2022)
Negative test results (Apr 18, 2022)
Total test results (Apr 18, 2022)
COVID Vaccine doses distributed (per 100k population) (Sep 19, 2023)
COVID Vaccine doses administered (per 100k population) (Sep 19, 2023)
COVID Vaccine doses distributed (Sep 19, 2023)
COVID Vaccine doses administered (Sep 19, 2023)
Likely homosexual households (%)
Likely homosexual households (% change since 2000)
Likely homosexual households - Lesbian couples (%)
Likely homosexual households - Lesbian couples (% change since 2000)
Likely homosexual households - Gay men (%)
Likely homosexual households - Gay men (% change since 2000)
Cost of living index
Median gross rent ($)
Median contract rent ($)
Median monthly housing costs ($)
Median house or condo value ($)
Median house or condo value ($ change since 2000)
Mean house or condo value by units in structure - 1, detached ($)
Mean house or condo value by units in structure - 1, attached ($)
Mean house or condo value by units in structure - 2 ($)
Mean house or condo value by units in structure by units in structure - 3 or 4 ($)
Mean house or condo value by units in structure - 5 or more ($)
Mean house or condo value by units in structure - Boat, RV, van, etc. ($)
Mean house or condo value by units in structure - Mobile home ($)
Median house or condo value ($) - White
Median house or condo value ($) - Black or African American
Median house or condo value ($) - Asian
Median house or condo value ($) - Hispanic or Latino
Median house or condo value ($) - American Indian and Alaska Native
Median house or condo value ($) - Multirace
Median house or condo value ($) - Other Race
Median resident age
Resident age diversity
Median resident age - Males
Median resident age - Females
Median resident age - White
Median resident age - Black or African American
Median resident age - Asian
Median resident age - Hispanic or Latino
Median resident age - American Indian and Alaska Native
Median resident age - Multirace
Median resident age - Other Race
Median resident age - Males - White
Median resident age - Males - Black or African American
Median resident age - Males - Asian
Median resident age - Males - Hispanic or Latino
Median resident age - Males - American Indian and Alaska Native
Median resident age - Males - Multirace
Median resident age - Males - Other Race
Median resident age - Females - White
Median resident age - Females - Black or African American
Median resident age - Females - Asian
Median resident age - Females - Hispanic or Latino
Median resident age - Females - American Indian and Alaska Native
Median resident age - Females - Multirace
Median resident age - Females - Other Race
Commute - mean travel time to work (minutes)
Travel time to work - Less than 5 minutes (%)
Travel time to work - Less than 5 minutes (% change since 2000)
Travel time to work - 5 to 9 minutes (%)
Travel time to work - 5 to 9 minutes (% change since 2000)
Travel time to work - 10 to 19 minutes (%)
Travel time to work - 10 to 19 minutes (% change since 2000)
Travel time to work - 20 to 29 minutes (%)
Travel time to work - 20 to 29 minutes (% change since 2000)
Travel time to work - 30 to 39 minutes (%)
Travel time to work - 30 to 39 minutes (% change since 2000)
Travel time to work - 40 to 59 minutes (%)
Travel time to work - 40 to 59 minutes (% change since 2000)
Travel time to work - 60 to 89 minutes (%)
Travel time to work - 60 to 89 minutes (% change since 2000)
Travel time to work - 90 or more minutes (%)
Travel time to work - 90 or more minutes (% change since 2000)
Marital status - Never married (%)
Marital status - Now married (%)
Marital status - Separated (%)
Marital status - Widowed (%)
Marital status - Divorced (%)
Median family income ($)
Median family income (% change since 2000)
Median non-family income ($)
Median non-family income (% change since 2000)
Median per capita income ($)
Median per capita income (% change since 2000)
Median family income ($) - White
Median family income ($) - Black or African American
Median family income ($) - Asian
Median family income ($) - Hispanic or Latino
Median family income ($) - American Indian and Alaska Native
Median family income ($) - Multirace
Median family income ($) - Other Race
Median year house/condo built
Median year apartment built
Year house built - Built 2005 or later (%)
Year house built - Built 2000 to 2004 (%)
Year house built - Built 1990 to 1999 (%)
Year house built - Built 1980 to 1989 (%)
Year house built - Built 1970 to 1979 (%)
Year house built - Built 1960 to 1969 (%)
Year house built - Built 1950 to 1959 (%)
Year house built - Built 1940 to 1949 (%)
Year house built - Built 1939 or earlier (%)
Average household size
Household density (households per square mile)
Average household size - White
Average household size - Black or African American
Average household size - Asian
Average household size - Hispanic or Latino
Average household size - American Indian and Alaska Native
Average household size - Multirace
Average household size - Other Race
Occupied housing units (%)
Vacant housing units (%)
Owner occupied housing units (%)
Renter occupied housing units (%)
Vacancy status - For rent (%)
Vacancy status - For sale only (%)
Vacancy status - Rented or sold, not occupied (%)
Vacancy status - For seasonal, recreational, or occasional use (%)
Vacancy status - For migrant workers (%)
Vacancy status - Other vacant (%)
Residents with income below the poverty level (%)
Residents with income below 50% of the poverty level (%)
Children below poverty level (%)
Poor families by family type - Married-couple family (%)
Poor families by family type - Male, no wife present (%)
Poor families by family type - Female, no husband present (%)
Poverty status for native-born residents (%)
Poverty status for foreign-born residents (%)
Poverty among high school graduates not in families (%)
Poverty among people who did not graduate high school not in families (%)
Residents with income below the poverty level (%) - White
Residents with income below the poverty level (%) - Black or African American
Residents with income below the poverty level (%) - Asian
Residents with income below the poverty level (%) - Hispanic or Latino
Residents with income below the poverty level (%) - American Indian and Alaska Native
Residents with income below the poverty level (%) - Multirace
Residents with income below the poverty level (%) - Other Race
Air pollution - Air Quality Index (AQI)
Air pollution - CO
Air pollution - NO2
Air pollution - SO2
Air pollution - Ozone
Air pollution - PM10
Air pollution - PM25
Air pollution - Pb
Crime - Murders per 100,000 population
Crime - Rapes per 100,000 population
Crime - Robberies per 100,000 population
Crime - Assaults per 100,000 population
Crime - Burglaries per 100,000 population
Crime - Thefts per 100,000 population
Crime - Auto thefts per 100,000 population
Crime - Arson per 100,000 population
Crime - City-data.com crime index
Crime - Violent crime index
Crime - Property crime index
Crime - Murders per 100,000 population (5 year average)
Crime - Rapes per 100,000 population (5 year average)
Crime - Robberies per 100,000 population (5 year average)
Crime - Assaults per 100,000 population (5 year average)
Crime - Burglaries per 100,000 population (5 year average)
Crime - Thefts per 100,000 population (5 year average)
Crime - Auto thefts per 100,000 population (5 year average)
Crime - Arson per 100,000 population (5 year average)
Crime - City-data.com crime index (5 year average)
Crime - Violent crime index (5 year average)
Crime - Property crime index (5 year average)
1996 Presidential Elections Results (%) - Democratic Party (Clinton)
1996 Presidential Elections Results (%) - Republican Party (Dole)
1996 Presidential Elections Results (%) - Other
2000 Presidential Elections Results (%) - Democratic Party (Gore)
2000 Presidential Elections Results (%) - Republican Party (Bush)
2000 Presidential Elections Results (%) - Other
2004 Presidential Elections Results (%) - Democratic Party (Kerry)
2004 Presidential Elections Results (%) - Republican Party (Bush)
2004 Presidential Elections Results (%) - Other
2008 Presidential Elections Results (%) - Democratic Party (Obama)
2008 Presidential Elections Results (%) - Republican Party (McCain)
2008 Presidential Elections Results (%) - Other
2012 Presidential Elections Results (%) - Democratic Party (Obama)
2012 Presidential Elections Results (%) - Republican Party (Romney)
2012 Presidential Elections Results (%) - Other
2016 Presidential Elections Results (%) - Democratic Party (Clinton)
2016 Presidential Elections Results (%) - Republican Party (Trump)
2016 Presidential Elections Results (%) - Other
2020 Presidential Elections Results (%) - Democratic Party (Biden)
2020 Presidential Elections Results (%) - Republican Party (Trump)
2020 Presidential Elections Results (%) - Other
Ancestries Reported - Arab (%)
Ancestries Reported - Czech (%)
Ancestries Reported - Danish (%)
Ancestries Reported - Dutch (%)
Ancestries Reported - English (%)
Ancestries Reported - French (%)
Ancestries Reported - French Canadian (%)
Ancestries Reported - German (%)
Ancestries Reported - Greek (%)
Ancestries Reported - Hungarian (%)
Ancestries Reported - Irish (%)
Ancestries Reported - Italian (%)
Ancestries Reported - Lithuanian (%)
Ancestries Reported - Norwegian (%)
Ancestries Reported - Polish (%)
Ancestries Reported - Portuguese (%)
Ancestries Reported - Russian (%)
Ancestries Reported - Scotch-Irish (%)
Ancestries Reported - Scottish (%)
Ancestries Reported - Slovak (%)
Ancestries Reported - Subsaharan African (%)
Ancestries Reported - Swedish (%)
Ancestries Reported - Swiss (%)
Ancestries Reported - Ukrainian (%)
Ancestries Reported - United States (%)
Ancestries Reported - Welsh (%)
Ancestries Reported - West Indian (%)
Ancestries Reported - Other (%)
Educational Attainment - No schooling completed (%)
Educational Attainment - Less than high school (%)
Educational Attainment - High school or equivalent (%)
Educational Attainment - Less than 1 year of college (%)
Educational Attainment - 1 or more years of college (%)
Educational Attainment - Associate degree (%)
Educational Attainment - Bachelor's degree (%)
Educational Attainment - Master's degree (%)
Educational Attainment - Professional school degree (%)
Educational Attainment - Doctorate degree (%)
School Enrollment - Nursery, preschool (%)
School Enrollment - Kindergarten (%)
School Enrollment - Grade 1 to 4 (%)
School Enrollment - Grade 5 to 8 (%)
School Enrollment - Grade 9 to 12 (%)
School Enrollment - College undergrad (%)
School Enrollment - Graduate or professional (%)
School Enrollment - Not enrolled in school (%)
School enrollment - Public schools (%)
School enrollment - Private schools (%)
School enrollment - Not enrolled (%)
Median number of rooms in houses and condos
Median number of rooms in apartments
Housing units lacking complete plumbing facilities (%)
Housing units lacking complete kitchen facilities (%)
Density of houses
Urban houses (%)
Rural houses (%)
Households with people 60 years and over (%)
Households with people 65 years and over (%)
Households with people 75 years and over (%)
Households with one or more nonrelatives (%)
Households with no nonrelatives (%)
Population in households (%)
Family households (%)
Nonfamily households (%)
Population in families (%)
Family households with own children (%)
Median number of bedrooms in owner occupied houses
Mean number of bedrooms in owner occupied houses
Median number of bedrooms in renter occupied houses
Mean number of bedrooms in renter occupied houses
Median number of vehichles in owner occupied houses
Mean number of vehichles in owner occupied houses
Median number of vehichles in renter occupied houses
Mean number of vehichles in renter occupied houses
Mortgage status - with mortgage (%)
Mortgage status - with second mortgage (%)
Mortgage status - with home equity loan (%)
Mortgage status - with both second mortgage and home equity loan (%)
Mortgage status - without a mortgage (%)
Average family size
Average family size - White
Average family size - Black or African American
Average family size - Asian
Average family size - Hispanic or Latino
Average family size - American Indian and Alaska Native
Average family size - Multirace
Average family size - Other Race
Geographical mobility - Same house 1 year ago (%)
Geographical mobility - Moved within same county (%)
Geographical mobility - Moved from different county within same state (%)
Geographical mobility - Moved from different state (%)
Geographical mobility - Moved from abroad (%)
Place of birth - Born in state of residence (%)
Place of birth - Born in other state (%)
Place of birth - Native, outside of US (%)
Place of birth - Foreign born (%)
Housing units in structures - 1, detached (%)
Housing units in structures - 1, attached (%)
Housing units in structures - 2 (%)
Housing units in structures - 3 or 4 (%)
Housing units in structures - 5 to 9 (%)
Housing units in structures - 10 to 19 (%)
Housing units in structures - 20 to 49 (%)
Housing units in structures - 50 or more (%)
Housing units in structures - Mobile home (%)
Housing units in structures - Boat, RV, van, etc. (%)
House/condo owner moved in on average (years ago)
Renter moved in on average (years ago)
Year householder moved into unit - Moved in 1999 to March 2000 (%)
Year householder moved into unit - Moved in 1995 to 1998 (%)
Year householder moved into unit - Moved in 1990 to 1994 (%)
Year householder moved into unit - Moved in 1980 to 1989 (%)
Year householder moved into unit - Moved in 1970 to 1979 (%)
Year householder moved into unit - Moved in 1969 or earlier (%)
Means of transportation to work - Drove car alone (%)
Means of transportation to work - Carpooled (%)
Means of transportation to work - Public transportation (%)
Means of transportation to work - Bus or trolley bus (%)
Means of transportation to work - Streetcar or trolley car (%)
Means of transportation to work - Subway or elevated (%)
Means of transportation to work - Railroad (%)
Means of transportation to work - Ferryboat (%)
Means of transportation to work - Taxicab (%)
Means of transportation to work - Motorcycle (%)
Means of transportation to work - Bicycle (%)
Means of transportation to work - Walked (%)
Means of transportation to work - Other means (%)
Working at home (%)
Industry diversity
Most Common Industries - Agriculture, forestry, fishing and hunting, and mining (%)
Most Common Industries - Agriculture, forestry, fishing and hunting (%)
Most Common Industries - Mining, quarrying, and oil and gas extraction (%)
Most Common Industries - Construction (%)
Most Common Industries - Manufacturing (%)
Most Common Industries - Wholesale trade (%)
Most Common Industries - Retail trade (%)
Most Common Industries - Transportation and warehousing, and utilities (%)
Most Common Industries - Transportation and warehousing (%)
Most Common Industries - Utilities (%)
Most Common Industries - Information (%)
Most Common Industries - Finance and insurance, and real estate and rental and leasing (%)
Most Common Industries - Finance and insurance (%)
Most Common Industries - Real estate and rental and leasing (%)
Most Common Industries - Professional, scientific, and management, and administrative and waste management services (%)
Most Common Industries - Professional, scientific, and technical services (%)
Most Common Industries - Management of companies and enterprises (%)
Most Common Industries - Administrative and support and waste management services (%)
Most Common Industries - Educational services, and health care and social assistance (%)
Most Common Industries - Educational services (%)
Most Common Industries - Health care and social assistance (%)
Most Common Industries - Arts, entertainment, and recreation, and accommodation and food services (%)
Most Common Industries - Arts, entertainment, and recreation (%)
Most Common Industries - Accommodation and food services (%)
Most Common Industries - Other services, except public administration (%)
Most Common Industries - Public administration (%)
Occupation diversity
Most Common Occupations - Management, business, science, and arts occupations (%)
Most Common Occupations - Management, business, and financial occupations (%)
Most Common Occupations - Management occupations (%)
Most Common Occupations - Business and financial operations occupations (%)
Most Common Occupations - Computer, engineering, and science occupations (%)
Most Common Occupations - Computer and mathematical occupations (%)
Most Common Occupations - Architecture and engineering occupations (%)
Most Common Occupations - Life, physical, and social science occupations (%)
Most Common Occupations - Education, legal, community service, arts, and media occupations (%)
Most Common Occupations - Community and social service occupations (%)
Most Common Occupations - Legal occupations (%)
Most Common Occupations - Education, training, and library occupations (%)
Most Common Occupations - Arts, design, entertainment, sports, and media occupations (%)
Most Common Occupations - Healthcare practitioners and technical occupations (%)
Most Common Occupations - Health diagnosing and treating practitioners and other technical occupations (%)
Most Common Occupations - Health technologists and technicians (%)
Most Common Occupations - Service occupations (%)
Most Common Occupations - Healthcare support occupations (%)
Most Common Occupations - Protective service occupations (%)
Most Common Occupations - Fire fighting and prevention, and other protective service workers including supervisors (%)
Most Common Occupations - Law enforcement workers including supervisors (%)
Most Common Occupations - Food preparation and serving related occupations (%)
Most Common Occupations - Building and grounds cleaning and maintenance occupations (%)
Most Common Occupations - Personal care and service occupations (%)
Most Common Occupations - Sales and office occupations (%)
Most Common Occupations - Sales and related occupations (%)
Most Common Occupations - Office and administrative support occupations (%)
Most Common Occupations - Natural resources, construction, and maintenance occupations (%)
Most Common Occupations - Farming, fishing, and forestry occupations (%)
Most Common Occupations - Construction and extraction occupations (%)
Most Common Occupations - Installation, maintenance, and repair occupations (%)
Most Common Occupations - Production, transportation, and material moving occupations (%)
Most Common Occupations - Production occupations (%)
Most Common Occupations - Transportation occupations (%)
Most Common Occupations - Material moving occupations (%)
People in Group quarters - Institutionalized population (%)
People in Group quarters - Correctional institutions (%)
People in Group quarters - Federal prisons and detention centers (%)
People in Group quarters - Halfway houses (%)
People in Group quarters - Local jails and other confinement facilities (including police lockups) (%)
People in Group quarters - Military disciplinary barracks (%)
People in Group quarters - State prisons (%)
People in Group quarters - Other types of correctional institutions (%)
People in Group quarters - Nursing homes (%)
People in Group quarters - Hospitals/wards, hospices, and schools for the handicapped (%)
People in Group quarters - Hospitals/wards and hospices for chronically ill (%)
People in Group quarters - Hospices or homes for chronically ill (%)
People in Group quarters - Military hospitals or wards for chronically ill (%)
People in Group quarters - Other hospitals or wards for chronically ill (%)
People in Group quarters - Hospitals or wards for drug/alcohol abuse (%)
People in Group quarters - Mental (Psychiatric) hospitals or wards (%)
People in Group quarters - Schools, hospitals, or wards for the mentally retarded (%)
People in Group quarters - Schools, hospitals, or wards for the physically handicapped (%)
People in Group quarters - Institutions for the deaf (%)
People in Group quarters - Institutions for the blind (%)
People in Group quarters - Orthopedic wards and institutions for the physically handicapped (%)
People in Group quarters - Wards in general hospitals for patients who have no usual home elsewhere (%)
People in Group quarters - Wards in military hospitals for patients who have no usual home elsewhere (%)
People in Group quarters - Juvenile institutions (%)
People in Group quarters - Long-term care (%)
People in Group quarters - Homes for abused, dependent, and neglected children (%)
People in Group quarters - Residential treatment centers for emotionally disturbed children (%)
People in Group quarters - Training schools for juvenile delinquents (%)
People in Group quarters - Short-term care, detention or diagnostic centers for delinquent children (%)
People in Group quarters - Type of juvenile institution unknown (%)
People in Group quarters - Noninstitutionalized population (%)
People in Group quarters - College dormitories (includes college quarters off campus) (%)
People in Group quarters - Military quarters (%)
People in Group quarters - On base (%)
People in Group quarters - Barracks, unaccompanied personnel housing (UPH), (Enlisted/Officer), ;and similar group living quarters for military personnel (%)
People in Group quarters - Transient quarters for temporary residents (%)
People in Group quarters - Military ships (%)
People in Group quarters - Group homes (%)
People in Group quarters - Homes or halfway houses for drug/alcohol abuse (%)
People in Group quarters - Homes for the mentally ill (%)
People in Group quarters - Homes for the mentally retarded (%)
People in Group quarters - Homes for the physically handicapped (%)
People in Group quarters - Other group homes (%)
People in Group quarters - Religious group quarters (%)
People in Group quarters - Dormitories (%)
People in Group quarters - Agriculture workers' dormitories on farms (%)
People in Group quarters - Job Corps and vocational training facilities (%)
People in Group quarters - Other workers' dormitories (%)
People in Group quarters - Crews of maritime vessels (%)
People in Group quarters - Other nonhousehold living situations (%)
People in Group quarters - Other noninstitutional group quarters (%)
Residents speaking English at home (%)
Residents speaking English at home - Born in the United States (%)
Residents speaking English at home - Native, born elsewhere (%)
Residents speaking English at home - Foreign born (%)
Residents speaking Spanish at home (%)
Residents speaking Spanish at home - Born in the United States (%)
Residents speaking Spanish at home - Native, born elsewhere (%)
Residents speaking Spanish at home - Foreign born (%)
Residents speaking other language at home (%)
Residents speaking other language at home - Born in the United States (%)
Residents speaking other language at home - Native, born elsewhere (%)
Residents speaking other language at home - Foreign born (%)
Class of Workers - Employee of private company (%)
Class of Workers - Self-employed in own incorporated business (%)
Class of Workers - Private not-for-profit wage and salary workers (%)
Class of Workers - Local government workers (%)
Class of Workers - State government workers (%)
Class of Workers - Federal government workers (%)
Class of Workers - Self-employed workers in own not incorporated business and Unpaid family workers (%)
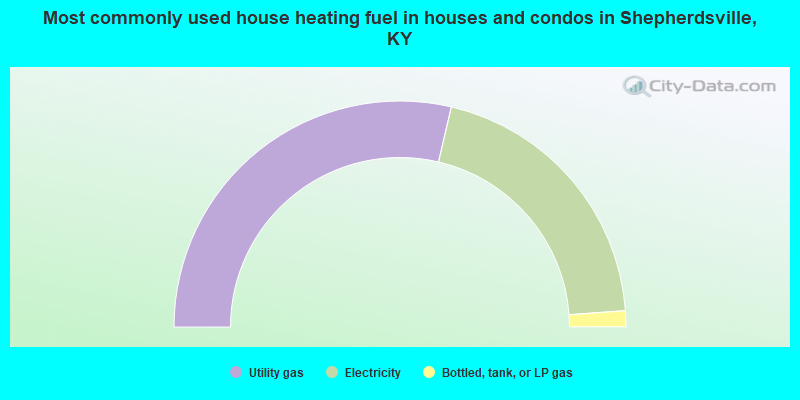
House heating fuel used in houses and condos - Utility gas (%)
House heating fuel used in houses and condos - Bottled, tank, or LP gas (%)
House heating fuel used in houses and condos - Electricity (%)
House heating fuel used in houses and condos - Fuel oil, kerosene, etc. (%)
House heating fuel used in houses and condos - Coal or coke (%)
House heating fuel used in houses and condos - Wood (%)
House heating fuel used in houses and condos - Solar energy (%)
House heating fuel used in houses and condos - Other fuel (%)
House heating fuel used in houses and condos - No fuel used (%)
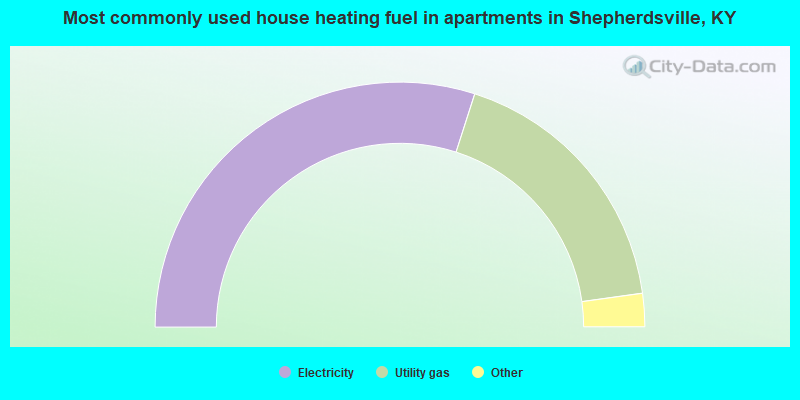
House heating fuel used in apartments - Utility gas (%)
House heating fuel used in apartments - Bottled, tank, or LP gas (%)
House heating fuel used in apartments - Electricity (%)
House heating fuel used in apartments - Fuel oil, kerosene, etc. (%)
House heating fuel used in apartments - Coal or coke (%)
House heating fuel used in apartments - Wood (%)
House heating fuel used in apartments - Solar energy (%)
House heating fuel used in apartments - Other fuel (%)
House heating fuel used in apartments - No fuel used (%)
Armed forces status - In Armed Forces (%)
Armed forces status - Civilian (%)
Armed forces status - Civilian - Veteran (%)
Armed forces status - Civilian - Nonveteran (%)
Fatal accidents locations in years 2005-2021
Fatal accidents locations in 2005
Fatal accidents locations in 2006
Fatal accidents locations in 2007
Fatal accidents locations in 2008
Fatal accidents locations in 2009
Fatal accidents locations in 2010
Fatal accidents locations in 2011
Fatal accidents locations in 2012
Fatal accidents locations in 2013
Fatal accidents locations in 2014
Fatal accidents locations in 2015
Fatal accidents locations in 2016
Fatal accidents locations in 2017
Fatal accidents locations in 2018
Fatal accidents locations in 2019
Fatal accidents locations in 2020
Fatal accidents locations in 2021
Alcohol use - People drinking some alcohol every month (%)
Alcohol use - People not drinking at all (%)
Alcohol use - Average days/month drinking alcohol
Alcohol use - Average drinks/week
Alcohol use - Average days/year people drink much
Audiometry - Average condition of hearing (%)
Audiometry - People that can hear a whisper from across a quiet room (%)
Audiometry - People that can hear normal voice from across a quiet room (%)
Audiometry - Ears ringing, roaring, buzzing (%)
Audiometry - Had a job exposure to loud noise (%)
Audiometry - Had off-work exposure to loud noise (%)
Blood Pressure & Cholesterol - Has high blood pressure (%)
Blood Pressure & Cholesterol - Checking blood pressure at home (%)
Blood Pressure & Cholesterol - Frequently checking blood cholesterol (%)
Blood Pressure & Cholesterol - Has high cholesterol level (%)
Consumer Behavior - Money monthly spent on food at supermarket/grocery store
Consumer Behavior - Money monthly spent on food at other stores
Consumer Behavior - Money monthly spent on eating out
Consumer Behavior - Money monthly spent on carryout/delivered foods
Consumer Behavior - Income spent on food at supermarket/grocery store (%)
Consumer Behavior - Income spent on food at other stores (%)
Consumer Behavior - Income spent on eating out (%)
Consumer Behavior - Income spent on carryout/delivered foods (%)
Current Health Status - General health condition (%)
Current Health Status - Blood donors (%)
Current Health Status - Has blood ever tested for HIV virus (%)
Current Health Status - Left-handed people (%)
Dermatology - People using sunscreen (%)
Diabetes - Diabetics (%)
Diabetes - Had a blood test for high blood sugar (%)
Diabetes - People taking insulin (%)
Diet Behavior & Nutrition - Diet health (%)
Diet Behavior & Nutrition - Milk product consumption (# of products/month)
Diet Behavior & Nutrition - Meals not home prepared (#/week)
Diet Behavior & Nutrition - Meals from fast food or pizza place (#/week)
Diet Behavior & Nutrition - Ready-to-eat foods (#/month)
Diet Behavior & Nutrition - Frozen meals/pizza (#/month)
Drug Use - People that ever used marijuana or hashish (%)
Drug Use - Ever used hard drugs (%)
Drug Use - Ever used any form of cocaine (%)
Drug Use - Ever used heroin (%)
Drug Use - Ever used methamphetamine (%)
Health Insurance - People covered by health insurance (%)
Kidney Conditions-Urology - Avg. # of times urinating at night
Medical Conditions - People with asthma (%)
Medical Conditions - People with anemia (%)
Medical Conditions - People with psoriasis (%)
Medical Conditions - People with overweight (%)
Medical Conditions - Elderly people having difficulties in thinking or remembering (%)
Medical Conditions - People who ever received blood transfusion (%)
Medical Conditions - People having trouble seeing even with glass/contacts (%)
Medical Conditions - People with arthritis (%)
Medical Conditions - People with gout (%)
Medical Conditions - People with congestive heart failure (%)
Medical Conditions - People with coronary heart disease (%)
Medical Conditions - People with angina pectoris (%)
Medical Conditions - People who ever had heart attack (%)
Medical Conditions - People who ever had stroke (%)
Medical Conditions - People with emphysema (%)
Medical Conditions - People with thyroid problem (%)
Medical Conditions - People with chronic bronchitis (%)
Medical Conditions - People with any liver condition (%)
Medical Conditions - People who ever had cancer or malignancy (%)
Mental Health - People who have little interest in doing things (%)
Mental Health - People feeling down, depressed, or hopeless (%)
Mental Health - People who have trouble sleeping or sleeping too much (%)
Mental Health - People feeling tired or having little energy (%)
Mental Health - People with poor appetite or overeating (%)
Mental Health - People feeling bad about themself (%)
Mental Health - People who have trouble concentrating on things (%)
Mental Health - People moving or speaking slowly or too fast (%)
Mental Health - People having thoughts they would be better off dead (%)
Oral Health - Average years since last visit a dentist
Oral Health - People embarrassed because of mouth (%)
Oral Health - People with gum disease (%)
Oral Health - General health of teeth and gums (%)
Oral Health - Average days a week using dental floss/device
Oral Health - Average days a week using mouthwash for dental problem
Oral Health - Average number of teeth
Pesticide Use - Households using pesticides to control insects (%)
Pesticide Use - Households using pesticides to kill weeds (%)
Physical Activity - People doing vigorous-intensity work activities (%)
Physical Activity - People doing moderate-intensity work activities (%)
Physical Activity - People walking or bicycling (%)
Physical Activity - People doing vigorous-intensity recreational activities (%)
Physical Activity - People doing moderate-intensity recreational activities (%)
Physical Activity - Average hours a day doing sedentary activities
Physical Activity - Average hours a day watching TV or videos
Physical Activity - Average hours a day using computer
Physical Functioning - People having limitations keeping them from working (%)
Physical Functioning - People limited in amount of work they can do (%)
Physical Functioning - People that need special equipment to walk (%)
Physical Functioning - People experiencing confusion/memory problems (%)
Physical Functioning - People requiring special healthcare equipment (%)
Prescription Medications - Average number of prescription medicines taking
Preventive Aspirin Use - Adults 40+ taking low-dose aspirin (%)
Reproductive Health - Vaginal deliveries (%)
Reproductive Health - Cesarean deliveries (%)
Reproductive Health - Deliveries resulted in a live birth (%)
Reproductive Health - Pregnancies resulted in a delivery (%)
Reproductive Health - Women breastfeeding newborns (%)
Reproductive Health - Women that had a hysterectomy (%)
Reproductive Health - Women that had both ovaries removed (%)
Reproductive Health - Women that have ever taken birth control pills (%)
Reproductive Health - Women taking birth control pills (%)
Reproductive Health - Women that have ever used Depo-Provera or injectables (%)
Reproductive Health - Women that have ever used female hormones (%)
Sexual Behavior - People 18+ that ever had sex (vaginal, anal, or oral) (%)
Sexual Behavior - Males 18+ that ever had vaginal sex with a woman (%)
Sexual Behavior - Males 18+ that ever performed oral sex on a woman (%)
Sexual Behavior - Males 18+ that ever had anal sex with a woman (%)
Sexual Behavior - Males 18+ that ever had any sex with a man (%)
Sexual Behavior - Females 18+ that ever had vaginal sex with a man (%)
Sexual Behavior - Females 18+ that ever performed oral sex on a man (%)
Sexual Behavior - Females 18+ that ever had anal sex with a man (%)
Sexual Behavior - Females 18+ that ever had any kind of sex with a woman (%)
Sexual Behavior - Average age people first had sex
Sexual Behavior - Average number of female sex partners in lifetime (males 18+)
Sexual Behavior - Average number of female vaginal sex partners in lifetime (males 18+)
Sexual Behavior - Average age people first performed oral sex on a woman (18+)
Sexual Behavior - Average number of woman performed oral sex on in lifetime (18+)
Sexual Behavior - Average number of male sex partners in lifetime (males 18+)
Sexual Behavior - Average number of male anal sex partners in lifetime (males 18+)
Sexual Behavior - Average age people first performed oral sex on a man (18+)
Sexual Behavior - Average number of male oral sex partners in lifetime (18+)
Sexual Behavior - People using protection when performing oral sex (%)
Sexual Behavior - Average number of times people have vaginal or anal sex a year
Sexual Behavior - People having sex without condom (%)
Sexual Behavior - Average number of male sex partners in lifetime (females 18+)
Sexual Behavior - Average number of male vaginal sex partners in lifetime (females 18+)
Sexual Behavior - Average number of female sex partners in lifetime (females 18+)
Sexual Behavior - Circumcised males 18+ (%)
Sleep Disorders - Average hours sleeping at night
Sleep Disorders - People that has trouble sleeping (%)
Smoking-Cigarette Use - People smoking cigarettes (%)
Taste & Smell - People 40+ having problems with smell (%)
Taste & Smell - People 40+ having problems with taste (%)
Taste & Smell - People 40+ that ever had wisdom teeth removed (%)
Taste & Smell - People 40+ that ever had tonsils teeth removed (%)
Taste & Smell - People 40+ that ever had a loss of consciousness because of a head injury (%)
Taste & Smell - People 40+ that ever had a broken nose or other serious injury to face or skull (%)
Taste & Smell - People 40+ that ever had two or more sinus infections (%)
Weight - Average height (inches)
Weight - Average weight (pounds)
Weight - Average BMI
Weight - People that are obese (%)
Weight - People that ever were obese (%)
Weight - People trying to lose weight (%)
Officers per 1,000 residents here:
2.98Kentucky average:
1.89
Latest news from Shepherdsville, KY collected exclusively by city-data.com from local newspapers, TV, and radio stations
Shepherdsville, KY City Guides: Ancestries: American (26.0%), German (14.5%), Irish (13.4%), English (9.8%), European (3.6%), Italian (2.8%).
Current Local Time:
Incorporated on 02/21/1846
Land area: 10.5 square miles.
Population density: 1,375 people per square mile (low).
201 residents are foreign born
This city:
1.4%Kentucky:
4.1%
Median real estate property taxes paid for housing units with mortgages in 2022: $1,876 (0.9%)Median real estate property taxes paid for housing units with no mortgage in 2022: $1,478 (0.8%)
Nearest city with pop. 50,000+: Louisville, KY
Nearest city with pop. 1,000,000+: Chicago, IL
Nearest cities:
Latitude: 37.99 N, Longitude: 85.71 W
Daytime population change due to commuting: +5,730 (+39.9%)Workers who live and work in this city: 2,753 (40.9%)
Unemployment in December 2023:
Population change in the 1990s: +3,452 (+70.7%).
Most common industries in Shepherdsville, KY (%)
Both Males Females
Construction (10.4%)
Health care (7.9%)
Accommodation & food services (5.2%)
Other transportation, support activities, couriers (5.0%)
Transportation equipment (4.9%)
Educational services (4.3%)
Publishing, motion picture & sound recording industries (4.0%)
Construction (17.3%)
Transportation equipment (7.1%)
Repair & maintenance (5.1%)
Other transportation, support activities, couriers (4.7%)
Publishing, motion picture & sound recording industries (4.4%)
Truck transportation (3.9%)
Real estate & rental & leasing (3.4%)
Health care (14.6%)
Accommodation & food services (9.1%)
Finance & insurance (7.7%)
Educational services (6.9%)
Food & beverage stores (6.0%)
Other transportation, support activities, couriers (5.3%)
Professional, scientific, technical services (4.8%)
Most common occupations in Shepherdsville, KY (%)
Both Males Females
Laborers and material movers, hand (6.1%)
Cashiers (5.2%)
Other production occupations, including supervisors (5.0%)
Electrical equipment mechanics and other installation, maintenance, and repair workers, including supervisors (4.4%)
Other office and administrative support workers, including supervisors (4.3%)
Assemblers and fabricators (3.8%)
Other sales and related occupations, including supervisors (3.7%)
Laborers and material movers, hand (7.7%)
Other production occupations, including supervisors (7.5%)
Electrical equipment mechanics and other installation, maintenance, and repair workers, including supervisors (7.3%)
Vehicle and mobile equipment mechanics, installers, and repairers (6.2%)
Assemblers and fabricators (5.6%)
Driver/sales workers and truck drivers (5.2%)
Construction traders workers except carpenters, electricians, painters, plumbers, and construction laborers (4.2%)
Cashiers (9.7%)
Other office and administrative support workers, including supervisors (7.4%)
Secretaries and administrative assistants (5.3%)
Material recording, scheduling, dispatching, and distributing workers (4.7%)
Preschool, kindergarten, elementary, and middle school teachers (4.4%)
Laborers and material movers, hand (4.4%)
Other sales and related occupations, including supervisors (4.4%)
Tornado activity:
Shepherdsville-area historical tornado activity is slightly above Kentucky state average. It is 57% greater than the overall U.S. average.
On 4/3/1974, a category F5 (max. wind speeds 261-318 mph) tornado 21.5 miles away from the Shepherdsville city center killed 31 people and injured 270 people and caused between $500,000 and $5,000,000 in damages.
On 5/28/1996, a category F4 (max. wind speeds 207-260 mph) tornado 11.4 miles away from the city center injured 10 people and caused $101 million in damages.
Earthquake activity:
Shepherdsville-area historical earthquake activity is significantly above Kentucky state average. It is 118% greater than the overall U.S. average. On 4/18/2008 at 09:36:59, a magnitude 5.4 (5.1 MB, 4.8 MS, 5.4 MW, 5.2 MW, Class: Moderate, Intensity: VI - VII) earthquake occurred 122.3 miles away from the city center On 7/27/1980 at 18:52:21, a magnitude 5.2 (5.1 MB, 4.7 MS, 5.0 UK, 5.2 UK) earthquake occurred 97.6 miles away from the city center On 4/18/2008 at 09:36:59, a magnitude 5.2 (5.2 MW, Depth: 8.9 mi) earthquake occurred 122.3 miles away from Shepherdsville center On 6/10/1987 at 23:48:54, a magnitude 5.1 (4.9 MB, 4.4 MS, 4.6 MS, 5.1 LG) earthquake occurred 131.0 miles away from the city center On 6/18/2002 at 17:37:15, a magnitude 5.0 (4.3 MB, 4.6 MW, 5.0 LG) earthquake occurred 112.6 miles away from the city center On 4/18/2008 at 15:14:16, a magnitude 4.8 (4.5 MB, 4.8 MW, 4.6 MW, Class: Light, Intensity: IV - V) earthquake occurred 120.7 miles away from Shepherdsville center Magnitude types: regional Lg-wave magnitude (LG), body-wave magnitude (MB), surface-wave magnitude (MS), moment magnitude (MW) Natural disasters: The number of natural disasters in Bullitt County (18) is near the US average (15).Major Disasters (Presidential) Declared: 14Emergencies Declared: 2Floods: 11, Storms: 10, Tornadoes: 6, Mudslides: 4, Landslides: 3, Winter Storms: 3, Blizzard: 1, Heavy Rain: 1, Hurricane: 1, Snowstorm: 1, Tropical Depression: 1, Wind: 1, Other: 1 (Note: some incidents may be assigned to more than one category). Hospitals and medical centers in Shepherdsville: FMC - SHEPHERDSVILLE (421 ADAM SHEPHERD PARKWAY)
Other hospitals and medical centers near Shepherdsville: GREEN MEADOWS HEALTH CARE CENTER 1 (Nursing Home, about 10 miles away; MOUNT WASHINGTON, KY)
WESLEY MANOR NURSING CENTER (Nursing Home, about 10 miles away; LOUISVILLE, KY)
FILSON CARE HOME (Nursing Home, about 10 miles away; LOUISVILLE, KY)
REGENCY CARE AND REHABILITATION CENTER (Nursing Home, about 10 miles away; LOUISVILLE, KY)
MEADOWS ICF/MR (Hospital, about 11 miles away; MOUNT WASHINGTON, KY)
ESSEX NURSING AND REHABILITATION CENTER (Nursing Home, about 11 miles away; LOUISVILLE, KY)
PARK TERRACE HEALTH CAMPUS (Nursing Home, about 11 miles away; LOUISVILLE, KY)
Airports located in Shepherdsville: Colleges/universities with over 2000 students nearest to Shepherdsville:
Sullivan University (about 16 miles; Louisville, KY ; Full-time enrollment: 5,129)
University of Louisville (about 16 miles; Louisville, KY ; FT enrollment: 16,640)
Bellarmine University (about 16 miles; Louisville, KY ; FT enrollment: 3,180)
The Southern Baptist Theological Seminary (about 19 miles; Louisville, KY ; FT enrollment: 2,360)
Jefferson Community and Technical College (about 19 miles; Louisville, KY ; FT enrollment: 7,950)
Elizabethtown Community and Technical College (about 22 miles; Elizabethtown, KY ; FT enrollment: 3,762)
Indiana University-Southeast (about 26 miles; New Albany, IN ; FT enrollment: 5,050)
Public high schools in Shepherdsville: BULLITT CENTRAL HIGH SCHOOL Students: 1,207, Location: 1330 HWY 44 E, Grades: 9-12)NORTH BULLITT HIGH SCHOOL Students: 1,065, Location: 3200 E HEBRON LN, Grades: 9-12)RIVERVIEW OPPORTUNITY CENTER Location: 383 HIGH SCHOOL DR, Grades: 9-12)
BULLITT ALTERNATIVE CENTER Location: 381 HIGH SCHOOL DR, Grades: 6-12)
Public elementary/middle schools in Shepherdsville: ZONETON MIDDLE SCHOOL Students: 610, Location: 797 OLD PRESTON HWY N, Grades: 6-8)FREEDOM ELEMENTARY SCHOOL Students: 559, Location: 4682 NORTH PRESTON HWY., Grades: PK-5)BULLITT LICK MIDDLE SCHOOL Students: 526, Location: 555 W BLUE LICK RD, Grades: 6-8)CEDAR GROVE ELEMENTARY Students: 516, Location: 1900 CEDAR GROVE ROAD, Grades: PK-5)BERNHEIM MIDDLE SCHOOL Students: 516, Location: 700 AUDUBON DR, Grades: 6-8)SHEPHERDSVILLE ELEMENTARY Students: 431, Location: 527 W BLUE LICK RD, Grades: PK-5)HEBRON MIDDLE SCHOOL Students: 427, Location: 3300 E HEBRON LN, Grades: 6-8)ROBY ELEMENTARY SCHOOL Students: 392, Location: 1148 HWY 44 E, Grades: PK-5)BROOKS ELEMENTARY SCHOOL Location: 1800 E BLUE LICK RD, Grades: PK-5)
Private elementary/middle schools in Shepherdsville: LITTLE FLOCK CHRISTIAN ACADEMY Students: 202, Location: 5500 N PRESTON HWY, Grades: KG-8)
ST ALOYSIUS GONZAGA ACADEMY Students: 132, Location: 197 S PLUM ST, Grades: PK-8)
See full list of schools located in Shepherdsville Library in Shepherdsville: BULLITT COUNTY LIBRARY DISTRICT Operating income: $2,932,207; Location: 127 NORTH WALNUT STREET; 150,763 books ; 11,409 audio materials ; 7,339 video materials ; 5 local licensed databases ; 48 state licensed databases ; 137 print serial subscriptions )
User-submitted facts and corrections:
Radio station: 93.9 FM WFBR, Mt. Washington, KY (Owner: First Baptist Church, Mt. Washington)
Notable locations in Shepherdsville: (A) , Shepherdsville Fire Department Station 1 (B) , Southeast Bullitt Fire and Rescue (C) , Shepherdsville Fire Department Station 2 (D) , Bullitt County Emergency Medical Services (E) . Display/hide their locations on the map
Church in Shepherdsville: (A) . Display/hide its location on the map
Cemeteries: (1) , Hall Cemetery (2) . Display/hide their locations on the map
Tourist attractions:
Hotels:
Courts:
Birthplace of: Wayne Edwards - Busch series NASCAR driver (born : Jun 23, 1967), Charles Kurtsinger - Jockey.
Bullitt County has a predicted average indoor radon screening level greater than 4 pCi/L (pico curies per liter) - Highest Potential Average household size: This city:
2.6 peopleKentucky:
2.5 people
Percentage of family households: This city:
70.6%Whole state:
66.9%
Percentage of households with unmarried partners: This city:
10.1%Whole state:
6.4%
Likely homosexual households (counted as self-reported same-sex unmarried-partner households)
Lesbian couples: 0.2% of all households Gay men: 0.2% of all households
265 people in state prisons in 2010people in local jails and other confinement facilities (including police lockups) in 2000people in homes for the mentally ill in 2000
Banks with branches in Shepherdsville (2011 data):
The Peoples Bank of Bullitt County: Buckman Street Branch, John Harper Highway Branch, The Peoples Bank Of Bullitt County. Info updated 2006/11/03: Bank assets: $214.9 mil, Deposits: $183.9 mil, local headquarters , positive income , 5 total offices , Holding Company: Peoples Bancorp Inc. Of Bullitt County
PBI Bank: Bullitt County Bank Branch at 340 S Buckman Street, branch established on 1889/01/01; Conestoga Branch at 155 Conestoga Parkway, branch established on 2008/07/01. Info updated 2008/03/03: Bank assets: $1,461.9 mil, Deposits: $1,326.3 mil, headquarters in Louisville, KY, negative income in the last year , Commercial Lending Specialization, 19 total offices , Holding Company: Porter Bancorp, Inc.
First Federal Savings Bank of Elizabethtown: Bullitt Branch at 395 North Buckman Street, branch established on 1959/01/01; Cedar Grove Branch at 1707 Cedar Grove Rd Suite 1, branch established on 2008/08/16. Info updated 2008/06/26: Bank assets: $1,228.8 mil, Deposits: $1,123.3 mil, headquarters in Elizabethtown, KY, negative income in the last year , Commercial Lending Specialization, 24 total offices , Holding Company: First Financial Service Corporation
First Citizens Bank: Shepherdsville Branch at 4810 North Preston Highway, branch established on 2004/10/06. Info updated 2012/03/30: Bank assets: $316.3 mil, Deposits: $268.8 mil, headquarters in Elizabethtown, KY, positive income , Commercial Lending Specialization, 6 total offices , Holding Company: Farmers Capital Bank Corporation
Stock Yards Bank & Trust Company: Shepherdsville Branch at 185 Adam Shepherd Parkway, branch established on 2006/09/05. Info updated 2011/11/29: Bank assets: $2,045.7 mil, Deposits: $1,643.0 mil, headquarters in Louisville, KY, positive income , Commercial Lending Specialization, 31 total offices , Holding Company: S. Y. Bancorp, Inc.
PNC Bank, National Association: Shepherdsville Branch at 262 Adam Shepherd Pkwy, branch established on 2007/01/22. Info updated 2012/03/20: Bank assets: $263,309.6 mil, Deposits: $197,343.0 mil, headquarters in Wilmington, DE, positive income , Commercial Lending Specialization, 3085 total offices , Holding Company: Pnc Financial Services Group, Inc., The
Republic Bank & Trust Company: Shepherdsville Branch at 438 Highway 44 East, branch established on 2007/10/30. Info updated 2012/01/30: Bank assets: $3,310.3 mil, Deposits: $1,691.4 mil, headquarters in Louisville, KY, positive income , Mortgage Lending Specialization, 38 total offices , Holding Company: Republic Bancorp, Inc.
For population 15 years and over in Shepherdsville:
Never married: 24.3%Now married: 52.0%Separated: 1.2%Widowed: 4.8%Divorced: 17.6% For population 25 years and over in Shepherdsville:
High school or higher: 87.7%Bachelor's degree or higher: 15.6%Graduate or professional degree: 4.5%Unemployed: 3.6%Mean travel time to work (commute): 18.9 minutes
Education Gini index (Inequality in education) Here:
10.2Kentucky average:
11.7
Religion statistics for Shepherdsville, KY (based on Bullitt County data)
Religion Adherents Congregations Evangelical Protestant 19,239 62 Catholic 3,054 3 Mainline Protestant 2,123 10 Other 291 4 None 49,612 -
Source: Clifford Grammich, Kirk Hadaway, Richard Houseal, Dale E.Jones, Alexei Krindatch, Richie Stanley and Richard H.Taylor. 2012. 2010 U.S.Religion Census: Religious Congregations & Membership Study. Association of Statisticians of American Religious Bodies. Jones, Dale E., et al. 2002. Congregations and Membership in the United States 2000. Nashville, TN: Glenmary Research Center. Graphs represent county-level data
Food Environment Statistics: Number of grocery stores : 9Bullitt County :
1.22 / 10,000 pop.Kentucky :
2.19 / 10,000 pop.
Number of convenience stores (no gas) : 3Bullitt County :
0.41 / 10,000 pop.Kentucky :
0.74 / 10,000 pop.
Number of convenience stores (with gas) : 34Bullitt County :
4.60 / 10,000 pop.Kentucky :
4.36 / 10,000 pop.
Number of full-service restaurants : 21This county :
2.84 / 10,000 pop.Kentucky :
5.74 / 10,000 pop.
Adult diabetes rate : Bullitt County :
9.1%State :
11.0%
Adult obesity rate : This county :
31.1%Kentucky :
30.0%
Low-income preschool obesity rate : This county :
14.8%Kentucky :
15.9%
Health and Nutrition: Healthy diet rate : Shepherdsville:
49.4%Kentucky:
49.9%
Average overall health of teeth and gums : People feeling badly about themselves : This city:
19.9%State:
21.0%
People not drinking alcohol at all : Shepherdsville:
11.4%State:
10.1%
Average hours sleeping at night : Shepherdsville:
6.8State:
6.8
Overweight people : This city:
30.9%State:
33.8%
General health condition : Shepherdsville:
58.0%State:
56.8%
Average condition of hearing : Shepherdsville:
79.8%State:
78.9%
More about Health and Nutrition of Shepherdsville, KY Residents
Local government employment and payroll (March 2022)
Function
Full-time employees
Monthly full-time payroll
Average yearly full-time wage
Part-time employees
Monthly part-time payroll
Police Protection - Officers
37 $233,590 $75,759 0 $0 Firefighters
32 $182,957 $68,609 4 $7,946 Sewerage
10 $49,607 $59,528 0 $0 Streets and Highways
7 $35,979 $61,678 0 $0 Other Government Administration
6 $24,286 $48,572 9 $6,900 Police - Other
2 $6,946 $41,676 0 $0 Financial Administration
2 $14,842 $89,052 0 $0 Other and Unallocable
1 $4,820 $57,840 0 $0 Judicial and Legal
1 $3,333 $39,996 0 $0 Fire - Other
0 $0 1 $1,833
Totals for Government
98 $556,359 $68,126 14 $16,679
Shepherdsville government finances - Expenditure in 2021 (per resident):
Current Operations - Police Protection: $3,207,000 ($221.39)
Sewerage: $2,704,000 ($186.66)Local Fire Protection: $2,674,000 ($184.59)Central Staff Services: $1,512,000 ($104.38)Regular Highways: $840,000 ($57.99)General - Interest on Debt: $903,000 ($62.34)
Other Capital Outlay - Central Staff Services: $599,000 ($41.35)
Sewerage: $245,000 ($16.91)Local Fire Protection: $154,000 ($10.63)Police Protection: $46,000 ($3.18)Regular Highways: $8,000 ($0.55)Total Salaries and Wages: $6,592,000 ($455.06)
Shepherdsville government finances - Revenue in 2021 (per resident):
Charges - Sewerage: $6,764,000 ($466.93)
Other: $433,000 ($29.89)Miscellaneous - Rents: $28,000 ($1.93)
Fines and Forfeits: $22,000 ($1.52)Sale of Property: $10,000 ($0.69)Interest Earnings: $8,000 ($0.55)Donations From Private Sources: $2,000 ($0.14)State Intergovernmental - Other: $1,567,000 ($108.17)
Highways: $178,000 ($12.29)Tax - Individual Income: $8,565,000 ($591.26)
Property: $2,803,000 ($193.50)Insurance Premiums Sales: $947,000 ($65.37)Other License: $300,000 ($20.71)Occupation and Business License - Other: $97,000 ($6.70)Public Utilities Sales: $23,000 ($1.59)Alcoholic Beverage License: $19,000 ($1.31)
Shepherdsville government finances - Debt in 2021 (per resident):
Long Term Debt - Beginning Outstanding - Unspecified Public Purpose: $24,208,000 ($1671.13)
Outstanding Unspecified Public Purpose: $21,659,000 ($1495.17)Retired Unspecified Public Purpose: $2,549,000 ($175.96)
Shepherdsville government finances - Cash and Securities in 2021 (per resident):
Other Funds - Cash and Securities: $16,361,000 ($1129.44)
Businesses in Shepherdsville, KY
Name Count Name Count
AT&T 1 Long John Silver's 1 Advance Auto Parts 1 Lowe's 1 Arby's 2 McDonald's 2 AutoZone 1 Motel 6 1 Best Western 1 Papa John's Pizza 1 Big O Tires 1 Penske 1 Blockbuster 1 RadioShack 1 Burger King 1 Rite Aid 1 Circle K 1 SONIC Drive-In 1 Comfort Inn 1 Sleep Inn 1 Cracker Barrel 1 Subway 3 Cricket Wireless 1 Super 8 1 Dairy Queen 1 Taco Bell 1 Days Inn 1 U-Haul 2 FedEx 2 UPS 3 GNC 1 Waffle House 2 H&R Block 1 Walgreens 1 KFC 1 Wendy's 1 Kroger 1 White Castle 1 Lane Furniture 1 YMCA 1
Strongest AM radio stations in Shepherdsville:
WLCR (1470 AM; daytime; 2 kW; SHEPHERDSVILLE, KY; Owner: LCR PARTNERS, L.P.)
WHAS (840 AM; 50 kW; LOUISVILLE, KY; Owner: CLEAR CHANNEL BROADCASTING LICENSES, INC.)
WDRD (680 AM; 1 kW; NEWBURG, KY; Owner: ABC, INC.)
WXXA (790 AM; 5 kW; LOUISVILLE, KY)
WKJK (1080 AM; 10 kW; LOUISVILLE, KY; Owner: CLEAR CHANNEL BROADCASTING LICENSES, INC.)
WGTK (970 AM; 5 kW; LOUISVILLE, KY; Owner: SALEM MEDIA OF KENTUCKY, INC.)
WLOU (1350 AM; 2 kW; LOUISVILLE, KY; Owner: MORTENSON BROADCASTING CO., INC.)
WLW (700 AM; 50 kW; CINCINNATI, OH; Owner: JACOR BROADCASTING CORPORATION)
WSAI (1530 AM; 50 kW; CINCINNATI, OH; Owner: JACOR BROADCASTING CORPORATION)
WSM (650 AM; 50 kW; NASHVILLE, TN; Owner: GAYLORD ENTERTAINMENT COMPANY)
WFIA (900 AM; 1 kW; LOUISVILLE, KY; Owner: SCA LICENSE CORPORATION)
WBRT (1320 AM; 1 kW; BARDSTOWN, KY; Owner: CBC OF NELSON COUNTY, INC.)
WLLV (1240 AM; 1 kW; LOUISVILLE, KY; Owner: MORTENSON BROADCASTING COMPANY)
Strongest FM radio stations in Shepherdsville:
WJIE-FM (88.5 FM; OKOLONA, KY; Owner: EVANGEL SCHOOLS, INC.)
WAMZ (97.5 FM; LOUISVILLE, KY; Owner: CLEAR CHANNEL BROADCASTING LICENSES, INC.)
WLRS (105.1 FM; SHEPHERDSVILLE, KY; Owner: BLUE CHIP BROADCASTING LICENSES II, LTD.)
WRVI (105.9 FM; VALLEY STATION, KY; Owner: SALEM MEDIA OF KENTUCKY, INC.)
WFPL (89.3 FM; LOUISVILLE, KY; Owner: KENTUCKY PUBLIC RADIO, INC.)
WASE (103.5 FM; RADCLIFF, KY; Owner: W & B BROADCASTING, INC.)
WQMF (95.7 FM; JEFFERSONVILLE, IN; Owner: CLEAR CHANNEL BROADCASTING LICENSES, INC.)
WTFX-FM (100.5 FM; LOUISVILLE, KY; Owner: CLEAR CHANNEL BROADCASTING LICENSES, INC.)
W216BM (91.1 FM; OKOLONA, KY; Owner: CALVARY CHAPEL OF TWIN FALLS, INC.)
WSFR (107.7 FM; CORYDON, IN; Owner: CXR HOLDINGS, INC.)
WKUE (90.9 FM; ELIZABETHTOWN, KY; Owner: WESTERN KENTUCKY UNIVERSITY)
WQXE (98.3 FM; ELIZABETHTOWN, KY; Owner: SKYTOWER COMMUNICATIONS-E'TOWN, INC.)
WPTI (103.9 FM; LOUISVILLE, KY; Owner: CXR HOLDINGS, INC.)
WLVK (105.5 FM; FORT KNOX, KY; Owner: BIG CAT BROADCASTING, INC.)
WFPK (91.9 FM; LOUISVILLE, KY; Owner: KENTUCKY PUBLIC RADIO, INC.)
WUOL-FM (90.5 FM; LOUISVILLE, KY; Owner: KENTUCKY PUBLIC RADIO, INC.)
WMJM (101.3 FM; JEFFERSONTOWN, KY; Owner: BLUE CHIP BROADCASTING LICENSES II, LTD.)
WDJX (99.7 FM; LOUISVILLE, KY; Owner: BLUE CHIP BROADCASTING LICENSES II, LTD.)
WVEZ (106.9 FM; LOUISVILLE, KY; Owner: CXR HOLDINGS, INC.)
W284AD (104.7 FM; NEW ALBANY, IN; Owner: LIFETALK RADIO, INC.)
TV broadcast stations around Shepherdsville:
WBKI-CA (Channel 28; LOUISVILLE, KY; Owner: LOUISVILLE COMMUNICATIONS, LLC)
W24BW (Channel 24; LOUISVILLE, KY; Owner: GREATER LOUISVILLE COMMUNICATIONS)
WAVE (Channel 3; LOUISVILLE, KY; Owner: LIBCO, INC.)
WHAS-TV (Channel 11; LOUISVILLE, KY; Owner: BELO KENTUCKY, INC.)
WVHF-LP (Channel 5; JEFFERSONVILLE, ETC., IN; Owner: JOHN W. SMITH, JR.)
WDRB (Channel 41; LOUISVILLE, KY; Owner: INDEPENDENCE TELEVISION COMPANY)
WFTE (Channel 58; SALEM, IN; Owner: INDEPENDENCE TELEVISION COMPANY)
WLKY-TV (Channel 32; LOUISVILLE, KY; Owner: WLKY HEARST-ARGYLE TELEVISION, INC.)
WKZT-TV (Channel 23; ELIZABETHTOWN, KY; Owner: KENTUCKY AUTHORITY FOR EDUCATIONAL TV)
WBXV-CA (Channel 13; LOUISVILLE, KY; Owner: THE BOX WORLDWIDE LLC)
WBKI-TV (Channel 34; CAMPBELLSVILLE, KY; Owner: LOUISVILLE COMMUNICATIONS, LLC)
WJYL-CA (Channel 45; CLARKSVILLE, IN; Owner: JOHN W. SMITH, JR.)
W39CJ (Channel 39; ELIZABETHTOWN, KY; Owner: TRINITY BROADCASTING NETWORK)
WKPC-TV (Channel 15; LOUISVILLE, KY; Owner: KENTUCKY AUTHORITY FOR EDUC'L. TV)
WKMJ-TV (Channel 68; LOUISVILLE, KY; Owner: KENTUCKY AUTHORITY FOR EDUCATIONAL TV)
WBNA (Channel 21; LOUISVILLE, KY; Owner: WORD BROADCASTING NETWORK, INC.)
W50CI (Channel 50; LOUISVILLE, KY; Owner: SOUTH CENTRAL COMMUNICATIONS CORP.)
National Bridge Inventory (NBI) Statistics 52 Number of bridges669ft / 204m Total length $3,302,000 Total costs1,120,891 Total average daily traffic220,558 Total average daily truck traffic
New bridges - historical statistics
1 1920-1929 3 1930-1939 1 1940-1949 7 1950-1959 3 1960-1969 1 1970-1979 20 1980-1989 5 1990-1999 3 2000-2009 6 2010-2019 2 2020-2022
See full National Bridge Inventory statistics for Shepherdsville, KY
Home Mortgage Disclosure Act Aggregated Statistics For Year 2009(Based on 1 partial tract) A) FHA, FSA/RHS & VA B) Conventional C) Refinancings D) Home Improvement Loans E) Loans on Dwellings For 5+ Families F) Non-occupant Loans on G) Loans On Manufactured Number Average Value Number Average Value Number Average Value Number Average Value Number Average Value Number Average Value Number Average Value
LOANS ORIGINATED 30 $127,771 20 $98,300 98 $128,399 2 $106,790 1 $204,520 11 $77,665 5 $47,998 APPLICATIONS APPROVED, NOT ACCEPTED 4 $107,922 4 $50,942 9 $131,401 1 $3,020 0 $0 1 $30,190 2 $30,190 APPLICATIONS DENIED 4 $122,828 12 $39,999 35 $126,747 3 $40,000 0 $0 1 $67,920 11 $35,059 APPLICATIONS WITHDRAWN 1 $59,620 2 $141,505 29 $148,103 1 $15,090 0 $0 0 $0 0 $0 FILES CLOSED FOR INCOMPLETENESS 2 $121,130 1 $107,170 4 $137,355 1 $9,060 0 $0 1 $73,210 1 $9,060
Aggregated Statistics For Year 2008(Based on 1 partial tract) A) FHA, FSA/RHS & VA B) Conventional C) Refinancings D) Home Improvement Loans E) Loans on Dwellings For 5+ Families F) Non-occupant Loans on G) Loans On Manufactured Number Average Value Number Average Value Number Average Value Number Average Value Number Average Value Number Average Value Number Average Value
LOANS ORIGINATED 26 $119,330 35 $104,537 58 $119,581 5 $20,226 1 $2,490,510 14 $106,844 8 $29,339 APPLICATIONS APPROVED, NOT ACCEPTED 3 $140,373 6 $82,262 8 $113,016 2 $55,850 0 $0 1 $66,410 3 $39,243 APPLICATIONS DENIED 6 $129,557 12 $89,872 48 $121,915 5 $13,132 1 $1,358,460 7 $111,264 8 $37,075 APPLICATIONS WITHDRAWN 2 $95,845 2 $212,825 16 $147,355 2 $52,830 1 $15,094,000 2 $77,355 0 $0 FILES CLOSED FOR INCOMPLETENESS 2 $92,075 0 $0 5 $171,468 0 $0 0 $0 0 $0 0 $0
Aggregated Statistics For Year 2007(Based on 1 partial tract) A) FHA, FSA/RHS & VA B) Conventional C) Refinancings D) Home Improvement Loans E) Loans on Dwellings For 5+ Families F) Non-occupant Loans on G) Loans On Manufactured Number Average Value Number Average Value Number Average Value Number Average Value Number Average Value Number Average Value Number Average Value
LOANS ORIGINATED 11 $140,031 52 $100,636 74 $110,390 13 $24,092 1 $679,230 22 $99,243 7 $39,137 APPLICATIONS APPROVED, NOT ACCEPTED 2 $161,885 5 $71,092 11 $102,022 6 $42,767 0 $0 1 $46,040 2 $32,450 APPLICATIONS DENIED 2 $63,395 20 $71,621 65 $122,807 14 $32,560 1 $137,360 5 $123,922 12 $38,112 APPLICATIONS WITHDRAWN 2 $69,055 8 $107,072 25 $109,462 3 $13,333 0 $0 2 $50,940 2 $75,470 FILES CLOSED FOR INCOMPLETENESS 2 $77,735 0 $0 8 $138,110 0 $0 0 $0 0 $0 0 $0
Aggregated Statistics For Year 2006(Based on 1 partial tract) A) FHA, FSA/RHS & VA B) Conventional C) Refinancings D) Home Improvement Loans E) Loans on Dwellings For 5+ Families F) Non-occupant Loans on G) Loans On Manufactured Number Average Value Number Average Value Number Average Value Number Average Value Number Average Value Number Average Value Number Average Value
LOANS ORIGINATED 17 $119,953 76 $103,583 78 $99,137 16 $27,594 2 $200,750 20 $90,564 5 $41,810 APPLICATIONS APPROVED, NOT ACCEPTED 2 $112,075 14 $81,022 14 $97,249 1 $6,040 0 $0 1 $86,040 4 $54,338 APPLICATIONS DENIED 4 $101,318 20 $88,376 56 $106,831 14 $29,164 2 $434,705 8 $126,035 10 $80,904 APPLICATIONS WITHDRAWN 2 $137,735 12 $107,985 27 $118,963 3 $45,533 0 $0 1 $143,390 1 $82,260 FILES CLOSED FOR INCOMPLETENESS 0 $0 8 $97,451 7 $104,903 1 $92,070 0 $0 0 $0 0 $0
Aggregated Statistics For Year 2005(Based on 1 partial tract) A) FHA, FSA/RHS & VA B) Conventional C) Refinancings D) Home Improvement Loans E) Loans on Dwellings For 5+ Families F) Non-occupant Loans on G) Loans On Manufactured Number Average Value Number Average Value Number Average Value Number Average Value Number Average Value Number Average Value Number Average Value
LOANS ORIGINATED 24 $136,160 97 $104,304 88 $95,461 11 $27,238 1 $144,900 25 $93,070 8 $33,584 APPLICATIONS APPROVED, NOT ACCEPTED 3 $81,003 17 $69,122 18 $95,596 2 $42,640 0 $0 1 $28,680 7 $49,487 APPLICATIONS DENIED 4 $98,865 33 $80,593 73 $105,689 16 $29,150 0 $0 5 $88,752 23 $45,512 APPLICATIONS WITHDRAWN 2 $95,845 8 $120,658 38 $117,892 8 $153,581 0 $0 1 $64,900 0 $0 FILES CLOSED FOR INCOMPLETENESS 2 $93,205 3 $129,053 5 $81,810 1 $15,090 0 $0 0 $0 0 $0
Aggregated Statistics For Year 2004(Based on 1 partial tract) A) FHA, FSA/RHS & VA B) Conventional C) Refinancings D) Home Improvement Loans E) Loans on Dwellings For 5+ Families F) Non-occupant Loans on G) Loans On Manufactured Number Average Value Number Average Value Number Average Value Number Average Value Number Average Value Number Average Value Number Average Value
LOANS ORIGINATED 20 $113,242 82 $113,960 112 $99,115 12 $36,162 2 $253,200 19 $80,078 7 $44,311 APPLICATIONS APPROVED, NOT ACCEPTED 2 $78,490 14 $73,961 20 $93,508 3 $44,277 1 $90,560 2 $32,075 3 $37,737 APPLICATIONS DENIED 5 $77,584 36 $88,237 73 $89,861 8 $25,849 0 $0 5 $117,884 29 $65,164 APPLICATIONS WITHDRAWN 1 $162,260 8 $102,828 35 $101,345 3 $62,893 0 $0 3 $93,080 1 $67,920 FILES CLOSED FOR INCOMPLETENESS 0 $0 1 $146,410 8 $104,998 0 $0 0 $0 1 $28,680 0 $0
Aggregated Statistics For Year 2003(Based on 1 partial tract) A) FHA, FSA/RHS & VA B) Conventional C) Refinancings D) Home Improvement Loans F) Non-occupant Loans on Number Average Value Number Average Value Number Average Value Number Average Value Number Average Value
LOANS ORIGINATED 23 $109,136 68 $88,311 208 $96,264 11 $33,618 11 $59,484 APPLICATIONS APPROVED, NOT ACCEPTED 1 $58,870 5 $55,848 31 $89,687 2 $97,355 0 $0 APPLICATIONS DENIED 2 $89,810 11 $80,685 72 $87,304 7 $23,611 2 $50,565 APPLICATIONS WITHDRAWN 4 $89,998 12 $87,922 44 $101,541 0 $0 4 $81,130 FILES CLOSED FOR INCOMPLETENESS 0 $0 6 $105,532 9 $111,192 2 $19,245 1 $47,550
Aggregated Statistics For Year 2002(Based on 1 partial tract) A) FHA, FSA/RHS & VA B) Conventional C) Refinancings D) Home Improvement Loans E) Loans on Dwellings For 5+ Families F) Non-occupant Loans on Number Average Value Number Average Value Number Average Value Number Average Value Number Average Value Number Average Value
LOANS ORIGINATED 21 $109,468 54 $81,927 134 $91,031 11 $19,279 2 $231,315 11 $74,578 APPLICATIONS APPROVED, NOT ACCEPTED 0 $0 7 $70,834 20 $80,640 2 $6,415 0 $0 2 $82,640 APPLICATIONS DENIED 2 $97,355 29 $44,892 51 $71,193 6 $18,742 0 $0 0 $0 APPLICATIONS WITHDRAWN 3 $121,757 5 $90,262 25 $95,726 2 $15,470 0 $0 1 $55,850 FILES CLOSED FOR INCOMPLETENESS 0 $0 2 $90,565 9 $101,213 1 $37,730 0 $0 0 $0
Aggregated Statistics For Year 2001(Based on 1 partial tract) A) FHA, FSA/RHS & VA B) Conventional C) Refinancings D) Home Improvement Loans E) Loans on Dwellings For 5+ Families F) Non-occupant Loans on Number Average Value Number Average Value Number Average Value Number Average Value Number Average Value Number Average Value
LOANS ORIGINATED 35 $107,448 103 $66,011 155 $89,386 14 $18,382 1 $293,580 20 $95,809 APPLICATIONS APPROVED, NOT ACCEPTED 4 $84,905 12 $65,659 25 $68,346 2 $30,190 0 $0 1 $52,070 APPLICATIONS DENIED 2 $73,205 66 $36,694 59 $72,119 14 $14,178 1 $2,060,330 2 $91,695 APPLICATIONS WITHDRAWN 5 $83,168 5 $95,846 26 $85,397 3 $16,353 0 $0 0 $0 FILES CLOSED FOR INCOMPLETENESS 0 $0 2 $50,565 12 $74,338 0 $0 0 $0 2 $33,585
Aggregated Statistics For Year 2000(Based on 1 partial tract) A) FHA, FSA/RHS & VA B) Conventional C) Refinancings D) Home Improvement Loans F) Non-occupant Loans on Number Average Value Number Average Value Number Average Value Number Average Value Number Average Value
LOANS ORIGINATED 44 $94,029 100 $62,504 53 $66,812 12 $17,861 6 $61,382 APPLICATIONS APPROVED, NOT ACCEPTED 0 $0 29 $56,654 17 $79,155 4 $28,868 0 $0 APPLICATIONS DENIED 6 $81,005 156 $44,150 48 $55,958 14 $12,991 7 $32,560 APPLICATIONS WITHDRAWN 2 $112,450 8 $42,358 20 $77,206 1 $7,550 2 $29,055 FILES CLOSED FOR INCOMPLETENESS 0 $0 0 $0 5 $54,188 2 $28,300 0 $0
Aggregated Statistics For Year 1999(Based on 1 partial tract) A) FHA, FSA/RHS & VA B) Conventional C) Refinancings D) Home Improvement Loans F) Non-occupant Loans on Number Average Value Number Average Value Number Average Value Number Average Value Number Average Value
LOANS ORIGINATED 22 $94,425 126 $60,136 74 $76,651 15 $14,988 11 $72,624 APPLICATIONS APPROVED, NOT ACCEPTED 1 $167,870 20 $46,350 25 $65,408 4 $19,110 0 $0 APPLICATIONS DENIED 1 $68,940 142 $39,586 53 $52,812 9 $14,988 7 $41,003 APPLICATIONS WITHDRAWN 0 $0 16 $73,488 27 $64,726 0 $0 0 $0 FILES CLOSED FOR INCOMPLETENESS 1 $56,950 4 $96,298 4 $58,452 0 $0 0 $0
Detailed HMDA statistics for the following Tracts:
0207.00
Private Mortgage Insurance Companies Aggregated Statistics For Year 2009(Based on 1 partial tract) A) Conventional B) Refinancings Number Average Value Number Average Value
LOANS ORIGINATED 2 $113,205 3 $153,457 APPLICATIONS APPROVED, NOT ACCEPTED 0 $0 2 $140,750 APPLICATIONS DENIED 0 $0 0 $0 APPLICATIONS WITHDRAWN 0 $0 0 $0 FILES CLOSED FOR INCOMPLETENESS 0 $0 0 $0
Aggregated Statistics For Year 2008(Based on 1 partial tract) A) Conventional B) Refinancings C) Non-occupant Loans on Number Average Value Number Average Value Number Average Value
LOANS ORIGINATED 3 $142,890 7 $173,904 0 $0 APPLICATIONS APPROVED, NOT ACCEPTED 1 $83,770 4 $170,750 0 $0 APPLICATIONS DENIED 0 $0 1 $81,510 1 $81,510 APPLICATIONS WITHDRAWN 2 $61,130 1 $185,660 0 $0 FILES CLOSED FOR INCOMPLETENESS 0 $0 0 $0 0 $0
Aggregated Statistics For Year 2007(Based on 1 partial tract) A) Conventional B) Refinancings C) Non-occupant Loans on Number Average Value Number Average Value Number Average Value
LOANS ORIGINATED 20 $120,073 8 $132,732 1 $63,390 APPLICATIONS APPROVED, NOT ACCEPTED 1 $64,900 2 $103,395 0 $0 APPLICATIONS DENIED 1 $78,490 0 $0 0 $0 APPLICATIONS WITHDRAWN 1 $76,220 2 $100,750 0 $0 FILES CLOSED FOR INCOMPLETENESS 0 $0 0 $0 0 $0
Aggregated Statistics For Year 2006(Based on 1 partial tract) A) Conventional B) Refinancings Number Average Value Number Average Value
LOANS ORIGINATED 14 $110,671 6 $164,650 APPLICATIONS APPROVED, NOT ACCEPTED 2 $101,885 2 $169,810 APPLICATIONS DENIED 0 $0 0 $0 APPLICATIONS WITHDRAWN 0 $0 1 $85,280 FILES CLOSED FOR INCOMPLETENESS 1 $144,150 0 $0
Aggregated Statistics For Year 2005(Based on 1 partial tract) A) Conventional B) Refinancings C) Non-occupant Loans on Number Average Value Number Average Value Number Average Value
LOANS ORIGINATED 11 $126,515 5 $106,110 2 $58,110 APPLICATIONS APPROVED, NOT ACCEPTED 1 $118,490 1 $83,020 0 $0 APPLICATIONS DENIED 1 $58,110 0 $0 1 $58,110 APPLICATIONS WITHDRAWN 1 $146,410 0 $0 0 $0 FILES CLOSED FOR INCOMPLETENESS 0 $0 0 $0 0 $0
Aggregated Statistics For Year 2004(Based on 1 partial tract) A) Conventional B) Refinancings Number Average Value Number Average Value
LOANS ORIGINATED 10 $131,997 9 $117,062 APPLICATIONS APPROVED, NOT ACCEPTED 2 $147,165 2 $73,205 APPLICATIONS DENIED 0 $0 0 $0 APPLICATIONS WITHDRAWN 1 $101,880 1 $104,150 FILES CLOSED FOR INCOMPLETENESS 0 $0 0 $0
Aggregated Statistics For Year 2003(Based on 1 partial tract) A) Conventional B) Refinancings C) Non-occupant Loans on Number Average Value Number Average Value Number Average Value
LOANS ORIGINATED 9 $99,620 20 $112,828 1 $49,810 APPLICATIONS APPROVED, NOT ACCEPTED 2 $186,790 4 $105,658 0 $0 APPLICATIONS DENIED 0 $0 0 $0 0 $0 APPLICATIONS WITHDRAWN 0 $0 2 $133,580 0 $0 FILES CLOSED FOR INCOMPLETENESS 0 $0 0 $0 0 $0
Aggregated Statistics For Year 2002(Based on 1 partial tract) A) Conventional B) Refinancings C) Non-occupant Loans on Number Average Value Number Average Value Number Average Value
LOANS ORIGINATED 9 $108,844 19 $110,742 1 $76,980 APPLICATIONS APPROVED, NOT ACCEPTED 1 $63,390 4 $126,035 1 $67,920 APPLICATIONS DENIED 0 $0 1 $54,340 0 $0 APPLICATIONS WITHDRAWN 0 $0 2 $81,885 0 $0 FILES CLOSED FOR INCOMPLETENESS 0 $0 0 $0 0 $0
Aggregated Statistics For Year 2001(Based on 1 partial tract) A) Conventional B) Refinancings C) Non-occupant Loans on Number Average Value Number Average Value Number Average Value
LOANS ORIGINATED 13 $91,493 14 $109,916 0 $0 APPLICATIONS APPROVED, NOT ACCEPTED 3 $143,643 5 $97,206 0 $0 APPLICATIONS DENIED 0 $0 0 $0 0 $0 APPLICATIONS WITHDRAWN 1 $44,530 1 $92,070 1 $44,530 FILES CLOSED FOR INCOMPLETENESS 0 $0 0 $0 0 $0
Aggregated Statistics For Year 2000(Based on 1 partial tract) A) Conventional B) Refinancings C) Non-occupant Loans on Number Average Value Number Average Value Number Average Value
LOANS ORIGINATED 8 $111,979 4 $91,885 1 $62,640 APPLICATIONS APPROVED, NOT ACCEPTED 0 $0 2 $141,505 0 $0 APPLICATIONS DENIED 0 $0 1 $67,170 0 $0 APPLICATIONS WITHDRAWN 1 $138,860 0 $0 0 $0 FILES CLOSED FOR INCOMPLETENESS 0 $0 0 $0 0 $0
Aggregated Statistics For Year 1999(Based on 1 partial tract) A) Conventional B) Refinancings Number Average Value Number Average Value
LOANS ORIGINATED 16 $113,909 9 $76,189 APPLICATIONS APPROVED, NOT ACCEPTED 0 $0 1 $113,910 APPLICATIONS DENIED 1 $61,450 1 $54,710 APPLICATIONS WITHDRAWN 1 $57,700 0 $0 FILES CLOSED FOR INCOMPLETENESS 0 $0 0 $0
Detailed PMIC statistics for the following Tracts:
0207.00
Fire-safe hotels and motels in Shepherdsville, Kentucky:
Ramada Limited Motel, I-65 & Hwy 44, Shepherdsville, Kentucky 40165 Phone: (502) 543-2291
Best Western Motel, 211 Lakeview Dr, Shepherdsville, Kentucky 40165 Phone: (502) 543-7097
Comfort Inn Louisville South, 191 Brenton Way, Shepherdsville, Kentucky 41065 Phone: (502) 955-5566, Fax: (502) 955-5588
Super 8 Shepardsville, 275 Keystone Crossroads, Shepherdsville, Kentucky 40165 Phone: (502) 543-8870, Fax: (502) 921-2123
Holiday Inn Express, 365 Brenton Way, Shepherdsville, Kentucky 40165 Phone: (502) 439-7665, Fax: (502) 805-0804
Country Inn & Suites - Shepherdsville, 400 Paroquet Spgs, Shepherdsville, Kentucky 40165 Phone: (502) 543-8400, Fax: (502) 543-8469
Sleep Inn & Suites, 130 Spg Pointe Dr, Shepherdsville, Kentucky 40165 Phone: (502) 921-1001
Tru by Hilton Shepherdsville Louisville South, 191 Ctr Dr, Shepherdsville, Kentucky 40165 Phone: (502) 890-2055, Fax: (502) 890-2056
Country Inn And Suites Louisville South, 400 Paroquet Springs Dr, Shepherdsville, Kentucky 40165 Phone: (502) 543-8400, Fax: (502) 543-8469
All 9 fire-safe hotels and motels in Shepherdsville, Kentucky Shepherdsville compared to Kentucky state average:
Unemployed percentage significantly below state average. Black race population percentage significantly below state average. Median age significantly below state average. Foreign-born population percentage below state average. House age below state average. Shepherdsville on our top lists :
#28 on the list of "Top 101 cities with largest percentage of females in occupations: office and administrative support occupations (population 5,000+)"
#62 on the list of "Top 101 cities with largest percentage of males in industries: transportation and warehousing (population 5,000+)"
#15 on the list of "Top 101 counties with the smallest number of people without health insurance coverage in 2000 (pop. 50,000+)"
#20 on the list of "Top 101 counties with the largest increase in the number of deaths per 1000 residents 2000-2006 to 2007-2013 (pop. 50,000+)"
Top Patent Applicants
Stephen Bernard Froelicher (17)
Steve B. Froelicher (7)
Cecilia Maria Thomas (6)
Adam Montoya (4)
Stephen Froelicher (4)
Coty T. Coots (4)
Scott Charles Myers (2)
Cindy Peck (2)
Andre' M. Gobin (2)
Jeremy Wooldridge (2)
Total of 67 patent applications in 2008-2024.
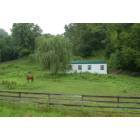
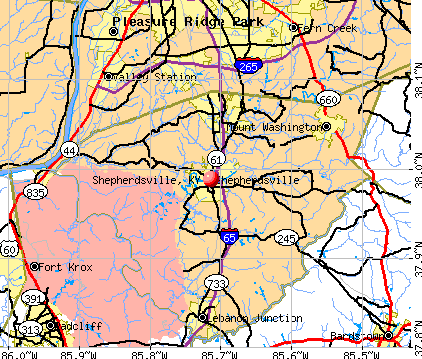


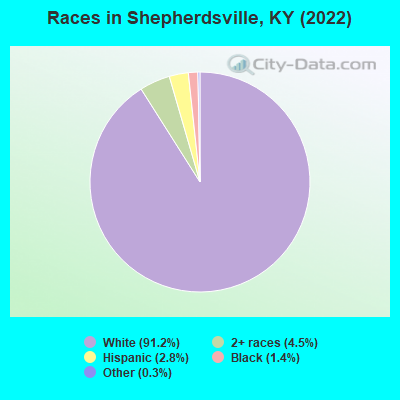
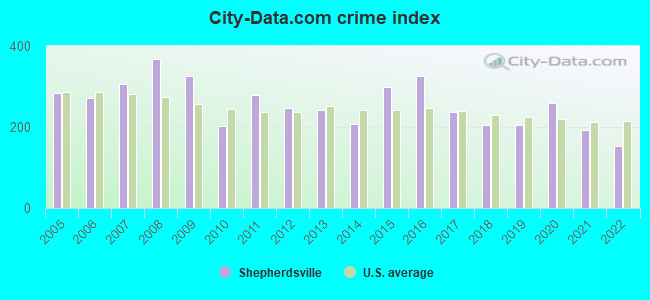
 Recent articles from our blog. Our writers, many of them Ph.D. graduates or candidates, create easy-to-read articles on a wide variety of topics.

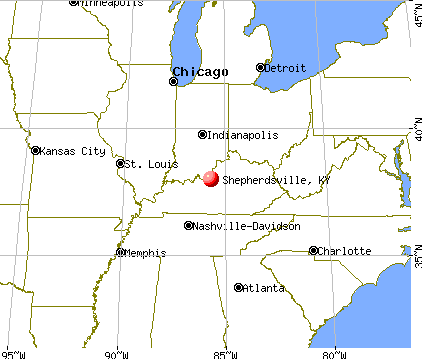
 (16.8 miles
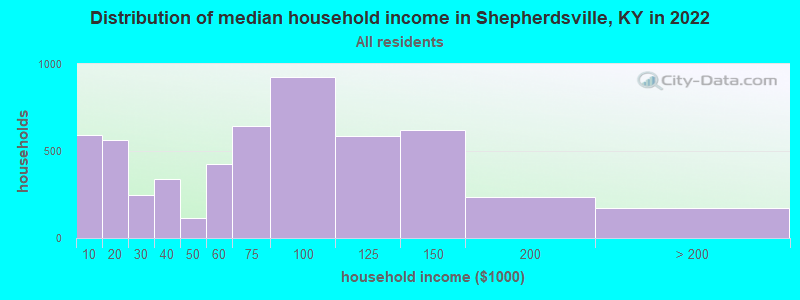
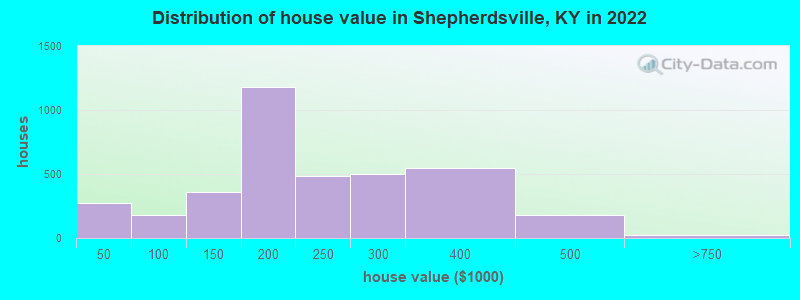

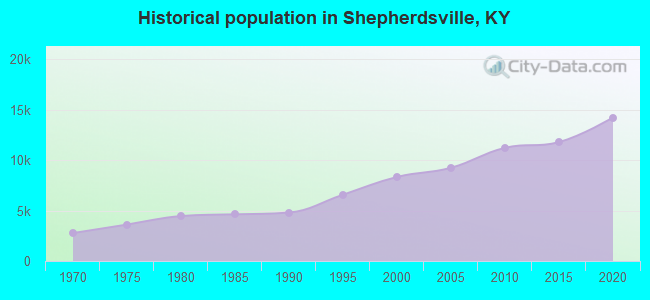
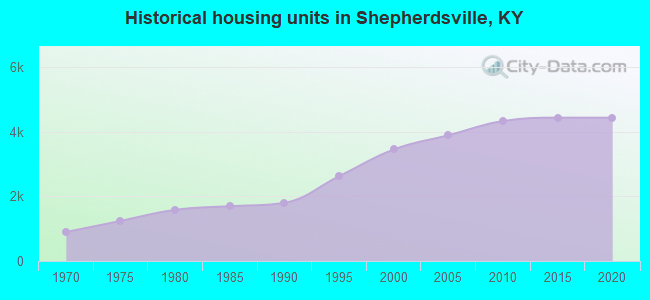
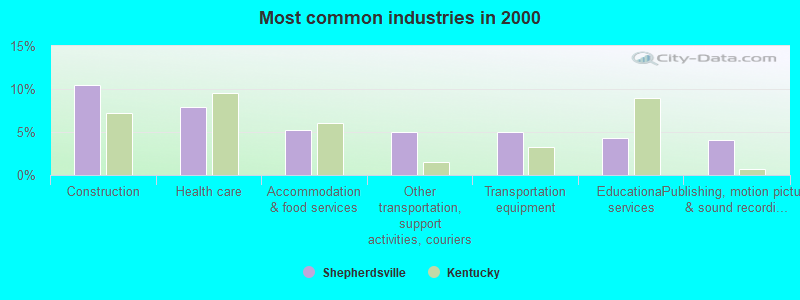
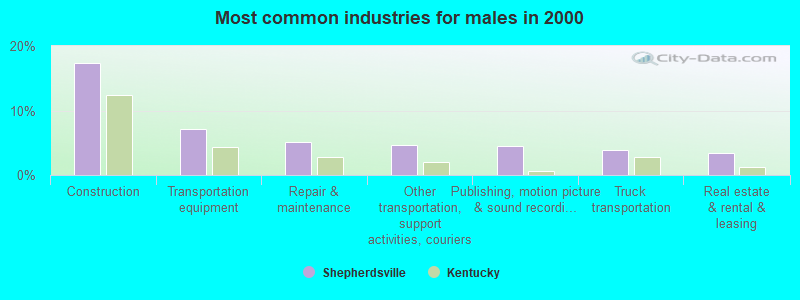
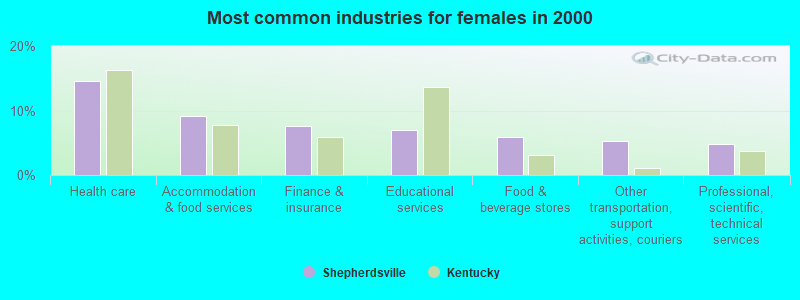
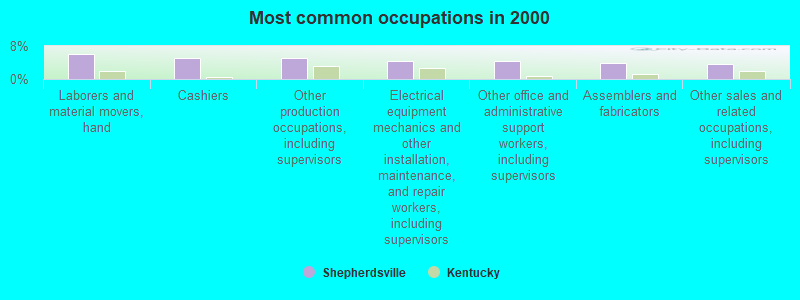
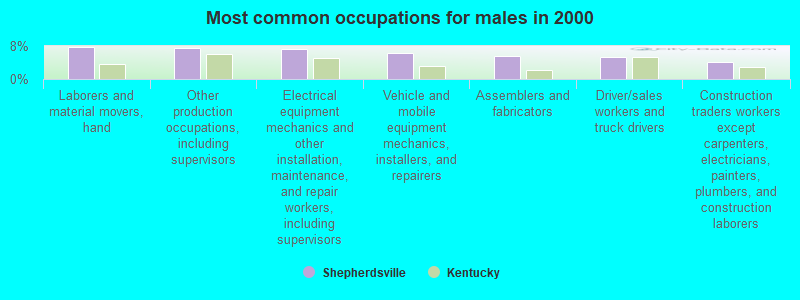
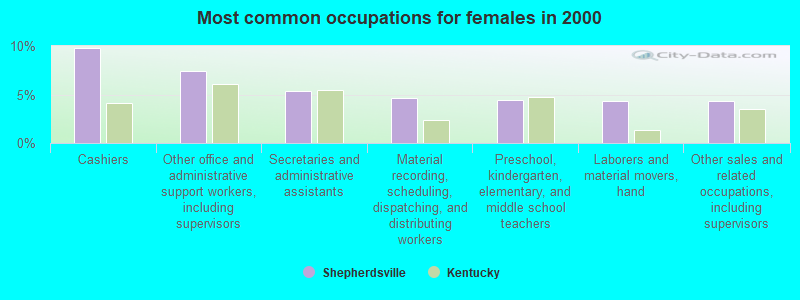


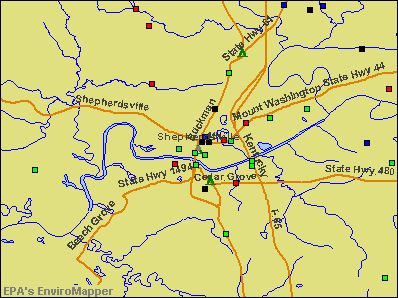

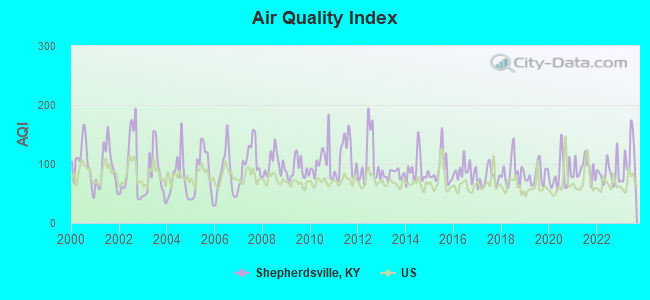
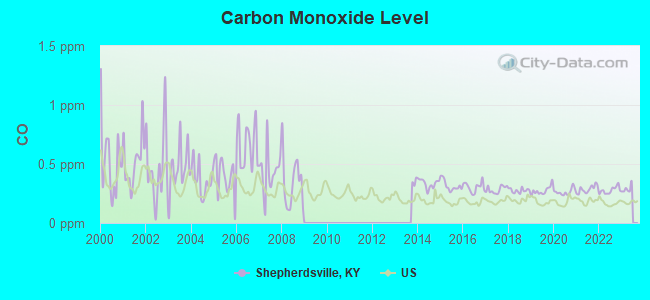
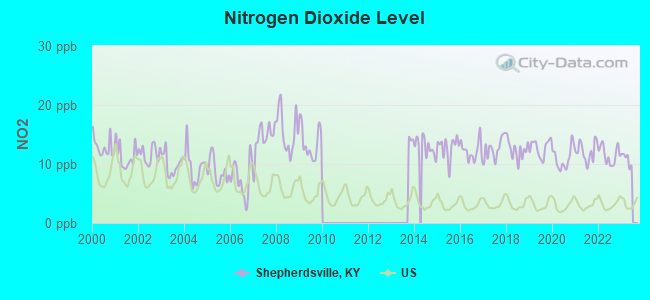
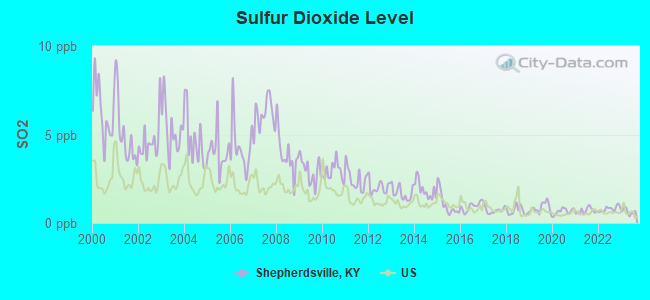
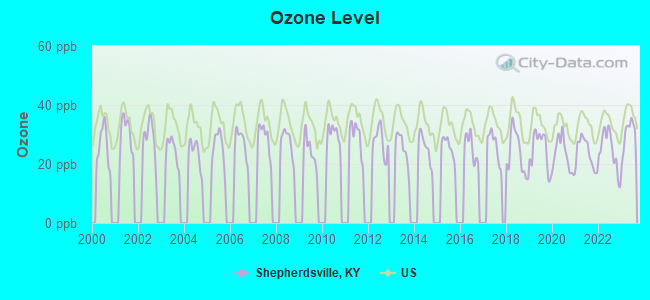
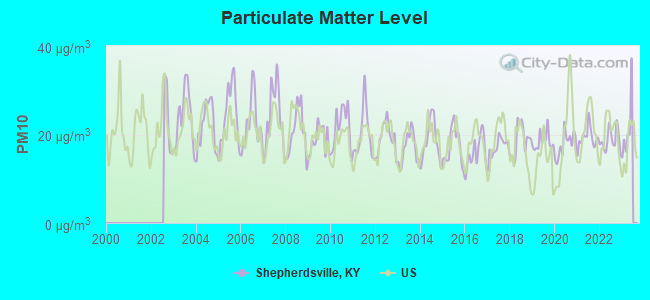
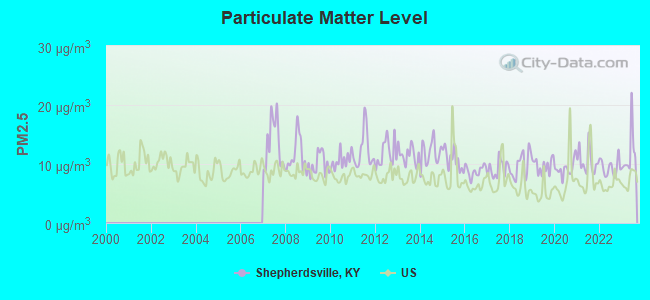

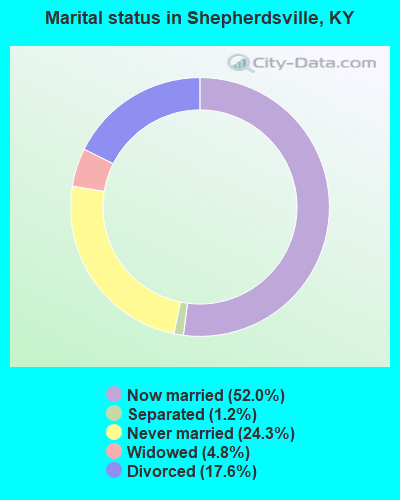
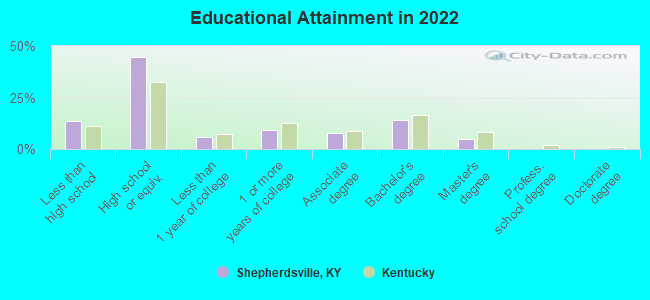
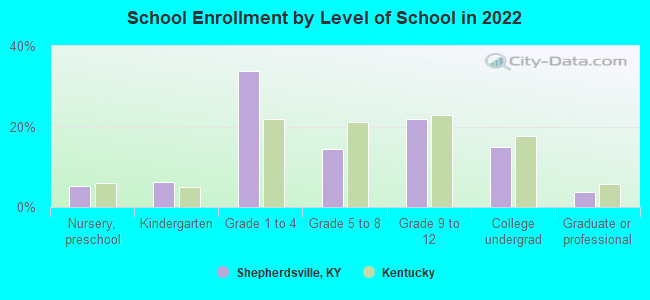
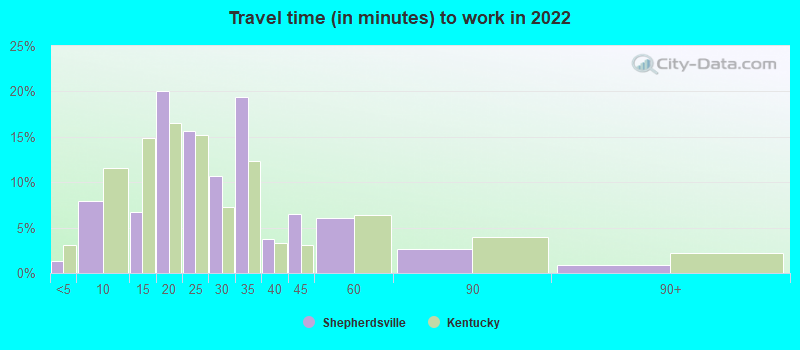
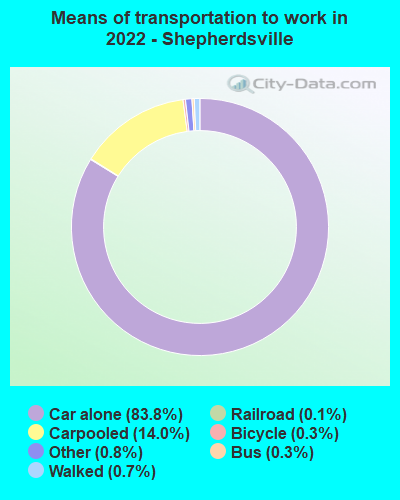
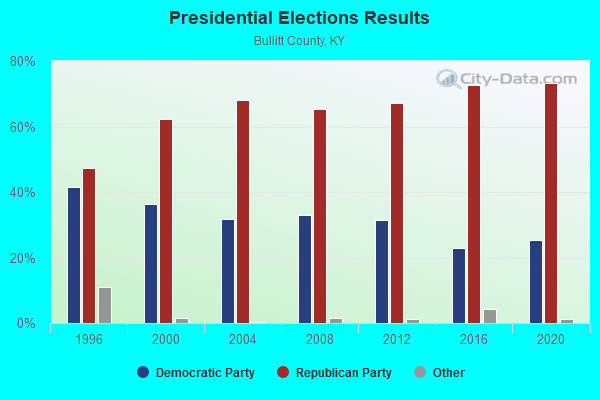
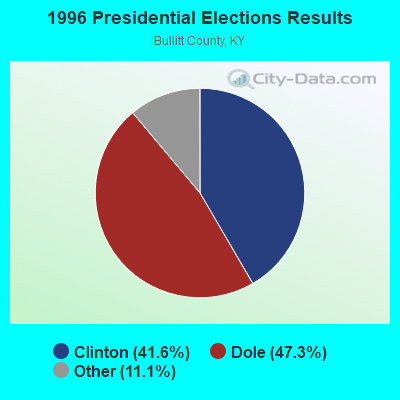
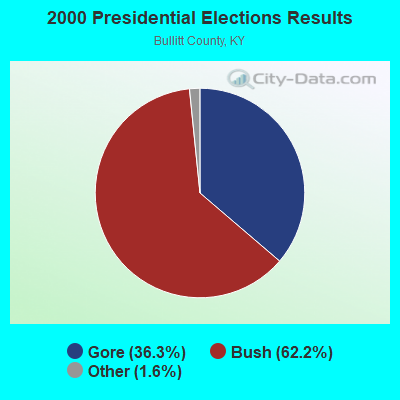
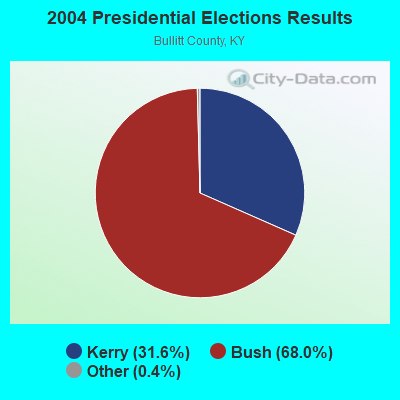


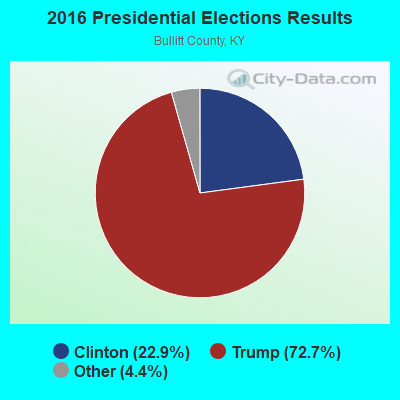
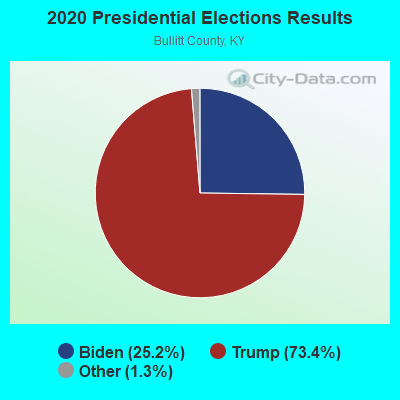
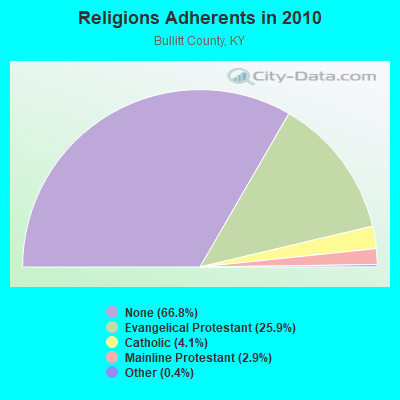
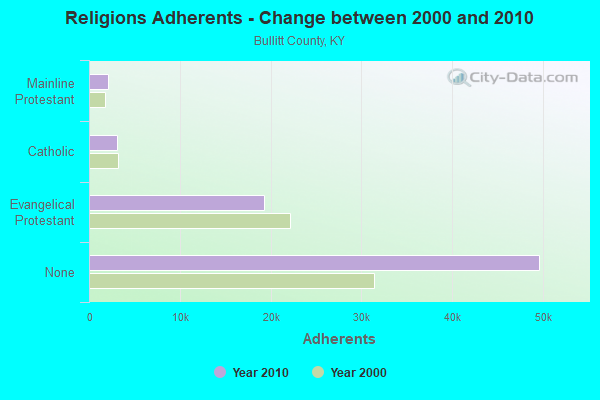
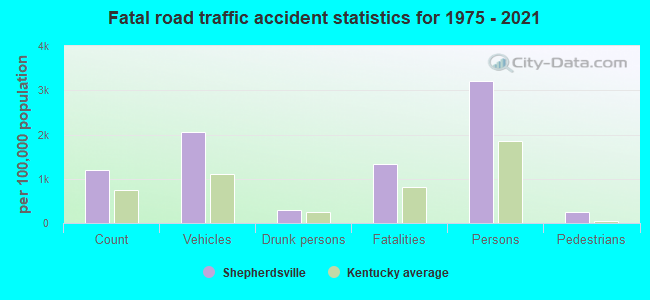
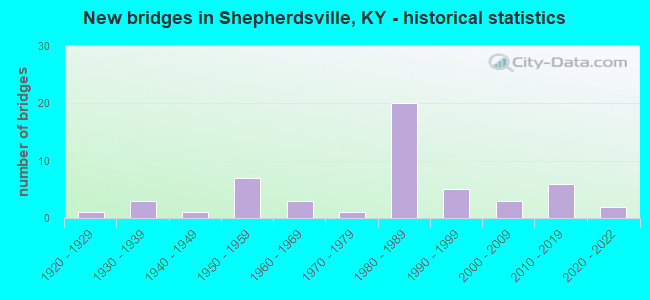
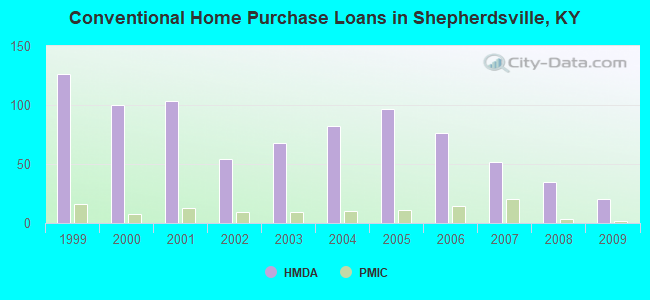
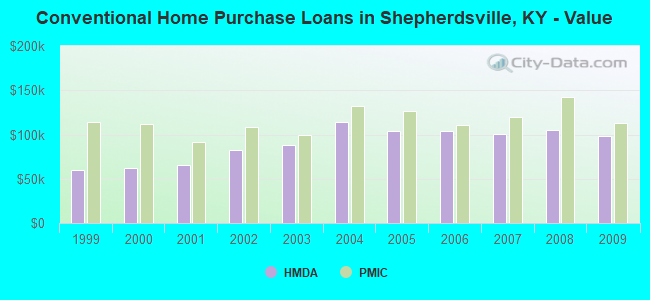
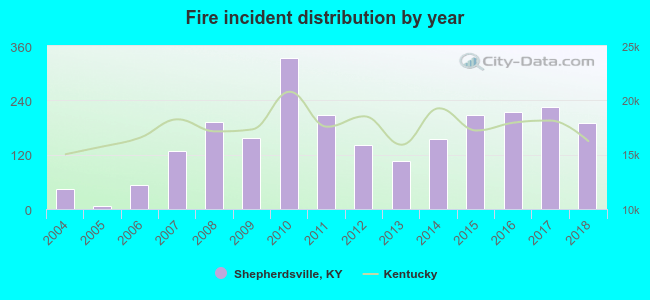 According to the data from the years 2004 - 2018 the average number of fires per year is 158. The highest number of fires - 333 took place in 2010, and the least - 6 in 2005. The data has a rising trend.
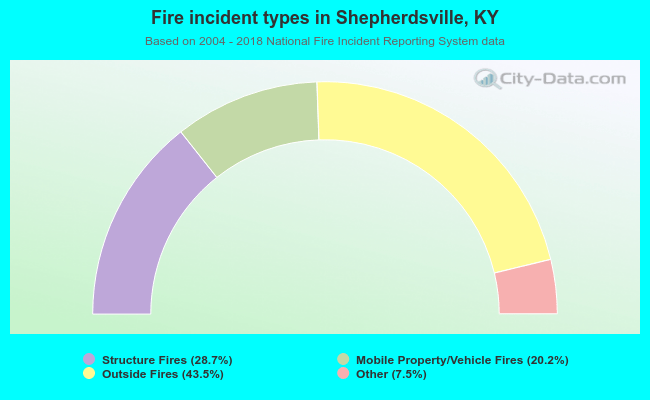 When looking into fire subcategories, the most reports belonged to: Outside Fires (43.5%), and Structure Fires (28.7%).