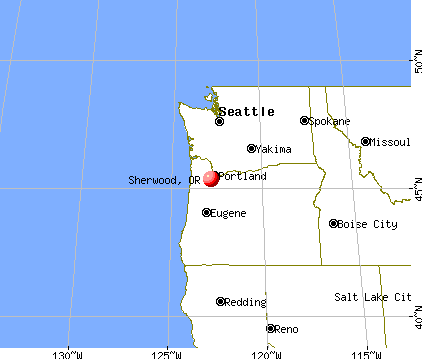
Sherwood, Oregon

Sherwood: Sunset in Sherwood, Highpoint Construction, inc
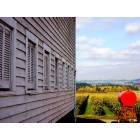
Sherwood: Farm/Fall/Vineyard What an Amazing Mix
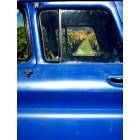
Sherwood: A peak of the vineyard through the old blue truck

Sherwood: Sherwood Sunset: by living green remodeling
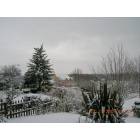
Sherwood: Snow day, in Sherwood!

Sherwood: Beautful Oregon Clusters
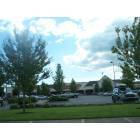
Sherwood: A Safeway in Sherwood
- add
your
Submit your own pictures of this city and show them to the world
- OSM Map
- General Map
- Google Map
- MSN Map
Population change since 2000: +69.9%
| Males: 9,951 | |
| Females: 10,079 |
| Median resident age: | 37.1 years |
| Oregon median age: | 40.5 years |
Zip codes: 97140.
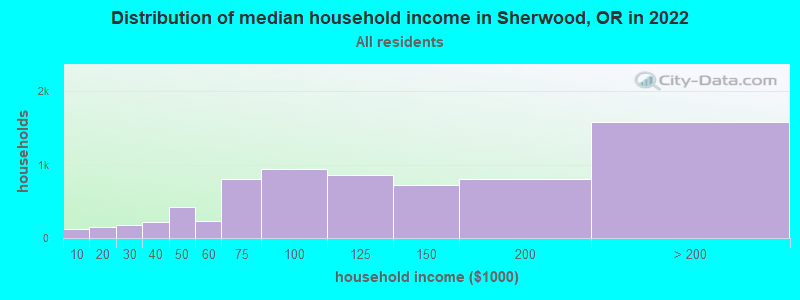
| Sherwood: | $108,438 |
| OR: | $75,657 |
Estimated per capita income in 2022: $48,650 (it was $25,793 in 2000)
Sherwood city income, earnings, and wages data
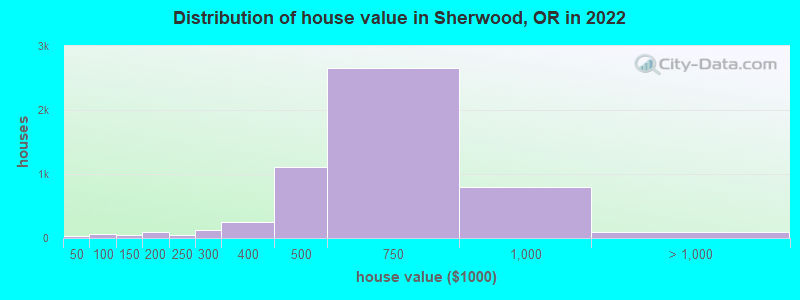
Estimated median house or condo value in 2022: $607,095 (it was $181,500 in 2000)
| Sherwood: | $607,095 |
| OR: | $475,600 |
Mean prices in 2022: all housing units: $574,886; detached houses: $606,940; townhouses or other attached units: $429,421; in 3-to-4-unit structures: $377,873; in 5-or-more-unit structures: $195,139; mobile homes: $139,740
Median gross rent in 2022: $1,982.
(5.0% for White Non-Hispanic residents, 3.0% for Hispanic or Latino residents, 1.4% for two or more races residents)
Detailed information about poverty and poor residents in Sherwood, OR


Compare current foreclosures in Sherwood, OR:
| Photo | Address | Area | Beds / Baths | Price | Details |
|---|---|---|---|---|---|

|
#1
SW Baler Way
Sherwood, OR 97140
|
1,894 sq. feet
|
3 baths 4 beds |
show details | |

|
#2
SW Thrasher Way
Sherwood, OR 97140
|
1,192 sq. feet
|
2 baths 3 beds |
show details | |

|
#3
SW Alexander Ln
Sherwood, OR 97140
|
1,853 sq. feet
|
3 baths 3 beds |
show details | |

|
#4
SW Madrona Ln
Sherwood, OR 97140
|
2,408 sq. feet
|
2 baths 2 beds |
show details | |

|
#5
SW Elder View Dr
Sherwood, OR 97140
|
2,514 sq. feet
|
3 baths 5 beds |
show details | |

|
#6
SW Brookman Rd
Sherwood, OR 97140
|
1,796 sq. feet
|
2 baths 3 beds |
show details | |

|
#7
SW Shady Grove Dr
Sherwood, OR 97140
|
1,678 sq. feet
|
2 baths 3 beds |
show details | |

|
#8
SW Glenco Ct
Sherwood, OR 97140
|
975 sq. feet
|
1 baths 1 beds |
show details | |

|
#9
SW Noble Fir Ct
Sherwood, OR 97140
|
2,855 sq. feet
|
3 baths 4 beds |
show details | |

|
#10
SW Orland St
Sherwood, OR 97140
|
1,490 sq. feet
|
2 baths 3 beds |
show details |
| Photo | Address | Area | Beds / Baths | Price | Details |
|---|---|---|---|---|---|

|
#11
SW Sir Lancelot Ln
Sherwood, OR 97140
|
2,524 sq. feet
|
3 baths 4 beds |
show details | |

|
#12
SW Belton Rd
Sherwood, OR 97140
|
3,456 sq. feet
|
3 baths 3 beds |
show details | |

|
#13
SW Keda Ct
Sherwood, OR 97140
|
1,611 sq. feet
|
3 baths 3 beds |
show details | |

|
#14
SW Cinnamon Hill Pl
Sherwood, OR 97140
|
1,300 sq. feet
|
2 baths 3 beds |
show details | |

|
#15
SW William Ave
Sherwood, OR 97140
|
1,464 sq. feet
|
3 baths 3 beds |
show details | |

|
#16
SW Madrona Ln
Sherwood, OR 97140
|
1,546 sq. feet
|
3 baths 3 beds |
show details | |

|
#17
SW Crestmont Pl
Sherwood, OR 97140
|
1,709 sq. feet
|
3 baths 3 beds |
show details | |

|
#18
SW Duckridge Pl
Sherwood, OR 97140
|
1,927 sq. feet
|
3 baths 3 beds |
show details | |

|
#19
SW Shady Grove Dr
Sherwood, OR 97140
|
2,234 sq. feet
|
3 baths 3 beds |
show details | |

|
#20
SW Elder View Dr
Sherwood, OR 97140
|
2,388 sq. feet
|
3 baths 4 beds |
show details |
| Photo | Address | Area | Beds / Baths | Price | Details |
|---|---|---|---|---|---|

|
#21
SW Lynnly Way
Sherwood, OR 97140
|
1,427 sq. feet
|
2 baths 3 beds |
show details | |

|
#22
SW Smith Ave Unit 21
Sherwood, OR 97140
|
1,510 sq. feet
|
2 baths 3 beds |
show details | |

|
#23
SW Trails End Dr
Sherwood, OR 97140
|
1,507 sq. feet
|
2 baths 3 beds |
show details | |

|
#24
SW Melissa Pl
Sherwood, OR 97140
|
602 sq. feet
|
2 baths 2 beds |
show details | |

|
#25
SW Willamette St
Sherwood, OR 97140
|
1,788 sq. feet
|
2 baths 3 beds |
show details | |

|
#26
SW Swanstrom Dr
Sherwood, OR 97140
|
1,647 sq. feet
|
3 baths 4 beds |
show details | |

|
#27
SW Aubergine Ter
Sherwood, OR 97140
|
- sq. feet
|
4 baths 3 beds |
show details | |

|
#28
SW Melissa Pl
Sherwood, OR 97140
|
1,296 sq. feet
|
2 baths - beds |
show details | |

|
#29
SW Fletcher Ter
Sherwood, OR 97140
|
- sq. feet
|
- baths - beds |
show details | |

|
#30
SW Brittany Pl
Sherwood, OR 97140
|
- sq. feet
|
- baths - beds |
show details |
| Photo | Address | Area | Beds / Baths | Price | Details |
|---|---|---|---|---|---|

|
#31
SW Borchers Dr
Sherwood, OR 97140
|
64,628 sq. feet
|
- baths - beds |
show details | |

|
#32
SW Sequoia Ter
Sherwood, OR 97140
|
- sq. feet
|
- baths - beds |
show details | |

|
#33
SW 12th St Ste D
Sherwood, OR 97140
|
- sq. feet
|
- baths - beds |
show details | |

|
#34
SW Highland Dr Apt 110
Sherwood, OR 97140
|
- sq. feet
|
- baths - beds |
show details | |

|
#35
SW Forest Creek Dr Unit 201
Sherwood, OR 97140
|
- sq. feet
|
- baths - beds |
show details | |

|
#36
SW Century Dr Apt 153
Sherwood, OR 97140
|
- sq. feet
|
- baths - beds |
show details | |

|
#37
SW Forest Creek Dr Unit 201
Sherwood, OR 97140
|
- sq. feet
|
- baths - beds |
show details | |

|
#38
SW Aubergine Ter
Sherwood, OR 97140
|
- sq. feet
|
- baths - beds |
show details | |

|
#39
SW Ladd Hill Rd
Sherwood, OR 97140
|
- sq. feet
|
- baths - beds |
show details | |

|
Check over 1 million property listings on Foreclosure.com!
|
browse all offers | |||


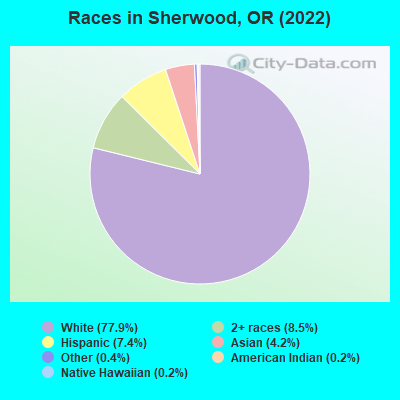
- 15,82077.9%White alone
- 1,7248.5%Two or more races
- 1,5117.4%Hispanic
- 8524.2%Asian alone
- 810.4%Other race alone
- 470.2%American Indian alone
- 360.2%Native Hawaiian and Other
Pacific Islander alone
Races in Sherwood detailed stats: ancestries, foreign born residents, place of birth
According to our research of Oregon and other state lists, there was 1 registered sex offender living in Sherwood, Oregon as of June 16, 2024.
The ratio of all residents to sex offenders in Sherwood is 19,593 to 1.
The ratio of registered sex offenders to all residents in this city is much lower than the state average.
Type |
2009 |
2010 |
2011 |
2012 |
2013 |
2014 |
2015 |
2016 |
2017 |
2018 |
2019 |
2020 |
2021 |
2022 |
|---|---|---|---|---|---|---|---|---|---|---|---|---|---|---|
| Murders (per 100,000) | 0 (0.0) | 0 (0.0) | 1 (5.4) | 0 (0.0) | 0 (0.0) | 1 (5.3) | 0 (0.0) | 0 (0.0) | 0 (0.0) | 0 (0.0) | 0 (0.0) | 0 (0.0) | 0 (0.0) | 0 (0.0) |
| Rapes (per 100,000) | 2 (11.0) | 5 (27.5) | 4 (21.8) | 6 (32.1) | 2 (10.6) | 1 (5.3) | 0 (0.0) | 7 (35.9) | 10 (51.4) | 6 (30.5) | 2 (10.1) | 2 (10.0) | 9 (45.3) | 11 (54.7) |
| Robberies (per 100,000) | 4 (22.1) | 1 (5.5) | 1 (5.4) | 2 (10.7) | 2 (10.6) | 1 (5.3) | 0 (0.0) | 1 (5.1) | 2 (10.3) | 4 (20.4) | 0 (0.0) | 4 (19.9) | 2 (10.1) | 3 (14.9) |
| Assaults (per 100,000) | 5 (27.6) | 3 (16.5) | 1 (5.4) | 3 (16.0) | 4 (21.1) | 3 (15.8) | 1 (5.2) | 6 (30.8) | 4 (20.5) | 5 (25.4) | 13 (65.4) | 6 (29.9) | 13 (65.4) | 26 (129.3) |
| Burglaries (per 100,000) | 27 (149.1) | 25 (137.4) | 14 (76.1) | 26 (139.0) | 31 (163.7) | 25 (131.3) | 4 (20.9) | 20 (102.6) | 15 (77.0) | 14 (71.3) | 20 (100.7) | 16 (79.8) | 18 (90.5) | 25 (124.4) |
| Thefts (per 100,000) | 195 (1,077) | 170 (934.4) | 161 (875.6) | 214 (1,144) | 260 (1,373) | 249 (1,308) | 51 (266.3) | 190 (975.1) | 198 (1,017) | 176 (895.8) | 196 (986.7) | 224 (1,117) | 307 (1,544) | 384 (1,910) |
| Auto thefts (per 100,000) | 1 (5.5) | 4 (22.0) | 7 (38.1) | 4 (21.4) | 10 (52.8) | 6 (31.5) | 1 (5.2) | 15 (77.0) | 15 (77.0) | 14 (71.3) | 12 (60.4) | 25 (124.7) | 16 (80.5) | 38 (189.0) |
| Arson (per 100,000) | 1 (5.5) | 1 (5.5) | 4 (21.8) | 5 (26.7) | 3 (15.8) | 8 (42.0) | 1 (5.2) | 3 (15.4) | 1 (5.1) | 0 (0.0) | 0 (0.0) | 0 (0.0) | 0 (0.0) | 0 (0.0) |
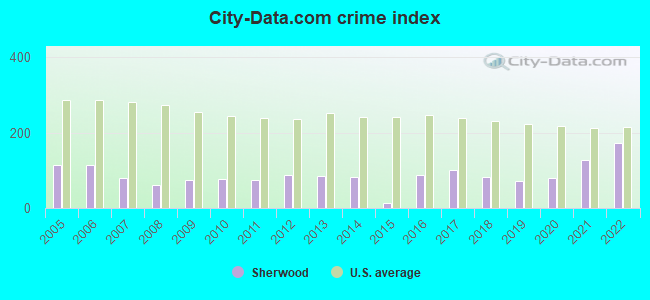
| City-Data.com crime index | 74.9 | 75.7 | 74.4 | 89.3 | 86.5 | 83.5 | 13.6 | 88.8 | 100.5 | 82.1 | 72.5 | 80.2 | 126.8 | 174.4 |
The City-Data.com crime index weighs serious crimes and violent crimes more heavily. Higher means more crime, U.S. average is 246.1. It adjusts for the number of visitors and daily workers commuting into cities.
Crime rate in Sherwood detailed stats: murders, rapes, robberies, assaults, burglaries, thefts, arson
Full-time law enforcement employees in 2021, including police officers: 28 (24 officers - 22 male; 2 female).
| Officers per 1,000 residents here: | 1.21 |
| Oregon average: | 1.48 |
 Recent articles from our blog. Our writers, many of them Ph.D. graduates or candidates, create easy-to-read articles on a wide variety of topics.

 | Sherwood, Beverton or ? (2 replies) |
| Place to live in Sherwood or near it (2 replies) |
| Long Distance Sherwood Recommendations? (21 replies) |
| Is Sherwood family friendly/"up and coming"? Other suburbs or hidden gems that locals can help with :)?? Thanks! (5 replies) |
| Sherwood, Tigard, or Tualatin? (3 replies) |
| Tualatin or Sherwood!? (11 replies) |
Latest news from Sherwood, OR collected exclusively by city-data.com from local newspapers, TV, and radio stations
Sherwood, OR City Guides:
Ancestries: German (12.2%), English (11.4%), European (10.0%), American (8.5%), Irish (5.4%), Iranian (2.6%).
Current Local Time: PST time zone
Incorporated in 1893
Elevation: 205 feet
Land area: 4.07 square miles.
Population density: 4,919 people per square mile (average).
1,967 residents are foreign born (5.3% Asia, 2.0% Latin America, 1.4% Europe).
| This city: | 9.7% |
| Oregon: | 9.8% |
Median real estate property taxes paid for housing units with mortgages in 2022: $5,046 (0.8%)
Median real estate property taxes paid for housing units with no mortgage in 2022: $4,888 (0.8%)
Nearest city with pop. 50,000+: Beaverton, OR  (8.6 miles , pop. 76,129).
Nearest city with pop. 200,000+: Northwest Clackamas, OR (11.2 miles , pop. 224,220).
Nearest city with pop. 1,000,000+: Los Angeles, CA (814.6 miles , pop. 3,694,820).
Nearest cities:
), ), ), ), ), )Latitude: 45.36 N, Longitude: 122.84 W
Daytime population change due to commuting: -2,017 (-9.9%)
Workers who live and work in this city: 4,074 (39.7%)
Area codes: 503, 971
Property values in Sherwood, OR
Sherwood, Oregon accommodation & food services, waste management - Economy and Business Data
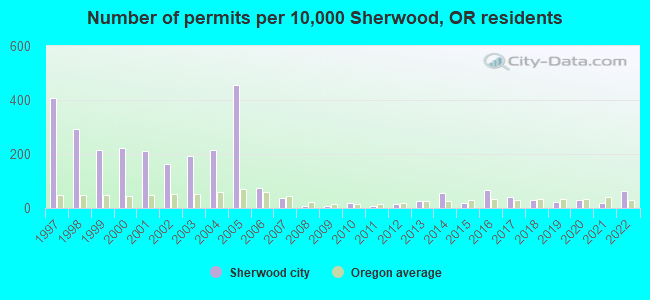
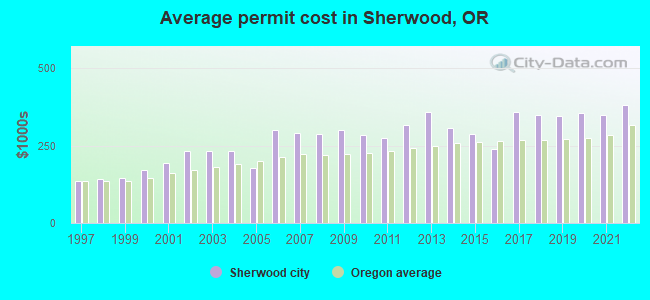
Single-family new house construction building permits:
- 2022: 75 buildings, average cost: $381,500
- 2021: 21 buildings, average cost: $349,900
- 2020: 36 buildings, average cost: $356,300
- 2019: 26 buildings, average cost: $344,000
- 2018: 37 buildings, average cost: $350,200
- 2017: 46 buildings, average cost: $357,900
- 2016: 78 buildings, average cost: $240,400
- 2015: 20 buildings, average cost: $286,000
- 2014: 65 buildings, average cost: $305,600
- 2013: 29 buildings, average cost: $357,100
- 2012: 15 buildings, average cost: $317,100
- 2011: 11 buildings, average cost: $275,600
- 2010: 22 buildings, average cost: $285,100
- 2009: 7 buildings, average cost: $298,800
- 2008: 11 buildings, average cost: $288,300
- 2007: 45 buildings, average cost: $289,200
- 2006: 87 buildings, average cost: $299,100
- 2005: 537 buildings, average cost: $175,900
- 2004: 254 buildings, average cost: $232,300
- 2003: 227 buildings, average cost: $232,800
- 2002: 193 buildings, average cost: $232,400
- 2001: 250 buildings, average cost: $192,800
- 2000: 261 buildings, average cost: $172,000
- 1999: 255 buildings, average cost: $145,500
- 1998: 345 buildings, average cost: $141,600
- 1997: 479 buildings, average cost: $133,600
| Here: | 3.4% |
| Oregon: | 3.9% |
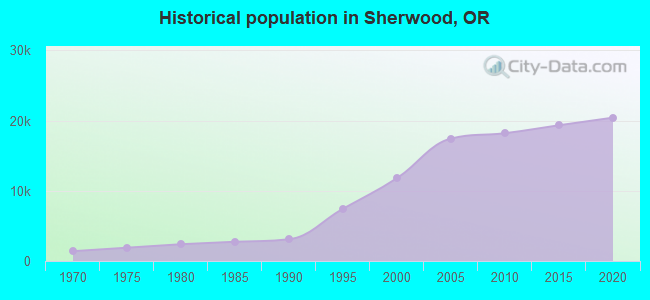
Population change in the 1990s: +8,560 (+264.9%).
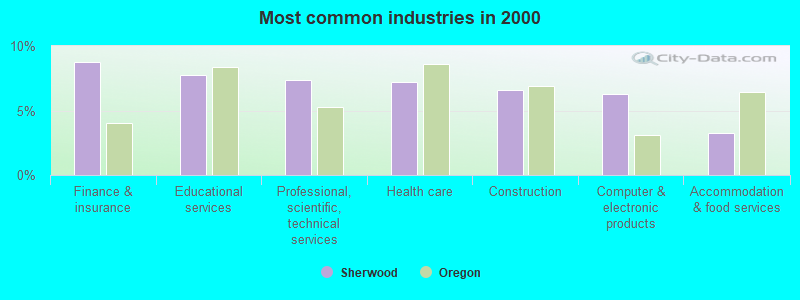
- Finance & insurance (8.7%)
- Educational services (7.8%)
- Professional, scientific, technical services (7.4%)
- Health care (7.2%)
- Construction (6.6%)
- Computer & electronic products (6.3%)
- Accommodation & food services (3.3%)
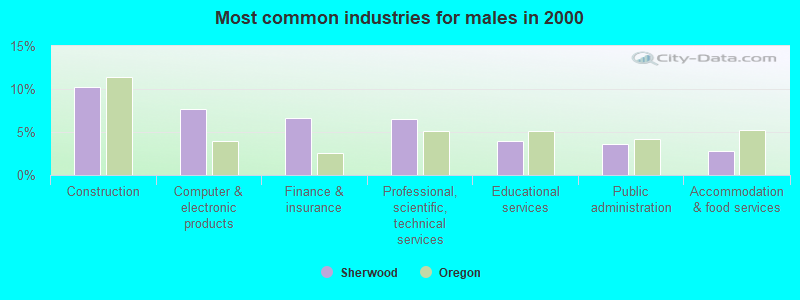
- Construction (10.2%)
- Computer & electronic products (7.6%)
- Finance & insurance (6.6%)
- Professional, scientific, technical services (6.6%)
- Educational services (4.0%)
- Public administration (3.6%)
- Accommodation & food services (2.7%)
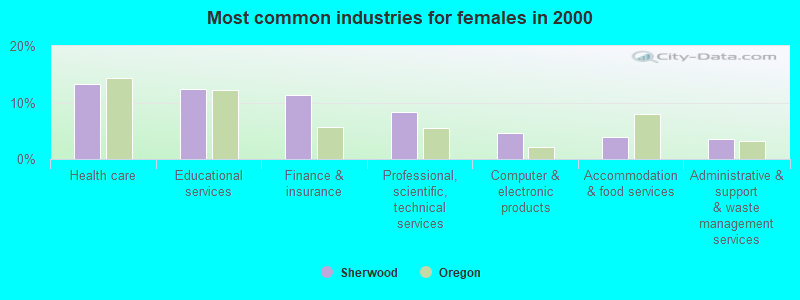
- Health care (13.2%)
- Educational services (12.3%)
- Finance & insurance (11.3%)
- Professional, scientific, technical services (8.4%)
- Computer & electronic products (4.7%)
- Accommodation & food services (3.9%)
- Administrative & support & waste management services (3.5%)
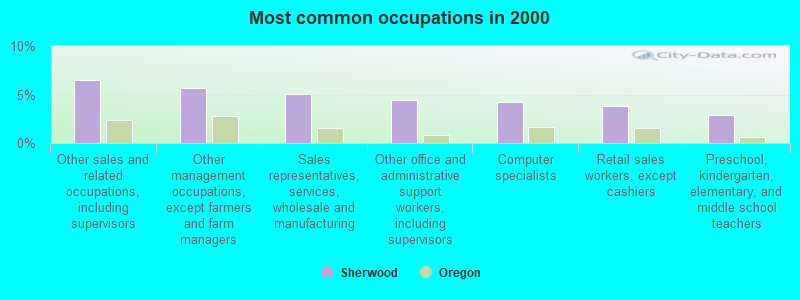
- Other sales and related occupations, including supervisors (6.5%)
- Other management occupations, except farmers and farm managers (5.7%)
- Sales representatives, services, wholesale and manufacturing (5.1%)
- Other office and administrative support workers, including supervisors (4.4%)
- Computer specialists (4.2%)
- Retail sales workers, except cashiers (3.8%)
- Preschool, kindergarten, elementary, and middle school teachers (2.9%)
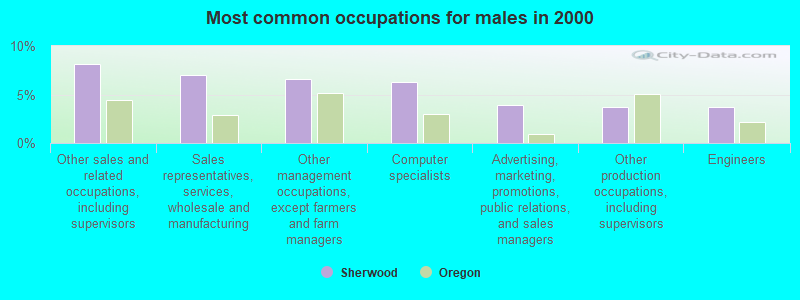
- Other sales and related occupations, including supervisors (8.1%)
- Sales representatives, services, wholesale and manufacturing (7.0%)
- Other management occupations, except farmers and farm managers (6.6%)
- Computer specialists (6.3%)
- Advertising, marketing, promotions, public relations, and sales managers (3.9%)
- Other production occupations, including supervisors (3.7%)
- Engineers (3.7%)
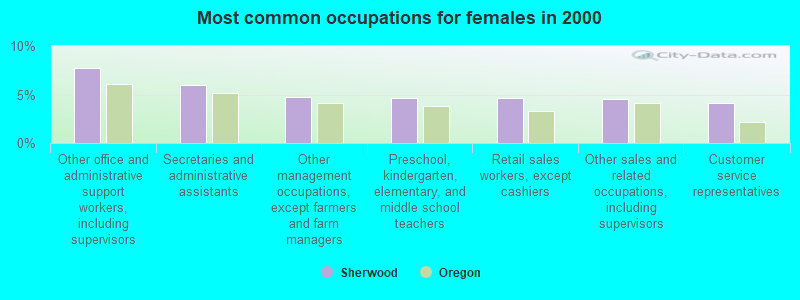
- Other office and administrative support workers, including supervisors (7.7%)
- Secretaries and administrative assistants (6.0%)
- Other management occupations, except farmers and farm managers (4.7%)
- Preschool, kindergarten, elementary, and middle school teachers (4.7%)
- Retail sales workers, except cashiers (4.7%)
- Other sales and related occupations, including supervisors (4.6%)
- Customer service representatives (4.1%)
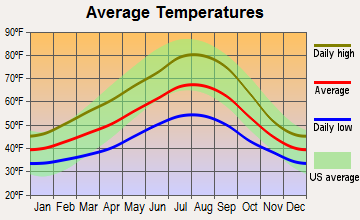
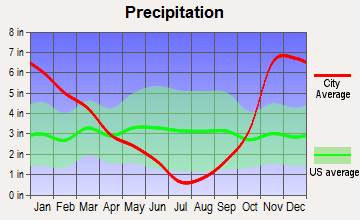
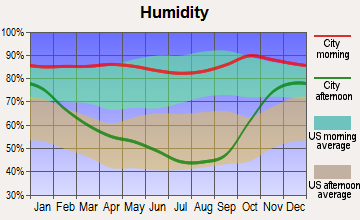
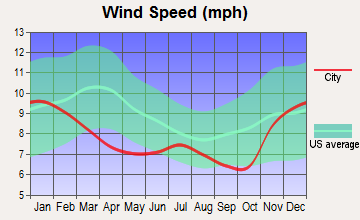
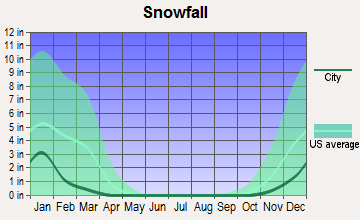
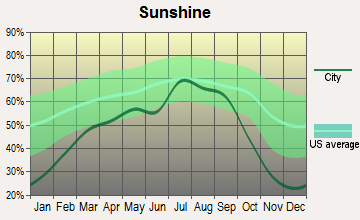
Average climate in Sherwood, Oregon
Based on data reported by over 4,000 weather stations

|
|

(lower is better)
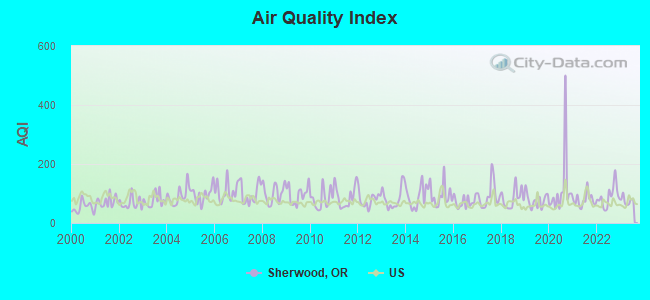
Air Quality Index (AQI) level in 2023 was 76.1. This is about average.
| City: | 76.1 |
| U.S.: | 72.6 |
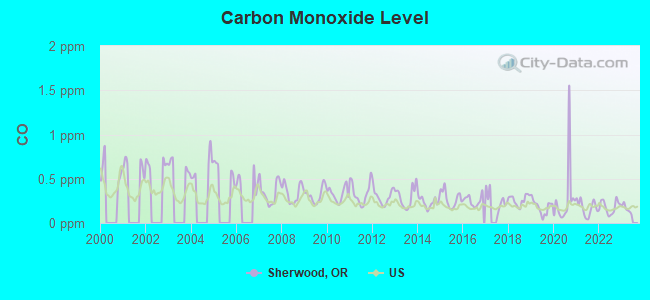
Carbon Monoxide (CO) [ppm] level in 2022 was 0.181. This is better than average. Closest monitor was 13.7 miles away from the city center.
| City: | 0.181 |
| U.S.: | 0.251 |
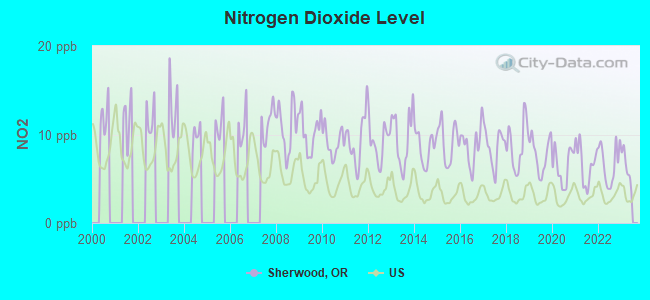
Nitrogen Dioxide (NO2) [ppb] level in 2022 was 6.68. This is worse than average. Closest monitor was 12.0 miles away from the city center.
| City: | 6.68 |
| U.S.: | 5.11 |
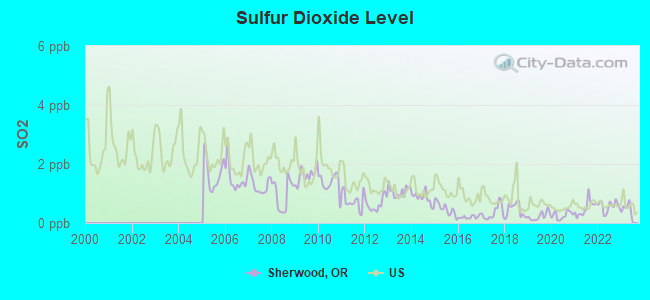
Sulfur Dioxide (SO2) [ppb] level in 2022 was 0.569. This is significantly better than average. Closest monitor was 13.0 miles away from the city center.
| City: | 0.569 |
| U.S.: | 1.515 |
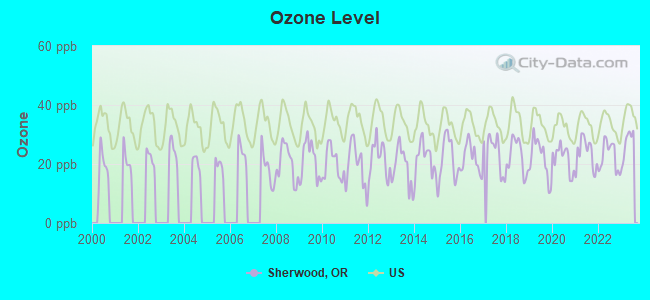
Ozone [ppb] level in 2023 was 27.0. This is better than average. Closest monitor was 11.6 miles away from the city center.
| City: | 27.0 |
| U.S.: | 33.3 |
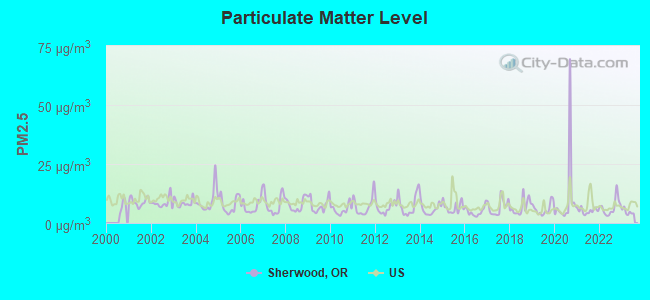
Particulate Matter (PM2.5) [µg/m3] level in 2023 was 4.72. This is significantly better than average. Closest monitor was 6.3 miles away from the city center.
| City: | 4.72 |
| U.S.: | 8.11 |
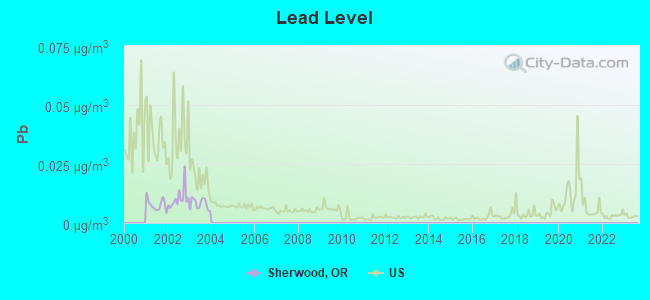
Lead (Pb) [µg/m3] level in 2003 was 0.00810. This is about average. Closest monitor was 8.9 miles away from the city center.
| City: | 0.00810 |
| U.S.: | 0.00931 |
Earthquake activity:
Sherwood-area historical earthquake activity is significantly above Oregon state average. It is 1441% greater than the overall U.S. average.On 4/13/1949 at 19:55:42, a magnitude 7.0 (7.0 UK, Class: Major, Intensity: VIII - XII) earthquake occurred 132.0 miles away from Sherwood center, causing $80,000,000 total damage
On 2/28/2001 at 18:54:32, a magnitude 6.8 (6.5 MB, 6.6 MS, 6.8 MW, Class: Strong, Intensity: VII - IX) earthquake occurred 120.5 miles away from Sherwood center, causing $2,000,000,000 total damage and $305,000,000 insured losses
On 2/28/2001 at 18:54:32, a magnitude 6.8 (6.8 MD, Depth: 32.2 mi) earthquake occurred 124.1 miles away from Sherwood center
On 1/31/1922 at 13:17:28, a magnitude 7.6 (7.6 UK) earthquake occurred 350.0 miles away from Sherwood center
On 4/29/1965 at 15:28:43, a magnitude 6.6 (6.6 UK) earthquake occurred 137.7 miles away from Sherwood center, causing $28,000,000 total damage
On 11/8/1980 at 10:27:34, a magnitude 7.2 (6.2 MB, 7.2 MS, 7.2 MW, 7.0 ML) earthquake occurred 302.8 miles away from the city center
Magnitude types: body-wave magnitude (MB), duration magnitude (MD), local magnitude (ML), surface-wave magnitude (MS), moment magnitude (MW)
Natural disasters:
The number of natural disasters in Washington County (12) is smaller than the US average (15).Major Disasters (Presidential) Declared: 10
Emergencies Declared: 1
Causes of natural disasters: Floods: 6, Storms: 5, Landslides: 3, Mudslides: 3, Winds: 3, Snows: 2, Winter Storms: 2, Earthquake: 1, Fire: 1, Heavy Rain: 1, Hurricane: 1, Other: 1 (Note: some incidents may be assigned to more than one category).
Hospitals and medical centers in Sherwood:
- SHERWOOD DIALYSIS CENTER (21035 SW PACIFIC HIGHWAY)
- PROVIDENCE NEWBERG HOSP HHA (16078 SW TUALATIN SHERWOOD ROAD)
Other hospitals and medical centers near Sherwood:
- AVAMERE REHABILITATION OF KING CITY (Nursing Home, about 4 miles away; TIGARD, OR)
- DAMMASCH STATE HOSPITAL (Hospital, about 4 miles away; WILSONVILLE, OR)
- MARQUIS CARE AT WILSONVILLE (Nursing Home, about 5 miles away; WILSONVILLE, OR)
- PNRS TUALATIN (Dialysis Facility, about 5 miles away; TUALATIN, OR)
- PACIFIC HEALTH AND REHABILITATION (Nursing Home, about 6 miles away; TIGARD, OR)
- LEGACY MERIDIAN PARK MEDICAL CENTER Acute Care Hospitals (about 6 miles away; TUALATIN, OR)
- MERIDIAN PARK DIALYSIS CENTER (Dialysis Facility, about 6 miles away; TUALATIN, OR)
Amtrak stations near Sherwood:
- 12 miles: OREGON CITY (1757 WASHINGTON ST.)
- 15 miles: PORTLAND (800 NW 6TH AVE.) . Services: ticket office, fully wheelchair accessible, enclosed waiting area, public restrooms, public payphones, full-service food facilities, paid short-term parking, paid long-term parking, call for car rental service, taxi stand, intercity bus service, public transit connection.
Colleges/universities with over 2000 students nearest to Sherwood:
- Pioneer Pacific College (about 5 miles; Wilsonville, OR; Full-time enrollment: 2,194)
- George Fox University (about 8 miles; Newberg, OR; FT enrollment: 2,954)
- Portland Community College (about 8 miles; Portland, OR; FT enrollment: 23,600)
- Lewis & Clark College (about 11 miles; Portland, OR; FT enrollment: 2,864)
- Portland State University (about 14 miles; Portland, OR; FT enrollment: 21,450)
- Clackamas Community College (about 14 miles; Oregon City, OR; FT enrollment: 4,261)
- University of Portland (about 16 miles; Portland, OR; FT enrollment: 4,030)
Public high school in Sherwood:
- SHERWOOD HIGH SCHOOL (Students: 1,127, Location: 16956 SW MEINECKE RD, Grades: 9-12)
Public elementary/middle schools in Sherwood:
- SHERWOOD MIDDLE SCHOOL (Students: 1,050, Location: 21970 SW SHERWOOD BLVD, Grades: 6-8)
- MIDDLETON ELEMENTARY SCHOOL (Students: 702, Location: 23505 SW OLD HWY 99W, Grades: KG-5)
- J CLYDE HOPKINS ELEMENTARY SCHOOL (Students: 684, Location: 21920 SW SHERWOOD BLVD, Grades: PK-5)
- ARCHER GLEN ELEMENTARY SCHOOL (Students: 672, Location: 16155 SW SUNSET BLVD, Grades: KG-5)
- SHERWOOD CHARTER SCHOOL (Location: 23264 SW MAIN ST, Grades: KG-8, Charter school)
- EDY RIDGE ELEMENTARY SCHOOL (Location: 21472 SW COPPER TERRACE, Grades: KG-5)
- LAUREL RIDGE MIDDLE SCHOOL (Location: 21416 SW COPPER TERRACE, Grades: 6-8)
Private elementary/middle schools in Sherwood:
Points of interest:
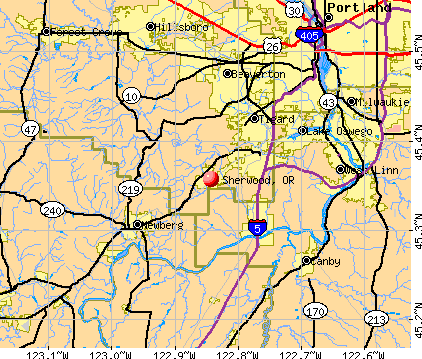
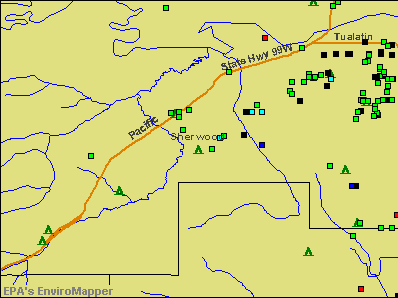
Notable locations in Sherwood: Sherwood Park and Ride (A), Sherwood Regal Cinemas Park and Ride (B), Sherwood Municipal Court (C), Sherwood Public Library (D), Sherwood City Hall (E), Tualatin Valley Fire and Rescue Station 33 Sherwood (F), Sherwood Ice Arena (G), Sherwood Public Works Department (H), Sherwood Heritage Center (I), Department of Motor Vehicles Sherwood (J). Display/hide their locations on the map
Shopping Centers: Sherwood Plaza Shopping Center (1), Sherwood Market Center Shopping Center (2). Display/hide their locations on the map
Churches in Sherwood include: Sherwood United Methodist Church (A), Woodhaven Community Church (B), Saint Paul Lutheran Church (C), Saint Francis Catholic Church (D). Display/hide their locations on the map
Cemeteries: Maple Lane Cemetery (1), Saint Paul Lutheran Cemetery (2). Display/hide their locations on the map
Parks in Sherwood include: Sunset City Park (1), Community Campus Park (2), Murdock City Park (3), Pioneer City Park (4), Stella Olsen City Park (5), Cinnamon Hills City Park (6), Lady Fern City Park (7), Langer City Park (8), Oregon Trail City Park (9). Display/hide their locations on the map
Tourist attraction: Godfather's Pizza (Museums; 15982 Southwest Tualatin Sherwood Road).
Court: Sherwood City - Municipal Court (20 Northwest Washington Street).
Birthplace of: Del Baker - Baseball player and coach, Chuck Sun - Motorcycle racer.
Drinking water stations with addresses in Sherwood and their reported violations in the past:
TUALATIN VALLEY REGIONAL TRNG CTR (Population served: 300, Groundwater):Past health violations:USFWS TUALATIN RIVER NATL WLR (Population served: 275, Groundwater):Past monitoring violations:
- MCL, Monthly (TCR) - Between JUL-2006 and SEP-2006, Contaminant: Coliform. Follow-up actions: St Compliance achieved (OCT-11-2006)
- Failure to Conduct Assessment Monitoring - Between JAN-2012 and DEC-2012, Contaminant: COLIPHAGE. Follow-up actions: St Violation/Reminder Notice (FEB-04-2013), St Compliance achieved (DEC-26-2013)
Past health violations:CHEHALEM MTN SUN RIDGE WATER CO (Population served: 70, Groundwater):Past monitoring violations:
- MCL, Monthly (TCR) - Between JUL-2008 and SEP-2008, Contaminant: Coliform. Follow-up actions: St Compliance achieved (DEC-15-2008)
- 2 routine major monitoring violations
- One regular monitoring violation
Past monitoring violations:PACIFIC CHRISTMAS TREES (Population served: 25, Groundwater):
- 64 regular monitoring violations
Past monitoring violations:
- 6 routine major monitoring violations
Drinking water stations with addresses in Sherwood that have no violations reported:
- SHERWOOD ELKS CLUB (Population served: 100, Primary Water Source Type: Groundwater)
| This city: | 2.9 people |
| Oregon: | 2.5 people |
| This city: | 76.9% |
| Whole state: | 63.4% |
| This city: | 4.8% |
| Whole state: | 8.0% |
Likely homosexual households (counted as self-reported same-sex unmarried-partner households)
- Lesbian couples: 0.4% of all households
- Gay men: 0.3% of all households
2 people in group homes intended for adults in 2010
19 people in other group homes in 2000
Banks with branches in Sherwood (2011 data):
- U.S. Bank National Association: Sherwood Albertsons Branch at 16030 Southwest Tualatin-Sherwood Drive, branch established on 1995/11/15; Sherwood Branch at 95 N.W. Washington, branch established on 1954/11/29. Info updated 2012/01/30: Bank assets: $330,470.8 mil, Deposits: $236,091.5 mil, headquarters in Cincinnati, OH, positive income, 3121 total offices, Holding Company: U.S. Bancorp
- KeyBank National Association: Sherwood Branch at 21327 Sw Sherwood Boulevard, branch established on 2006/04/03. Info updated 2008/03/03: Bank assets: $86,198.8 mil, Deposits: $64,214.8 mil, headquarters in Cleveland, OH, positive income, Commercial Lending Specialization, 1067 total offices, Holding Company: Keycorp
- JPMorgan Chase Bank, National Association: Sherwood Branch at 16100 Southwest Tualatin-Sherwood Rd, branch established on 1996/06/10. Info updated 2011/11/10: Bank assets: $1,811,678.0 mil, Deposits: $1,190,738.0 mil, headquarters in Columbus, OH, positive income, International Specialization, 5577 total offices, Holding Company: Jpmorgan Chase & Co.
- Bank of America, National Association: Sherwood Banking Center at 15961 Tualatin-Sherwood Road, branch established on 2003/12/15. Info updated 2009/11/18: Bank assets: $1,451,969.3 mil, Deposits: $1,077,176.8 mil, headquarters in Charlotte, NC, positive income, 5782 total offices, Holding Company: Bank Of America Corporation
For population 15 years and over in Sherwood:
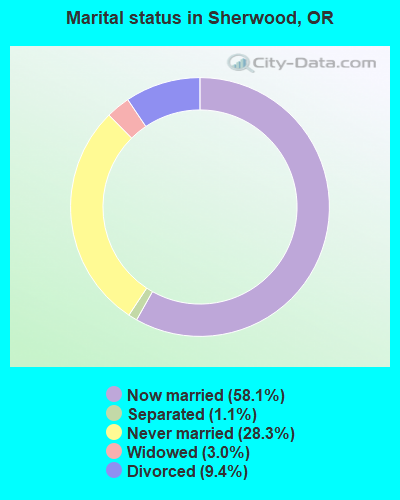
- Never married: 28.3%
- Now married: 58.1%
- Separated: 1.1%
- Widowed: 3.0%
- Divorced: 9.4%
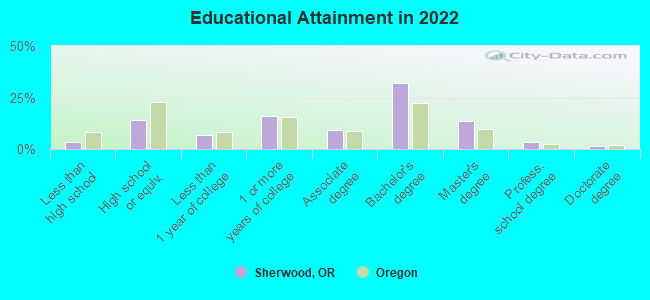
For population 25 years and over in Sherwood:
- High school or higher: 96.4%
- Bachelor's degree or higher: 49.6%
- Graduate or professional degree: 17.7%
- Unemployed: 3.2%
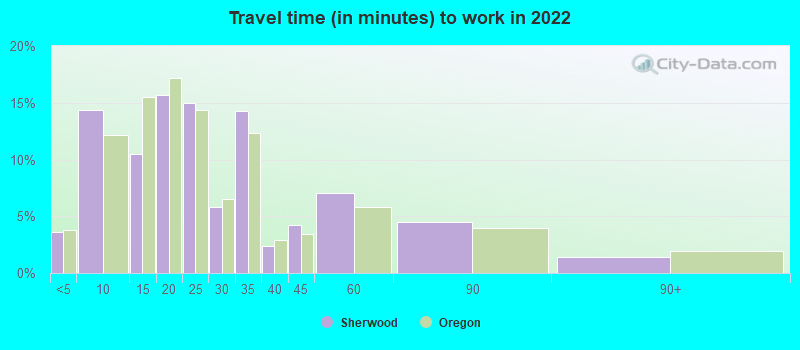
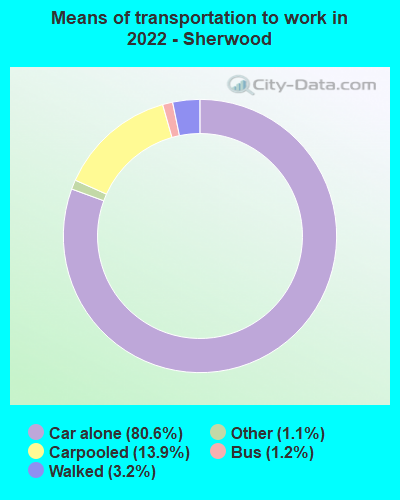
- Mean travel time to work (commute): 16.9 minutes

| Here: | 9.2 |
| Oregon average: | 11.6 |
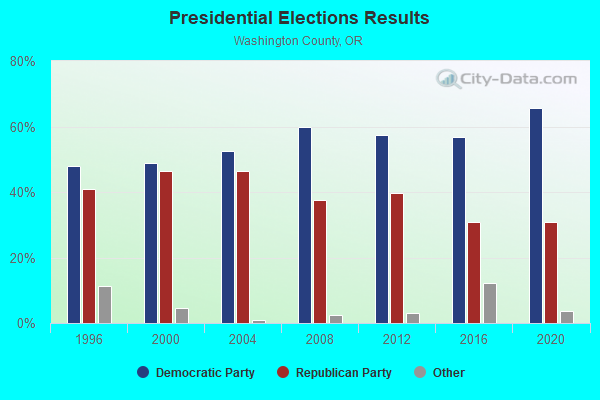
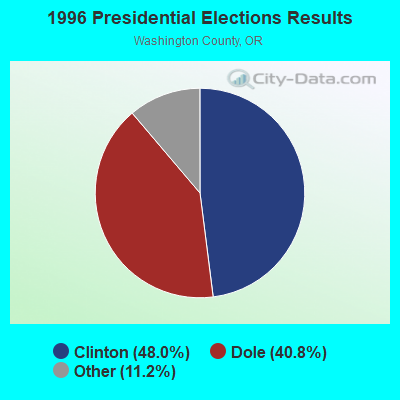
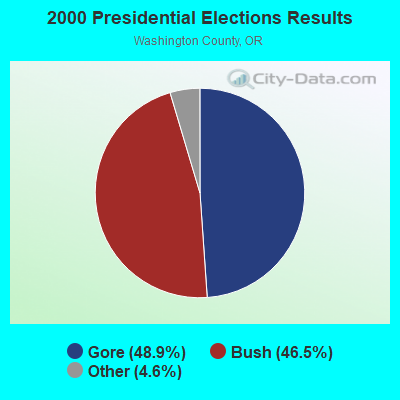


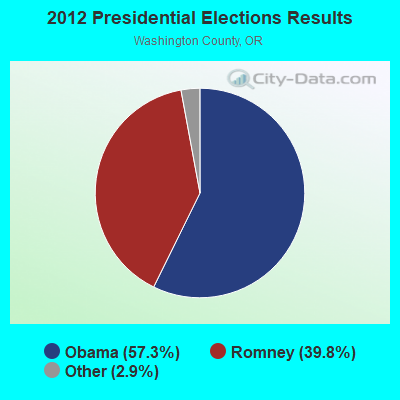
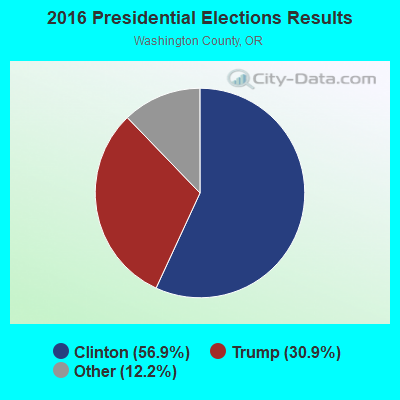

Graphs represent county-level data. Detailed 2008 Election Results
Religion statistics for Sherwood, OR (based on Washington County data)
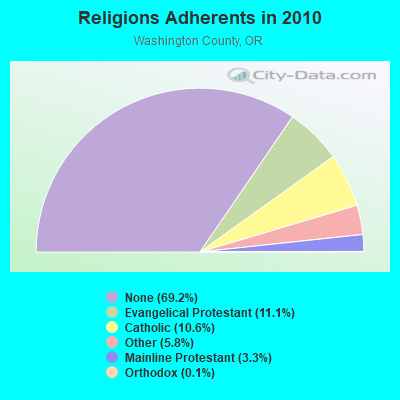
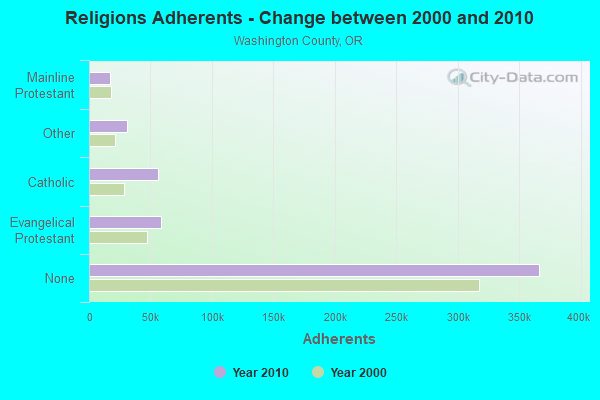
| Religion | Adherents | Congregations |
|---|---|---|
| Evangelical Protestant | 58,752 | 200 |
| Catholic | 55,886 | 11 |
| Other | 30,823 | 77 |
| Mainline Protestant | 17,404 | 53 |
| Orthodox | 550 | 1 |
| None | 366,295 | - |
Food Environment Statistics:
| This county: | 1.44 / 10,000 pop. |
| State: | 2.03 / 10,000 pop. |
| Washington County: | 0.33 / 10,000 pop. |
| Oregon: | 0.33 / 10,000 pop. |
| Here: | 1.42 / 10,000 pop. |
| Oregon: | 2.01 / 10,000 pop. |
| Washington County: | 0.90 / 10,000 pop. |
| State: | 1.69 / 10,000 pop. |
| Washington County: | 7.35 / 10,000 pop. |
| State: | 9.93 / 10,000 pop. |
| This county: | 6.5% |
| Oregon: | 7.4% |
| This county: | 24.0% |
| Oregon: | 25.6% |
| This county: | 13.8% |
| Oregon: | 14.2% |
Health and Nutrition:
| Here: | 49.0% |
| State: | 49.6% |
| Sherwood: | 47.4% |
| Oregon: | 46.8% |
| Sherwood: | 28.6 |
| State: | 28.5 |
| This city: | 20.7% |
| State: | 21.2% |
| This city: | 8.7% |
| State: | 10.1% |
| This city: | 6.8 |
| Oregon: | 6.8 |
| Here: | 33.3% |
| Oregon: | 33.3% |
| Sherwood: | 58.1% |
| State: | 56.5% |
| Here: | 81.6% |
| Oregon: | 78.7% |
More about Health and Nutrition of Sherwood, OR Residents
| Local government employment and payroll (March 2022) | |||||
| Function | Full-time employees | Monthly full-time payroll | Average yearly full-time wage | Part-time employees | Monthly part-time payroll |
|---|---|---|---|---|---|
| Other and Unallocable | 26 | $183,106 | $84,510 | 2 | $5,500 |
| Police Protection - Officers | 22 | $191,931 | $104,690 | 1 | $2,403 |
| Other Government Administration | 16 | $128,073 | $96,055 | 0 | $0 |
| Financial Administration | 14 | $107,726 | $92,337 | 1 | $3,472 |
| Parks and Recreation | 11 | $59,355 | $64,751 | 2 | $874 |
| Local Libraries | 6 | $40,287 | $80,574 | 13 | $19,939 |
| Judicial and Legal | 5 | $37,483 | $89,959 | 1 | $1,950 |
| Sewerage | 5 | $20,824 | $49,978 | 0 | $0 |
| Police - Other | 4 | $21,678 | $65,034 | 0 | $0 |
| Water Supply | 3 | $24,020 | $96,080 | 0 | $0 |
| Streets and Highways | 2 | $10,871 | $65,226 | 0 | $0 |
| Totals for Government | 114 | $825,355 | $86,879 | 20 | $34,138 |
Sherwood government finances - Expenditure in 2021 (per resident):
- Construction - General - Other: $1,564,000 ($78.08)
Sewerage: $1,181,000 ($58.96)
Regular Highways: $909,000 ($45.38)
Water Utilities: $812,000 ($40.54)
Miscellaneous Commercial Activities - Other: $305,000 ($15.23)
- Current Operations - Police Protection: $4,786,000 ($238.94)
Central Staff Services: $3,503,000 ($174.89)
Water Utilities: $3,419,000 ($170.69)
Miscellaneous Commercial Activities - Other: $2,355,000 ($117.57)
Parks and Recreation: $2,147,000 ($107.19)
Regular Highways: $1,977,000 ($98.70)
Sewerage: $1,906,000 ($95.16)
General - Other: $1,283,000 ($64.05)
Libraries: $1,218,000 ($60.81)
General Public Buildings: $950,000 ($47.43)
Judicial and Legal Services: $662,000 ($33.05)
Financial Administration: $604,000 ($30.15)
- General - Interest on Debt: $1,100,000 ($54.92)
- Other Capital Outlay - General - Other: $340,000 ($16.97)
General Public Building: $84,000 ($4.19)
Miscellaneous Commercial Activities - Other: $18,000 ($0.90)
Parks and Recreation: $17,000 ($0.85)
- Total Salaries and Wages: $14,825,000 ($740.14)
Sherwood government finances - Revenue in 2021 (per resident):
- Charges - Sewerage: $2,825,000 ($141.04)
Miscellaneous Commercial Activities: $793,000 ($39.59)
Regular Highways: $727,000 ($36.30)
Parks and Recreation: $195,000 ($9.74)
Other: $15,000 ($0.75)
- Federal Intergovernmental - Other: $2,575,000 ($128.56)
- Local Intergovernmental - Other: $1,353,000 ($67.55)
General Local Government Support: $659,000 ($32.90)
Housing and Community Development: $77,000 ($3.84)
- Miscellaneous - Fines and Forfeits: $2,112,000 ($105.44)
General Revenue - Other: $391,000 ($19.52)
Interest Earnings: $376,000 ($18.77)
Rents: $153,000 ($7.64)
Sale of Property: $11,000 ($0.55)
Donations From Private Sources: $1,000 ($0.05)
- Revenue - Water Utilities: $6,402,000 ($319.62)
- State Intergovernmental - Highways: $1,875,000 ($93.61)
Housing and Community Development: $106,000 ($5.29)
Other: $33,000 ($1.65)
General Local Government Support: $16,000 ($0.80)
- Tax - Property: $9,699,000 ($484.22)
Other License: $2,781,000 ($138.84)
Public Utilities Sales: $2,141,000 ($106.89)
Occupation and Business License - Other: $66,000 ($3.30)
Other Selective Sales: $61,000 ($3.05)
Alcoholic Beverage License: $2,000 ($0.10)
Sherwood government finances - Debt in 2021 (per resident):
- Long Term Debt - Beginning Outstanding - Unspecified Public Purpose: $27,496,000 ($1372.74)
Outstanding Unspecified Public Purpose: $22,364,000 ($1116.53)
Retired Unspecified Public Purpose: $14,027,000 ($700.30)
Issue, Unspecified Public Purpose: $8,895,000 ($444.08)
Sherwood government finances - Cash and Securities in 2021 (per resident):
- Other Funds - Cash and Securities: $43,127,000 ($2153.12)
8.36% of this county's 2021 resident taxpayers lived in other counties in 2020 ($73,593 average adjusted gross income)
| Here: | 8.36% |
| Oregon average: | 8.20% |
0.01% of residents moved from foreign countries ($84 average AGI)
Washington County: 0.01% Oregon average: 0.01%
Top counties from which taxpayers relocated into this county between 2020 and 2021:
| from Multnomah County, OR | |
| from Clackamas County, OR | |
| from Clark County, WA |
8.64% of this county's 2020 resident taxpayers moved to other counties in 2021 ($92,423 average adjusted gross income)
| Here: | 8.64% |
| Oregon average: | 8.24% |
0.01% of residents moved to foreign countries ($83 average AGI)
Washington County: 0.01% Oregon average: 0.00%
Top counties to which taxpayers relocated from this county between 2020 and 2021:
| to Multnomah County, OR | |
| to Clackamas County, OR | |
| to Clark County, WA |
| Businesses in Sherwood, OR | ||||
| Name | Count | Name | Count | |
|---|---|---|---|---|
| AT&T | 1 | MasterBrand Cabinets | 1 | |
| Albertsons | 1 | McDonald's | 1 | |
| Baskin-Robbins | 1 | Panda Express | 1 | |
| Blockbuster | 1 | Quiznos | 1 | |
| Burger King | 1 | Red Robin | 1 | |
| Cricket Wireless | 1 | Sprint Nextel | 1 | |
| Curves | 1 | Starbucks | 4 | |
| DHL | 1 | Subway | 1 | |
| Domino's Pizza | 1 | T-Mobile | 1 | |
| FedEx | 2 | Taco Bell | 1 | |
| GNC | 1 | Target | 1 | |
| GameStop | 1 | U-Haul | 1 | |
| Goodwill | 1 | UPS | 2 | |
| H&R Block | 1 | Vons | 1 | |
| Home Depot | 1 | Walgreens | 1 | |
| Jones New York | 1 | YMCA | 1 | |
| KFC | 1 | |||
Strongest AM radio stations in Sherwood:
- KPOJ (620 AM; 50 kW; PORTLAND, OR; Owner: CITICASTERS LICENSES, L.P.)
- KEX (1190 AM; 50 kW; PORTLAND, OR; Owner: CITICASTERS LICENSES, L.P.)
- KKSN (1520 AM; 50 kW; OREGON CITY, OR; Owner: ENTERCOM PORTLAND LICENSE, LLC)
- KXL (750 AM; 50 kW; PORTLAND, OR; Owner: ROSE CITY RADIO CORPORATION)
- KOTK (1080 AM; 50 kW; PORTLAND, OR; Owner: FISHER BROADCASTING - PORTLAND RADIO, L.L.C.)
- KPAM (860 AM; 50 kW; TROUTDALE, OR; Owner: PAMPLIN BROADCASTING-OREGON, INC.)
- KKAD (1550 AM; 50 kW; VANCOUVER, WA; Owner: PAMPLIN BROADCASTING-WASHINGTON, INC)
- KKSL (1290 AM; 10 kW; LAKE OSWEGO, OR; Owner: ABC, INC.)
- KUIK (1360 AM; 5 kW; HILLSBORO, OR; Owner: DOLPHIN COMMUNICATIONS, INC.)
- KUPL (970 AM; 5 kW; PORTLAND, OR; Owner: INFINITY RADIO OPERATIONS INC.)
- KBNP (1410 AM; 5 kW; PORTLAND, OR; Owner: KBNP RADIO, INC.)
- KDZR (1640 AM; 10 kW; LAKE OSWEGO, OR; Owner: ABC, INC.)
- KFXX (910 AM; 10 kW; VANCOUVER, WA; Owner: ENTERCOM PORTLAND LICENSE, LLC (DE))
Strongest FM radio stations in Sherwood:
- K225AI (92.9 FM; PORTLAND, OR; Owner: EDUCATIONAL MEDIA FOUNDATION)
- KINK (101.9 FM; PORTLAND, OR; Owner: INFINITY RADIO OPERATIONS INC.)
- KKCW (103.3 FM; BEAVERTON, OR; Owner: CITICASTERS LICENSES, L.P.)
- KPDQ-FM (93.7 FM; PORTLAND, OR; Owner: SALEM MEDIA OF OREGON, INC.)
- KOPB-FM (91.5 FM; PORTLAND, OR; Owner: OREGON PUBLIC BROADCASTING)
- KKRZ (100.3 FM; PORTLAND, OR; Owner: CITICASTERS LICENSES, L.P.)
- KMHD (89.1 FM; GRESHAM, OR; Owner: MT. HOOD COMMUNITY COLLEGE DISTRICT)
- KVMX (107.5 FM; BANKS, OR; Owner: INFINITY RADIO OPERATIONS INC.)
- KLTH (106.7 FM; LAKE OSWEGO, OR; Owner: INIFINITY RADIO OF PORTLAND INC.)
- KUPL-FM (98.7 FM; PORTLAND, OR; Owner: INFINITY RADIO OF PORTLAND INC.)
- KUFO-FM (101.1 FM; PORTLAND, OR; Owner: INFINITY RADIO OPERATIONS INC.)
- KNRK (94.7 FM; CAMAS, WA; Owner: ENTERCOM PORTLAND LICENSE, LLC (DE))
- KBVM (88.3 FM; PORTLAND, OR; Owner: CATHOLIC BROADCASTING NORTHWEST, INC)
- KBPS-FM (89.9 FM; PORTLAND, OR; Owner: SCHOOL DISTRICT #1, MULTNOMAH COUNTY, OR)
- KBOO (90.7 FM; PORTLAND, OR; Owner: THE KBOO FOUNDATION)
- KWJJ-FM (99.5 FM; PORTLAND, OR; Owner: FISHER BROADCASTING - PORTLAND RADIO, L.L.C.)
- KGON (92.3 FM; PORTLAND, OR; Owner: ENTERCOM PORTLAND LICENSE, LLC (DE))
- KKSN-FM (97.1 FM; PORTLAND, OR; Owner: ENTERCOM PORTLAND LICENSE, LLC (DE))
- KXJM (95.5 FM; PORTLAND, OR; Owner: ROSE CITY RADIO CORPORATION)
- KFIS (104.1 FM; SCAPPOOSE, OR; Owner: CARON BROADCASTING, INC.)
TV broadcast stations around Sherwood:
- KATU (Channel 2; PORTLAND, OR; Owner: FISHER BROADCASTING - PORTLAND TV, L.L.C.)
- KWBP-LP (Channel 4; PORTLAND, OR; Owner: TRIBUNE BROADCASTING HOLDINGS, INC.)
- KPDX (Channel 49; VANCOUVER, WA; Owner: MEREDITH CORPORATION)
- KPTV (Channel 12; PORTLAND, OR; Owner: MEREDITH CORPORATION)
- K57IF (Channel 57; SALEM, OR; Owner: LaGRANDE BROADCASTING, INC.)
- KOIN (Channel 6; PORTLAND, OR; Owner: EMMIS TELEVISION LICENSE CORPORATION)
- KNMT (Channel 24; PORTLAND, OR; Owner: NATIONAL MINORITY T.V., INC.)
- KGW (Channel 8; PORTLAND, OR; Owner: KING BROADCASTING COMPANY)
- K18EL (Channel 18; NEWBERG/TIGARD, OR; Owner: MEREDITH CORPORATION)
- KOPB-TV (Channel 10; PORTLAND, OR; Owner: OREGON PUBLIC BROADCASTING)
- KPXG-LP (Channel 54; PORTLAND, OR; Owner: PAXSON COMMUNICATIONS LICENSE COMPANY, LLC)
- K14HN (Channel 14; VANCOUVER/CAMAS, WA; Owner: MEREDITH CORPORATION)
- KPXG (Channel 22; SALEM, OR; Owner: PAXSON SALEM LICENSE, INC.)
- KOXO-CA (Channel 51; NEWBERG, OR; Owner: WATCHTV, INC.)
- KWBP (Channel 32; SALEM, OR; Owner: TRIBUNE BROADCAST HOLDINGS, INC.)
- KORK-CA (Channel 35; PORTLAND, OR; Owner: WATCHTV, INC.)
- K58CO (Channel 58; PORTLAND, OR; Owner: NORTHWEST CHRISTIAN BROADCASTING)
- National Bridge Inventory (NBI) Statistics
- 7Number of bridges
- 36ft / 10.7mTotal length
- 32,446Total average daily traffic
- 976Total average daily truck traffic
- 35,791Total future (year 2025) average daily traffic
FCC Registered Cell Phone Towers:
2 (See the full list of FCC Registered Cell Phone Towers in Sherwood)FCC Registered Antenna Towers:
36 (See the full list of FCC Registered Antenna Towers)FCC Registered Broadcast Land Mobile Towers:
7- Water Reservoir 300 Block E Div (Lat: 45.353167 Lon: -122.834000), Call Sign: KXX386, Licensee ID: L00083669,
Assigned Frequencies: 453.425 MHz, Grant Date: 01/31/2015, Expiration Date: 04/04/2025, Registrant: City Of Dba None Sherwood, 15527 Sw Willamette St, Sherwood, OR 97140, Phone: (503) 625-5722
- HAWKS VIEW ES, Lat: 45.358917 Lon: -122.841278, Call Sign: WPGB725,
Assigned Frequencies: 467.237 MHz, Grant Date: 11/06/2014, Expiration Date: 12/07/2024, Registrant: Innovation Wireless, 11869 Teale St, Culver City, CA 90230, Phone: (888) 559-5565, Fax: (310) 482-3480, Email:
- Lat: 45.406528 Lon: -122.840222, Call Sign: WQAZ497, Licensee ID: L00853105,
Assigned Frequencies: 72.2000 MHz, Grant Date: 08/12/2014, Expiration Date: 08/31/2024, Certifier: Thomas Mccarthy, Registrant: St. Francis Parish
- 15650 Sw Tualatin Sherwood Road (Lat: 45.367500 Lon: -122.836667), Call Sign: WQCF374,
Assigned Frequencies: 467.512 MHz, 467.487 MHz, 467.462 MHz, 467.187 MHz, Grant Date: 02/18/2005, Expiration Date: 02/18/2015, Cancellation Date: 04/25/2015, Certifier: Joan Anderberg, Registrant: Advanced Wireless Communications, 20809 Kensington Blvd., Lakeville, MN 55021, Phone: (952) 469-5400, Email:
- Lat: 45.396000 Lon: -122.851861, Call Sign: WQFK220,
Assigned Frequencies: 160.020 MHz, 160.065 MHz, 159.900 MHz, 159.720 MHz, Grant Date: 05/17/2016, Expiration Date: 08/02/2026, Certifier: Mark D Bigej, Registrant: Radio Licensing Services, 4700 Se International Way, 97222-4657, Milwaukie, OR 97269-2161, Phone: (503) 794-3787, Fax: (503) 794-3759, Email:
- Lat: 45.367694 Lon: -122.815444, Call Sign: WQRC960,
Assigned Frequencies: 461.662 MHz, 462.087 MHz, 463.262 MHz, 463.662 MHz, 464.362 MHz, Grant Date: 04/18/2013, Expiration Date: 04/18/2023, Cancellation Date: 07/15/2023, Certifier: Aaron Bruce, Registrant: Larsen Wireless, 3075 S. W. 234th Ave., Suite 207, Hillsboro, OR 97123, Phone: (503) 591-1200, Fax: (503) 591-1211, Email:
- SHERWOOD CHARTER, 23264 Sw Main Street (Lat: 45.351139 Lon: -122.840444), Type: Building, Structure height: 5 m, Call Sign: WREE634,
Assigned Frequencies: 465.000 MHz, Grant Date: 10/01/2019, Expiration Date: 10/01/2029, Certifier: Cheryl Mcleod, Registrant: Visiplex, Inc., 1287 North Barclay Boulevard, Buffalo Grove, IL 60089, Phone: (847) 229-0250, Fax: (847) 229-0259, Email:
FCC Registered Microwave Towers:
16 (See the full list of FCC Registered Microwave Towers in this town)FCC Registered Amateur Radio Licenses:
248 (See the full list of FCC Registered Amateur Radio Licenses in Sherwood)FAA Registered Aircraft Manufacturers and Dealers:
1 (See the full list of FAA Registered Manufacturers and Dealers in Sherwood)FAA Registered Aircraft:
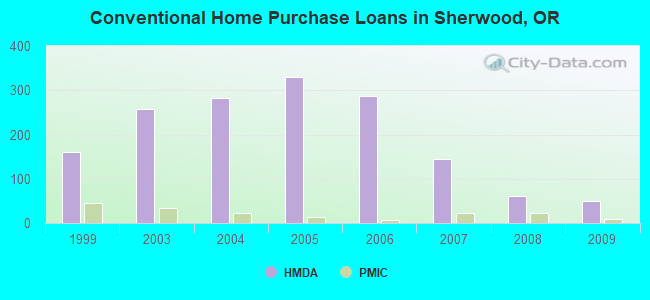
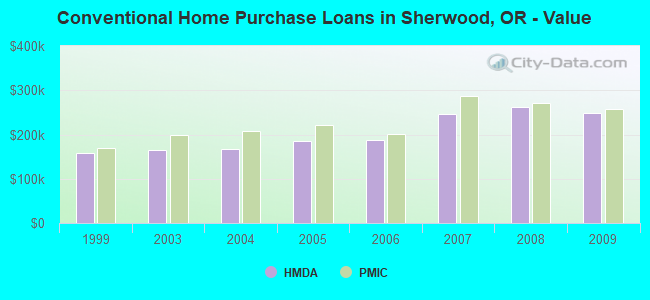
32 (See the full list of FAA Registered Aircraft)| Home Mortgage Disclosure Act Aggregated Statistics For Year 2009 (Based on 2 partial tracts) | ||||||||||||||
| A) FHA, FSA/RHS & VA Home Purchase Loans | B) Conventional Home Purchase Loans | C) Refinancings | D) Home Improvement Loans | E) Loans on Dwellings For 5+ Families | F) Non-occupant Loans on < 5 Family Dwellings (A B C & D) | G) Loans On Manufactured Home Dwelling (A B C & D) | ||||||||
|---|---|---|---|---|---|---|---|---|---|---|---|---|---|---|
| Number | Average Value | Number | Average Value | Number | Average Value | Number | Average Value | Number | Average Value | Number | Average Value | Number | Average Value | |
| LOANS ORIGINATED | 47 | $245,425 | 49 | $249,061 | 285 | $242,234 | 4 | $177,660 | 0 | $0 | 11 | $197,277 | 2 | $70,030 |
| APPLICATIONS APPROVED, NOT ACCEPTED | 1 | $128,890 | 3 | $84,307 | 24 | $245,808 | 1 | $12,610 | 0 | $0 | 1 | $272,010 | 2 | $33,690 |
| APPLICATIONS DENIED | 10 | $224,775 | 4 | $114,212 | 104 | $255,295 | 6 | $102,562 | 1 | $2,244,400 | 8 | $163,744 | 3 | $89,840 |
| APPLICATIONS WITHDRAWN | 5 | $247,810 | 4 | $265,610 | 49 | $261,228 | 5 | $165,488 | 0 | $0 | 2 | $231,655 | 0 | $0 |
| FILES CLOSED FOR INCOMPLETENESS | 2 | $283,015 | 2 | $307,835 | 14 | $259,291 | 0 | $0 | 0 | $0 | 0 | $0 | 0 | $0 |
Detailed HMDA statistics for the following Tracts: 0321.03 , 0321.04
| Private Mortgage Insurance Companies Aggregated Statistics For Year 2009 (Based on 2 partial tracts) | ||||
| A) Conventional Home Purchase Loans | B) Refinancings | |||
|---|---|---|---|---|
| Number | Average Value | Number | Average Value | |
| LOANS ORIGINATED | 10 | $258,231 | 4 | $332,870 |
| APPLICATIONS APPROVED, NOT ACCEPTED | 2 | $274,395 | 3 | $262,700 |
| APPLICATIONS DENIED | 2 | $228,425 | 1 | $206,170 |
| APPLICATIONS WITHDRAWN | 0 | $0 | 0 | $0 |
| FILES CLOSED FOR INCOMPLETENESS | 0 | $0 | 0 | $0 |
Detailed PMIC statistics for the following Tracts: 0321.03 , 0321.04
2002 - 2017 National Fire Incident Reporting System (NFIRS) incidents
- Fire incident types reported to NFIRS in Sherwood, OR
- 32446.3%Outside Fires
- 25836.9%Structure Fires
- 9914.1%Mobile Property/Vehicle Fires
- 192.7%Other
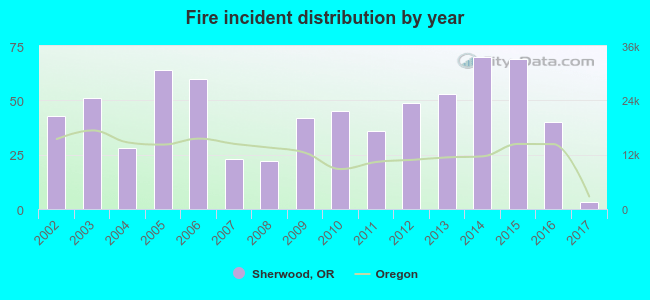 Based on the data from the years 2002 - 2017 the average number of fires per year is 44. The highest number of reported fires - 70 took place in 2014, and the least - 3 in 2017. The data has a declining trend.
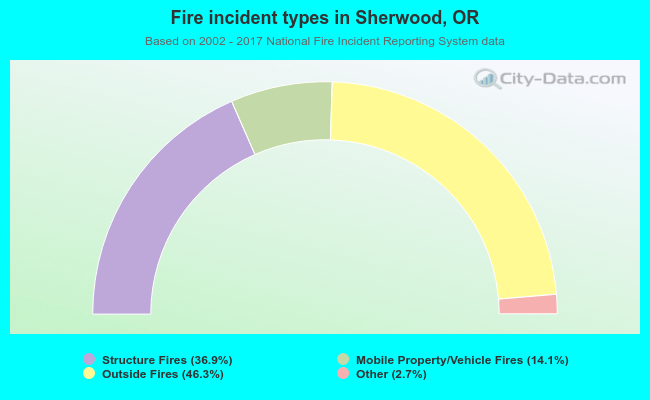 When looking into fire subcategories, the most incidents belonged to: Outside Fires (46.3%), and Structure Fires (36.9%).
| Most common first names in Sherwood, OR among deceased individuals | ||
| Name | Count | Lived (average) |
|---|---|---|
| Mary | 42 | 79.9 years |
| John | 40 | 75.5 years |
| Robert | 38 | 74.0 years |
| William | 38 | 76.3 years |
| James | 36 | 75.4 years |
| Charles | 25 | 75.6 years |
| Helen | 23 | 83.6 years |
| Richard | 22 | 72.0 years |
| Margaret | 22 | 79.0 years |
| George | 20 | 80.1 years |
| Most common last names in Sherwood, OR among deceased individuals | ||
| Last name | Count | Lived (average) |
|---|---|---|
| Baker | 13 | 72.2 years |
| Smith | 13 | 82.6 years |
| Miller | 12 | 75.3 years |
| Clark | 11 | 84.0 years |
| Jones | 10 | 77.4 years |
| Harvey | 10 | 78.9 years |
| Cole | 8 | 83.2 years |
| Anderson | 8 | 81.2 years |
| Johnson | 8 | 71.7 years |
| Brown | 7 | 76.1 years |
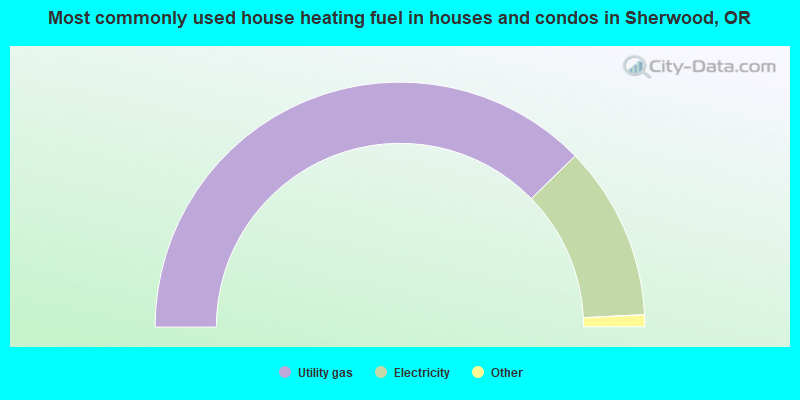
- 75.4%Utility gas
- 23.0%Electricity
- 0.5%Bottled, tank, or LP gas
- 0.4%Solar energy
- 0.4%No fuel used
- 0.2%Fuel oil, kerosene, etc.
- 0.2%Wood
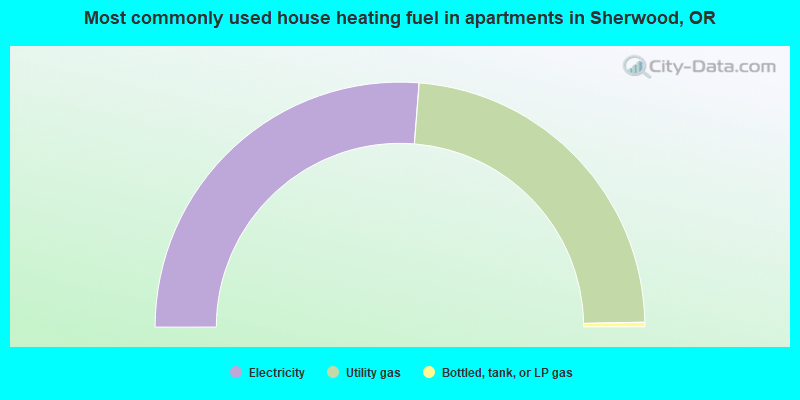
- 52.5%Electricity
- 46.9%Utility gas
- 0.6%Bottled, tank, or LP gas
Sherwood compared to Oregon state average:
- Unemployed percentage significantly below state average.
- Black race population percentage significantly below state average.
- Foreign-born population percentage above state average.
- Renting percentage below state average.
- Length of stay since moving in above state average.
- House age significantly below state average.
- Percentage of population with a bachelor's degree or higher above state average.
Sherwood on our top lists:
- #54 on the list of "Top 101 cities with largest percentage of females in industries: wholesale trade (population 5,000+)"
- #9 on the list of "Top 101 counties with the highest percentage of residents that exercised in the past month"
- #32 on the list of "Top 101 counties with the largest increase in the number of infant deaths per 1000 residents 2000-2006 to 2007-2013 (pop. 50,000+)"
- #42 on the list of "Top 101 counties with the largest number of children under 18 without health insurance coverage in 2000 (pop. 50,000+)"
- #47 on the list of "Top 101 counties with the lowest number of infant deaths per 1000 residents 2007-2013 (pop. 50,000+)"
- #49 on the list of "Top 101 counties with the lowest percentage of residents that smoked 100+ cigarettes in their lives"

|
|
Total of 743 patent applications in 2008-2024.