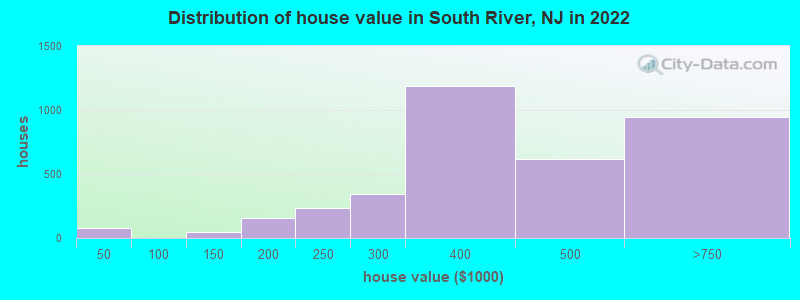
Estimated median house or condo value in 2022: $385,414 (it was $150,000 in 2000)
South River:
$385,414
NJ:
$428,900
Mean prices in 2022:all housing units: $453,250; detached houses: $489,297; townhouses or other attached units: $387,943; in 2-unit structures: $281,108; in 3-to-4-unit structures: $341,963; in 5-or-more-unit structures: $260,268; mobile homes: $71,279
Median gross rent in 2022: $1,549.
March 2022 cost of living index in South River: 119.6 (more than average, U.S. average is 100)
Percentage of residents living in poverty in 2022: 12.2%
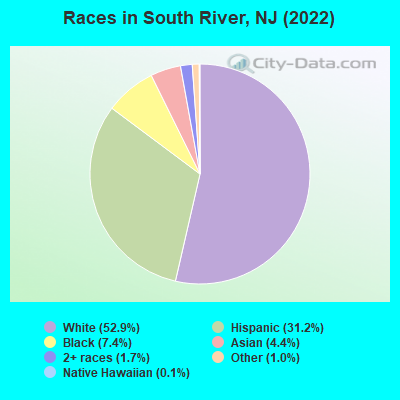
(11.3% for White Non-Hispanic residents, 5.7% for Black residents, 17.6% for Hispanic or Latino residents, 24.4% for other race residents, 9.7% for two or more races residents)
According to our research of New Jersey and other state lists, there were 9 registered sex offenders living in South River, New Jersey as of June 15, 2024. The ratio of all residents to sex offenders in South River is 1,823 to 1. The ratio of registered sex offenders to all residents in this city is near the state average.
Crime rates in South River by year
Type
2009
2010
2011
2012
2013
2014
2015
2016
2017
2018
2019
2020
2021
2022
Murders (per 100,000)
0 (0.0)
0 (0.0)
0 (0.0)
0 (0.0)
0 (0.0)
0 (0.0)
0 (0.0)
0 (0.0)
0 (0.0)
0 (0.0)
0 (0.0)
0 (0.0)
0 (0.0)
0 (0.0)
Rapes (per 100,000)
3 (19.1)
3 (18.7)
0 (0.0)
2 (12.4)
2 (12.3)
4 (24.5)
6 (36.6)
1 (6.1)
3 (18.3)
3 (18.6)
7 (43.9)
4 (25.4)
1 (6.2)
1 (6.3)
Robberies (per 100,000)
6 (38.2)
4 (25.0)
3 (18.7)
2 (12.4)
9 (55.6)
7 (42.9)
7 (42.7)
1 (6.1)
7 (42.7)
2 (12.4)
6 (37.6)
3 (19.1)
1 (6.2)
2 (12.6)
Assaults (per 100,000)
29 (184.5)
25 (156.2)
9 (56.0)
18 (111.3)
17 (105.0)
13 (79.7)
10 (61.0)
12 (73.2)
8 (48.8)
14 (86.6)
22 (138.0)
22 (139.9)
10 (61.6)
7 (44.1)
Burglaries (per 100,000)
40 (254.5)
31 (193.7)
38 (236.6)
46 (284.4)
41 (253.1)
27 (165.5)
19 (116.0)
27 (164.7)
17 (103.7)
16 (99.0)
13 (81.5)
14 (89.0)
16 (98.5)
12 (75.6)
Thefts (per 100,000)
171 (1,088)
191 (1,193)
168 (1,046)
151 (933.5)
140 (864.3)
127 (778.4)
136 (830.2)
107 (652.8)
93 (567.1)
102 (631.2)
80 (501.7)
68 (432.3)
25 (153.9)
79 (497.6)
Auto thefts (per 100,000)
13 (82.7)
6 (37.5)
6 (37.4)
9 (55.6)
7 (43.2)
1 (6.1)
2 (12.2)
4 (24.4)
14 (85.4)
4 (24.8)
9 (56.4)
3 (19.1)
4 (24.6)
10 (63.0)
Arson (per 100,000)
2 (12.7)
2 (12.5)
1 (6.2)
0 (0.0)
1 (6.2)
0 (0.0)
3 (18.3)
5 (30.5)
2 (12.2)
2 (12.4)
0 (0.0)
1 (6.4)
0 (0.0)
1 (6.3)
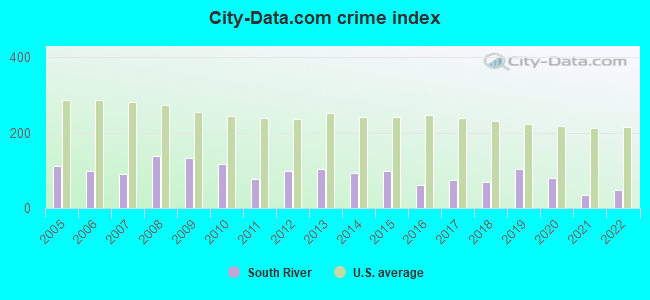
City-Data.com crime index
131.6
118.0
78.2
97.6
103.3
91.6
96.6
60.9
74.0
70.1
104.3
79.1
34.1
47.9
The City-Data.com crime index weighs serious crimes and violent crimes more heavily. Higher means more crime, U.S. average is 246.1. It adjusts for the number of visitors and daily workers commuting into cities.
Latest news from South River, NJ collected exclusively by city-data.com from local newspapers, TV, and radio stations
Ancestries: Portuguese (15.6%), Polish (6.9%), Italian (5.9%), Greek (4.3%), American (2.9%), Ukrainian (2.7%).
Current Local Time: EST time zone
Incorporated in 1898
Elevation: 80 feet
Land area: 2.81 square miles.
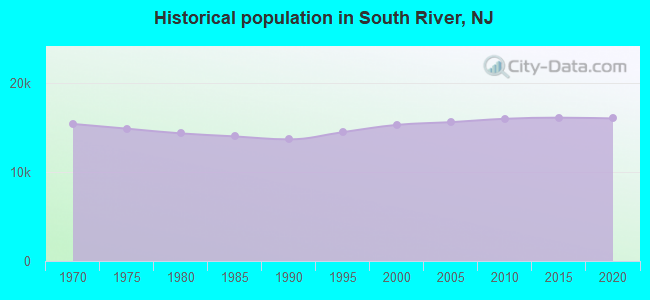
Population density: 5,682 people per square mile (average).
4,637 residents are foreign born (15.4% Latin America, 8.0% Europe, 3.3% Asia).
This borough:
28.8%
New Jersey:
23.2%
Median real estate property taxes paid for housing units with mortgages in 2022: $7,412 (1.8%) Median real estate property taxes paid for housing units with no mortgage in 2022: $7,012 (2.0%)
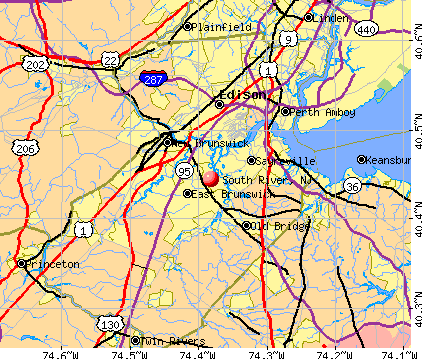
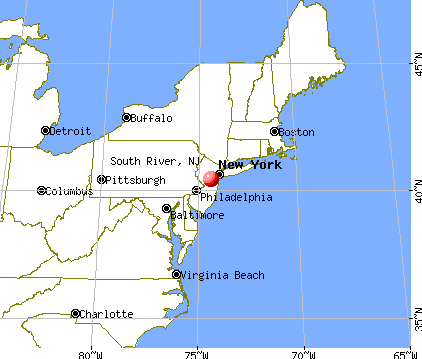
Nearest city with pop. 50,000+: Edison, NJ (6.5 miles , pop. 97,687).
Nearest city with pop. 200,000+: Staten Island, NY (15.9 miles , pop. 443,728).
Nearest city with pop. 1,000,000+: Brooklyn, NY (26.7 miles , pop. 2,465,326).
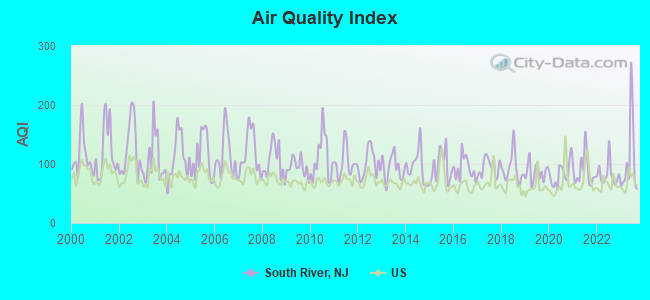
Air Quality Index (AQI) level in 2023 was 107. This is significantly worse than average.
City:
107
U.S.:
73
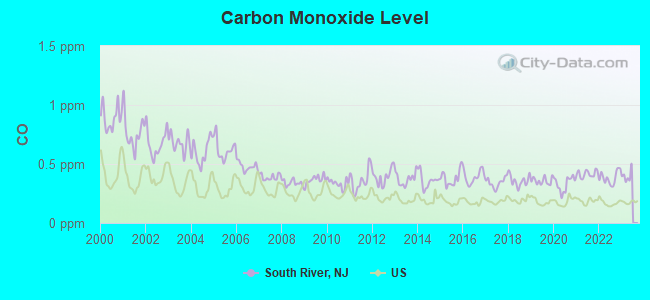
Carbon Monoxide (CO) [ppm] level in 2022 was 0.383. This is significantly worse than average.Closest monitor was 4.8 miles away from the city center.
City:
0.383
U.S.:
0.251
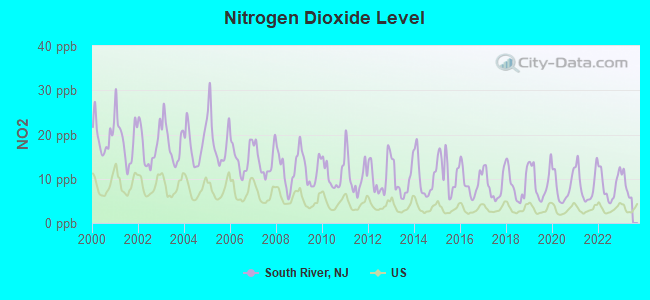
Nitrogen Dioxide (NO2) [ppb] level in 2022 was 8.47. This is significantly worse than average.Closest monitor was 2.8 miles away from the city center.
City:
8.47
U.S.:
5.11
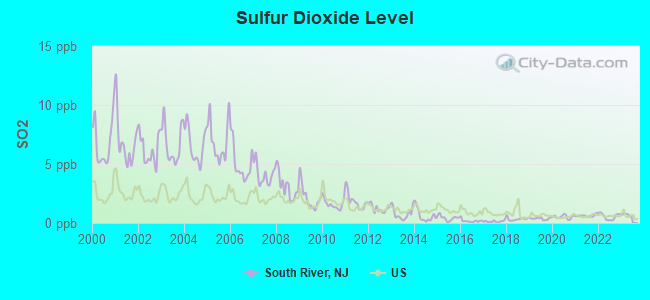
Sulfur Dioxide (SO2) [ppb] level in 2022 was 0.550. This is significantly better than average.Closest monitor was 2.9 miles away from the city center.
City:
0.550
U.S.:
1.515
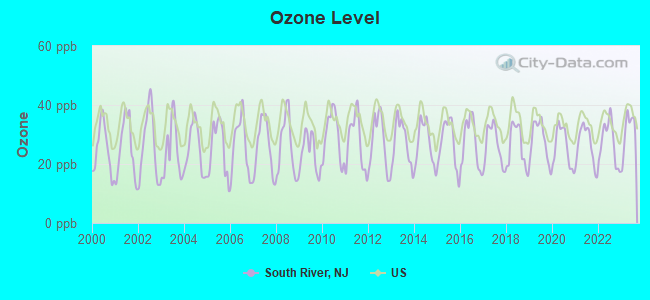
Ozone [ppb] level in 2023 was 31.0. This is about average.Closest monitor was 2.8 miles away from the city center.
City:
31.0
U.S.:
33.3
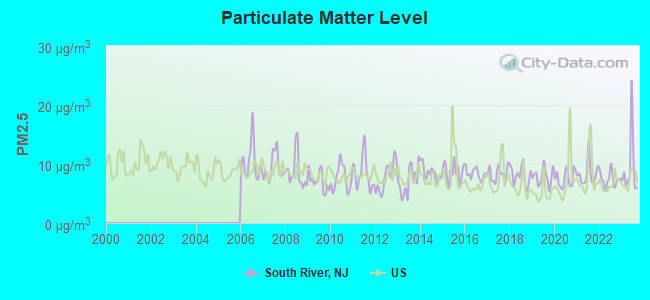
Particulate Matter (PM2.5) [µg/m3] level in 2023 was 9.33. This is about average.Closest monitor was 2.8 miles away from the city center.
City:
9.33
U.S.:
8.11
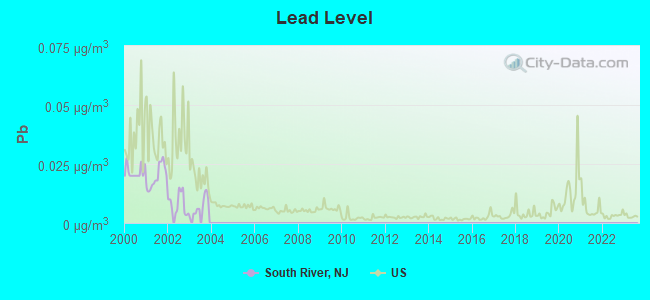
Lead (Pb) [µg/m3] level in 2003 was 0.00543. This is significantly better than average.Closest monitor was 4.2 miles away from the city center.
City:
0.00543
U.S.:
0.00931
Tornado activity:
South River-area historical tornado activity is near New Jersey state average. It is 31% smaller than the overall U.S. average.
On 10/18/1990, a category F3 (max. wind speeds 158-206 mph) tornado 20.6 miles away from the South River borough center injured 8 peopleand causedbetween $500,000 and $5,000,000 in damages.
On 5/28/1973, a category F3 tornado 25.4 miles away from the borough center causedbetween $50,000 and $500,000 in damages.
Earthquake activity:
South River-area historical earthquake activity is significantly above New Jersey state average. It is 68% smaller than the overall U.S. average.
On 8/23/2011 at 17:51:04, a magnitude 5.8 (5.8 MW, Depth: 3.7 mi, Class: Moderate, Intensity: VI - VII) earthquake occurred 258.9 miles away from the city center On 1/16/1994 at 01:49:16, a magnitude 4.6 (4.6 MB, 4.6 LG, Depth: 3.1 mi, Class: Light, Intensity: IV - V) earthquake occurred 87.6 miles away from the city center On 10/7/1983 at 10:18:46, a magnitude 5.3 (5.1 MB, 5.3 LG, 5.1 ML) earthquake occurred 242.7 miles away from South River center On 4/20/2002 at 10:50:47, a magnitude 5.3 (5.3 ML, Depth: 3.0 mi) earthquake occurred 283.5 miles away from South River center On 1/16/1994 at 00:42:43, a magnitude 4.2 (4.2 MB, 4.0 LG, Depth: 3.1 mi) earthquake occurred 86.0 miles away from the city center On 4/20/2002 at 10:50:47, a magnitude 5.2 (5.2 MB, 4.2 MS, 5.2 MW, 5.0 MW) earthquake occurred 281.7 miles away from South River center Magnitude types: regional Lg-wave magnitude (LG), body-wave magnitude (MB), local magnitude (ML), surface-wave magnitude (MS), moment magnitude (MW)
Natural disasters:
The number of natural disasters in Middlesex County (26) is a lot greater than the US average (15). Major Disasters (Presidential) Declared: 17 Emergencies Declared: 9
Causes of natural disasters: Floods: 7, Hurricanes: 7, Storms: 6, Heavy Rains: 4, Snowstorms: 3, Blizzards: 2, Water Shortages: 2, Winter Storms: 2, Tornado: 1, Wind: 1, Other: 3 (Note: some incidents may be assigned to more than one category).
Hospitals and medical centers near South River:
SUMMER HILL NURSING HOME (Nursing Home, about 3 miles away; OLD BRIDGE, NJ)
CARE ONE AT EAST BRUNSWICK (Nursing Home, about 4 miles away; EAST BRUNSWICK, NJ)
REFORMED CHURCH HOME (Nursing Home, about 5 miles away; OLD BRIDGE, NJ)
ELMS NURSING HOME (Nursing Home, about 5 miles away; CRANBURY, NJ)
VNA IN MIDDLESEX CO (Home Health Center, about 5 miles away; NORTH BRUNSWICK, NJ)
RW JOHNSON UNIVERSITY HOSPITAL DIALYSIS (Dialysis Facility, about 5 miles away; NEW BRUNSWICK, NJ)
CHILDRENS SPECIALIZED HOSPITAL (Hospital, about 6 miles away; NEW BRUNSWICK, NJ)
Amtrak stations near South River:
5 miles: NEW BRUNSWICK (FRENCH & ALBANY STS.) . Services: ticket office, fully wheelchair accessible, enclosed waiting area, public restrooms, public payphones, snack bar, ATM, free short-term parking, free long-term parking, call for car rental service, taxi stand, public transit connection.
9 miles: METROPARK (ISELIN, 100 MIDDLESEX-ESSEX TPK.) . Services: ticket office, fully wheelchair accessible, enclosed waiting area, public restrooms, public payphones, paid short-term parking, call for car rental service, taxi stand, public transit connection.
16 miles: PRINCETON JUNCTION (WALLACE RD.) . Services: ticket office, fully wheelchair accessible, enclosed waiting area, public restrooms, snack bar, paid short-term parking, paid long-term parking, call for car rental service, taxi stand, public transit connection.
Colleges/universities with over 2000 students nearest to South River:
Middlesex County College (about 5 miles; Edison, NJ; Full-time enrollment: 9,849)
Rutgers University-New Brunswick (about 6 miles; New Brunswick, NJ; FT enrollment: 39,388)
Brookdale Community College (about 16 miles; Lincroft, NJ; FT enrollment: 10,879)
Union County College (about 16 miles; Cranford, NJ; FT enrollment: 9,148)
Princeton University (about 17 miles; Princeton, NJ; FT enrollment: 6,897)
College of Staten Island CUNY (about 17 miles; Staten Island, NY; FT enrollment: 11,684)
Kean University (about 19 miles; Union, NJ; FT enrollment: 12,648)
SOUTH RIVER PUBLIC LIBRARY (Operating income: $721,093; Location: 55 APPLEBY AVENUE; 32,979 books; 394 e-books; 1,797 audio materials; 2,644 video materials; 14 local licensed databases; 22 state licensed databases; 4 other licensed databases; 145 print serial subscriptions)
User-submitted facts and corrections:
Kindergarten through 2nd grade now have their own school. added by Ann
St. Mary of Ostrabrama Parochial School has been closed since 2002, July.
W36AS (Channel 36; NEW BRUNSWICK, NJ; Owner: DEEPAK VISWANATH). This channel is a local broadcast that the South River High School ues.
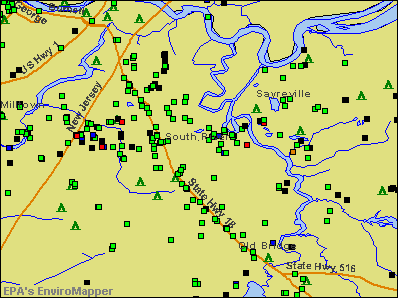
Notable locations in South River: South River Rescue Squad (A), South River Fire Station 2 Summit Fire House (B), South River Fire Department (C). Display/hide their locations on the map
Churches in South River include: First Russian Baptist Church (A), Evangelical Church of God (B), Christian Life Fellowship Center (C), Redentor Presbyterian Church (D), Union Baptist Church (E), Conklin United Methodist Church (F), Congregation Anshe Emethodist (G), Tabernacle Baptist Church (H), Saint Mary of Ostrabrama Church (I). Display/hide their locations on the map
Parks in South River include: Bissett's Recreation Area (1), Daley's Pond Recreation Area (2), Pacer's Field (3), Veterans Park Recreation Area (4). Display/hide their locations on the map
Tourist attractions: Corpus Christi Latchkey - Nurse's Office (Cultural Attractions- Events- & Facilities; 80 David Street), Museum of Modern Art (Cultural Attractions- Events- & Facilities; 5 Brick Plant Road).
Birthplace of: Janet Evanovich - Novelist, Stanley Kamel - Actor, Alex Wojciechowicz - Professional football player, Drew Pearson (American football) - Pro football wide receiver and sportscaster.
Middlesex County has a predicted average indoor radon screening level between 2 and 4 pCi/L (pico curies per liter) - Moderate Potential
Drinking water stations with addresses in South River and their reported violations in the past:
SOUTH RIVER W DEPT (Population served: 14,000, Purch surface water):
Past monitoring violations:
Monitoring, Repeat Major (TCR) - In DEC-2013, Contaminant: Coliform (TCR). Follow-up actions: St Formal NOV issued (JAN-14-2014), St Compliance achieved (JAN-17-2014)
Monitoring and Reporting (DBP) - In MAY-2013, Contaminant: Total Haloacetic Acids (HAA5). Follow-up actions: St Public Notif requested (JUL-29-2013), St Formal NOV issued (JUL-29-2013), St Public Notif received (JUN-05-2014)
Monitoring and Reporting (DBP) - In MAY-2013, Contaminant: TTHM. Follow-up actions: St Public Notif requested (JUL-29-2013), St Formal NOV issued (JUL-29-2013), St Public Notif received (JUN-05-2014)
Monitoring and Reporting (DBP) - Between OCT-2009 and DEC-2009, Contaminant: TTHM. Follow-up actions: St Public Notif requested (JUL-16-2010), St Formal NOV issued (JUL-16-2010), St Compliance achieved (SEP-21-2010)
One minor monitoring violation
Average household size:
This borough:
2.8 people
New Jersey:
2.7 people
Percentage of family households:
This borough:
71.1%
Whole state:
69.3%
Percentage of households with unmarried partners:
This borough:
6.1%
Whole state:
5.9%
Likely homosexual households (counted as self-reported same-sex unmarried-partner households)
Lesbian couples: 0.3% of all households
Gay men: 0.4% of all households
6 people in other noninstitutional facilities in 2010
5 people in residential treatment centers for adults in 2010
People in group quarters in South River in 2000:
80 people in other group homes
6 people in religious group quarters
2 people in homes or halfway houses for drug/alcohol abuse
Banks with branches in South River (2011 data):
The Provident Bank: South River at 6 Jackson Street, branch established on 1916/01/01. Info updated 2010/07/27: Bank assets: $7,097.5 mil, Deposits: $5,186.9 mil, headquarters in Jersey City, NJ, positive income, Commercial Lending Specialization, 83 total offices, Holding Company: Provident Financial Services, Inc.
PNC Bank, National Association: South River Branch at 55 Main Street, branch established on 1957/08/15. Info updated 2012/03/20: Bank assets: $263,309.6 mil, Deposits: $197,343.0 mil, headquarters in Wilmington, DE, positive income, Commercial Lending Specialization, 3085 total offices, Holding Company: Pnc Financial Services Group, Inc., The
Bank of America, National Association: South River Branch at 25 Main Street, branch established on 1965/02/11. Info updated 2009/11/18: Bank assets: $1,451,969.3 mil, Deposits: $1,077,176.8 mil, headquarters in Charlotte, NC, positive income, 5782 total offices, Holding Company: Bank Of America Corporation
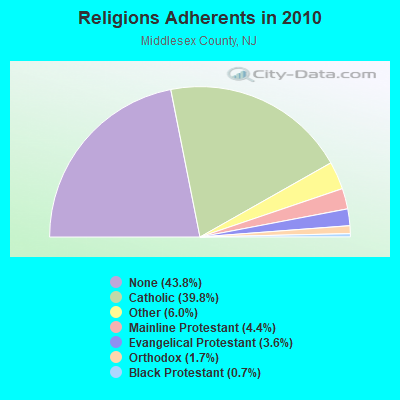
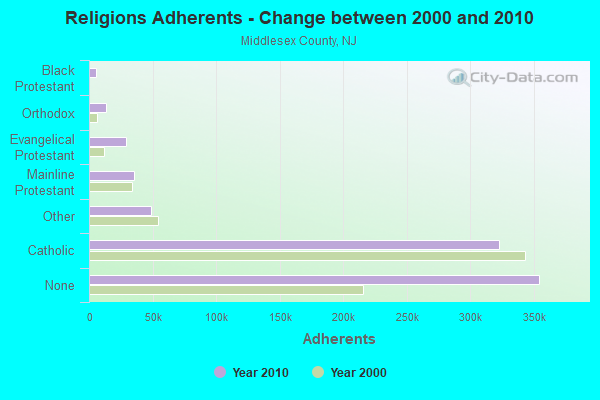
Religion statistics for South River, NJ (based on Middlesex County data)
Religion
Adherents
Congregations
Catholic
322,340
74
Other
48,717
73
Mainline Protestant
35,693
113
Evangelical Protestant
29,296
130
Orthodox
13,491
14
Black Protestant
5,879
17
None
354,442
-
Source: Clifford Grammich, Kirk Hadaway, Richard Houseal, Dale E.Jones, Alexei Krindatch, Richie Stanley and Richard H.Taylor. 2012. 2010 U.S.Religion Census: Religious Congregations & Membership Study. Association of Statisticians of American Religious Bodies. Jones, Dale E., et al. 2002. Congregations and Membership in the United States 2000. Nashville, TN: Glenmary Research Center. Graphs represent county-level data
33,070Total future (year 2041) average daily traffic
FCC Registered Broadcast Land Mobile Towers:
4
George St Firehouse (Lat: 40.449556 Lon: -74.391806), Call Sign: KDN530, Assigned Frequencies: 33.8200 MHz, Grant Date: 02/26/2021, Expiration Date: 05/07/2031, Registrant: Borough Of South River-Fire Dept., 48 Washington Street, South River, NJ 08882, Phone: (732) 257-1999, Email:
Police Headquarters Boro Hall (Lat: 40.449556 Lon: -74.391806), Call Sign: WRW42, Assigned Frequencies: 458.475 MHz, Grant Date: 02/09/2023, Expiration Date: 05/03/2033, Registrant: Tactical Public Safety, 1036 Industrial Drive, West Berlin, NJ 08091, Phone: (856) 768-3336, Fax: (856) 768-3666, Email:
Lat: 40.450833 Lon: -74.381667, Call Sign: WPNT297, Assigned Frequencies: 158.355 MHz, Grant Date: 04/10/2014, Expiration Date: 06/04/2024, Certifier: John W Adamusik, Registrant: Business Radio Licensing, 30251 Golden Lantern Suite E #501, Laguna Niguel, CA 92677, Phone: (949) 348-8510, Fax: (949) 348-8514, Email:
Police Headquarters 61 Main St (Lat: 40.449556 Lon: -74.391806), Call Sign: KYX412, Assigned Frequencies: 153.500 MHz, Grant Date: 08/26/2005, Expiration Date: 11/02/2015, Cancellation Date: 01/02/2016, Registrant: Borough Of South River, 9 Ivan Way, South River, NJ 08882, Phone: (732) 257-9051, Fax: (732) 613-6113, Email:
FCC Registered Microwave Towers:
1
223 WILLIAMS STREET, 223 Williams Street (Lat: 40.459806 Lon: -74.387056), Type: Pole, Structure height: 30.5 m, Call Sign: WQJY309, Assigned Frequencies: 11615.0 MHz, Grant Date: 02/11/2009, Expiration Date: 02/01/2019, Cancellation Date: 09/04/2009, Certifier: James J.R. Talbot, Registrant: At&t Corp., 2315 Salem Road, First Floor, H9, Conyers, GA 30013, Phone: (770) 602-2065, Fax: (770) 929-4454, Email:
Aircraft: SEMCO BALLOON MARK V (Category: Land, Seats: 4, Weight: Up to 12,499 Pounds, Speed: 69 mph), Engine: None N-Number: 36001, N36001, N-36001, Serial Number: SEM-159, Year manufactured: 1975, Certificate Issue Date: 11/18/1975 Registrant (Corporation): Marchuks Modern Service Inc, 1 Ferry St, South River, NJ 08882 Deregistered:Cancel Date: 03/16/2018
Home Mortgage Disclosure Act Aggregated Statistics For Year 2009 (Based on 3 full tracts)
A) FHA, FSA/RHS & VA Home Purchase Loans
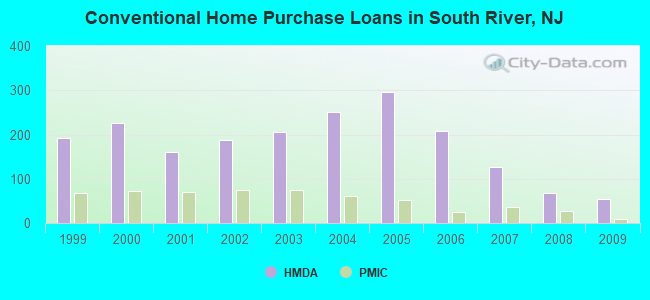
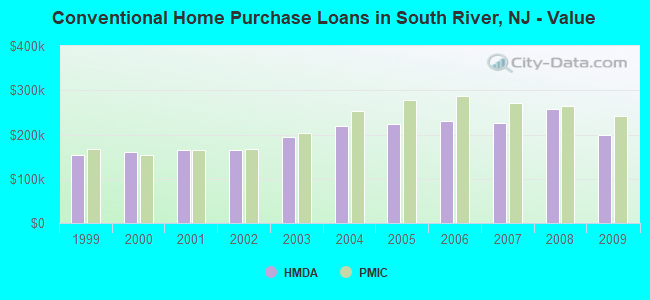
B) Conventional Home Purchase Loans
C) Refinancings
D) Home Improvement Loans
E) Loans on Dwellings For 5+ Families
F) Non-occupant Loans on < 5 Family Dwellings (A B C & D)
Number
Average Value
Number
Average Value
Number
Average Value
Number
Average Value
Number
Average Value
Number
Average Value
LOANS ORIGINATED
46
$250,913
54
$197,981
259
$220,544
14
$70,429
2
$2,122,000
11
$166,545
APPLICATIONS APPROVED, NOT ACCEPTED
6
$244,167
10
$220,400
35
$234,400
2
$141,500
0
$0
2
$258,000
APPLICATIONS DENIED
9
$215,333
8
$252,000
146
$242,438
14
$93,286
0
$0
6
$291,167
APPLICATIONS WITHDRAWN
9
$234,889
7
$201,000
67
$265,716
2
$165,000
0
$0
3
$158,667
FILES CLOSED FOR INCOMPLETENESS
6
$243,667
0
$0
19
$257,105
2
$65,000
0
$0
0
$0
Aggregated Statistics For Year 2008 (Based on 3 full tracts)
A) FHA, FSA/RHS & VA Home Purchase Loans
B) Conventional Home Purchase Loans
C) Refinancings
D) Home Improvement Loans
E) Loans on Dwellings For 5+ Families
F) Non-occupant Loans on < 5 Family Dwellings (A B C & D)
Number
Average Value
Number
Average Value
Number
Average Value
Number
Average Value
Number
Average Value
Number
Average Value
LOANS ORIGINATED
30
$243,833
67
$258,358
175
$233,720
24
$67,750
0
$0
14
$177,214
APPLICATIONS APPROVED, NOT ACCEPTED
4
$245,500
17
$222,412
46
$210,761
9
$93,333
0
$0
8
$234,000
APPLICATIONS DENIED
17
$257,941
22
$237,682
137
$236,547
41
$45,195
1
$5,000,000
21
$190,238
APPLICATIONS WITHDRAWN
5
$282,000
12
$231,250
57
$231,842
16
$131,250
0
$0
3
$245,333
FILES CLOSED FOR INCOMPLETENESS
1
$213,000
4
$249,250
15
$325,600
2
$135,000
0
$0
1
$100,000
Aggregated Statistics For Year 2007 (Based on 3 full tracts)
A) FHA, FSA/RHS & VA Home Purchase Loans
B) Conventional Home Purchase Loans
C) Refinancings
D) Home Improvement Loans
E) Loans on Dwellings For 5+ Families
F) Non-occupant Loans on < 5 Family Dwellings (A B C & D)
Number
Average Value
Number
Average Value
Number
Average Value
Number
Average Value
Number
Average Value
Number
Average Value
LOANS ORIGINATED
11
$274,455
127
$226,488
268
$237,679
76
$82,776
2
$910,000
26
$202,308
APPLICATIONS APPROVED, NOT ACCEPTED
1
$274,000
20
$218,950
60
$235,817
15
$81,667
0
$0
6
$177,500
APPLICATIONS DENIED
3
$243,333
43
$221,349
193
$245,477
76
$69,184
0
$0
14
$239,286
APPLICATIONS WITHDRAWN
2
$249,000
19
$278,053
95
$237,579
13
$176,538
1
$336,000
8
$225,375
FILES CLOSED FOR INCOMPLETENESS
0
$0
6
$235,167
47
$275,957
0
$0
0
$0
3
$148,333
Aggregated Statistics For Year 2006 (Based on 3 full tracts)
A) FHA, FSA/RHS & VA Home Purchase Loans
B) Conventional Home Purchase Loans
C) Refinancings
D) Home Improvement Loans
E) Loans on Dwellings For 5+ Families
F) Non-occupant Loans on < 5 Family Dwellings (A B C & D)
G) Loans On Manufactured Home Dwelling (A B C & D)
Number
Average Value
Number
Average Value
Number
Average Value
Number
Average Value
Number
Average Value
Number
Average Value
Number
Average Value
LOANS ORIGINATED
6
$265,000
208
$231,130
420
$220,045
83
$63,229
4
$558,250
46
$226,804
0
$0
APPLICATIONS APPROVED, NOT ACCEPTED
0
$0
22
$218,636
77
$209,429
20
$76,400
0
$0
11
$195,091
0
$0
APPLICATIONS DENIED
1
$62,000
71
$216,423
193
$229,358
57
$60,368
3
$453,333
26
$156,462
3
$36,333
APPLICATIONS WITHDRAWN
1
$362,000
35
$217,914
184
$229,457
11
$68,455
0
$0
10
$245,400
0
$0
FILES CLOSED FOR INCOMPLETENESS
1
$316,000
7
$226,000
54
$265,481
4
$105,000
0
$0
0
$0
0
$0
Aggregated Statistics For Year 2005 (Based on 3 full tracts)
A) FHA, FSA/RHS & VA Home Purchase Loans
B) Conventional Home Purchase Loans
C) Refinancings
D) Home Improvement Loans
E) Loans on Dwellings For 5+ Families
F) Non-occupant Loans on < 5 Family Dwellings (A B C & D)
G) Loans On Manufactured Home Dwelling (A B C & D)
Number
Average Value
Number
Average Value
Number
Average Value
Number
Average Value
Number
Average Value
Number
Average Value
Number
Average Value
LOANS ORIGINATED
16
$259,562
296
$222,716
502
$203,839
95
$70,537
3
$660,333
42
$195,881
0
$0
APPLICATIONS APPROVED, NOT ACCEPTED
0
$0
36
$205,639
75
$196,347
15
$100,400
0
$0
6
$185,333
1
$80,000
APPLICATIONS DENIED
2
$284,000
80
$214,050
200
$214,615
51
$77,863
0
$0
13
$193,923
0
$0
APPLICATIONS WITHDRAWN
3
$240,667
64
$208,953
270
$229,130
23
$127,478
1
$256,000
11
$219,636
0
$0
FILES CLOSED FOR INCOMPLETENESS
0
$0
8
$259,500
41
$230,341
4
$36,750
0
$0
3
$153,000
0
$0
Aggregated Statistics For Year 2004 (Based on 3 full tracts)
A) FHA, FSA/RHS & VA Home Purchase Loans
B) Conventional Home Purchase Loans
C) Refinancings
D) Home Improvement Loans
E) Loans on Dwellings For 5+ Families
F) Non-occupant Loans on < 5 Family Dwellings (A B C & D)
G) Loans On Manufactured Home Dwelling (A B C & D)
Number
Average Value
Number
Average Value
Number
Average Value
Number
Average Value
Number
Average Value
Number
Average Value
Number
Average Value
LOANS ORIGINATED
23
$239,130
251
$218,618
413
$177,356
57
$76,088
2
$321,500
38
$200,105
0
$0
APPLICATIONS APPROVED, NOT ACCEPTED
2
$242,500
26
$189,000
82
$159,951
16
$76,125
1
$330,000
6
$186,667
0
$0
APPLICATIONS DENIED
6
$228,167
34
$178,676
228
$186,171
44
$72,091
0
$0
19
$180,684
1
$123,000
APPLICATIONS WITHDRAWN
4
$199,000
39
$222,128
172
$176,430
13
$133,692
1
$345,000
11
$164,000
0
$0
FILES CLOSED FOR INCOMPLETENESS
1
$161,000
2
$256,000
23
$233,217
6
$51,667
0
$0
0
$0
0
$0
Aggregated Statistics For Year 2003 (Based on 3 full tracts)
A) FHA, FSA/RHS & VA Home Purchase Loans
B) Conventional Home Purchase Loans
C) Refinancings
D) Home Improvement Loans
E) Loans on Dwellings For 5+ Families
F) Non-occupant Loans on < 5 Family Dwellings (A B C & D)
Number
Average Value
Number
Average Value
Number
Average Value
Number
Average Value
Number
Average Value
Number
Average Value
LOANS ORIGINATED
22
$209,045
206
$193,976
886
$152,737
64
$50,672
2
$145,000
48
$148,167
APPLICATIONS APPROVED, NOT ACCEPTED
2
$217,000
31
$179,742
119
$155,588
18
$41,278
0
$0
14
$139,500
APPLICATIONS DENIED
4
$164,500
29
$193,828
213
$158,779
25
$60,080
0
$0
16
$148,938
APPLICATIONS WITHDRAWN
6
$175,667
35
$163,314
182
$161,802
6
$61,667
0
$0
14
$181,929
FILES CLOSED FOR INCOMPLETENESS
1
$207,000
12
$238,250
40
$171,000
4
$60,000
0
$0
2
$167,000
Aggregated Statistics For Year 2002 (Based on 3 full tracts)
A) FHA, FSA/RHS & VA Home Purchase Loans
B) Conventional Home Purchase Loans
C) Refinancings
D) Home Improvement Loans
E) Loans on Dwellings For 5+ Families
F) Non-occupant Loans on < 5 Family Dwellings (A B C & D)
Number
Average Value
Number
Average Value
Number
Average Value
Number
Average Value
Number
Average Value
Number
Average Value
LOANS ORIGINATED
20
$175,250
187
$164,358
584
$142,813
45
$40,800
2
$224,500
37
$125,514
APPLICATIONS APPROVED, NOT ACCEPTED
5
$127,200
25
$159,240
98
$133,929
23
$33,261
0
$0
5
$167,200
APPLICATIONS DENIED
5
$173,400
13
$119,923
202
$127,356
46
$45,022
0
$0
9
$160,333
APPLICATIONS WITHDRAWN
3
$171,000
25
$150,080
130
$146,638
17
$36,824
0
$0
8
$122,125
FILES CLOSED FOR INCOMPLETENESS
3
$153,667
5
$189,400
33
$125,061
2
$82,000
0
$0
0
$0
Aggregated Statistics For Year 2001 (Based on 3 full tracts)
A) FHA, FSA/RHS & VA Home Purchase Loans
B) Conventional Home Purchase Loans
C) Refinancings
D) Home Improvement Loans
E) Loans on Dwellings For 5+ Families
F) Non-occupant Loans on < 5 Family Dwellings (A B C & D)
Number
Average Value
Number
Average Value
Number
Average Value
Number
Average Value
Number
Average Value
Number
Average Value
LOANS ORIGINATED
38
$152,737
161
$165,255
356
$134,163
40
$35,450
1
$176,000
21
$109,381
APPLICATIONS APPROVED, NOT ACCEPTED
5
$160,600
25
$162,200
49
$104,061
17
$40,235
0
$0
1
$134,000
APPLICATIONS DENIED
2
$140,000
32
$143,031
140
$101,329
52
$27,404
0
$0
7
$104,000
APPLICATIONS WITHDRAWN
5
$153,600
12
$138,083
85
$115,918
12
$85,500
0
$0
5
$102,400
FILES CLOSED FOR INCOMPLETENESS
2
$138,500
1
$260,000
16
$104,062
2
$52,500
0
$0
0
$0
Aggregated Statistics For Year 2000 (Based on 3 full tracts)
A) FHA, FSA/RHS & VA Home Purchase Loans
B) Conventional Home Purchase Loans
C) Refinancings
D) Home Improvement Loans
E) Loans on Dwellings For 5+ Families
F) Non-occupant Loans on < 5 Family Dwellings (A B C & D)
Number
Average Value
Number
Average Value
Number
Average Value
Number
Average Value
Number
Average Value
Number
Average Value
LOANS ORIGINATED
39
$133,538
227
$159,564
87
$93,632
33
$35,394
3
$1,427,000
15
$121,867
APPLICATIONS APPROVED, NOT ACCEPTED
5
$120,800
34
$155,000
43
$111,465
26
$23,385
0
$0
1
$204,000
APPLICATIONS DENIED
3
$138,667
38
$145,000
111
$67,216
47
$25,340
0
$0
8
$86,500
APPLICATIONS WITHDRAWN
2
$153,000
21
$164,286
48
$91,042
10
$32,500
0
$0
2
$415,500
FILES CLOSED FOR INCOMPLETENESS
1
$155,000
6
$150,000
32
$114,844
1
$20,000
0
$0
1
$75,000
Aggregated Statistics For Year 1999 (Based on 2 full and 1 partial tracts)
A) FHA, FSA/RHS & VA Home Purchase Loans
B) Conventional Home Purchase Loans
C) Refinancings
D) Home Improvement Loans
E) Loans on Dwellings For 5+ Families
F) Non-occupant Loans on < 5 Family Dwellings (A B C & D)
2004 - 2018 National Fire Incident Reporting System (NFIRS) incidents
According to the data from the years 2004 - 2018 the average number of fire incidents per year is 31. The highest number of fire incidents - 94 took place in 2012, and the least - 2 in 2011. The data has a declining trend.
When looking into fire subcategories, the most reports belonged to: Structure Fires (66.1%), and Outside Fires (25.2%).
Fire incident types reported to NFIRS in South River, NJ
#19 on the list of "Top 101 cities with the most residents born in Portugal (population 500+)"
#29 on the list of "Top 101 cities with the most residents born in Southern Europe (population 500+)"
#52 on the list of "Top 101 cities with the most residents born in Europe (population 500+)"
#52 on the list of "Top 101 cities with the most residents born in Egypt (population 500+)"
#76 on the list of "Top 101 cities with the most residents born in Brazil (population 500+)"
#92 on the list of "Top 101 cities with the most residents born in Northern Africa (population 500+)"
#15 on the list of "Top 101 counties with the most Orthodox adherents"
#17 on the list of "Top 101 counties with the lowest percentage of residents that keep firearms around their homes"
#24 on the list of "Top 101 counties with the lowest number of infant deaths per 1000 residents 2007-2013 (pop. 50,000+)"
#25 on the list of "Top 101 counties with the largest decrease in the number of infant deaths per 1000 residents 2000-2006 to 2007-2013 (pop. 50,000+)"
#29 on the list of "Top 101 counties with the most Catholic congregations"


 Recent articles from our blog. Our writers, many of them Ph.D. graduates or candidates, create easy-to-read articles on a wide variety of topics.

 (6.5 miles


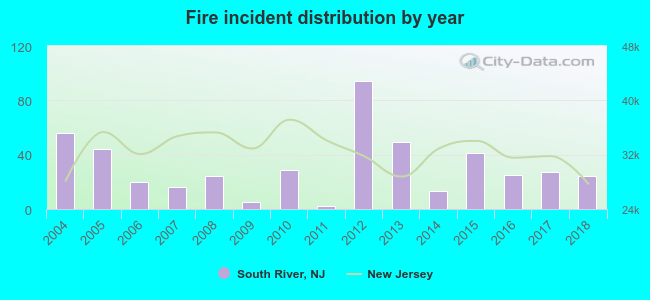 According to the data from the years 2004 - 2018 the average number of fire incidents per year is 31. The highest number of fire incidents - 94 took place in 2012, and the least - 2 in 2011. The data has a declining trend.
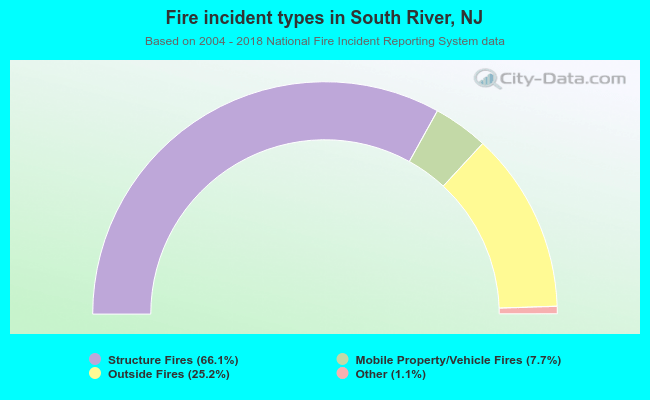 When looking into fire subcategories, the most reports belonged to: Structure Fires (66.1%), and Outside Fires (25.2%).