South Salt Lake, Utah
Submit your own pictures of this city and show them to the world
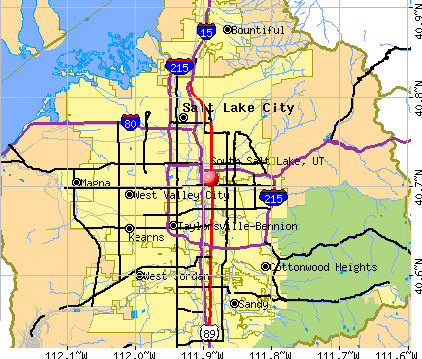
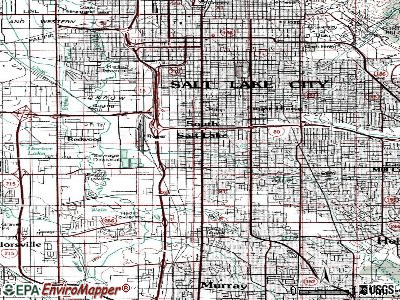
- OSM Map
- General Map
- Google Map
- MSN Map
Population change since 2000: +18.0%
 |
| Males: 13,392 | |
| Females: 12,611 |
| Median resident age: | 32.0 years |
| Utah median age: | 32.1 years |
Zip codes: 84115.
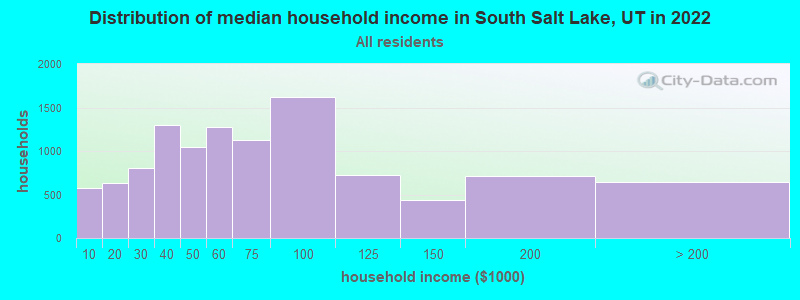
| South Salt Lake: | $58,339 |
| UT: | $89,168 |
Estimated per capita income in 2022: $33,339 (it was $15,474 in 2000)
South Salt Lake city income, earnings, and wages data
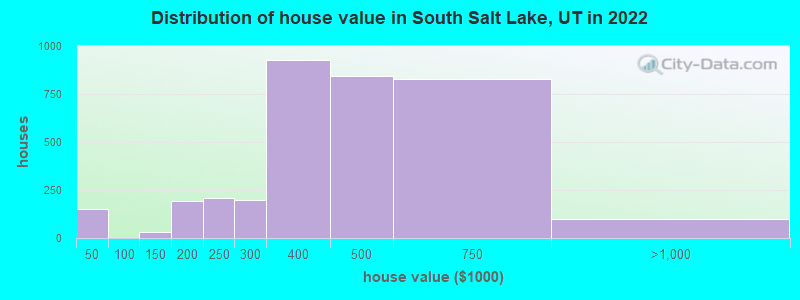
Estimated median house or condo value in 2022: $430,197 (it was $113,000 in 2000)
| South Salt Lake: | $430,197 |
| UT: | $499,500 |
Mean prices in 2022: all housing units: $364,071; detached houses: $394,263; townhouses or other attached units: $389,511; in 2-unit structures: $679,513; in 3-to-4-unit structures: $287,674; in 5-or-more-unit structures: $174,836; mobile homes: $39,815
Median gross rent in 2022: $1,229.
South Salt Lake, UT residents, houses, and apartments details
(13.5% for White Non-Hispanic residents, 8.8% for Black residents, 14.6% for Hispanic or Latino residents, 15.3% for American Indian residents, 9.4% for Native Hawaiian and other Pacific Islander residents, 16.7% for other race residents, 3.3% for two or more races residents)
Detailed information about poverty and poor residents in South Salt Lake, UT
Compare current foreclosures near South Salt Lake, UT:
| Photo | Address | Area | Beds / Baths | Price | Details |
|---|---|---|---|---|---|

|
#1
E Downington Ave
Salt Lake City, UT 84108
|
2,580 sq. feet
|
2 baths 1 beds |
$949,900
|
show details |

|
#2
S Holladay Cir
Salt Lake City, UT 84117
|
2,440 sq. feet
|
2 baths 4 beds |
$799,900
|
show details |

|
#3
W Honda Ave
Salt Lake City, UT 84119
|
1,064 sq. feet
|
2 baths 3 beds |
show details | |

|
#4
W Homestead Farms Ln Apt 4
Salt Lake City, UT 84119
|
1,292 sq. feet
|
2 baths 3 beds |
show details | |

|
#5
E Bonneville Dr
Bountiful, UT 84010
|
1,188 sq. feet
|
2 baths 4 beds |
show details | |

|
#6
E 10375 S
Sandy, UT 84070
|
900 sq. feet
|
2 baths 4 beds |
show details | |

|
#7
S Cambridge Dr
Salt Lake City, UT 84119
|
1,097 sq. feet
|
1 baths 3 beds |
show details | |

|
#8
E Castle Hill Ave
Salt Lake City, UT 84121
|
1,024 sq. feet
|
2 baths 3 beds |
show details | |

|
#9
W Maytime Dr
Magna, UT 84044
|
991 sq. feet
|
2 baths 4 beds |
show details | |

|
#10
W 7560 S
West Jordan, UT 84084
|
984 sq. feet
|
2 baths 4 beds |
show details |
| Photo | Address | Area | Beds / Baths | Price | Details |
|---|---|---|---|---|---|

|
#11
E 10230 S
Sandy, UT 84070
|
893 sq. feet
|
1 baths 4 beds |
show details | |

|
#12
E Oakridge Dr
Salt Lake City, UT 84106
|
1,567 sq. feet
|
3 baths 5 beds |
show details | |

|
#13
S 7785 W
Magna, UT 84044
|
816 sq. feet
|
2 baths 4 beds |
show details | |

|
#14
W 7105 S
West Jordan, UT 84084
|
2,631 sq. feet
|
1 baths 4 beds |
show details | |

|
#15
S 5900 W
West Jordan, UT 84081
|
2,542 sq. feet
|
3 baths 4 beds |
show details | |

|
#16
E River Oaks Dr
Sandy, UT 84093
|
2,527 sq. feet
|
5 baths 8 beds |
show details | |

|
#17
S 1630 W
Salt Lake City, UT 84119
|
1,599 sq. feet
|
3 baths 3 beds |
show details | |

|
#18
W Sunnybrook Dr
Salt Lake City, UT 84119
|
976 sq. feet
|
1 baths 3 beds |
show details | |

|
#19
S 1175 W Unit 25c
Salt Lake City, UT 84123
|
447 sq. feet
|
1 baths 2 beds |
show details | |

|
#20
W 3800 S
Bountiful, UT 84010
|
1,236 sq. feet
|
2 baths 4 beds |
show details |
| Photo | Address | Area | Beds / Baths | Price | Details |
|---|---|---|---|---|---|

|
#21
W Sable Cir
Salt Lake City, UT 84129
|
974 sq. feet
|
2 baths 3 beds |
show details | |

|
#22
W Homestead Farms Ln Apt 4
Salt Lake City, UT 84119
|
1,337 sq. feet
|
2 baths 3 beds |
show details | |

|
#23
N Fairway Dr
North Salt Lake, UT 84054
|
2,929 sq. feet
|
3 baths 4 beds |
show details | |

|
#24
S 3100 W
West Jordan, UT 84084
|
2,007 sq. feet
|
3 baths 5 beds |
show details | |

|
#25
E Resaca Dr Unit F2
Sandy, UT 84070
|
1,185 sq. feet
|
2 baths 3 beds |
show details | |

|
#26
S Allen St
Midvale, UT 84047
|
1,219 sq. feet
|
2 baths 3 beds |
show details | |

|
#27
E Hidden Oak Dr
Salt Lake City, UT 84121
|
3,730 sq. feet
|
4 baths 4 beds |
show details | |

|
#28
S Oak Meadows Dr Apt 31
Salt Lake City, UT 84123
|
662 sq. feet
|
1 baths 1 beds |
show details | |

|
#29
Westslope Dr
Salt Lake City, UT 84118
|
924 sq. feet
|
2 baths 4 beds |
show details | |

|
#30
W 5215 S
Salt Lake City, UT 84118
|
1,443 sq. feet
|
1 baths 3 beds |
show details |
| Photo | Address | Area | Beds / Baths | Price | Details |
|---|---|---|---|---|---|

|
#31
S 4620 W
Salt Lake City, UT 84118
|
1,002 sq. feet
|
1 baths 3 beds |
show details | |

|
#32
S Glacier Ridge Dr
Sandy, UT 84092
|
2,808 sq. feet
|
3 baths 7 beds |
show details | |

|
#33
E 4025 S
Salt Lake City, UT 84124
|
875 sq. feet
|
1 baths 3 beds |
show details | |

|
#34
E Waterside Cv Apt 23
Midvale, UT 84047
|
824 sq. feet
|
2 baths 2 beds |
show details | |

|
#35
N Marion St
Salt Lake City, UT 84116
|
780 sq. feet
|
1 baths 4 beds |
show details | |

|
#36
W Tytus Dr
Salt Lake City, UT 84107
|
2,005 sq. feet
|
3 baths 3 beds |
show details | |

|
#37
W 8305 S
West Jordan, UT 84081
|
2,596 sq. feet
|
3 baths 4 beds |
show details | |

|
#38
S Madison Nan Dr
West Jordan, UT 84081
|
1,330 sq. feet
|
2 baths 3 beds |
show details | |

|
#39
W 4955 S
Salt Lake City, UT 84118
|
1,624 sq. feet
|
2 baths 4 beds |
show details | |

|
#40
S 3760 W
Salt Lake City, UT 84120
|
1,141 sq. feet
|
2 baths 4 beds |
show details |
| Photo | Address | Area | Beds / Baths | Price | Details |
|---|---|---|---|---|---|

|
#41
E 1700 S
Salt Lake City, UT 84105
|
2,417 sq. feet
|
3 baths 3 beds |
show details | |

|
#42
E Walker Ln
Salt Lake City, UT 84117
|
10,574 sq. feet
|
6 baths 7 beds |
show details | |

|
#43
S Ewell Dr
Salt Lake City, UT 84107
|
1,272 sq. feet
|
1 baths 3 beds |
show details | |

|
#44
E Grand Cayman Dr
Salt Lake City, UT 84107
|
1,660 sq. feet
|
3 baths 4 beds |
show details | |

|
#45
S 8650 W
Magna, UT 84044
|
895 sq. feet
|
2 baths 3 beds |
show details | |

|
#46
W Telegraph Hill Dr
Salt Lake City, UT 84123
|
770 sq. feet
|
1 baths 2 beds |
show details | |

|
#47
W 5335 S
Salt Lake City, UT 84118
|
956 sq. feet
|
3 baths 4 beds |
show details | |

|
#48
W 4100 S
Salt Lake City, UT 84120
|
952 sq. feet
|
2 baths 5 beds |
show details | |

|
#49
S Hawkeye Dr
Salt Lake City, UT 84120
|
1,471 sq. feet
|
4 baths 6 beds |
show details | |

|
Check over 1 million property listings on Foreclosure.com!
|
browse all offers | |||


- 13,13649.7%White alone
- 8,01930.3%Hispanic
- 2,5439.6%Asian alone
- 1,1414.3%Two or more races
- 9793.7%Black alone
- 5182.0%American Indian alone
- 3081.2%Native Hawaiian and Other
Pacific Islander alone - 80.03%Other race alone
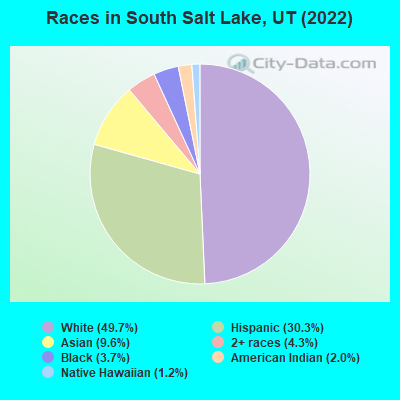
Races in South Salt Lake detailed stats: ancestries, foreign born residents, place of birth
According to our research of Utah and other state lists, there were 69 registered sex offenders living in South Salt Lake, Utah as of June 16, 2024.
The ratio of all residents to sex offenders in South Salt Lake is 366 to 1.
The ratio of registered sex offenders to all residents in this city is near the state average.
Type |
2009 |
2010 |
2011 |
2012 |
2013 |
2014 |
2015 |
2016 |
2017 |
2018 |
2019 |
2020 |
2021 |
2022 |
|---|---|---|---|---|---|---|---|---|---|---|---|---|---|---|
| Murders (per 100,000) | 1 (4.7) | 5 (21.2) | 2 (8.3) | 3 (12.3) | 2 (8.1) | 2 (8.0) | 1 (4.0) | 3 (12.0) | 2 (8.1) | 6 (23.8) | 1 (3.9) | 4 (15.5) | 3 (11.8) | 0 (0.0) |
| Rapes (per 100,000) | 44 (205.1) | 32 (135.5) | 35 (145.4) | 51 (209.5) | 42 (170.8) | 47 (188.3) | 51 (203.8) | 37 (147.9) | 44 (177.3) | 50 (198.7) | 24 (93.8) | 39 (151.1) | 44 (173.1) | 10 (38.4) |
| Robberies (per 100,000) | 55 (256.4) | 62 (262.5) | 45 (186.9) | 30 (123.3) | 45 (183.0) | 44 (176.3) | 46 (183.9) | 58 (231.8) | 54 (217.6) | 57 (226.6) | 49 (191.4) | 73 (282.8) | 54 (212.4) | 11 (42.3) |
| Assaults (per 100,000) | 98 (456.9) | 112 (474.2) | 91 (378.0) | 124 (509.4) | 117 (475.7) | 119 (476.7) | 129 (515.6) | 106 (423.6) | 135 (544.1) | 129 (512.7) | 131 (511.7) | 134 (519.1) | 160 (629.4) | 38 (146.0) |
| Burglaries (per 100,000) | 295 (1,375) | 239 (1,012) | 264 (1,097) | 241 (990.1) | 216 (878.2) | 226 (905.4) | 228 (911.3) | 323 (1,291) | 355 (1,431) | 237 (942.0) | 256 (1,000) | 234 (906.4) | 146 (574.3) | 34 (130.7) |
| Thefts (per 100,000) | 1,247 (5,814) | 1,176 (4,979) | 1,059 (4,399) | 1,129 (4,638) | 1,145 (4,655) | 1,176 (4,711) | 1,244 (4,972) | 1,268 (5,068) | 1,226 (4,941) | 1,246 (4,952) | 1,264 (4,938) | 1,679 (6,504) | 1,359 (5,346) | 281 (1,080) |
| Auto thefts (per 100,000) | 271 (1,264) | 247 (1,046) | 258 (1,072) | 207 (850.5) | 320 (1,301) | 278 (1,114) | 337 (1,347) | 372 (1,487) | 397 (1,600) | 313 (1,244) | 350 (1,367) | 462 (1,790) | 431 (1,695) | 74 (284.4) |
| Arson (per 100,000) | 7 (32.6) | 4 (16.9) | 1 (4.2) | 2 (8.2) | 5 (20.3) | 2 (8.0) | 4 (16.0) | 4 (16.0) | 6 (24.2) | 2 (7.9) | 4 (15.6) | 12 (46.5) | 3 (11.8) | 2 (7.7) |
| City-Data.com crime index | 771.7 | 678.0 | 603.1 | 654.0 | 654.7 | 655.8 | 699.8 | 708.5 | 757.9 | 740.7 | 619.5 | 807.3 | 741.3 | 147.7 |
The City-Data.com crime index weighs serious crimes and violent crimes more heavily. Higher means more crime, U.S. average is 246.1. It adjusts for the number of visitors and daily workers commuting into cities.
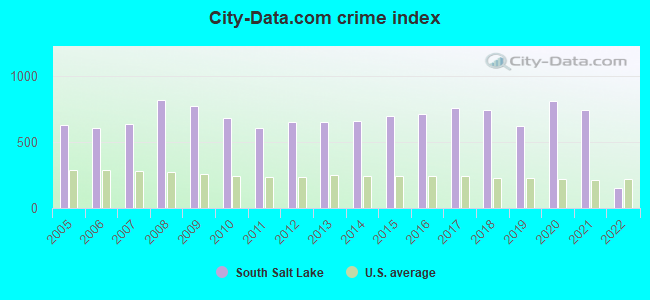
Crime rate in South Salt Lake detailed stats: murders, rapes, robberies, assaults, burglaries, thefts, arson
Full-time law enforcement employees in 2021, including police officers: 83 (70 officers - 65 male; 5 female).
| Officers per 1,000 residents here: | 2.75 |
| Utah average: | 1.67 |
 Recent articles from our blog. Our writers, many of them Ph.D. graduates or candidates, create easy-to-read articles on a wide variety of topics.

 | Black in SLC (154 replies) |
| Summer Travel to Salt Lake City (52 replies) |
| Foodie recommendations (5 replies) |
| Relocating to SLC in late fall (9 replies) |
| Another Moving thread...Denver to Lehi (14 replies) |
| Seen this person around? (Please remove if not allowed) (1 reply) |
Latest news from South Salt Lake, UT collected exclusively by city-data.com from local newspapers, TV, and radio stations
Ancestries: English (6.0%), Irish (4.4%), American (3.3%), German (3.2%), Italian (2.6%), European (2.1%).
Current Local Time: MST time zone
Elevation: 4263 feet
Land area: 6.91 square miles.
Population density: 3,765 people per square mile (average).
6,234 residents are foreign born (13.2% Latin America, 6.4% Asia).
| This city: | 23.6% |
| Utah: | 8.4% |
Median real estate property taxes paid for housing units with mortgages in 2022: $1,995 (0.5%)
Median real estate property taxes paid for housing units with no mortgage in 2022: $2,097 (0.5%)
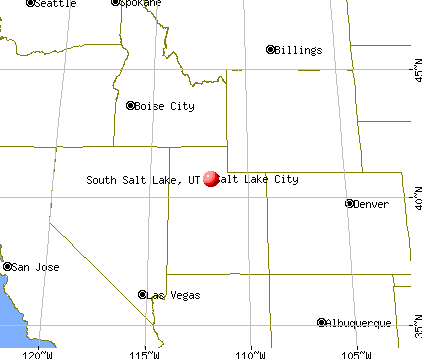
Nearest city with pop. 50,000+: Salt Lake City, UT  (3.2 miles , pop. 181,743).
Nearest city with pop. 200,000+: Las Vegas, NV (360.6 miles , pop. 478,434).
Nearest city with pop. 1,000,000+: Phoenix, AZ (496.7 miles , pop. 1,321,045).
Nearest cities:
), ), ), ), )Latitude: 40.71 N, Longitude: 111.89 W
Daytime population change due to commuting: +12,641 (+47.8%)
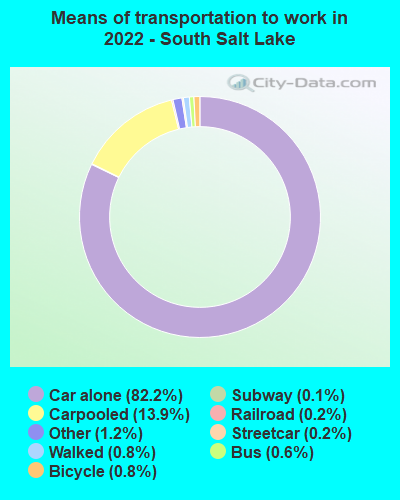
Workers who live and work in this city: 3,042 (19.8%)
Area code commonly used in this area: 801
South Salt Lake, Utah accommodation & food services, waste management - Economy and Business Data
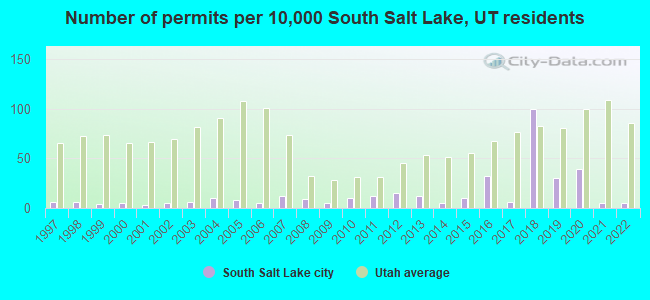
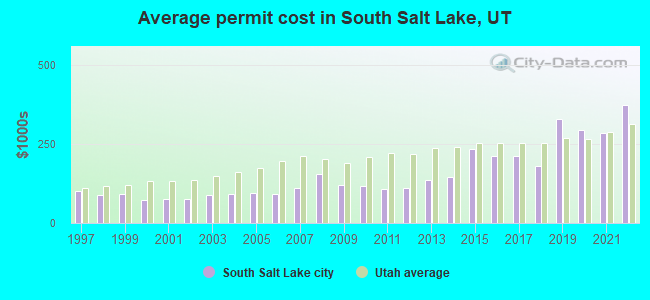
Single-family new house construction building permits:
- 2022: 10 buildings, average cost: $374,100
- 2021: 10 buildings, average cost: $284,500
- 2020: 85 buildings, average cost: $296,000
- 2019: 66 buildings, average cost: $329,000
- 2018: 220 buildings, average cost: $181,800
- 2017: 14 buildings, average cost: $212,900
- 2016: 70 buildings, average cost: $213,100
- 2015: 23 buildings, average cost: $232,700
- 2014: 11 buildings, average cost: $145,600
- 2013: 27 buildings, average cost: $137,400
- 2012: 33 buildings, average cost: $109,900
- 2011: 26 buildings, average cost: $106,700
- 2010: 23 buildings, average cost: $115,600
- 2009: 10 buildings, average cost: $121,400
- 2008: 19 buildings, average cost: $154,500
- 2007: 27 buildings, average cost: $110,400
- 2006: 12 buildings, average cost: $92,900
- 2005: 17 buildings, average cost: $95,900
- 2004: 21 buildings, average cost: $92,800
- 2003: 14 buildings, average cost: $90,400
- 2002: 10 buildings, average cost: $75,000
- 2001: 7 buildings, average cost: $76,900
- 2000: 10 buildings, average cost: $74,300
- 1999: 9 buildings, average cost: $92,600
- 1998: 13 buildings, average cost: $90,400
- 1997: 14 buildings, average cost: $101,800
| Here: | 3.1% |
| Utah: | 2.5% |
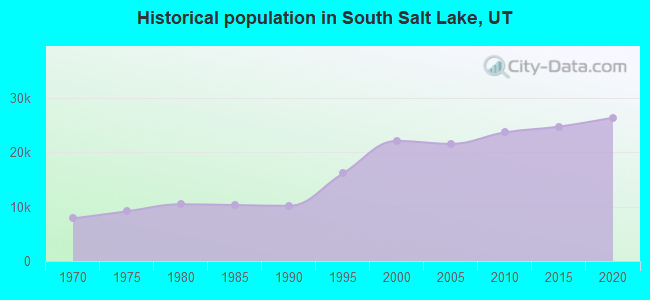
Population change in the 1990s: +11,623 (+111.6%).
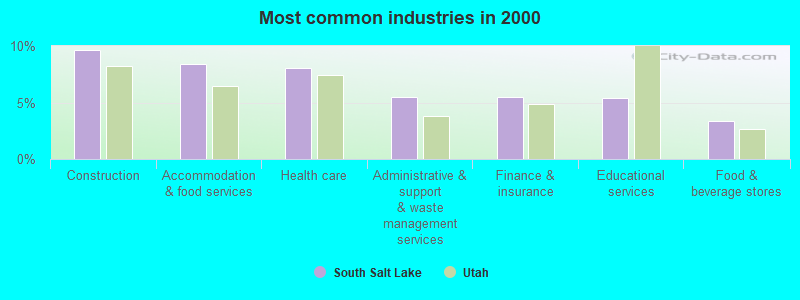
- Construction (9.7%)
- Accommodation & food services (8.4%)
- Health care (8.1%)
- Administrative & support & waste management services (5.5%)
- Finance & insurance (5.4%)
- Educational services (5.4%)
- Food & beverage stores (3.4%)
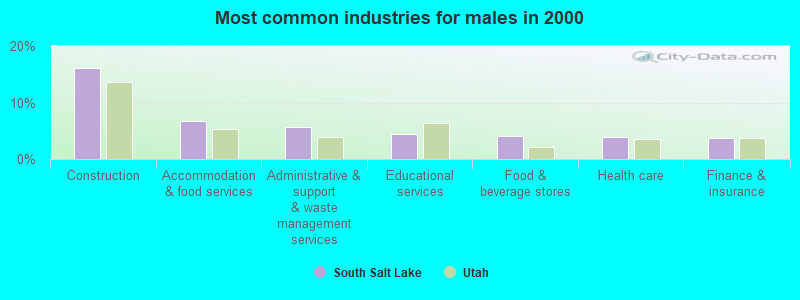
- Construction (16.0%)
- Accommodation & food services (6.7%)
- Administrative & support & waste management services (5.6%)
- Educational services (4.4%)
- Food & beverage stores (4.1%)
- Health care (4.0%)
- Finance & insurance (3.7%)
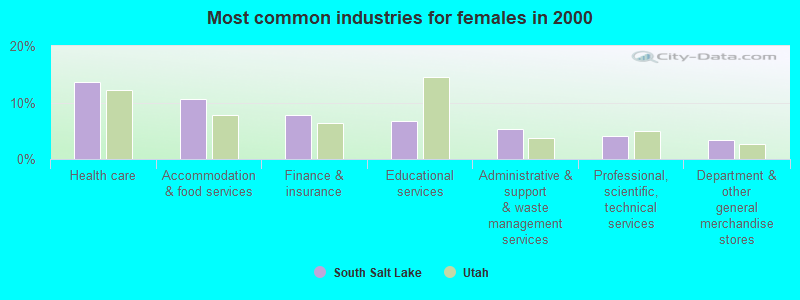
- Health care (13.5%)
- Accommodation & food services (10.7%)
- Finance & insurance (7.8%)
- Educational services (6.8%)
- Administrative & support & waste management services (5.2%)
- Professional, scientific, technical services (4.1%)
- Department & other general merchandise stores (3.3%)
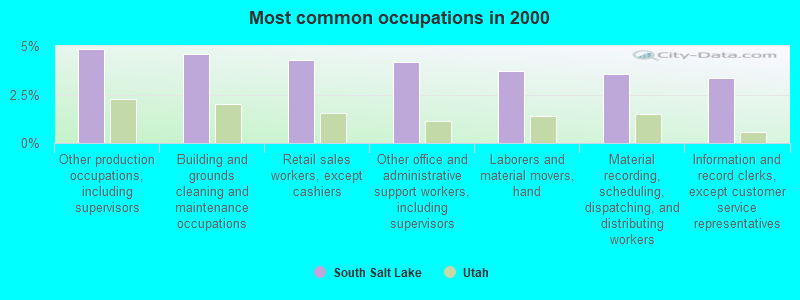
- Other production occupations, including supervisors (4.9%)
- Building and grounds cleaning and maintenance occupations (4.6%)
- Retail sales workers, except cashiers (4.3%)
- Other office and administrative support workers, including supervisors (4.2%)
- Laborers and material movers, hand (3.7%)
- Material recording, scheduling, dispatching, and distributing workers (3.5%)
- Information and record clerks, except customer service representatives (3.4%)
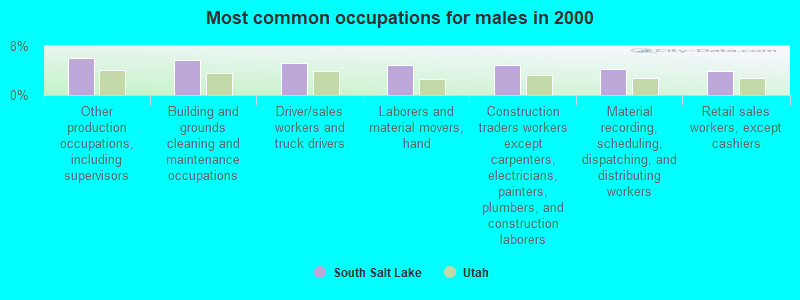
- Other production occupations, including supervisors (6.1%)
- Building and grounds cleaning and maintenance occupations (5.8%)
- Driver/sales workers and truck drivers (5.2%)
- Laborers and material movers, hand (4.9%)
- Construction traders workers except carpenters, electricians, painters, plumbers, and construction laborers (4.8%)
- Material recording, scheduling, dispatching, and distributing workers (4.2%)
- Retail sales workers, except cashiers (3.8%)
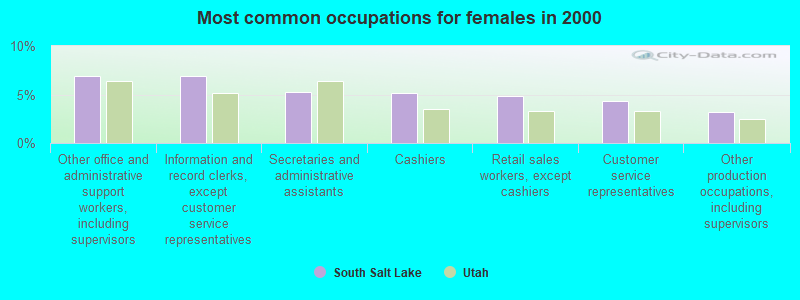
- Other office and administrative support workers, including supervisors (6.9%)
- Information and record clerks, except customer service representatives (6.9%)
- Secretaries and administrative assistants (5.3%)
- Cashiers (5.1%)
- Retail sales workers, except cashiers (4.8%)
- Customer service representatives (4.3%)
- Other production occupations, including supervisors (3.2%)
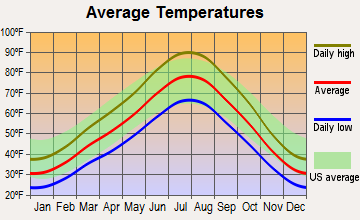
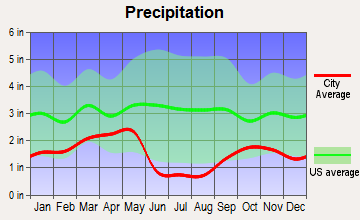
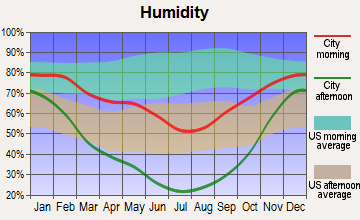
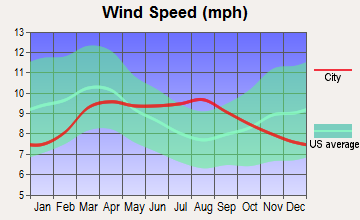
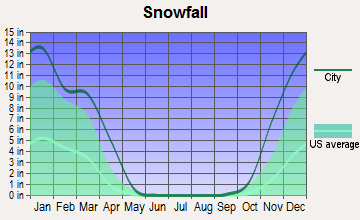
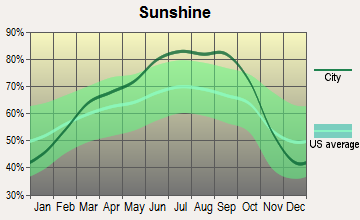
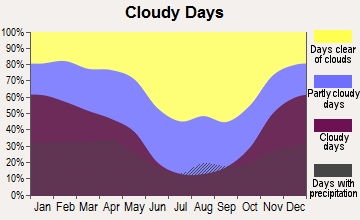
Average climate in South Salt Lake, Utah
Based on data reported by over 4,000 weather stations
|
|

(lower is better)
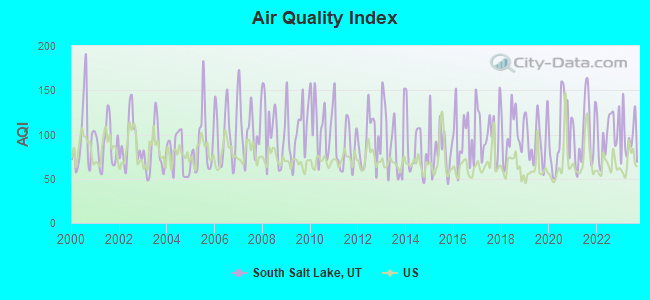
Air Quality Index (AQI) level in 2023 was 95.8. This is worse than average.
| City: | 95.8 |
| U.S.: | 72.6 |
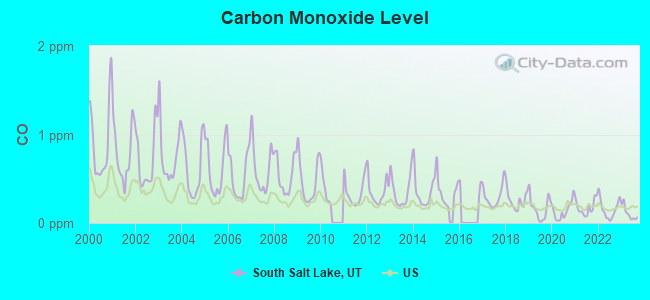
Carbon Monoxide (CO) [ppm] level in 2023 was 0.111. This is significantly better than average. Closest monitor was 2.2 miles away from the city center.
| City: | 0.111 |
| U.S.: | 0.251 |
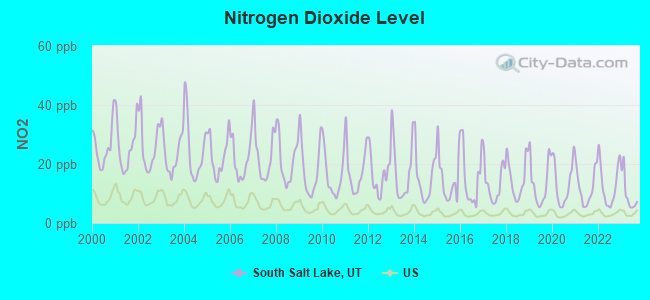
Nitrogen Dioxide (NO2) [ppb] level in 2023 was 9.74. This is significantly worse than average. Closest monitor was 2.2 miles away from the city center.
| City: | 9.74 |
| U.S.: | 5.11 |
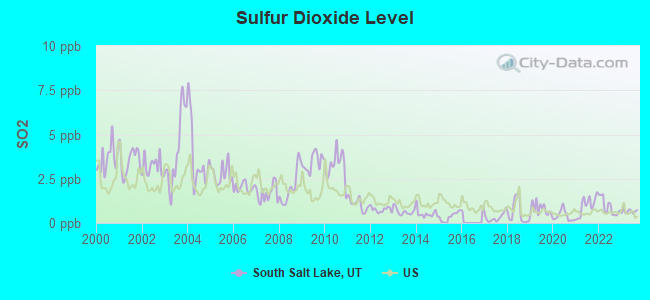
Sulfur Dioxide (SO2) [ppb] level in 2023 was 0.664. This is significantly better than average. Closest monitor was 2.2 miles away from the city center.
| City: | 0.664 |
| U.S.: | 1.515 |
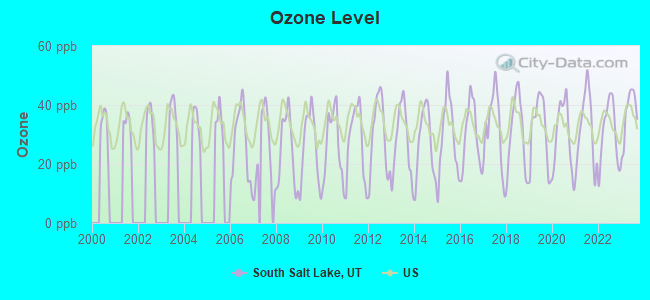
Ozone [ppb] level in 2023 was 37.2. This is about average. Closest monitor was 2.2 miles away from the city center.
| City: | 37.2 |
| U.S.: | 33.3 |
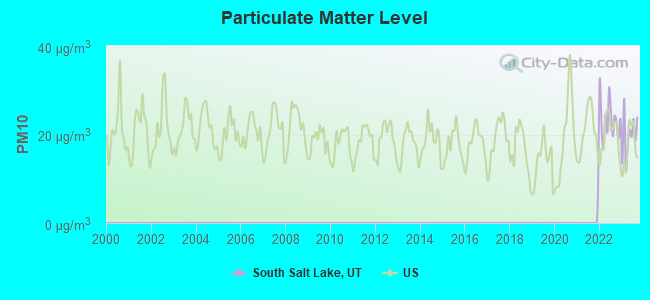
Particulate Matter (PM10) [µg/m3] level in 2023 was 19.7. This is about average. Closest monitor was 2.2 miles away from the city center.
| City: | 19.7 |
| U.S.: | 19.2 |
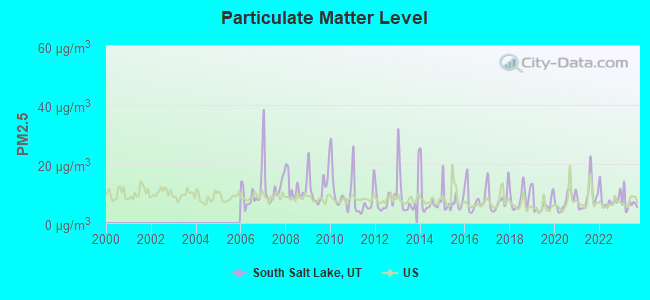
Particulate Matter (PM2.5) [µg/m3] level in 2023 was 6.79. This is about average. Closest monitor was 2.2 miles away from the city center.
| City: | 6.79 |
| U.S.: | 8.11 |
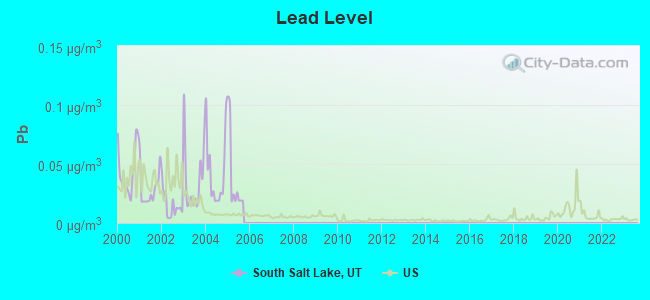
Lead (Pb) [µg/m3] level in 2005 was 0.0394. This is significantly worse than average. Closest monitor was 3.3 miles away from the city center.
| City: | 0.0394 |
| U.S.: | 0.0093 |
Earthquake activity:
South Salt Lake-area historical earthquake activity is significantly above Utah state average. It is 2180% greater than the overall U.S. average.On 8/18/1959 at 06:37:13, a magnitude 7.7 (7.7 UK, Class: Major, Intensity: VIII - XII) earthquake occurred 274.1 miles away from South Salt Lake center, causing $26,000,000 total damage
On 10/3/1915 at 06:52:48, a magnitude 7.6 (7.6 UK) earthquake occurred 295.0 miles away from South Salt Lake center
On 10/28/1983 at 14:06:06, a magnitude 7.3 (6.2 MB, 7.3 MS, 7.0 MW) earthquake occurred 252.7 miles away from the city center, causing 2 deaths (2 shaking deaths) and 3 injuries, causing $15,000,000 total damage
On 3/28/1975 at 02:31:05, a magnitude 6.2 (6.1 MB, 6.0 MS, 6.2 ML, Class: Strong, Intensity: VII - IX) earthquake occurred 95.2 miles away from South Salt Lake center
On 3/18/2020 at 13:09:31, a magnitude 5.7 (5.7 MW, Depth: 7.4 mi, Class: Moderate, Intensity: VI - VII) earthquake occurred 10.4 miles away from South Salt Lake center
On 12/21/1932 at 06:10:09, a magnitude 7.2 (7.2 UK) earthquake occurred 363.3 miles away from South Salt Lake center
Magnitude types: body-wave magnitude (MB), local magnitude (ML), surface-wave magnitude (MS), moment magnitude (MW)
Natural disasters:
The number of natural disasters in Salt Lake County (9) is smaller than the US average (15).Major Disasters (Presidential) Declared: 4
Emergencies Declared: 1
Causes of natural disasters: Floods: 3, Storms: 3, Fires: 2, Landslides: 2, Earthquake: 1, Hurricane: 1, Mudslide: 1, Tornado: 1, Other: 1 (Note: some incidents may be assigned to more than one category).
Hospitals and medical centers in South Salt Lake:
Other hospitals and medical centers near South Salt Lake:
- UNIVERSITY HOME CARE (Home Health Center, about 1 miles away; SALT LAKE CITY, UT)
- A AND E NH (Nursing Home, about 1 miles away; SALT LAKE CITY, UT)
- TRINITY CARE CENTER (Nursing Home, about 1 miles away; SALT LAKE CITY, UT)
- PARACELSUS HOSPITAL HOME CARE (Home Health Center, about 1 miles away; SALT LAKE CITY, UT)
- ROCKY MOUNTAIN MEDICAL CENTER (Hospital, about 1 miles away; SALT LAKE CITY, UT)
- MAJESTIC CARE AND REHABILITATION CENTER (Nursing Home, about 1 miles away; SALT LAKE CITY, UT)
- AVALON VALLEY REHABILITATION CENTER (Nursing Home, about 1 miles away; SALT LAKE CITY, UT)
Amtrak station near South Salt Lake:
Colleges/universities with over 2000 students nearest to South Salt Lake:
- Western Governors University (about 2 miles; Salt Lake City, UT; Full-time enrollment: 31,481)
- Westminster College (about 3 miles; Salt Lake City, UT; FT enrollment: 2,870)
- Stevens-Henager College-Murray (about 4 miles; Murray, UT; FT enrollment: 6,395)
- Salt Lake Community College (about 4 miles; Salt Lake City, UT; FT enrollment: 20,797)
- University of Utah (about 5 miles; Salt Lake City, UT; FT enrollment: 28,454)
- Latter-day Saints Business College (about 5 miles; Salt Lake City, UT; FT enrollment: 2,059)
- Utah Valley University (about 32 miles; Orem, UT; FT enrollment: 24,403)
User-submitted facts and corrections:
- There are two other spanish language stations serving these communities, KUTH 12 and KUTF 3. They are Equity Broadcasting Stations. The main number is 801-519-9784. Address is 525 South 300 west, Ste. 1 Salt Lake City.
Points of interest:
Notable locations in South Salt Lake: Fairclough Industrial Park (A), City of South Salt Lake Fire Department Station 41 (B), City of South Salt Lake Fire Department Station 42 (C), City of South Salt Lake Fire Department Station 43 (D), We R Kids (E). Display/hide their locations on the map
Shopping Centers: Interpointe Shopping Center (1), Southgate Shopping Center (2). Display/hide their locations on the map
Churches in South Salt Lake include: Full Armor Bible Center (A), Jehovahs Witnesses Granite Park Congregation (B), The Potters House Christian Fellowship Church (C), Potters House Christian Fellowship Church (D), Church of the Living Dead (E), The Church of Jesus Christ of Latter Day Saints (F), New Life Christian Center (G), Saint Anns Catholic Church (H), Salt Lake City Church of God (I). Display/hide their locations on the map
Park in South Salt Lake: Harmony Park (1). Display/hide its location on the map
| This city: | 2.5 people |
| Utah: | 3.1 people |
| This city: | 53.8% |
| Whole state: | 75.2% |
| This city: | 9.5% |
| Whole state: | 4.6% |
Likely homosexual households (counted as self-reported same-sex unmarried-partner households)
- Lesbian couples: 0.7% of all households
- Gay men: 0.4% of all households
People in group quarters in South Salt Lake in 2010:
- 2,247 people in local jails and other municipal confinement facilities
- 210 people in nursing facilities/skilled-nursing facilities
- 106 people in correctional facilities intended for juveniles
- 18 people in group homes for juveniles (non-correctional)
People in group quarters in South Salt Lake in 2000:
- 1,940 people in local jails and other confinement facilities (including police lockups)
- 114 people in nursing homes
- 98 people in short-term care, detention or diagnostic centers for delinquent children
- 50 people in training schools for juvenile delinquents
- 16 people in unknown juvenile institutions
- 2 people in religious group quarters
For population 15 years and over in South Salt Lake:
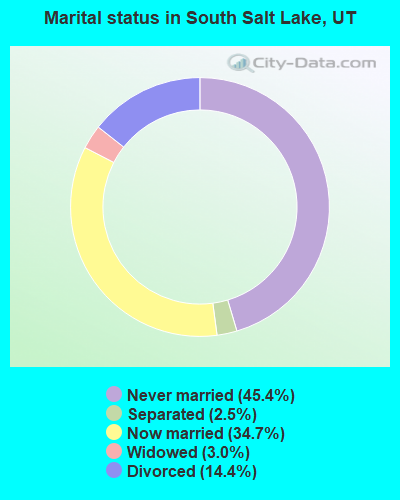
- Never married: 45.4%
- Now married: 34.7%
- Separated: 2.5%
- Widowed: 3.0%
- Divorced: 14.4%
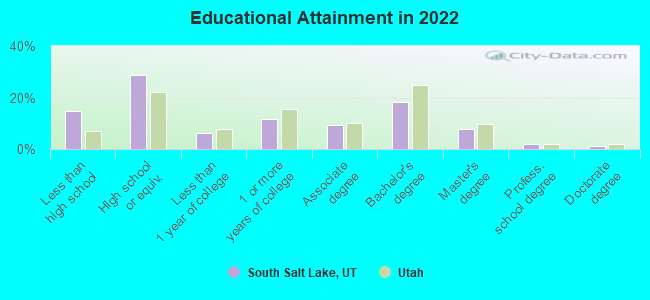
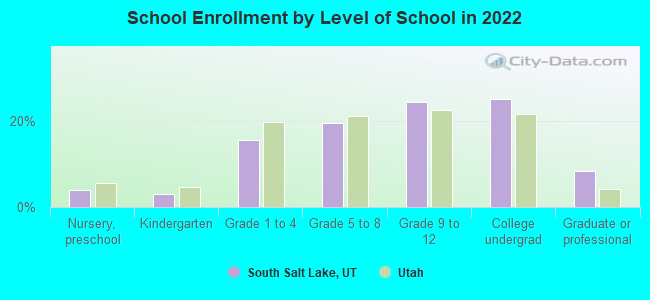
For population 25 years and over in South Salt Lake:
- High school or higher: 86.2%
- Bachelor's degree or higher: 28.6%
- Graduate or professional degree: 10.6%
- Unemployed: 5.8%
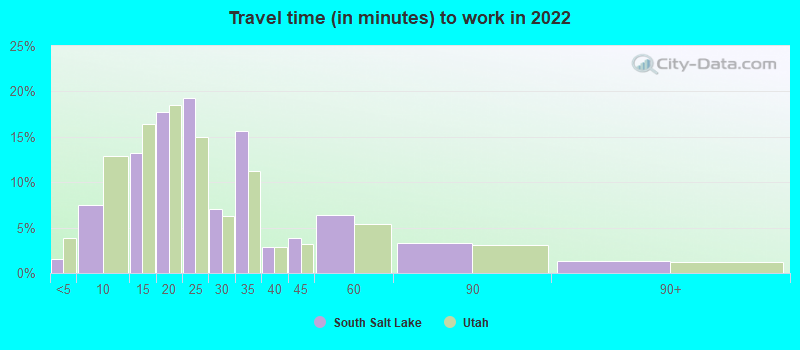
- Mean travel time to work (commute): 17.3 minutes
| Here: | 14.1 |
| Utah average: | 10.9 |
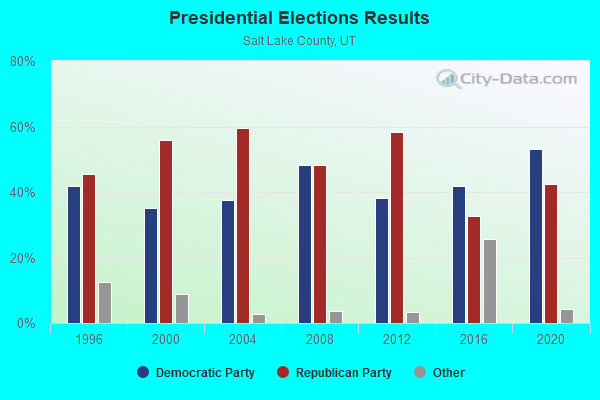
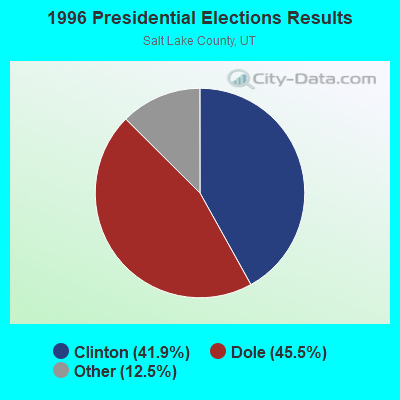
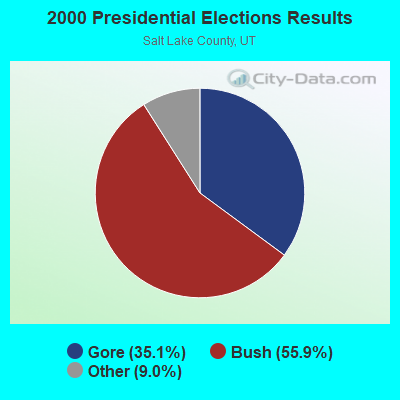
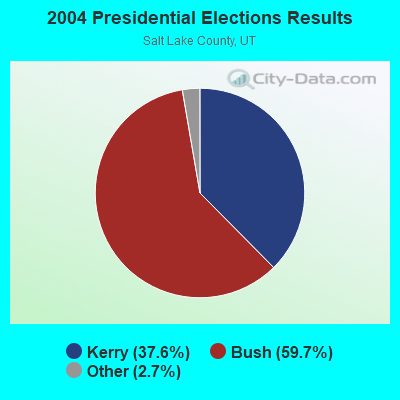
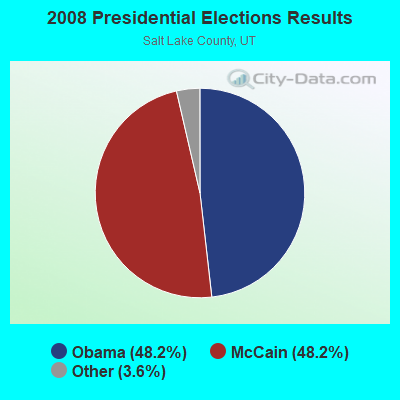

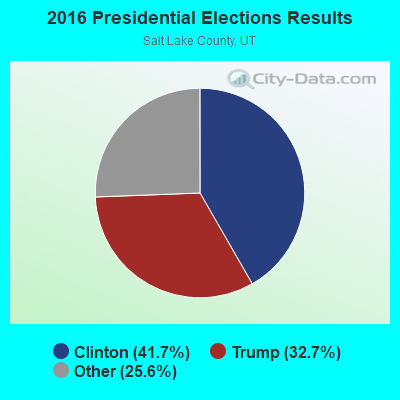
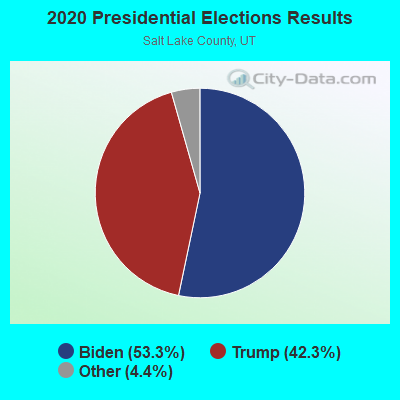
Graphs represent county-level data. Detailed 2008 Election Results
Political contributions by individuals in South Salt Lake, UT
Religion statistics for South Salt Lake, UT (based on Salt Lake County data)
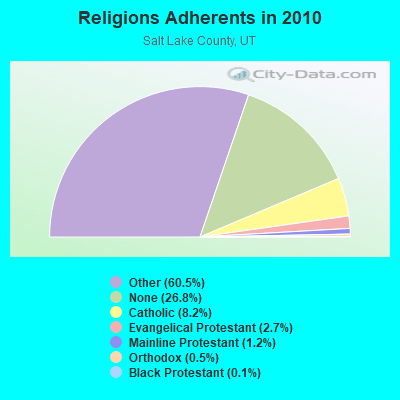
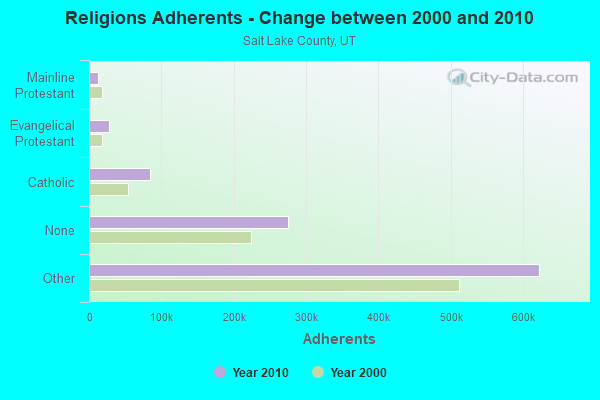
| Religion | Adherents | Congregations |
|---|---|---|
| Other | 622,807 | 1,452 |
| Catholic | 84,342 | 24 |
| Evangelical Protestant | 27,497 | 144 |
| Mainline Protestant | 12,789 | 38 |
| Orthodox | 5,352 | 7 |
| Black Protestant | 1,302 | 6 |
| None | 275,566 | - |
Food Environment Statistics:
| Here: | 1.45 / 10,000 pop. |
| State: | 1.37 / 10,000 pop. |
| Salt Lake County: | 0.16 / 10,000 pop. |
| Utah: | 0.18 / 10,000 pop. |
| This county: | 0.47 / 10,000 pop. |
| Utah: | 0.41 / 10,000 pop. |
| This county: | 2.45 / 10,000 pop. |
| Utah: | 2.82 / 10,000 pop. |
| Here: | 5.55 / 10,000 pop. |
| Utah: | 5.09 / 10,000 pop. |
| Salt Lake County: | 6.5% |
| State: | 6.3% |
| This county: | 22.7% |
| Utah: | 23.6% |
Health and Nutrition:
| This city: | 48.0% |
| Utah: | 48.9% |
| Here: | 46.7% |
| State: | 47.0% |
| South Salt Lake: | 28.3 |
| Utah: | 28.4 |
| South Salt Lake: | 19.9% |
| Utah: | 21.0% |
| South Salt Lake: | 10.2% |
| Utah: | 10.3% |
| South Salt Lake: | 6.8 |
| State: | 6.8 |
| This city: | 29.6% |
| Utah: | 31.9% |
| Here: | 57.7% |
| State: | 57.4% |
| Here: | 81.7% |
| State: | 80.1% |
More about Health and Nutrition of South Salt Lake, UT Residents
| Local government employment and payroll (March 2022) | |||||
| Function | Full-time employees | Monthly full-time payroll | Average yearly full-time wage | Part-time employees | Monthly part-time payroll |
|---|---|---|---|---|---|
| Police Protection - Officers | 68 | $518,320 | $91,468 | 0 | $0 |
| Firefighters | 44 | $329,528 | $89,871 | 22 | $75,492 |
| Parks and Recreation | 34 | $128,141 | $45,226 | 42 | $44,698 |
| Housing and Community Development (Local) | 25 | $131,061 | $62,909 | 9 | $4,805 |
| Other and Unallocable | 14 | $78,366 | $67,171 | 4 | $4,226 |
| Judicial and Legal | 13 | $79,674 | $73,545 | 1 | $704 |
| Streets and Highways | 12 | $53,442 | $53,442 | 0 | $0 |
| Police - Other | 12 | $71,568 | $71,568 | 16 | $11,802 |
| Other Government Administration | 11 | $73,942 | $80,664 | 17 | $8,027 |
| Water Supply | 9 | $55,725 | $74,300 | 0 | $0 |
| Financial Administration | 6 | $28,423 | $56,846 | 0 | $0 |
| Sewerage | 6 | $31,870 | $63,740 | 0 | $0 |
| Fire - Other | 1 | $5,799 | $69,588 | 0 | $0 |
| Totals for Government | 255 | $1,585,858 | $74,629 | 111 | $149,754 |
South Salt Lake government finances - Expenditure in 2021 (per resident):
- Construction - General - Other: $5,268,000 ($202.59)
Sewerage: $3,512,000 ($135.06)
Housing and Community Development: $557,000 ($21.42)
Regular Highways: $316,000 ($12.15)
Water Utilities: $42,000 ($1.62)
- Current Operations - Police Protection: $19,513,000 ($750.41)
Local Fire Protection: $14,432,000 ($555.01)
Central Staff Services: $8,012,000 ($308.12)
Sewerage: $5,435,000 ($209.01)
General - Other: $4,249,000 ($163.40)
Elementary and Secondary Education: $3,894,000 ($149.75)
Water Utilities: $3,733,000 ($143.56)
Regular Highways: $3,402,000 ($130.83)
Judicial and Legal Services: $2,582,000 ($99.30)
Housing and Community Development: $2,355,000 ($90.57)
Parks and Recreation: $2,013,000 ($77.41)
General Public Buildings: $1,430,000 ($54.99)
Protective Inspection and Regulation - Other: $1,022,000 ($39.30)
Health - Other: $383,000 ($14.73)
- General - Interest on Debt: $859,000 ($33.03)
- Other Capital Outlay - General - Other: $3,456,000 ($132.91)
Water Utilities: $9,000 ($0.35)
- Total Salaries and Wages: $35,635,000 ($1370.42)
- Water Utilities - Interest on Debt: $15,000 ($0.58)
South Salt Lake government finances - Revenue in 2021 (per resident):
- Charges - Sewerage: $8,088,000 ($311.04)
Other: $4,940,000 ($189.98)
- Federal Intergovernmental - Other: $6,207,000 ($238.70)
- Local Intergovernmental - Other: $740,000 ($28.46)
Housing and Community Development: $166,000 ($6.38)
General Local Government Support: $110,000 ($4.23)
- Miscellaneous - General Revenue - Other: $2,499,000 ($96.10)
Fines and Forfeits: $1,009,000 ($38.80)
Rents: $627,000 ($24.11)
Interest Earnings: $330,000 ($12.69)
Sale of Property: $211,000 ($8.11)
Donations From Private Sources: $2,000 ($0.08)
- Revenue - Water Utilities: $4,959,000 ($190.71)
- State Intergovernmental - Other: $6,921,000 ($266.16)
General Local Government Support: $3,814,000 ($146.68)
- Tax - General Sales and Gross Receipts: $33,524,000 ($1289.24)
Property: $11,731,000 ($451.14)
Public Utilities Sales: $5,536,000 ($212.90)
Other License: $1,822,000 ($70.07)
Occupation and Business License - Other: $1,420,000 ($54.61)
Other Selective Sales: $74,000 ($2.85)
South Salt Lake government finances - Debt in 2021 (per resident):
- Long Term Debt - Beginning Outstanding - Unspecified Public Purpose: $11,577,000 ($445.22)
Retired Unspecified Public Purpose: $11,577,000 ($445.22)
Issue, Unspecified Public Purpose: $9,100,000 ($349.96)
Outstanding Unspecified Public Purpose: $9,100,000 ($349.96)
South Salt Lake government finances - Cash and Securities in 2021 (per resident):
- Other Funds - Cash and Securities: $1,515,000 ($58.26)
- Sinking Funds - Cash and Securities: $175,000 ($6.73)
6.29% of this county's 2021 resident taxpayers lived in other counties in 2020 ($73,956 average adjusted gross income)
| Here: | 6.29% |
| Utah average: | 7.95% |
0.01% of residents moved from foreign countries ($111 average AGI)
Salt Lake County: 0.01% Utah average: 0.02%
Top counties from which taxpayers relocated into this county between 2020 and 2021:
| from Utah County, UT | |
| from Davis County, UT | |
| from Weber County, UT |
6.63% of this county's 2020 resident taxpayers moved to other counties in 2021 ($71,033 average adjusted gross income)
| Here: | 6.63% |
| Utah average: | 7.39% |
0.01% of residents moved to foreign countries ($100 average AGI)
Salt Lake County: 0.01% Utah average: 0.02%
Top counties to which taxpayers relocated from this county between 2020 and 2021:
| to Utah County, UT | |
| to Davis County, UT | |
| to Tooele County, UT |
Businesses in South Salt Lake, UT
- 7-Eleven: 3
- Carl\s Jr.: 1
- FedEx: 1
Strongest AM radio stations in South Salt Lake:
- KTKK (630 AM; 10 kW; SANDY, UT; Owner: UNITED BROADCASTING COMPANY)
- KBEE (860 AM; 10 kW; SALT LAKE CITY, UT; Owner: CITADEL BROADCASTING COMPANY)
- KBJA (1640 AM; 10 kW; SANDY, UT; Owner: UNITED BROADCASTING COMPANY, INC)
- KIQN (1010 AM; 50 kW; TOOELE, UT)
- KSOP (1370 AM; 5 kW; SOUTH SALT LAKE, UT; Owner: KSOP, INC.)
- KALL (700 AM; 50 kW; NORTH SALT LAKE CITY, UT; Owner: CITICASTERS LICENSES, L.P.)
- KSL (1160 AM; 50 kW; SALT LAKE CITY, UT; Owner: BONNEVILLE HOLDING COMPANY)
- KFNZ (1320 AM; 5 kW; SALT LAKE CITY, UT; Owner: CITADEL BROADCASTING COMPANY)
- KNRS (570 AM; 5 kW; SALT LAKE CITY, UT; Owner: CITICASTERS LICENSES, L.P.)
- KMRI (1550 AM; 10 kW; WEST VALLEY CITY, UT; Owner: KMRI RADIO, LLC)
- KJQS (1230 AM; 1 kW; MURRAY, UT; Owner: CITADEL BROADCASTING COMPANY)
- KZNS (1280 AM; 10 kW; SALT LAKE CITY, UT; Owner: SIMMONS-SLC, LS, LLC)
- KLLB (1510 AM; daytime; 10 kW; WEST JORDAN, UT; Owner: UNITED SECURITY FINANCIAL, INC.)
Strongest FM radio stations in South Salt Lake:
- KCPX (105.7 FM; CENTERVILLE, UT; Owner: MERCURY BROADCASTING COMPANY, INC.)
- KSOP-FM (104.3 FM; SALT LAKE CITY, UT; Owner: KSOP, INC.)
- K272DP (102.3 FM; TOOELE, UT; Owner: FAMILY STATIONS, INC.)
- KBZN (97.9 FM; OGDEN, UT; Owner: CAPITOL BROADCASTING, INC.)
- KRCL (90.9 FM; SALT LAKE CITY, UT; Owner: LISTENERS COMMUNITY RADIO OF UTAH)
- KBER (101.1 FM; OGDEN, UT; Owner: CITADEL BROADCASTING COMPANY)
- KISN-FM (97.1 FM; SALT LAKE CITY, UT; Owner: CLEAR CHANNEL BROADCASTING LICENSES, INC.)
- KKAT (101.9 FM; OGDEN, UT; Owner: CITICASTERS LICENSES, L.P.)
- KSFI (100.3 FM; SALT LAKE CITY, UT; Owner: SIMMONS-SLC, LS, LLC)
- KUBL-FM (93.3 FM; SALT LAKE CITY, UT; Owner: CITADEL BROADCASTING COMPANY)
- KOSY-FM (106.5 FM; SPANISH FORK, UT; Owner: MERCURY BROADCASTING COMPANY, INC.)
- KRSP-FM (103.5 FM; SALT LAKE CITY, UT; Owner: SIMMONS-SLC, LS, LLC)
- K252DI (98.3 FM; SALT LAKE CITY, UT; Owner: FIRST NATIONAL BROADCASTING CORPORATION)
- K276DP (103.1 FM; MILLCREEK, UT; Owner: FIRST NATIONAL B/CING CORPORATION)
- KODJ (94.1 FM; SALT LAKE CITY, UT; Owner: CITICASTERS LICENSES, L.P.)
- KUER-FM (90.1 FM; SALT LAKE CITY, UT; Owner: UNIVERSITY OF UTAH)
- KBYU-FM (89.1 FM; PROVO, UT; Owner: BRIGHAM YOUNG UNIVERSITY)
- KURR (99.5 FM; BOUNTIFUL, UT; Owner: CITICASTERS LICENSES, L.P.)
- KBEE-FM (98.7 FM; SALT LAKE CITY, UT; Owner: CITADEL BROADCASTING COMPANY)
- K248AK (97.5 FM; DRAPER, UT; Owner: CITICASTERS LICENSES, L.P.)
TV broadcast stations around South Salt Lake:
- K59GS (Channel 59; SALT LAKE CITY, UT; Owner: ALPHA & OMEGA COMMUNICATIONS, LLC)
- KUTV (Channel 2; SALT LAKE CITY, UT; Owner: KUTV HOLDINGS, INC.)
- K66FN (Channel 66; SALT LAKE CITY, UT; Owner: AZTECA BROADCASTING CORPORATION)
- KUCL-LP (Channel 26; SALT LAKE CITY, UT; Owner: CHRISTIAN LIFE BROADCASTING)
- KEJT-LP (Channel 48; SALT LAKE CITY, UT; Owner: TELEMUNDO OF NORTHERN CALIFORNIA LICENSE CORP.)
- KULC (Channel 9; OGDEN, UT; Owner: UTAH STATE BOARD OF REGENTS)
- KUED (Channel 7; SALT LAKE CITY, UT; Owner: UNIVERSITY OF UTAH)
- KSL-TV (Channel 5; SALT LAKE CITY, UT; Owner: BONNEVILLE HOLDING COMPANY)
- KBYU-TV (Channel 11; PROVO, UT; Owner: BRIGHAM YOUNG UNIVERSITY)
- KUWB (Channel 30; OGDEN, UT; Owner: ACME TV LICENSES OF UTAH, LLC)
- KJZZ-TV (Channel 14; SALT LAKE CITY, UT; Owner: LARRY H. MILLER COMMUNICATIONS CORP.)
- KTVX (Channel 4; SALT LAKE CITY, UT; Owner: CLEAR CHANNEL BROADCASTING LICENSES, INC.)
- KSTU (Channel 13; SALT LAKE CITY, UT; Owner: FOX TELEVISION STATIONS INC.)
- KTMW (Channel 20; SALT LAKE CITY, UT; Owner: ALPHA & OMEGA COMMUNICATIONS, LLC)
- KUBX-LP (Channel 58; SALT LAKE CITY, UT; Owner: EQUITY BROADCASTING CORPORATION)
- National Bridge Inventory (NBI) Statistics
- 100Number of bridges
- 2,375ft / 724mTotal length
- $10,684,000Total costs
- 7,007,232Total average daily traffic
- 923,199Total average daily truck traffic
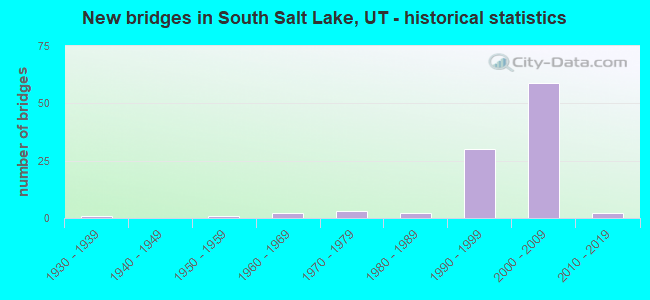
- New bridges - historical statistics
- 11930-1939
- 11950-1959
- 21960-1969
- 31970-1979
- 21980-1989
- 301990-1999
- 592000-2009
- 22010-2019
FCC Registered Antenna Towers:
31 (See the full list of FCC Registered Antenna Towers in South Salt Lake)FCC Registered Broadcast Land Mobile Towers:
6- 220 E Morris Ave (Lat: 40.717444 Lon: -111.884944), Type: Building, Structure height: 18 m, Overall height: 21 m, Call Sign: KBP639,
Assigned Frequencies: 453.800 MHz, Grant Date: 08/12/1996, Expiration Date: 08/12/2001, Cancellation Date: 10/14/2001, Certifier: Steve F Foote, Registrant: Cara Enterprises, 1383 Farm Meadow, Salt Lake City, UT 84117-8063, Fax: (801) 278-7239
- Lat: 40.703861 Lon: -111.914611, Structure height: 0 m, Call Sign: WPXJ340,
Assigned Frequencies: 451.025 MHz, Grant Date: 04/15/2003, Expiration Date: 04/15/2013, Cancellation Date: 06/15/2013, Certifier: Andrew Larsen, Registrant: Cara Enterprises Inc., Salt Lake City, UT 84117-0503, Phone: (801) 278-9728, Fax: (801) 278-7239, Email:
- Lat: 40.717833 Lon: -111.882250, Call Sign: WPZT945,
Assigned Frequencies: 464.387 MHz, 469.387 MHz, Grant Date: 03/12/2004, Expiration Date: 03/12/2014, Cancellation Date: 05/17/2014, Certifier: Craig Ulibarri, Registrant: Cara Enterprises Inc, Salt Lake City, UT 84117-0503, Phone: (801) 278-9728, Fax: (801) 278-7239
- Lat: 40.701111 Lon: -111.924444, Call Sign: WQDT778, Licensee ID: L01071770,
Assigned Frequencies: 452.287 MHz, 452.987 MHz, Grant Date: 10/28/2005, Expiration Date: 10/28/2015, Cancellation Date: 01/02/2016, Certifier: James Bailey, Registrant: Cottonwood Youth Academy, 1144 W 3300 S, South Salt Lake City, UT 84119, Phone: (801) 433-2900, Fax: (801) 433-2999
- 2357 South 900 West (Lat: 40.719389 Lon: -111.917306), Call Sign: WREC860,
Assigned Frequencies: 451.237 MHz, 452.987 MHz, 456.237 MHz, 452.837 MHz, 457.837 MHz, Grant Date: 09/20/2019, Expiration Date: 09/20/2029, Certifier: James R Stanley, Registrant: Utah Comm, 1202 South 300 West, Salt Lake City, UT 84101, Phone: (801) 486-0161, Email:
- 3459 S 700 W (Lat: 40.696222 Lon: -111.910889), Call Sign: WRUZ463,
Assigned Frequencies: 451.512 MHz, 456.512 MHz, 452.787 MHz, 457.787 MHz, 452.487 MHz, Grant Date: 10/21/2022, Expiration Date: 10/21/2032, Certifier: Melissa E Shell, Registrant: Utah Communications Inc, 1202 S 300 W, Salt Lake City, UT 84101, Phone: (801) 486-0161, Email:
FCC Registered Microwave Towers:
19 (See the full list of FCC Registered Microwave Towers in this town)FCC Registered Amateur Radio Licenses:
10 (See the full list of FCC Registered Amateur Radio Licenses in South Salt Lake)FAA Registered Aircraft:
2- Aircraft: PIPER PA 46-350P (Category: Land, Seats: 6, Weight: Up to 12,499 Pounds), Engine: LYCOMING TIO 540 SER (250 HP) (Reciprocating)
N-Number: 555JV, N555JV, N-555JV, Serial Number: 4636270, Year manufactured: 2000, Airworthiness Date: 03/21/2000, Certificate Issue Date: 03/30/2019
Registrant (LLC): Sky Kings 3 LLC, 825 W 2400 S, South Salt Lake, UT 84119 - Aircraft: BALONY KUBICEK SPOL SRO BB60Z (Category: Land, Seats: 13, Weight: Up to 12,499 Pounds), Engine: None
N-Number: 783AT, N783AT, N-783AT, Serial Number: 946, Year manufactured: 2012, Airworthiness Date: 09/11/2012, Certificate Issue Date: 09/11/2012
Registrant (LLC): Utah Outventures LLC, 3626 S Wendell Dr, South Salt Lake, UT 84115
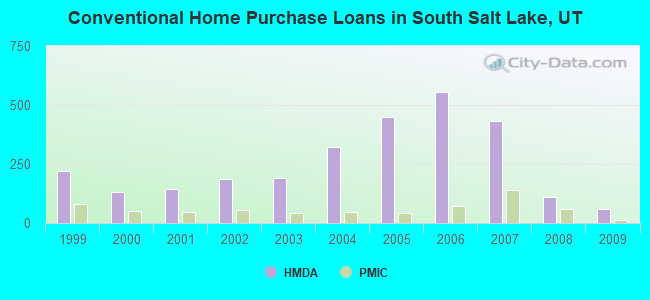
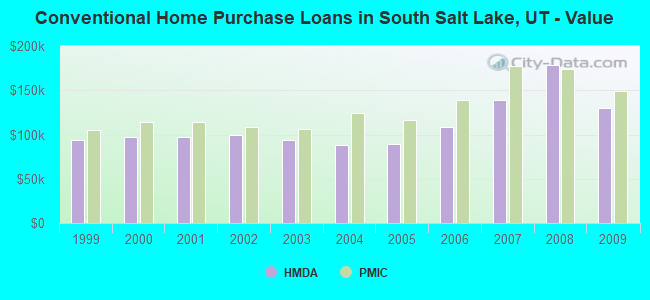
| Home Mortgage Disclosure Act Aggregated Statistics For Year 2009 (Based on 3 full and 1 partial tracts) | ||||||||||||||
| A) FHA, FSA/RHS & VA Home Purchase Loans | B) Conventional Home Purchase Loans | C) Refinancings | D) Home Improvement Loans | E) Loans on Dwellings For 5+ Families | F) Non-occupant Loans on < 5 Family Dwellings (A B C & D) | G) Loans On Manufactured Home Dwelling (A B C & D) | ||||||||
|---|---|---|---|---|---|---|---|---|---|---|---|---|---|---|
| Number | Average Value | Number | Average Value | Number | Average Value | Number | Average Value | Number | Average Value | Number | Average Value | Number | Average Value | |
| LOANS ORIGINATED | 147 | $167,222 | 59 | $129,488 | 385 | $154,211 | 13 | $75,329 | 3 | $2,032,947 | 36 | $132,182 | 2 | $129,825 |
| APPLICATIONS APPROVED, NOT ACCEPTED | 12 | $158,837 | 3 | $176,850 | 53 | $165,502 | 2 | $115,500 | 0 | $0 | 6 | $154,005 | 0 | $0 |
| APPLICATIONS DENIED | 22 | $167,317 | 17 | $119,336 | 151 | $153,621 | 12 | $39,302 | 1 | $249,280 | 27 | $142,831 | 4 | $49,855 |
| APPLICATIONS WITHDRAWN | 10 | $190,614 | 7 | $175,470 | 88 | $149,614 | 5 | $79,260 | 0 | $0 | 6 | $153,658 | 0 | $0 |
| FILES CLOSED FOR INCOMPLETENESS | 4 | $214,465 | 2 | $77,885 | 18 | $172,316 | 4 | $77,088 | 0 | $0 | 1 | $58,830 | 0 | $0 |
Detailed HMDA statistics for the following Tracts: 1114.00 , 1115.00, 1116.00, 1117.00
| Private Mortgage Insurance Companies Aggregated Statistics For Year 2009 (Based on 3 full and 1 partial tracts) | ||||
| A) Conventional Home Purchase Loans | B) Refinancings | |||
|---|---|---|---|---|
| Number | Average Value | Number | Average Value | |
| LOANS ORIGINATED | 11 | $148,723 | 14 | $178,466 |
| APPLICATIONS APPROVED, NOT ACCEPTED | 4 | $186,485 | 10 | $186,128 |
| APPLICATIONS DENIED | 2 | $173,325 | 3 | $159,393 |
| APPLICATIONS WITHDRAWN | 3 | $99,153 | 6 | $169,937 |
| FILES CLOSED FOR INCOMPLETENESS | 2 | $140,200 | 1 | $123,640 |
Detailed PMIC statistics for the following Tracts: 1114.00 , 1115.00, 1116.00, 1117.00
2002 - 2018 National Fire Incident Reporting System (NFIRS) incidents
- Fire incident types reported to NFIRS in South Salt Lake, UT
- 45644.0%Structure Fires
- 35634.4%Outside Fires
- 15314.8%Mobile Property/Vehicle Fires
- 716.9%Other
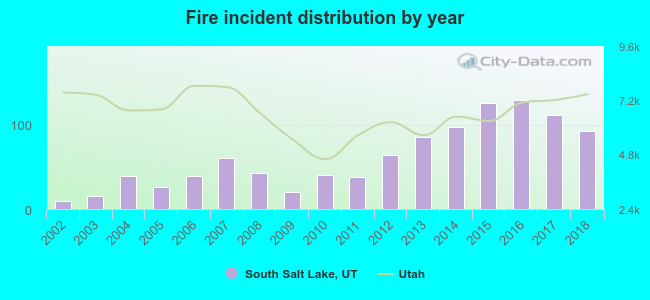 According to the data from the years 2002 - 2018 the average number of fires per year is 61. The highest number of fire incidents - 129 took place in 2016, and the least - 10 in 2002. The data has a rising trend.
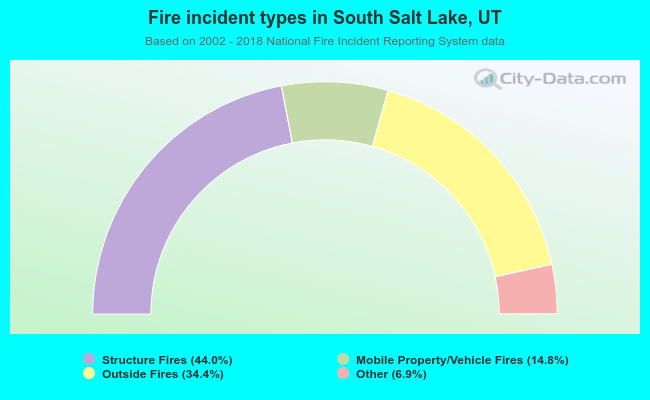 When looking into fire subcategories, the most incidents belonged to: Structure Fires (44.0%), and Outside Fires (34.4%).
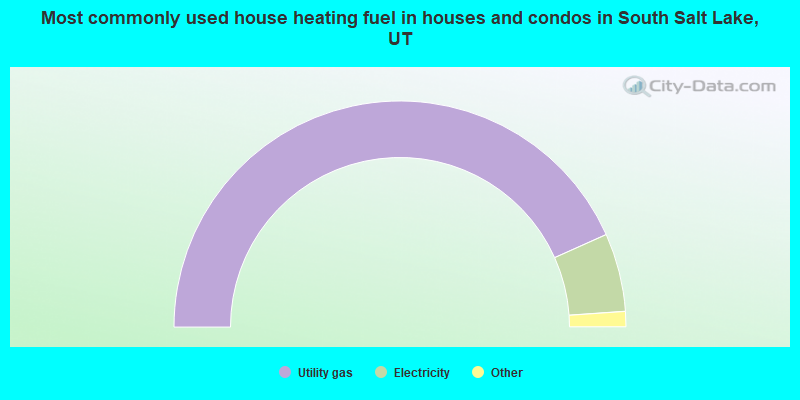
- 86.6%Utility gas
- 11.2%Electricity
- 1.4%Bottled, tank, or LP gas
- 0.8%Solar energy
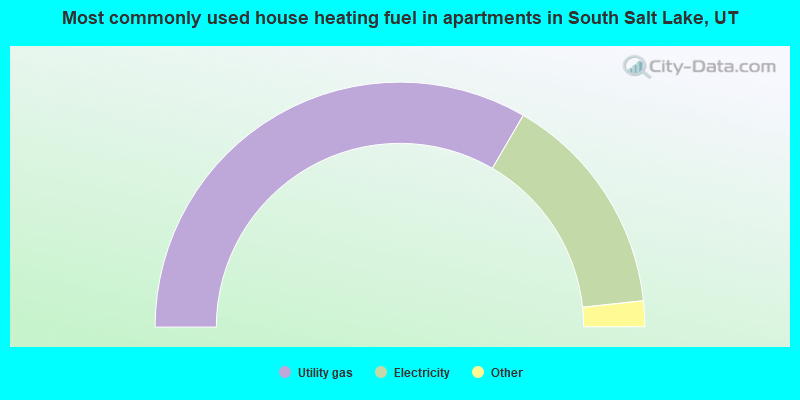
- 66.8%Utility gas
- 29.8%Electricity
- 3.0%Bottled, tank, or LP gas
- 0.3%Fuel oil, kerosene, etc.
South Salt Lake compared to Utah state average:
- Median household income below state average.
- Unemployed percentage below state average.
- Black race population percentage significantly above state average.
- Hispanic race population percentage above state average.
- Foreign-born population percentage significantly above state average.
- Renting percentage above state average.
- Number of rooms per house significantly below state average.
- Institutionalized population percentage significantly above state average.
South Salt Lake on our top lists:
- #8 on the list of "Top 101 cities with the most residents born in Other South Central Asia (population 500+)"
- #9 on the list of "Top 101 cities with the highest number of rapes per 100,000 residents, excludes tourist destinations and others with a lot of outsiders visiting based on city industries data (population 5,000+)"
- #47 on the list of "Top 101 cities with the largest percentage of people in local jails and other confinement facilities (including police lockups) (population 1,000+)"
- #62 on the list of "Top 101 cities with the largest percentage of people in short-term care, detention or diagnostic centers for delinquent children (population 1,000+)"
- #73 on the list of "Top 101 cities with the highest number of auto thefts per 100,000 residents, excludes tourist destinations and others with a lot of outsiders visiting based on city industries data (population 5,000+)"
- #89 (84115) on the list of "Top 101 zip codes with the largest percentage of Danish first ancestries (pop 5,000+)"
- #1 on the list of "Top 101 counties with the most Other adherents"
- #1 on the list of "Top 101 counties with the most Other congregations"
- #4 on the list of "Top 101 counties with the lowest percentage of residents that smoked 100+ cigarettes in their lives"
- #11 on the list of "Top 101 counties with the highest Nitrogen Dioxide air pollution readings in 2012 (ppm)"
- #14 on the list of "Top 101 counties with the highest number of births per 1000 residents 2007-2013"

|
|
Total of 7 patent applications in 2008-2024.