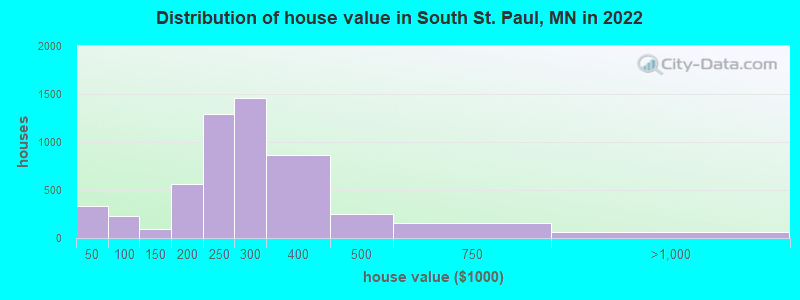
Estimated median house or condo value in 2022: $266,937 (it was $110,700 in 2000)
South St. Paul:
$266,937
MN:
$314,600
Mean prices in 2022:all housing units: $276,652; detached houses: $278,073; townhouses or other attached units: $311,113; in 2-unit structures: $268,574; in 5-or-more-unit structures: $273,635; mobile homes: $12,818
Median gross rent in 2022: $1,131.
March 2022 cost of living index in South St. Paul: 113.0 (more than average, U.S. average is 100)
Percentage of residents living in poverty in 2022: 9.7%
(8.8% for White Non-Hispanic residents, 20.0% for Black residents, 10.3% for Hispanic or Latino residents, 4.2% for American Indian residents, 100.0% for Native Hawaiian and other Pacific Islander residents, 3.9% for other race residents, 12.9% for two or more races residents)
According to our research of Minnesota and other state lists, there was 1 registered sex offender living in South St. Paul, Minnesota as of June 16, 2024. The ratio of all residents to sex offenders in South St. Paul is 20,580 to 1. The ratio of registered sex offenders to all residents in this city is much lower than the state average.
Crime rates in South St. Paul by year
Type
2009
2010
2011
2012
2013
2014
2015
2016
2017
2018
2019
2020
2021
2022
Murders (per 100,000)
1 (5.1)
0 (0.0)
0 (0.0)
0 (0.0)
0 (0.0)
0 (0.0)
2 (9.7)
0 (0.0)
1 (4.9)
0 (0.0)
0 (0.0)
2 (10.0)
0 (0.0)
0 (0.0)
Rapes (per 100,000)
0 (0.0)
4 (19.8)
4 (19.7)
5 (24.4)
15 (73.2)
12 (58.5)
15 (72.9)
18 (88.0)
9 (44.5)
10 (49.4)
18 (89.3)
2 (10.0)
13 (65.3)
13 (63.9)
Robberies (per 100,000)
12 (61.6)
8 (39.7)
10 (49.2)
6 (29.3)
9 (43.9)
14 (68.3)
11 (53.5)
21 (102.7)
9 (44.5)
8 (39.5)
5 (24.8)
4 (19.9)
4 (20.1)
1 (4.9)
Assaults (per 100,000)
14 (71.9)
11 (54.6)
71 (349.5)
39 (190.6)
64 (312.4)
53 (258.5)
73 (354.9)
88 (430.3)
56 (276.7)
28 (138.2)
23 (114.2)
28 (139.6)
55 (276.5)
69 (339.3)
Burglaries (per 100,000)
137 (703.1)
127 (630.0)
126 (620.2)
120 (586.4)
88 (429.6)
103 (502.3)
107 (520.3)
87 (425.4)
85 (420.1)
98 (483.7)
71 (352.4)
62 (309.2)
54 (271.4)
55 (270.4)
Thefts (per 100,000)
468 (2,402)
384 (1,905)
433 (2,131)
365 (1,784)
378 (1,845)
335 (1,634)
350 (1,702)
442 (2,161)
362 (1,789)
362 (1,787)
356 (1,767)
351 (1,750)
393 (1,975)
315 (1,549)
Auto thefts (per 100,000)
48 (246.3)
49 (243.1)
16 (78.8)
57 (278.5)
56 (273.4)
45 (219.5)
53 (257.7)
63 (308.0)
72 (355.8)
45 (222.1)
55 (273.0)
90 (448.8)
96 (482.5)
99 (486.8)
Arson (per 100,000)
2 (10.3)
8 (39.7)
8 (39.4)
12 (58.6)
42 (205.0)
27 (131.7)
5 (24.3)
6 (29.3)
1 (4.9)
3 (14.8)
2 (9.9)
4 (19.9)
3 (15.1)
2 (9.8)
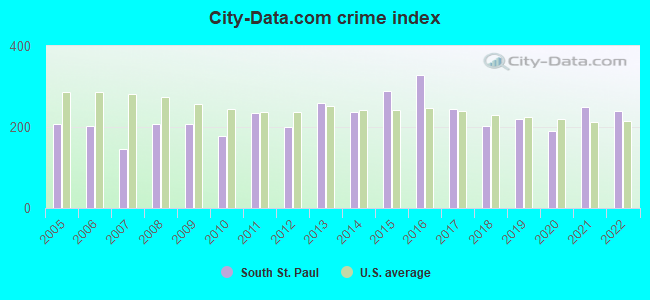
City-Data.com crime index
208.1
178.4
235.4
201.1
260.0
237.1
289.9
328.1
243.6
202.1
218.9
189.4
250.2
240.3
The City-Data.com crime index weighs serious crimes and violent crimes more heavily. Higher means more crime, U.S. average is 246.1. It adjusts for the number of visitors and daily workers commuting into cities.
Latest news from South St. Paul, MN collected exclusively by city-data.com from local newspapers, TV, and radio stations
Ancestries: German (22.3%), Norwegian (5.7%), Irish (4.3%), European (3.9%), American (3.2%), Scandinavian (2.8%).
Current Local Time: CST time zone
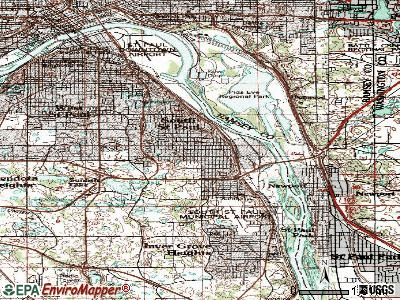
Land area: 5.74 square miles.
Population density: 3,575 people per square mile (average).
1,538 residents are foreign born (4.6% Latin America, 1.5% Africa, 0.8% Asia).
This city:
7.4%
Minnesota:
8.5%
Median real estate property taxes paid for housing units with mortgages in 2022: $2,811 (1.0%) Median real estate property taxes paid for housing units with no mortgage in 2022: $2,828 (1.1%)
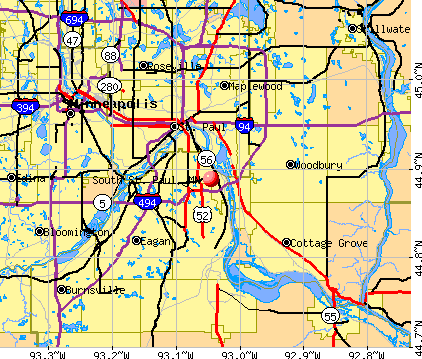
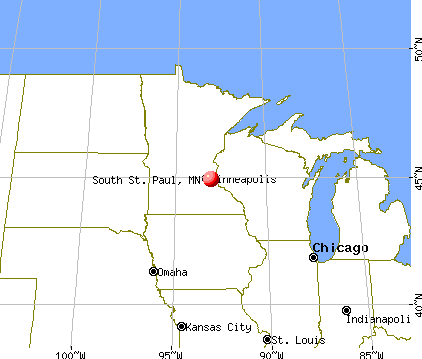
Nearest city with pop. 50,000+: St. Paul, MN (5.7 miles , pop. 287,151).
Nearest city with pop. 1,000,000+: Chicago, IL (342.3 miles , pop. 2,896,016).
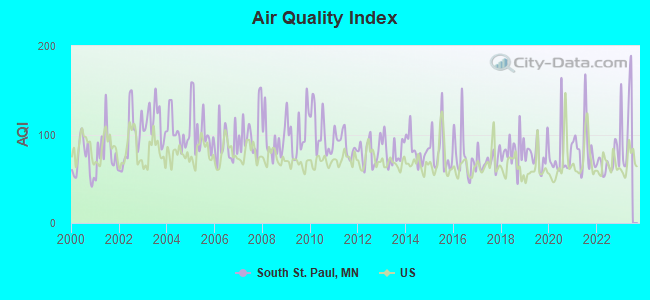
Air Quality Index (AQI) level in 2022 was 68.4. This is about average.
City:
68.4
U.S.:
72.6
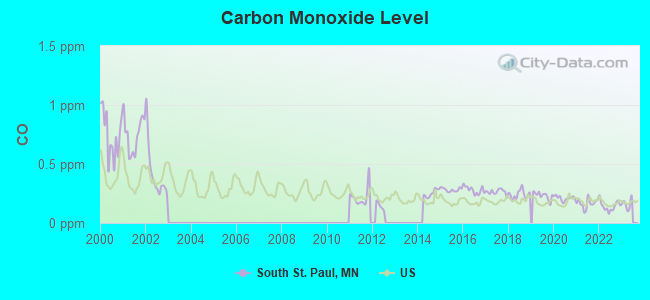
Carbon Monoxide (CO) [ppm] level in 2022 was 0.144. This is significantly better than average.Closest monitor was 4.6 miles away from the city center.
City:
0.144
U.S.:
0.251
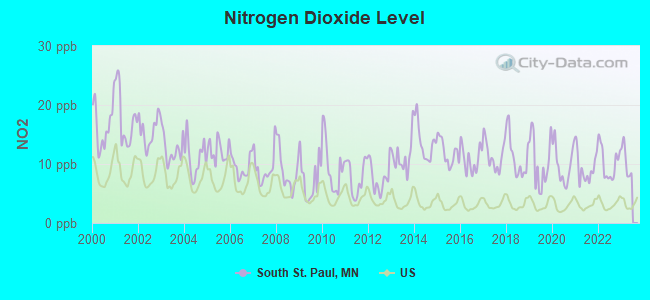
Nitrogen Dioxide (NO2) [ppb] level in 2022 was 10.2. This is significantly worse than average.Closest monitor was 1.6 miles away from the city center.
City:
10.2
U.S.:
5.1
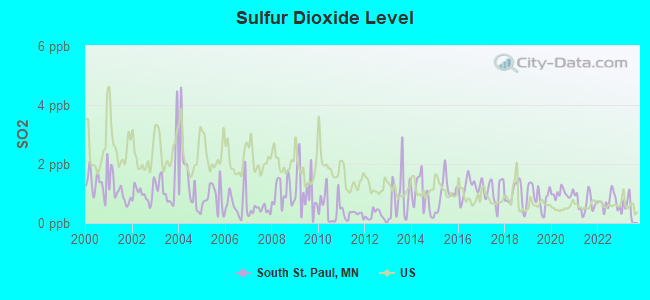
Sulfur Dioxide (SO2) [ppb] level in 2022 was 0.718. This is significantly better than average.Closest monitor was 1.6 miles away from the city center.
City:
0.718
U.S.:
1.515
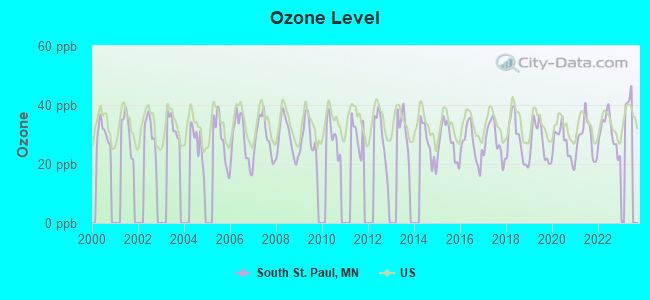
Ozone [ppb] level in 2022 was 30.7. This is about average.Closest monitor was 4.6 miles away from the city center.
City:
30.7
U.S.:
33.3
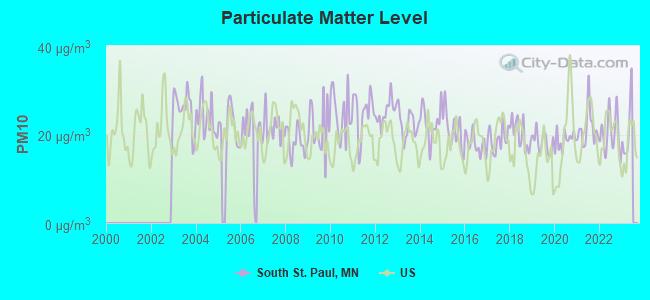
Particulate Matter (PM10) [µg/m3] level in 2022 was 20.2. This is about average.Closest monitor was 3.8 miles away from the city center.
City:
20.2
U.S.:
19.2
Particulate Matter (PM2.5) [µg/m3] level in 2022 was 6.35. This is better than average.Closest monitor was 2.9 miles away from the city center.
City:
6.35
U.S.:
8.11
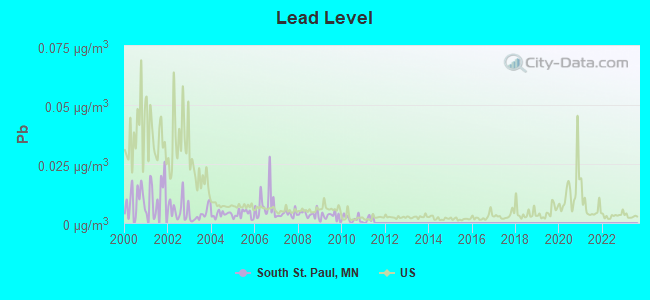
Lead (Pb) [µg/m3] level in 2010 was 0.00177. This is significantly better than average.Closest monitor was 1.6 miles away from the city center.
City:
0.00177
U.S.:
0.00931
Tornado activity:
South St. Paul-area historical tornado activity is slightly above Minnesota state average. It is 30% greater than the overall U.S. average.
On 5/6/1965, a category F4 (max. wind speeds 207-260 mph) tornado 15.1 miles away from the South St. Paul city center killed 3 peopleand injured 175 peopleand causedbetween $5,000,000 and $50,000,000 in damages.
On 6/4/1958, a category F5 (max. wind speeds 261-318 mph) tornado 35.1 miles away from the city center killed 21 peopleand injured 74 peopleand causedbetween $5,000,000 and $50,000,000 in damages.
Earthquake activity:
South St. Paul-area historical earthquake activity is significantly above Minnesota state average. It is 58% smaller than the overall U.S. average.
On 7/9/1975 at 14:54:15, a magnitude 4.6 (4.6 MB, Class: Light, Intensity: IV - V) earthquake occurred 155.5 miles away from the city center On 6/5/1993 at 01:24:53, a magnitude 4.1 (4.1 LG, Depth: 6.2 mi) earthquake occurred 167.1 miles away from South St. Paul center On 3/4/1983 at 06:32:18, a magnitude 4.6 (4.4 MB, 4.6 LG, 4.4 ML) earthquake occurred 317.0 miles away from South St. Paul center On 10/20/1995 at 15:57:18, a magnitude 3.7 (3.7 LG, Depth: 3.1 mi, Class: Light, Intensity: II - III) earthquake occurred 195.8 miles away from the city center On 2/9/1994 at 08:45:35, a magnitude 3.1 (3.1 LG, Depth: 3.1 mi) earthquake occurred 96.0 miles away from South St. Paul center On 11/3/2002 at 20:41:56, a magnitude 4.3 (4.3 MB, Depth: 3.1 mi) earthquake occurred 326.6 miles away from South St. Paul center Magnitude types: regional Lg-wave magnitude (LG), body-wave magnitude (MB), local magnitude (ML)
Natural disasters:
The number of natural disasters in Dakota County (15) is near the US average (15). Major Disasters (Presidential) Declared: 11 Emergencies Declared: 3
Causes of natural disasters: Floods: 11, Storms: 7, Tornadoes: 5, Drought: 1, Hurricane: 1, Wind: 1, Other: 1 (Note: some incidents may be assigned to more than one category).
Main business address for: DIGITAL ANGEL CORP (COMMUNICATIONS EQUIPMENT, NEC).
Hospitals and medical centers near South St. Paul:
DIVINE REDEEMER MEMORIAL HOSPITAL (Hospital, about 2 miles away; SOUTH ST PAUL, MN)
CERENITY CARE CTR - BETHESDA (Nursing Home, about 2 miles away; SOUTH ST PAUL, MN)
BRYANT AVE RESIDENCE (Hospital, about 2 miles away; S ST PAUL, MN)
SUMMIT AVENUE RESIDENCE (Hospital, about 2 miles away; SOUTH SAINT PAUL, MN)
SOUTHVIEW ACRES HEALTH CARE CENTER INC (Nursing Home, about 2 miles away; WEST SAINT PAUL, MN)
WEDGEWOOD HEALTH CARE CTR (Nursing Home, about 2 miles away; INVER GROVE HEIGHTS, MN)
WOODLYN HEIGHTS HEALTHCARE CENTER (Nursing Home, about 2 miles away; INVER GROVE HEIGHTS, MN)
Amtrak station near South St. Paul:
9 miles: ST. PAUL/MINNEAPOLIS (ST. PAUL, 730 TRANSFER RD.) . Services: ticket office, fully wheelchair accessible, enclosed waiting area, public restrooms, public payphones, vending machines, free short-term parking, free long-term parking, call for car rental service, taxi stand.
Parks in South St. Paul include: Harmon Park (1), Kaposia Park (2), Lorraine Park (3), Vets Field (4), North View Park (5), Summit Park (6), Grandview Park (7), Fred Lawshe Park (8), Siedl's Lake Park (9). Display/hide their locations on the map
Birthplace of: Grant Hart - Punk rock drummer, Little Crow - Native leader, Alex Stalock - Ice hockey player, Joe Atkins - Politician, Justin Faulk - Ice hockey defenceman.
Dakota County has a predicted average indoor radon screening level greater than 4 pCi/L (pico curies per liter) - Highest Potential
Drinking water stations with addresses in South St. Paul and their reported violations in the past:
Follow-up Or Routine LCR Tap M/R - In OCT-01-2011, Contaminant: Lead and Copper Rule. Follow-up actions: St Violation/Reminder Notice (2 times from SEP-06-2011 to SEP-19-2011), St Public Notif requested (NOV-18-2011), St Formal NOV issued (NOV-18-2011), St Violation/Reminder Notice (2 times from DEC-15-2011 to DEC-27-2011), St Public Notif received (JAN-19-2012), St Compliance achieved (JUL-11-2012)
2 routine major monitoring violations
Average household size:
This city:
2.4 people
Minnesota:
2.5 people
Percentage of family households:
This city:
61.9%
Whole state:
64.6%
Percentage of households with unmarried partners:
This city:
8.8%
Whole state:
6.9%
Likely homosexual households (counted as self-reported same-sex unmarried-partner households)
Lesbian couples: 0.5% of all households
Gay men: 0.1% of all households
People in group quarters in South St. Paul in 2010:
115 people in nursing facilities/skilled-nursing facilities
78 people in group homes intended for adults
11 people in residential treatment centers for adults
3 people in workers' group living quarters and job corps centers
3 people in other noninstitutional facilities
People in group quarters in South St. Paul in 2000:
74 people in homes for the mentally retarded
15 people in homes for the mentally ill
3 people in religious group quarters
3 people in other noninstitutional group quarters
Banks with branches in South St. Paul (2011 data):
Wells Fargo Bank, National Association: South St. Paul Branch at 161 North Concord Exchange, branch established on 1897/01/01. Info updated 2011/04/05: Bank assets: $1,161,490.0 mil, Deposits: $905,653.0 mil, headquarters in Sioux Falls, SD, positive income, 6395 total offices, Holding Company: Wells Fargo & Company
Bremer Bank, National Association: at 633 South Concord Street, branch established on 1932/11/19. Info updated 2006/11/03: Bank assets: $2,725.5 mil, Deposits: $2,268.8 mil, local headquarters, positive income, Commercial Lending Specialization, 29 total offices, Holding Company: Otto Bremer Foundation
Central Bank: South St. Paul Branch at 835 Southview Boulevard, branch established on 1964/02/10. Info updated 2011/10/11: Bank assets: $1,120.1 mil, Deposits: $949.3 mil, headquarters in Stillwater, MN, positive income, Commercial Lending Specialization, 20 total offices, Holding Company: Central Bancshares, Inc.
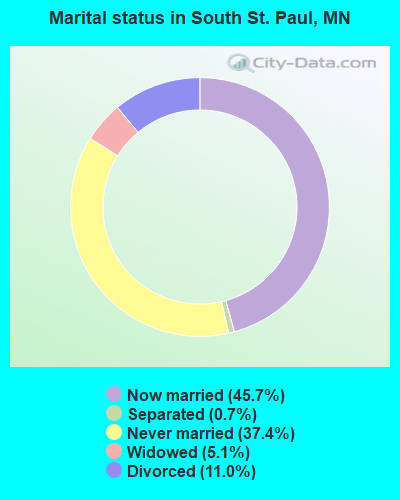
For population 15 years and over in South St. Paul:
Never married: 37.4%
Now married: 45.7%
Separated: 0.7%
Widowed: 5.1%
Divorced: 11.0%
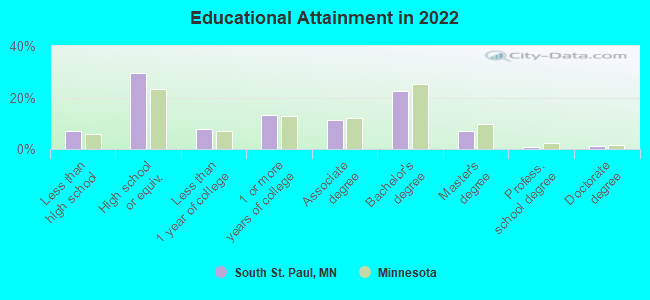
For population 25 years and over in South St. Paul:
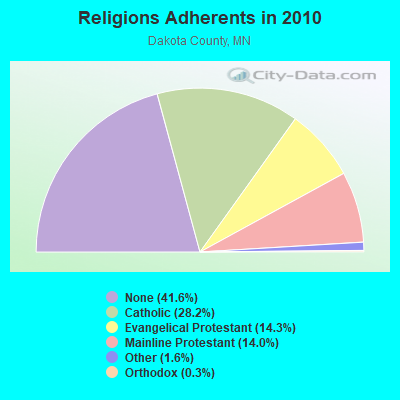
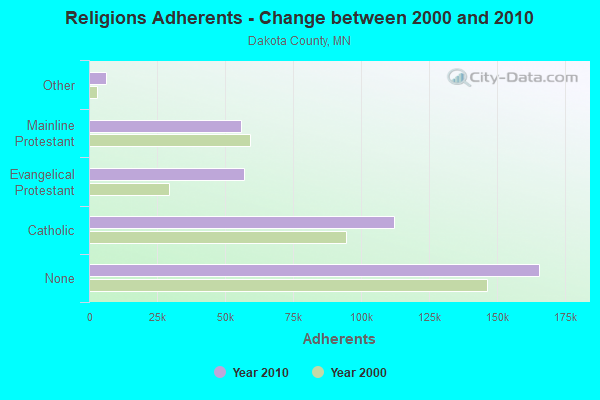
Religion statistics for South St. Paul, MN (based on Dakota County data)
Religion
Adherents
Congregations
Catholic
112,264
18
Evangelical Protestant
57,007
111
Mainline Protestant
55,850
56
Other
6,321
27
Orthodox
1,173
5
Black Protestant
313
2
None
165,624
-
Source: Clifford Grammich, Kirk Hadaway, Richard Houseal, Dale E.Jones, Alexei Krindatch, Richie Stanley and Richard H.Taylor. 2012. 2010 U.S.Religion Census: Religious Congregations & Membership Study. Association of Statisticians of American Religious Bodies. Jones, Dale E., et al. 2002. Congregations and Membership in the United States 2000. Nashville, TN: Glenmary Research Center. Graphs represent county-level data
CARROLL HI RISE, 300 W. Grand Ave (Lat: 44.894417 Lon: -93.038833), Type: Bant, Structure height: 43 m, Overall height: 49 m, Call Sign: KAX787, Assigned Frequencies: 158.820 MHz, Grant Date: 02/25/2021, Expiration Date: 05/06/2031, Certifier: Bill Schmidt, Registrant: Mobile Radio Eng., 745 Boone Ave N, Golden Valley, MN 55427, Phone: (763) 544-3319, Fax: (763) 544-2078, Email:
Call Sign: KC0CLY, Licensee ID: L01367452, Grant Date: 12/27/2017, Expiration Date: 02/08/2028, Registrant: Peter R Gawtry, 919 Logan Lane, South St. Paul, MN 55075
Call Sign: KL7PZ, Licensee ID: L01073505, Grant Date: 03/24/1999, Expiration Date: 03/24/2009, Cancellation Date: 10/18/2005, Registrant: Brian S Milum, 2418 Gilbert Ln, South St. Paul, MN 55075
Call Sign: NL7AS, Licensee ID: L00785981, Grant Date: 03/03/2015, Expiration Date: 03/03/2025, Registrant: Mark J Linafelter, 136 Tenth Avenue North, South St. Paul, MN 55075-1920
Home Mortgage Disclosure Act Aggregated Statistics For Year 2009 (Based on 6 full and 1 partial tracts)
A) FHA, FSA/RHS & VA Home Purchase Loans
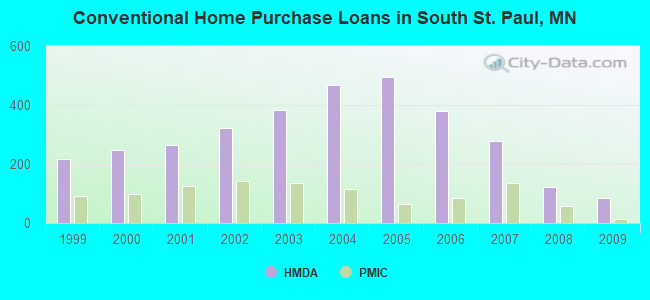
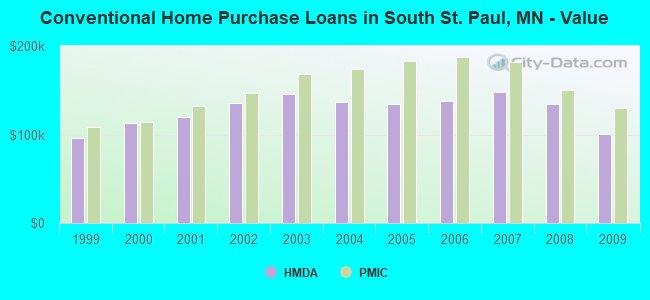
B) Conventional Home Purchase Loans
C) Refinancings
D) Home Improvement Loans
E) Loans on Dwellings For 5+ Families
F) Non-occupant Loans on < 5 Family Dwellings (A B C & D)
G) Loans On Manufactured Home Dwelling (A B C & D)
Number
Average Value
Number
Average Value
Number
Average Value
Number
Average Value
Number
Average Value
Number
Average Value
Number
Average Value
LOANS ORIGINATED
197
$143,423
84
$100,560
400
$148,624
28
$44,705
3
$527,033
37
$116,633
0
$0
APPLICATIONS APPROVED, NOT ACCEPTED
11
$150,293
6
$109,647
34
$145,059
4
$29,000
0
$0
6
$114,000
0
$0
APPLICATIONS DENIED
13
$129,231
13
$115,736
147
$169,605
17
$35,946
0
$0
6
$134,227
2
$98,535
APPLICATIONS WITHDRAWN
15
$135,195
9
$123,290
98
$168,756
5
$139,250
1
$585,000
7
$202,857
0
$0
FILES CLOSED FOR INCOMPLETENESS
1
$152,460
4
$126,628
40
$142,602
5
$76,794
0
$0
0
$0
0
$0
Aggregated Statistics For Year 2008 (Based on 6 full and 1 partial tracts)
A) FHA, FSA/RHS & VA Home Purchase Loans
B) Conventional Home Purchase Loans
C) Refinancings
D) Home Improvement Loans
E) Loans on Dwellings For 5+ Families
F) Non-occupant Loans on < 5 Family Dwellings (A B C & D)
G) Loans On Manufactured Home Dwelling (A B C & D)
Number
Average Value
Number
Average Value
Number
Average Value
Number
Average Value
Number
Average Value
Number
Average Value
Number
Average Value
LOANS ORIGINATED
123
$164,663
122
$134,042
240
$155,879
40
$33,071
5
$422,422
29
$109,652
0
$0
APPLICATIONS APPROVED, NOT ACCEPTED
7
$146,423
15
$162,464
53
$165,959
9
$27,623
0
$0
3
$152,333
1
$12,000
APPLICATIONS DENIED
10
$143,790
23
$124,189
165
$180,976
43
$37,327
1
$235,000
10
$108,024
1
$40,540
APPLICATIONS WITHDRAWN
14
$153,547
10
$144,085
56
$176,424
8
$71,314
0
$0
5
$169,400
0
$0
FILES CLOSED FOR INCOMPLETENESS
3
$220,850
2
$142,000
28
$193,400
5
$45,000
0
$0
1
$206,000
0
$0
Aggregated Statistics For Year 2007 (Based on 6 full and 1 partial tracts)
A) FHA, FSA/RHS & VA Home Purchase Loans
B) Conventional Home Purchase Loans
C) Refinancings
D) Home Improvement Loans
E) Loans on Dwellings For 5+ Families
F) Non-occupant Loans on < 5 Family Dwellings (A B C & D)
G) Loans On Manufactured Home Dwelling (A B C & D)
Number
Average Value
Number
Average Value
Number
Average Value
Number
Average Value
Number
Average Value
Number
Average Value
Number
Average Value
LOANS ORIGINATED
23
$211,114
277
$148,398
400
$140,409
77
$42,918
3
$420,420
58
$156,948
0
$0
APPLICATIONS APPROVED, NOT ACCEPTED
0
$0
22
$153,134
90
$147,581
15
$54,933
0
$0
10
$143,900
0
$0
APPLICATIONS DENIED
2
$235,545
84
$146,659
330
$176,983
52
$59,509
1
$160,000
30
$176,333
7
$39,784
APPLICATIONS WITHDRAWN
5
$213,954
25
$184,694
123
$171,768
13
$69,849
1
$178,000
14
$156,831
0
$0
FILES CLOSED FOR INCOMPLETENESS
0
$0
7
$184,359
37
$169,845
2
$99,035
0
$0
2
$194,000
0
$0
Aggregated Statistics For Year 2006 (Based on 6 full and 1 partial tracts)
A) FHA, FSA/RHS & VA Home Purchase Loans
B) Conventional Home Purchase Loans
C) Refinancings
D) Home Improvement Loans
E) Loans on Dwellings For 5+ Families
F) Non-occupant Loans on < 5 Family Dwellings (A B C & D)
G) Loans On Manufactured Home Dwelling (A B C & D)
Number
Average Value
Number
Average Value
Number
Average Value
Number
Average Value
Number
Average Value
Number
Average Value
Number
Average Value
LOANS ORIGINATED
27
$192,411
378
$137,368
564
$141,682
121
$44,318
5
$701,400
98
$134,232
0
$0
APPLICATIONS APPROVED, NOT ACCEPTED
0
$0
53
$138,695
118
$141,476
15
$65,976
0
$0
9
$161,070
2
$26,500
APPLICATIONS DENIED
1
$226,000
92
$147,807
363
$162,780
56
$60,010
2
$513,500
40
$166,578
3
$92,387
APPLICATIONS WITHDRAWN
2
$146,360
51
$141,043
226
$162,482
17
$95,697
0
$0
18
$160,543
0
$0
FILES CLOSED FOR INCOMPLETENESS
1
$164,000
20
$151,926
59
$165,246
5
$63,200
0
$0
2
$261,000
0
$0
Aggregated Statistics For Year 2005 (Based on 6 full and 1 partial tracts)
A) FHA, FSA/RHS & VA Home Purchase Loans
B) Conventional Home Purchase Loans
C) Refinancings
D) Home Improvement Loans
E) Loans on Dwellings For 5+ Families
F) Non-occupant Loans on < 5 Family Dwellings (A B C & D)
G) Loans On Manufactured Home Dwelling (A B C & D)
Number
Average Value
Number
Average Value
Number
Average Value
Number
Average Value
Number
Average Value
Number
Average Value
Number
Average Value
LOANS ORIGINATED
45
$182,632
495
$134,226
722
$146,209
109
$59,934
6
$405,593
109
$148,729
1
$25,530
APPLICATIONS APPROVED, NOT ACCEPTED
1
$182,000
58
$129,015
136
$132,964
23
$81,378
0
$0
16
$202,568
1
$84,870
APPLICATIONS DENIED
4
$158,500
81
$136,301
304
$168,528
56
$39,736
0
$0
32
$170,650
7
$48,813
APPLICATIONS WITHDRAWN
4
$198,200
46
$131,123
305
$172,013
25
$73,631
2
$127,500
15
$190,067
0
$0
FILES CLOSED FOR INCOMPLETENESS
0
$0
12
$102,082
98
$171,567
3
$103,000
0
$0
5
$203,400
0
$0
Aggregated Statistics For Year 2004 (Based on 6 full and 1 partial tracts)
A) FHA, FSA/RHS & VA Home Purchase Loans
B) Conventional Home Purchase Loans
C) Refinancings
D) Home Improvement Loans
E) Loans on Dwellings For 5+ Families
F) Non-occupant Loans on < 5 Family Dwellings (A B C & D)
G) Loans On Manufactured Home Dwelling (A B C & D)
Number
Average Value
Number
Average Value
Number
Average Value
Number
Average Value
Number
Average Value
Number
Average Value
Number
Average Value
LOANS ORIGINATED
65
$180,017
467
$137,252
731
$139,265
110
$43,762
3
$2,656,667
96
$140,968
1
$59,000
APPLICATIONS APPROVED, NOT ACCEPTED
2
$162,500
61
$121,001
123
$145,255
10
$83,220
0
$0
15
$124,933
5
$65,800
APPLICATIONS DENIED
0
$0
81
$130,495
335
$147,431
63
$42,839
1
$630,000
28
$124,026
4
$45,750
APPLICATIONS WITHDRAWN
4
$192,250
44
$163,369
214
$147,890
24
$55,743
0
$0
11
$157,809
0
$0
FILES CLOSED FOR INCOMPLETENESS
1
$214,000
13
$138,175
91
$158,262
4
$42,780
0
$0
1
$159,000
0
$0
Aggregated Statistics For Year 2003 (Based on 6 full and 1 partial tracts)
A) FHA, FSA/RHS & VA Home Purchase Loans
B) Conventional Home Purchase Loans
C) Refinancings
D) Home Improvement Loans
E) Loans on Dwellings For 5+ Families
F) Non-occupant Loans on < 5 Family Dwellings (A B C & D)
Number
Average Value
Number
Average Value
Number
Average Value
Number
Average Value
Number
Average Value
Number
Average Value
LOANS ORIGINATED
97
$172,162
382
$145,581
1,587
$126,263
99
$26,433
9
$439,778
97
$144,637
APPLICATIONS APPROVED, NOT ACCEPTED
2
$170,000
39
$147,357
166
$136,652
11
$22,011
0
$0
16
$130,674
APPLICATIONS DENIED
4
$155,715
58
$115,533
419
$129,595
34
$29,557
0
$0
10
$169,096
APPLICATIONS WITHDRAWN
5
$141,000
39
$126,044
353
$131,767
4
$24,250
0
$0
7
$102,286
FILES CLOSED FOR INCOMPLETENESS
1
$178,000
6
$157,838
62
$143,939
4
$18,200
0
$0
2
$221,500
Aggregated Statistics For Year 2002 (Based on 6 full and 1 partial tracts)
A) FHA, FSA/RHS & VA Home Purchase Loans
B) Conventional Home Purchase Loans
C) Refinancings
D) Home Improvement Loans
E) Loans on Dwellings For 5+ Families
F) Non-occupant Loans on < 5 Family Dwellings (A B C & D)
Number
Average Value
Number
Average Value
Number
Average Value
Number
Average Value
Number
Average Value
Number
Average Value
LOANS ORIGINATED
118
$153,310
322
$135,903
1,126
$114,791
91
$22,657
2
$215,000
64
$127,984
APPLICATIONS APPROVED, NOT ACCEPTED
4
$177,750
30
$126,703
125
$117,608
16
$30,586
0
$0
7
$170,571
APPLICATIONS DENIED
4
$150,000
39
$111,196
267
$99,946
50
$27,384
0
$0
9
$124,000
APPLICATIONS WITHDRAWN
5
$144,400
33
$128,462
283
$127,414
9
$30,978
0
$0
4
$114,250
FILES CLOSED FOR INCOMPLETENESS
2
$154,500
5
$79,650
96
$128,654
1
$103,810
0
$0
0
$0
Aggregated Statistics For Year 2001 (Based on 6 full and 1 partial tracts)
A) FHA, FSA/RHS & VA Home Purchase Loans
B) Conventional Home Purchase Loans
C) Refinancings
D) Home Improvement Loans
E) Loans on Dwellings For 5+ Families
F) Non-occupant Loans on < 5 Family Dwellings (A B C & D)
Number
Average Value
Number
Average Value
Number
Average Value
Number
Average Value
Number
Average Value
Number
Average Value
LOANS ORIGINATED
143
$143,018
264
$120,338
985
$101,919
102
$21,343
4
$275,500
47
$117,413
APPLICATIONS APPROVED, NOT ACCEPTED
3
$148,680
20
$100,330
97
$90,551
13
$27,510
0
$0
5
$110,600
APPLICATIONS DENIED
4
$151,062
37
$90,505
293
$81,648
50
$20,592
0
$0
7
$108,571
APPLICATIONS WITHDRAWN
3
$110,467
11
$107,348
288
$100,903
13
$39,748
0
$0
3
$62,667
FILES CLOSED FOR INCOMPLETENESS
1
$160,160
4
$116,290
46
$109,026
2
$26,625
0
$0
1
$111,000
Aggregated Statistics For Year 2000 (Based on 6 full and 1 partial tracts)
A) FHA, FSA/RHS & VA Home Purchase Loans
B) Conventional Home Purchase Loans
C) Refinancings
D) Home Improvement Loans
E) Loans on Dwellings For 5+ Families
F) Non-occupant Loans on < 5 Family Dwellings (A B C & D)
Number
Average Value
Number
Average Value
Number
Average Value
Number
Average Value
Number
Average Value
Number
Average Value
LOANS ORIGINATED
130
$123,261
248
$113,198
322
$74,799
127
$17,711
3
$159,333
35
$89,312
APPLICATIONS APPROVED, NOT ACCEPTED
3
$97,000
27
$75,060
51
$76,078
24
$19,292
1
$169,000
4
$105,032
APPLICATIONS DENIED
10
$114,021
50
$74,562
170
$59,962
67
$18,335
0
$0
4
$89,918
APPLICATIONS WITHDRAWN
5
$106,330
22
$84,840
149
$86,739
12
$18,568
1
$2,096,000
6
$69,667
FILES CLOSED FOR INCOMPLETENESS
4
$116,892
7
$93,000
48
$81,522
1
$37,540
0
$0
1
$57,000
Aggregated Statistics For Year 1999 (Based on 6 full and 1 partial tracts)
A) FHA, FSA/RHS & VA Home Purchase Loans
B) Conventional Home Purchase Loans
C) Refinancings
D) Home Improvement Loans
E) Loans on Dwellings For 5+ Families
F) Non-occupant Loans on < 5 Family Dwellings (A B C & D)
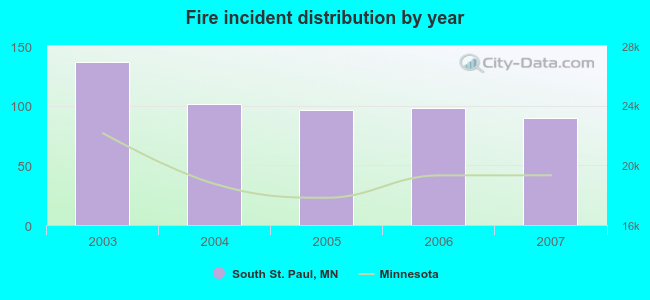
2003 - 2007 National Fire Incident Reporting System (NFIRS) incidents
According to the data from the years 2003 - 2007 the average number of fire incidents per year is 104. The highest number of reported fires - 137 took place in 2003, and the least - 90 in 2007. The data has a declining trend.
When looking into fire subcategories, the most incidents belonged to: Structure Fires (35.4%), and Outside Fires (33.1%).
Fire incident types reported to NFIRS in South St. Paul, MN


 Recent articles from our blog. Our writers, many of them Ph.D. graduates or candidates, create easy-to-read articles on a wide variety of topics.

 (5.7 miles


 According to the data from the years 2003 - 2007 the average number of fire incidents per year is 104. The highest number of reported fires - 137 took place in 2003, and the least - 90 in 2007. The data has a declining trend.
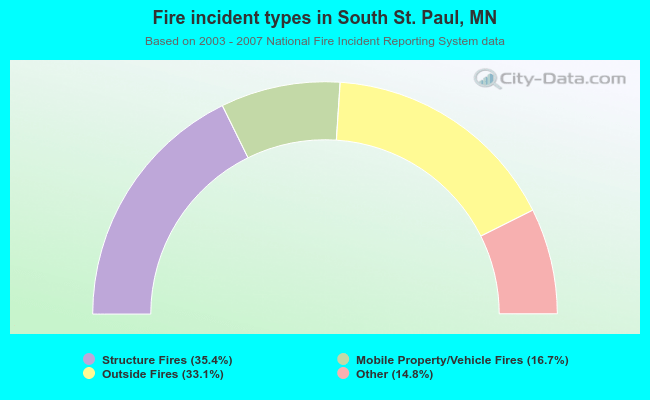 When looking into fire subcategories, the most incidents belonged to: Structure Fires (35.4%), and Outside Fires (33.1%).