Steubenville, Ohio Submit your own pictures of this city and show them to the world
OSM Map
General Map
Google Map
MSN Map
OSM Map
General Map
Google Map
MSN Map
OSM Map
General Map
Google Map
MSN Map
OSM Map
General Map
Google Map
MSN Map
Please wait while loading the map...
Population in 2022: 18,030 (100% urban, 0% rural). Population change since 2000: -5.2%Males: 8,829 Females: 9,201
March 2022 cost of living index in Steubenville: 88.5 (less than average, U.S. average is 100) Percentage of residents living in poverty in 2022: 27.9%for White Non-Hispanic residents , 45.4% for Black residents , 56.7% for Hispanic or Latino residents , 53.3% for other race residents , 37.3% for two or more races residents )Business Search - 14 Million verified businesses
Data:
Median household income ($)
Median household income (% change since 2000)
Household income diversity
Ratio of average income to average house value (%)
Ratio of average income to average rent
Median household income ($) - White
Median household income ($) - Black or African American
Median household income ($) - Asian
Median household income ($) - Hispanic or Latino
Median household income ($) - American Indian and Alaska Native
Median household income ($) - Multirace
Median household income ($) - Other Race
Median household income for houses/condos with a mortgage ($)
Median household income for apartments without a mortgage ($)
Races - White alone (%)
Races - White alone (% change since 2000)
Races - Black alone (%)
Races - Black alone (% change since 2000)
Races - American Indian alone (%)
Races - American Indian alone (% change since 2000)
Races - Asian alone (%)
Races - Asian alone (% change since 2000)
Races - Hispanic (%)
Races - Hispanic (% change since 2000)
Races - Native Hawaiian and Other Pacific Islander alone (%)
Races - Native Hawaiian and Other Pacific Islander alone (% change since 2000)
Races - Two or more races (%)
Races - Two or more races (% change since 2000)
Races - Other race alone (%)
Races - Other race alone (% change since 2000)
Racial diversity
Unemployment (%)
Unemployment (% change since 2000)
Unemployment (%) - White
Unemployment (%) - Black or African American
Unemployment (%) - Asian
Unemployment (%) - Hispanic or Latino
Unemployment (%) - American Indian and Alaska Native
Unemployment (%) - Multirace
Unemployment (%) - Other Race
Population density (people per square mile)
Population - Males (%)
Population - Females (%)
Population - Males (%) - White
Population - Males (%) - Black or African American
Population - Males (%) - Asian
Population - Males (%) - Hispanic or Latino
Population - Males (%) - American Indian and Alaska Native
Population - Males (%) - Multirace
Population - Males (%) - Other Race
Population - Females (%) - White
Population - Females (%) - Black or African American
Population - Females (%) - Asian
Population - Females (%) - Hispanic or Latino
Population - Females (%) - American Indian and Alaska Native
Population - Females (%) - Multirace
Population - Females (%) - Other Race
Coronavirus confirmed cases (Jun 16, 2024)
Deaths caused by coronavirus (Jun 16, 2024)
Coronavirus confirmed cases (per 100k population) (Jun 16, 2024)
Deaths caused by coronavirus (per 100k population) (Jun 16, 2024)
Daily increase in number of cases (Jun 16, 2024)
Weekly increase in number of cases (Jun 16, 2024)
Cases doubled (in days) (Jun 16, 2024)
Hospitalized patients (Apr 18, 2022)
Negative test results (Apr 18, 2022)
Total test results (Apr 18, 2022)
COVID Vaccine doses distributed (per 100k population) (Sep 19, 2023)
COVID Vaccine doses administered (per 100k population) (Sep 19, 2023)
COVID Vaccine doses distributed (Sep 19, 2023)
COVID Vaccine doses administered (Sep 19, 2023)
Likely homosexual households (%)
Likely homosexual households (% change since 2000)
Likely homosexual households - Lesbian couples (%)
Likely homosexual households - Lesbian couples (% change since 2000)
Likely homosexual households - Gay men (%)
Likely homosexual households - Gay men (% change since 2000)
Cost of living index
Median gross rent ($)
Median contract rent ($)
Median monthly housing costs ($)
Median house or condo value ($)
Median house or condo value ($ change since 2000)
Mean house or condo value by units in structure - 1, detached ($)
Mean house or condo value by units in structure - 1, attached ($)
Mean house or condo value by units in structure - 2 ($)
Mean house or condo value by units in structure by units in structure - 3 or 4 ($)
Mean house or condo value by units in structure - 5 or more ($)
Mean house or condo value by units in structure - Boat, RV, van, etc. ($)
Mean house or condo value by units in structure - Mobile home ($)
Median house or condo value ($) - White
Median house or condo value ($) - Black or African American
Median house or condo value ($) - Asian
Median house or condo value ($) - Hispanic or Latino
Median house or condo value ($) - American Indian and Alaska Native
Median house or condo value ($) - Multirace
Median house or condo value ($) - Other Race
Median resident age
Resident age diversity
Median resident age - Males
Median resident age - Females
Median resident age - White
Median resident age - Black or African American
Median resident age - Asian
Median resident age - Hispanic or Latino
Median resident age - American Indian and Alaska Native
Median resident age - Multirace
Median resident age - Other Race
Median resident age - Males - White
Median resident age - Males - Black or African American
Median resident age - Males - Asian
Median resident age - Males - Hispanic or Latino
Median resident age - Males - American Indian and Alaska Native
Median resident age - Males - Multirace
Median resident age - Males - Other Race
Median resident age - Females - White
Median resident age - Females - Black or African American
Median resident age - Females - Asian
Median resident age - Females - Hispanic or Latino
Median resident age - Females - American Indian and Alaska Native
Median resident age - Females - Multirace
Median resident age - Females - Other Race
Commute - mean travel time to work (minutes)
Travel time to work - Less than 5 minutes (%)
Travel time to work - Less than 5 minutes (% change since 2000)
Travel time to work - 5 to 9 minutes (%)
Travel time to work - 5 to 9 minutes (% change since 2000)
Travel time to work - 10 to 19 minutes (%)
Travel time to work - 10 to 19 minutes (% change since 2000)
Travel time to work - 20 to 29 minutes (%)
Travel time to work - 20 to 29 minutes (% change since 2000)
Travel time to work - 30 to 39 minutes (%)
Travel time to work - 30 to 39 minutes (% change since 2000)
Travel time to work - 40 to 59 minutes (%)
Travel time to work - 40 to 59 minutes (% change since 2000)
Travel time to work - 60 to 89 minutes (%)
Travel time to work - 60 to 89 minutes (% change since 2000)
Travel time to work - 90 or more minutes (%)
Travel time to work - 90 or more minutes (% change since 2000)
Marital status - Never married (%)
Marital status - Now married (%)
Marital status - Separated (%)
Marital status - Widowed (%)
Marital status - Divorced (%)
Median family income ($)
Median family income (% change since 2000)
Median non-family income ($)
Median non-family income (% change since 2000)
Median per capita income ($)
Median per capita income (% change since 2000)
Median family income ($) - White
Median family income ($) - Black or African American
Median family income ($) - Asian
Median family income ($) - Hispanic or Latino
Median family income ($) - American Indian and Alaska Native
Median family income ($) - Multirace
Median family income ($) - Other Race
Median year house/condo built
Median year apartment built
Year house built - Built 2005 or later (%)
Year house built - Built 2000 to 2004 (%)
Year house built - Built 1990 to 1999 (%)
Year house built - Built 1980 to 1989 (%)
Year house built - Built 1970 to 1979 (%)
Year house built - Built 1960 to 1969 (%)
Year house built - Built 1950 to 1959 (%)
Year house built - Built 1940 to 1949 (%)
Year house built - Built 1939 or earlier (%)
Average household size
Household density (households per square mile)
Average household size - White
Average household size - Black or African American
Average household size - Asian
Average household size - Hispanic or Latino
Average household size - American Indian and Alaska Native
Average household size - Multirace
Average household size - Other Race
Occupied housing units (%)
Vacant housing units (%)
Owner occupied housing units (%)
Renter occupied housing units (%)
Vacancy status - For rent (%)
Vacancy status - For sale only (%)
Vacancy status - Rented or sold, not occupied (%)
Vacancy status - For seasonal, recreational, or occasional use (%)
Vacancy status - For migrant workers (%)
Vacancy status - Other vacant (%)
Residents with income below the poverty level (%)
Residents with income below 50% of the poverty level (%)
Children below poverty level (%)
Poor families by family type - Married-couple family (%)
Poor families by family type - Male, no wife present (%)
Poor families by family type - Female, no husband present (%)
Poverty status for native-born residents (%)
Poverty status for foreign-born residents (%)
Poverty among high school graduates not in families (%)
Poverty among people who did not graduate high school not in families (%)
Residents with income below the poverty level (%) - White
Residents with income below the poverty level (%) - Black or African American
Residents with income below the poverty level (%) - Asian
Residents with income below the poverty level (%) - Hispanic or Latino
Residents with income below the poverty level (%) - American Indian and Alaska Native
Residents with income below the poverty level (%) - Multirace
Residents with income below the poverty level (%) - Other Race
Air pollution - Air Quality Index (AQI)
Air pollution - CO
Air pollution - NO2
Air pollution - SO2
Air pollution - Ozone
Air pollution - PM10
Air pollution - PM25
Air pollution - Pb
Crime - Murders per 100,000 population
Crime - Rapes per 100,000 population
Crime - Robberies per 100,000 population
Crime - Assaults per 100,000 population
Crime - Burglaries per 100,000 population
Crime - Thefts per 100,000 population
Crime - Auto thefts per 100,000 population
Crime - Arson per 100,000 population
Crime - City-data.com crime index
Crime - Violent crime index
Crime - Property crime index
Crime - Murders per 100,000 population (5 year average)
Crime - Rapes per 100,000 population (5 year average)
Crime - Robberies per 100,000 population (5 year average)
Crime - Assaults per 100,000 population (5 year average)
Crime - Burglaries per 100,000 population (5 year average)
Crime - Thefts per 100,000 population (5 year average)
Crime - Auto thefts per 100,000 population (5 year average)
Crime - Arson per 100,000 population (5 year average)
Crime - City-data.com crime index (5 year average)
Crime - Violent crime index (5 year average)
Crime - Property crime index (5 year average)
1996 Presidential Elections Results (%) - Democratic Party (Clinton)
1996 Presidential Elections Results (%) - Republican Party (Dole)
1996 Presidential Elections Results (%) - Other
2000 Presidential Elections Results (%) - Democratic Party (Gore)
2000 Presidential Elections Results (%) - Republican Party (Bush)
2000 Presidential Elections Results (%) - Other
2004 Presidential Elections Results (%) - Democratic Party (Kerry)
2004 Presidential Elections Results (%) - Republican Party (Bush)
2004 Presidential Elections Results (%) - Other
2008 Presidential Elections Results (%) - Democratic Party (Obama)
2008 Presidential Elections Results (%) - Republican Party (McCain)
2008 Presidential Elections Results (%) - Other
2012 Presidential Elections Results (%) - Democratic Party (Obama)
2012 Presidential Elections Results (%) - Republican Party (Romney)
2012 Presidential Elections Results (%) - Other
2016 Presidential Elections Results (%) - Democratic Party (Clinton)
2016 Presidential Elections Results (%) - Republican Party (Trump)
2016 Presidential Elections Results (%) - Other
2020 Presidential Elections Results (%) - Democratic Party (Biden)
2020 Presidential Elections Results (%) - Republican Party (Trump)
2020 Presidential Elections Results (%) - Other
Ancestries Reported - Arab (%)
Ancestries Reported - Czech (%)
Ancestries Reported - Danish (%)
Ancestries Reported - Dutch (%)
Ancestries Reported - English (%)
Ancestries Reported - French (%)
Ancestries Reported - French Canadian (%)
Ancestries Reported - German (%)
Ancestries Reported - Greek (%)
Ancestries Reported - Hungarian (%)
Ancestries Reported - Irish (%)
Ancestries Reported - Italian (%)
Ancestries Reported - Lithuanian (%)
Ancestries Reported - Norwegian (%)
Ancestries Reported - Polish (%)
Ancestries Reported - Portuguese (%)
Ancestries Reported - Russian (%)
Ancestries Reported - Scotch-Irish (%)
Ancestries Reported - Scottish (%)
Ancestries Reported - Slovak (%)
Ancestries Reported - Subsaharan African (%)
Ancestries Reported - Swedish (%)
Ancestries Reported - Swiss (%)
Ancestries Reported - Ukrainian (%)
Ancestries Reported - United States (%)
Ancestries Reported - Welsh (%)
Ancestries Reported - West Indian (%)
Ancestries Reported - Other (%)
Educational Attainment - No schooling completed (%)
Educational Attainment - Less than high school (%)
Educational Attainment - High school or equivalent (%)
Educational Attainment - Less than 1 year of college (%)
Educational Attainment - 1 or more years of college (%)
Educational Attainment - Associate degree (%)
Educational Attainment - Bachelor's degree (%)
Educational Attainment - Master's degree (%)
Educational Attainment - Professional school degree (%)
Educational Attainment - Doctorate degree (%)
School Enrollment - Nursery, preschool (%)
School Enrollment - Kindergarten (%)
School Enrollment - Grade 1 to 4 (%)
School Enrollment - Grade 5 to 8 (%)
School Enrollment - Grade 9 to 12 (%)
School Enrollment - College undergrad (%)
School Enrollment - Graduate or professional (%)
School Enrollment - Not enrolled in school (%)
School enrollment - Public schools (%)
School enrollment - Private schools (%)
School enrollment - Not enrolled (%)
Median number of rooms in houses and condos
Median number of rooms in apartments
Housing units lacking complete plumbing facilities (%)
Housing units lacking complete kitchen facilities (%)
Density of houses
Urban houses (%)
Rural houses (%)
Households with people 60 years and over (%)
Households with people 65 years and over (%)
Households with people 75 years and over (%)
Households with one or more nonrelatives (%)
Households with no nonrelatives (%)
Population in households (%)
Family households (%)
Nonfamily households (%)
Population in families (%)
Family households with own children (%)
Median number of bedrooms in owner occupied houses
Mean number of bedrooms in owner occupied houses
Median number of bedrooms in renter occupied houses
Mean number of bedrooms in renter occupied houses
Median number of vehichles in owner occupied houses
Mean number of vehichles in owner occupied houses
Median number of vehichles in renter occupied houses
Mean number of vehichles in renter occupied houses
Mortgage status - with mortgage (%)
Mortgage status - with second mortgage (%)
Mortgage status - with home equity loan (%)
Mortgage status - with both second mortgage and home equity loan (%)
Mortgage status - without a mortgage (%)
Average family size
Average family size - White
Average family size - Black or African American
Average family size - Asian
Average family size - Hispanic or Latino
Average family size - American Indian and Alaska Native
Average family size - Multirace
Average family size - Other Race
Geographical mobility - Same house 1 year ago (%)
Geographical mobility - Moved within same county (%)
Geographical mobility - Moved from different county within same state (%)
Geographical mobility - Moved from different state (%)
Geographical mobility - Moved from abroad (%)
Place of birth - Born in state of residence (%)
Place of birth - Born in other state (%)
Place of birth - Native, outside of US (%)
Place of birth - Foreign born (%)
Housing units in structures - 1, detached (%)
Housing units in structures - 1, attached (%)
Housing units in structures - 2 (%)
Housing units in structures - 3 or 4 (%)
Housing units in structures - 5 to 9 (%)
Housing units in structures - 10 to 19 (%)
Housing units in structures - 20 to 49 (%)
Housing units in structures - 50 or more (%)
Housing units in structures - Mobile home (%)
Housing units in structures - Boat, RV, van, etc. (%)
House/condo owner moved in on average (years ago)
Renter moved in on average (years ago)
Year householder moved into unit - Moved in 1999 to March 2000 (%)
Year householder moved into unit - Moved in 1995 to 1998 (%)
Year householder moved into unit - Moved in 1990 to 1994 (%)
Year householder moved into unit - Moved in 1980 to 1989 (%)
Year householder moved into unit - Moved in 1970 to 1979 (%)
Year householder moved into unit - Moved in 1969 or earlier (%)
Means of transportation to work - Drove car alone (%)
Means of transportation to work - Carpooled (%)
Means of transportation to work - Public transportation (%)
Means of transportation to work - Bus or trolley bus (%)
Means of transportation to work - Streetcar or trolley car (%)
Means of transportation to work - Subway or elevated (%)
Means of transportation to work - Railroad (%)
Means of transportation to work - Ferryboat (%)
Means of transportation to work - Taxicab (%)
Means of transportation to work - Motorcycle (%)
Means of transportation to work - Bicycle (%)
Means of transportation to work - Walked (%)
Means of transportation to work - Other means (%)
Working at home (%)
Industry diversity
Most Common Industries - Agriculture, forestry, fishing and hunting, and mining (%)
Most Common Industries - Agriculture, forestry, fishing and hunting (%)
Most Common Industries - Mining, quarrying, and oil and gas extraction (%)
Most Common Industries - Construction (%)
Most Common Industries - Manufacturing (%)
Most Common Industries - Wholesale trade (%)
Most Common Industries - Retail trade (%)
Most Common Industries - Transportation and warehousing, and utilities (%)
Most Common Industries - Transportation and warehousing (%)
Most Common Industries - Utilities (%)
Most Common Industries - Information (%)
Most Common Industries - Finance and insurance, and real estate and rental and leasing (%)
Most Common Industries - Finance and insurance (%)
Most Common Industries - Real estate and rental and leasing (%)
Most Common Industries - Professional, scientific, and management, and administrative and waste management services (%)
Most Common Industries - Professional, scientific, and technical services (%)
Most Common Industries - Management of companies and enterprises (%)
Most Common Industries - Administrative and support and waste management services (%)
Most Common Industries - Educational services, and health care and social assistance (%)
Most Common Industries - Educational services (%)
Most Common Industries - Health care and social assistance (%)
Most Common Industries - Arts, entertainment, and recreation, and accommodation and food services (%)
Most Common Industries - Arts, entertainment, and recreation (%)
Most Common Industries - Accommodation and food services (%)
Most Common Industries - Other services, except public administration (%)
Most Common Industries - Public administration (%)
Occupation diversity
Most Common Occupations - Management, business, science, and arts occupations (%)
Most Common Occupations - Management, business, and financial occupations (%)
Most Common Occupations - Management occupations (%)
Most Common Occupations - Business and financial operations occupations (%)
Most Common Occupations - Computer, engineering, and science occupations (%)
Most Common Occupations - Computer and mathematical occupations (%)
Most Common Occupations - Architecture and engineering occupations (%)
Most Common Occupations - Life, physical, and social science occupations (%)
Most Common Occupations - Education, legal, community service, arts, and media occupations (%)
Most Common Occupations - Community and social service occupations (%)
Most Common Occupations - Legal occupations (%)
Most Common Occupations - Education, training, and library occupations (%)
Most Common Occupations - Arts, design, entertainment, sports, and media occupations (%)
Most Common Occupations - Healthcare practitioners and technical occupations (%)
Most Common Occupations - Health diagnosing and treating practitioners and other technical occupations (%)
Most Common Occupations - Health technologists and technicians (%)
Most Common Occupations - Service occupations (%)
Most Common Occupations - Healthcare support occupations (%)
Most Common Occupations - Protective service occupations (%)
Most Common Occupations - Fire fighting and prevention, and other protective service workers including supervisors (%)
Most Common Occupations - Law enforcement workers including supervisors (%)
Most Common Occupations - Food preparation and serving related occupations (%)
Most Common Occupations - Building and grounds cleaning and maintenance occupations (%)
Most Common Occupations - Personal care and service occupations (%)
Most Common Occupations - Sales and office occupations (%)
Most Common Occupations - Sales and related occupations (%)
Most Common Occupations - Office and administrative support occupations (%)
Most Common Occupations - Natural resources, construction, and maintenance occupations (%)
Most Common Occupations - Farming, fishing, and forestry occupations (%)
Most Common Occupations - Construction and extraction occupations (%)
Most Common Occupations - Installation, maintenance, and repair occupations (%)
Most Common Occupations - Production, transportation, and material moving occupations (%)
Most Common Occupations - Production occupations (%)
Most Common Occupations - Transportation occupations (%)
Most Common Occupations - Material moving occupations (%)
People in Group quarters - Institutionalized population (%)
People in Group quarters - Correctional institutions (%)
People in Group quarters - Federal prisons and detention centers (%)
People in Group quarters - Halfway houses (%)
People in Group quarters - Local jails and other confinement facilities (including police lockups) (%)
People in Group quarters - Military disciplinary barracks (%)
People in Group quarters - State prisons (%)
People in Group quarters - Other types of correctional institutions (%)
People in Group quarters - Nursing homes (%)
People in Group quarters - Hospitals/wards, hospices, and schools for the handicapped (%)
People in Group quarters - Hospitals/wards and hospices for chronically ill (%)
People in Group quarters - Hospices or homes for chronically ill (%)
People in Group quarters - Military hospitals or wards for chronically ill (%)
People in Group quarters - Other hospitals or wards for chronically ill (%)
People in Group quarters - Hospitals or wards for drug/alcohol abuse (%)
People in Group quarters - Mental (Psychiatric) hospitals or wards (%)
People in Group quarters - Schools, hospitals, or wards for the mentally retarded (%)
People in Group quarters - Schools, hospitals, or wards for the physically handicapped (%)
People in Group quarters - Institutions for the deaf (%)
People in Group quarters - Institutions for the blind (%)
People in Group quarters - Orthopedic wards and institutions for the physically handicapped (%)
People in Group quarters - Wards in general hospitals for patients who have no usual home elsewhere (%)
People in Group quarters - Wards in military hospitals for patients who have no usual home elsewhere (%)
People in Group quarters - Juvenile institutions (%)
People in Group quarters - Long-term care (%)
People in Group quarters - Homes for abused, dependent, and neglected children (%)
People in Group quarters - Residential treatment centers for emotionally disturbed children (%)
People in Group quarters - Training schools for juvenile delinquents (%)
People in Group quarters - Short-term care, detention or diagnostic centers for delinquent children (%)
People in Group quarters - Type of juvenile institution unknown (%)
People in Group quarters - Noninstitutionalized population (%)
People in Group quarters - College dormitories (includes college quarters off campus) (%)
People in Group quarters - Military quarters (%)
People in Group quarters - On base (%)
People in Group quarters - Barracks, unaccompanied personnel housing (UPH), (Enlisted/Officer), ;and similar group living quarters for military personnel (%)
People in Group quarters - Transient quarters for temporary residents (%)
People in Group quarters - Military ships (%)
People in Group quarters - Group homes (%)
People in Group quarters - Homes or halfway houses for drug/alcohol abuse (%)
People in Group quarters - Homes for the mentally ill (%)
People in Group quarters - Homes for the mentally retarded (%)
People in Group quarters - Homes for the physically handicapped (%)
People in Group quarters - Other group homes (%)
People in Group quarters - Religious group quarters (%)
People in Group quarters - Dormitories (%)
People in Group quarters - Agriculture workers' dormitories on farms (%)
People in Group quarters - Job Corps and vocational training facilities (%)
People in Group quarters - Other workers' dormitories (%)
People in Group quarters - Crews of maritime vessels (%)
People in Group quarters - Other nonhousehold living situations (%)
People in Group quarters - Other noninstitutional group quarters (%)
Residents speaking English at home (%)
Residents speaking English at home - Born in the United States (%)
Residents speaking English at home - Native, born elsewhere (%)
Residents speaking English at home - Foreign born (%)
Residents speaking Spanish at home (%)
Residents speaking Spanish at home - Born in the United States (%)
Residents speaking Spanish at home - Native, born elsewhere (%)
Residents speaking Spanish at home - Foreign born (%)
Residents speaking other language at home (%)
Residents speaking other language at home - Born in the United States (%)
Residents speaking other language at home - Native, born elsewhere (%)
Residents speaking other language at home - Foreign born (%)
Class of Workers - Employee of private company (%)
Class of Workers - Self-employed in own incorporated business (%)
Class of Workers - Private not-for-profit wage and salary workers (%)
Class of Workers - Local government workers (%)
Class of Workers - State government workers (%)
Class of Workers - Federal government workers (%)
Class of Workers - Self-employed workers in own not incorporated business and Unpaid family workers (%)
House heating fuel used in houses and condos - Utility gas (%)
House heating fuel used in houses and condos - Bottled, tank, or LP gas (%)
House heating fuel used in houses and condos - Electricity (%)
House heating fuel used in houses and condos - Fuel oil, kerosene, etc. (%)
House heating fuel used in houses and condos - Coal or coke (%)
House heating fuel used in houses and condos - Wood (%)
House heating fuel used in houses and condos - Solar energy (%)
House heating fuel used in houses and condos - Other fuel (%)
House heating fuel used in houses and condos - No fuel used (%)
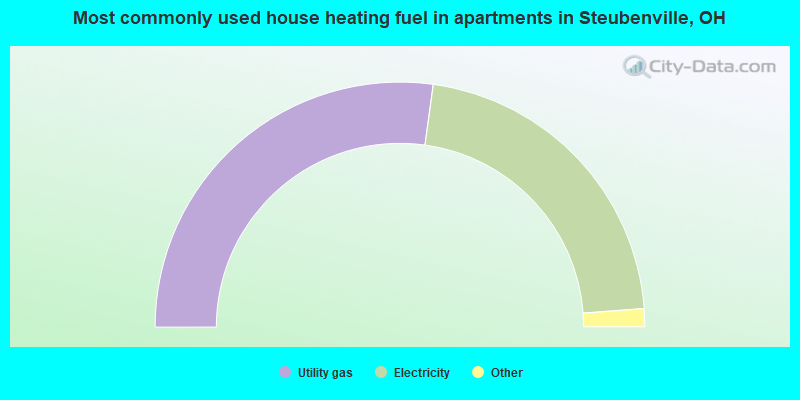
House heating fuel used in apartments - Utility gas (%)
House heating fuel used in apartments - Bottled, tank, or LP gas (%)
House heating fuel used in apartments - Electricity (%)
House heating fuel used in apartments - Fuel oil, kerosene, etc. (%)
House heating fuel used in apartments - Coal or coke (%)
House heating fuel used in apartments - Wood (%)
House heating fuel used in apartments - Solar energy (%)
House heating fuel used in apartments - Other fuel (%)
House heating fuel used in apartments - No fuel used (%)
Armed forces status - In Armed Forces (%)
Armed forces status - Civilian (%)
Armed forces status - Civilian - Veteran (%)
Armed forces status - Civilian - Nonveteran (%)
Fatal accidents locations in years 2005-2021
Fatal accidents locations in 2005
Fatal accidents locations in 2006
Fatal accidents locations in 2007
Fatal accidents locations in 2008
Fatal accidents locations in 2009
Fatal accidents locations in 2010
Fatal accidents locations in 2011
Fatal accidents locations in 2012
Fatal accidents locations in 2013
Fatal accidents locations in 2014
Fatal accidents locations in 2015
Fatal accidents locations in 2016
Fatal accidents locations in 2017
Fatal accidents locations in 2018
Fatal accidents locations in 2019
Fatal accidents locations in 2020
Fatal accidents locations in 2021
Alcohol use - People drinking some alcohol every month (%)
Alcohol use - People not drinking at all (%)
Alcohol use - Average days/month drinking alcohol
Alcohol use - Average drinks/week
Alcohol use - Average days/year people drink much
Audiometry - Average condition of hearing (%)
Audiometry - People that can hear a whisper from across a quiet room (%)
Audiometry - People that can hear normal voice from across a quiet room (%)
Audiometry - Ears ringing, roaring, buzzing (%)
Audiometry - Had a job exposure to loud noise (%)
Audiometry - Had off-work exposure to loud noise (%)
Blood Pressure & Cholesterol - Has high blood pressure (%)
Blood Pressure & Cholesterol - Checking blood pressure at home (%)
Blood Pressure & Cholesterol - Frequently checking blood cholesterol (%)
Blood Pressure & Cholesterol - Has high cholesterol level (%)
Consumer Behavior - Money monthly spent on food at supermarket/grocery store
Consumer Behavior - Money monthly spent on food at other stores
Consumer Behavior - Money monthly spent on eating out
Consumer Behavior - Money monthly spent on carryout/delivered foods
Consumer Behavior - Income spent on food at supermarket/grocery store (%)
Consumer Behavior - Income spent on food at other stores (%)
Consumer Behavior - Income spent on eating out (%)
Consumer Behavior - Income spent on carryout/delivered foods (%)
Current Health Status - General health condition (%)
Current Health Status - Blood donors (%)
Current Health Status - Has blood ever tested for HIV virus (%)
Current Health Status - Left-handed people (%)
Dermatology - People using sunscreen (%)
Diabetes - Diabetics (%)
Diabetes - Had a blood test for high blood sugar (%)
Diabetes - People taking insulin (%)
Diet Behavior & Nutrition - Diet health (%)
Diet Behavior & Nutrition - Milk product consumption (# of products/month)
Diet Behavior & Nutrition - Meals not home prepared (#/week)
Diet Behavior & Nutrition - Meals from fast food or pizza place (#/week)
Diet Behavior & Nutrition - Ready-to-eat foods (#/month)
Diet Behavior & Nutrition - Frozen meals/pizza (#/month)
Drug Use - People that ever used marijuana or hashish (%)
Drug Use - Ever used hard drugs (%)
Drug Use - Ever used any form of cocaine (%)
Drug Use - Ever used heroin (%)
Drug Use - Ever used methamphetamine (%)
Health Insurance - People covered by health insurance (%)
Kidney Conditions-Urology - Avg. # of times urinating at night
Medical Conditions - People with asthma (%)
Medical Conditions - People with anemia (%)
Medical Conditions - People with psoriasis (%)
Medical Conditions - People with overweight (%)
Medical Conditions - Elderly people having difficulties in thinking or remembering (%)
Medical Conditions - People who ever received blood transfusion (%)
Medical Conditions - People having trouble seeing even with glass/contacts (%)
Medical Conditions - People with arthritis (%)
Medical Conditions - People with gout (%)
Medical Conditions - People with congestive heart failure (%)
Medical Conditions - People with coronary heart disease (%)
Medical Conditions - People with angina pectoris (%)
Medical Conditions - People who ever had heart attack (%)
Medical Conditions - People who ever had stroke (%)
Medical Conditions - People with emphysema (%)
Medical Conditions - People with thyroid problem (%)
Medical Conditions - People with chronic bronchitis (%)
Medical Conditions - People with any liver condition (%)
Medical Conditions - People who ever had cancer or malignancy (%)
Mental Health - People who have little interest in doing things (%)
Mental Health - People feeling down, depressed, or hopeless (%)
Mental Health - People who have trouble sleeping or sleeping too much (%)
Mental Health - People feeling tired or having little energy (%)
Mental Health - People with poor appetite or overeating (%)
Mental Health - People feeling bad about themself (%)
Mental Health - People who have trouble concentrating on things (%)
Mental Health - People moving or speaking slowly or too fast (%)
Mental Health - People having thoughts they would be better off dead (%)
Oral Health - Average years since last visit a dentist
Oral Health - People embarrassed because of mouth (%)
Oral Health - People with gum disease (%)
Oral Health - General health of teeth and gums (%)
Oral Health - Average days a week using dental floss/device
Oral Health - Average days a week using mouthwash for dental problem
Oral Health - Average number of teeth
Pesticide Use - Households using pesticides to control insects (%)
Pesticide Use - Households using pesticides to kill weeds (%)
Physical Activity - People doing vigorous-intensity work activities (%)
Physical Activity - People doing moderate-intensity work activities (%)
Physical Activity - People walking or bicycling (%)
Physical Activity - People doing vigorous-intensity recreational activities (%)
Physical Activity - People doing moderate-intensity recreational activities (%)
Physical Activity - Average hours a day doing sedentary activities
Physical Activity - Average hours a day watching TV or videos
Physical Activity - Average hours a day using computer
Physical Functioning - People having limitations keeping them from working (%)
Physical Functioning - People limited in amount of work they can do (%)
Physical Functioning - People that need special equipment to walk (%)
Physical Functioning - People experiencing confusion/memory problems (%)
Physical Functioning - People requiring special healthcare equipment (%)
Prescription Medications - Average number of prescription medicines taking
Preventive Aspirin Use - Adults 40+ taking low-dose aspirin (%)
Reproductive Health - Vaginal deliveries (%)
Reproductive Health - Cesarean deliveries (%)
Reproductive Health - Deliveries resulted in a live birth (%)
Reproductive Health - Pregnancies resulted in a delivery (%)
Reproductive Health - Women breastfeeding newborns (%)
Reproductive Health - Women that had a hysterectomy (%)
Reproductive Health - Women that had both ovaries removed (%)
Reproductive Health - Women that have ever taken birth control pills (%)
Reproductive Health - Women taking birth control pills (%)
Reproductive Health - Women that have ever used Depo-Provera or injectables (%)
Reproductive Health - Women that have ever used female hormones (%)
Sexual Behavior - People 18+ that ever had sex (vaginal, anal, or oral) (%)
Sexual Behavior - Males 18+ that ever had vaginal sex with a woman (%)
Sexual Behavior - Males 18+ that ever performed oral sex on a woman (%)
Sexual Behavior - Males 18+ that ever had anal sex with a woman (%)
Sexual Behavior - Males 18+ that ever had any sex with a man (%)
Sexual Behavior - Females 18+ that ever had vaginal sex with a man (%)
Sexual Behavior - Females 18+ that ever performed oral sex on a man (%)
Sexual Behavior - Females 18+ that ever had anal sex with a man (%)
Sexual Behavior - Females 18+ that ever had any kind of sex with a woman (%)
Sexual Behavior - Average age people first had sex
Sexual Behavior - Average number of female sex partners in lifetime (males 18+)
Sexual Behavior - Average number of female vaginal sex partners in lifetime (males 18+)
Sexual Behavior - Average age people first performed oral sex on a woman (18+)
Sexual Behavior - Average number of woman performed oral sex on in lifetime (18+)
Sexual Behavior - Average number of male sex partners in lifetime (males 18+)
Sexual Behavior - Average number of male anal sex partners in lifetime (males 18+)
Sexual Behavior - Average age people first performed oral sex on a man (18+)
Sexual Behavior - Average number of male oral sex partners in lifetime (18+)
Sexual Behavior - People using protection when performing oral sex (%)
Sexual Behavior - Average number of times people have vaginal or anal sex a year
Sexual Behavior - People having sex without condom (%)
Sexual Behavior - Average number of male sex partners in lifetime (females 18+)
Sexual Behavior - Average number of male vaginal sex partners in lifetime (females 18+)
Sexual Behavior - Average number of female sex partners in lifetime (females 18+)
Sexual Behavior - Circumcised males 18+ (%)
Sleep Disorders - Average hours sleeping at night
Sleep Disorders - People that has trouble sleeping (%)
Smoking-Cigarette Use - People smoking cigarettes (%)
Taste & Smell - People 40+ having problems with smell (%)
Taste & Smell - People 40+ having problems with taste (%)
Taste & Smell - People 40+ that ever had wisdom teeth removed (%)
Taste & Smell - People 40+ that ever had tonsils teeth removed (%)
Taste & Smell - People 40+ that ever had a loss of consciousness because of a head injury (%)
Taste & Smell - People 40+ that ever had a broken nose or other serious injury to face or skull (%)
Taste & Smell - People 40+ that ever had two or more sinus infections (%)
Weight - Average height (inches)
Weight - Average weight (pounds)
Weight - Average BMI
Weight - People that are obese (%)
Weight - People that ever were obese (%)
Weight - People trying to lose weight (%)
According to our research of Ohio and other state lists, there were 35 registered sex offenders living in Steubenville, Ohio as of June 16, 2024 . The ratio of all residents to sex offenders in Steubenville is 524 to 1.The ratio of registered sex offenders to all residents in this city is near the state average.
Officers per 1,000 residents here:
2.23Ohio average:
2.31
Latest news from Steubenville, OH collected exclusively by city-data.com from local newspapers, TV, and radio stations
Ancestries: Italian (17.7%), African (16.2%), Irish (10.6%), German (8.6%), Polish (5.3%), European (3.3%).
Current Local Time:
Land area: 10.3 square miles.
Population density: 1,747 people per square mile (low).
550 residents are foreign born (1.3% Asia , 0.9% Europe , 0.6% Latin America ).
Median real estate property taxes paid for housing units with mortgages in 2022: $1,387 (0.9%)Median real estate property taxes paid for housing units with no mortgage in 2022: $1,011 (1.0%)
Nearest city with pop. 50,000+: Pittsburgh, PA
Nearest city with pop. 1,000,000+: Philadelphia, PA
Nearest cities:
Latitude: 40.37 N, Longitude: 80.63 W
Daytime population change due to commuting: +3,551 (+19.6%)Workers who live and work in this city: 4,808 (62.2%)
Single-family new house construction building permits:
2020: 1 building , cost: $231,0002018: 2 buildings , average cost: $391,3002017: 2 buildings , average cost: $391,3002016: 4 buildings , average cost: $208,0002015: 4 buildings , average cost: $208,0002014: 2 buildings , average cost: $235,0002013: 2 buildings , average cost: $235,0002012: 1 building , cost: $263,2002011: 1 building , cost: $247,0002010: 2 buildings , average cost: $247,0002009: 7 buildings , average cost: $211,2002008: 3 buildings , average cost: $188,5002007: 5 buildings , average cost: $188,5002006: 3 buildings , average cost: $126,8002005: 4 buildings , average cost: $126,8002004: 14 buildings , average cost: $100,8002003: 9 buildings , average cost: $85,5002002: 26 buildings , average cost: $69,9002001: 24 buildings , average cost: $69,9002000: 25 buildings , average cost: $69,9001999: 16 buildings , average cost: $93,3001998: 11 buildings , average cost: $109,9001997: 10 buildings , average cost: $109,900Unemployment in December 2023:
Most common occupations in Steubenville, OH (%)
Both Males Females
Other management occupations, except farmers and farm managers (5.2%)
Other sales and related occupations, including supervisors (5.0%)
Building and grounds cleaning and maintenance occupations (4.0%)
Registered nurses (4.0%)
Other production occupations, including supervisors (3.8%)
Material recording, scheduling, dispatching, and distributing workers (3.4%)
Preschool, kindergarten, elementary, and middle school teachers (3.4%)
Other production occupations, including supervisors (6.7%)
Laborers and material movers, hand (5.3%)
Material recording, scheduling, dispatching, and distributing workers (4.8%)
Other management occupations, except farmers and farm managers (4.7%)
Building and grounds cleaning and maintenance occupations (4.3%)
Law enforcement workers, including supervisors (4.0%)
Other sales and related occupations, including supervisors (3.9%)
Registered nurses (7.5%)
Other sales and related occupations, including supervisors (6.2%)
Preschool, kindergarten, elementary, and middle school teachers (5.7%)
Other management occupations, except farmers and farm managers (5.7%)
Nursing, psychiatric, and home health aides (5.1%)
Secretaries and administrative assistants (4.9%)
Other office and administrative support workers, including supervisors (4.3%)
Tornado activity:
Steubenville-area historical tornado activity is below Ohio state average. It is 19% smaller than the overall U.S. average.
On 5/8/1969, a category F3 (max. wind speeds 158-206 mph) tornado 30.3 miles away from the Steubenville city center killed one person and injured 14 people and caused between $50,000 and $500,000 in damages.
On 5/31/1985, a category F3 tornado 32.6 miles away from the city center killed 9 people and injured 120 people and caused between $5,000,000 and $50,000,000 in damages.
Earthquake activity:
Steubenville-area historical earthquake activity is significantly above Ohio state average. It is 50% smaller than the overall U.S. average. On 9/25/1998 at 19:52:52, a magnitude 5.2 (4.8 MB, 4.3 MS, 5.2 LG, 4.5 MW, Depth: 3.1 mi, Class: Moderate, Intensity: VI - VII) earthquake occurred 78.8 miles away from Steubenville center On 8/23/2011 at 17:51:04, a magnitude 5.8 (5.8 MW, Depth: 3.7 mi) earthquake occurred 223.0 miles away from Steubenville center On 1/31/1986 at 16:46:43, a magnitude 5.0 (5.0 MB) earthquake occurred 89.9 miles away from Steubenville center On 7/27/1980 at 18:52:21, a magnitude 5.2 (5.1 MB, 4.7 MS, 5.0 UK, 5.2 UK) earthquake occurred 231.8 miles away from the city center On 12/31/2011 at 20:05:01, a magnitude 4.0 (4.0 ML, Depth: 3.1 mi, Class: Light, Intensity: IV - V) earthquake occurred 52.4 miles away from the city center On 8/9/2020 at 12:07:37, a magnitude 5.1 (5.1 MW, Depth: 4.7 mi) earthquake occurred 270.2 miles away from Steubenville center Magnitude types: regional Lg-wave magnitude (LG), body-wave magnitude (MB), local magnitude (ML), surface-wave magnitude (MS), moment magnitude (MW) Natural disasters: The number of natural disasters in Jefferson County (20) is greater than the US average (15).Major Disasters (Presidential) Declared: 14Emergencies Declared: 3Floods: 14, Storms: 12, Tornadoes: 5, Landslides: 3, Mudslides: 3, Snowstorms: 2, Winds: 2, Blizzard: 1, Heavy Rain: 1, Hurricane: 1, Tropical Storm: 1, Winter Storm: 1, Other: 1 (Note: some incidents may be assigned to more than one category). Hospitals in Steubenville: ACUITY SPECIALTY HOSPITAL - OHIO VALLEY, LP (provides emergency services, 380 SUMMIT AVENUE) SHAFFER PLAZA C (256 JOHN SCOTT HIGHWAY) ST JOHN MEDICAL CENTER (ST JOHN HEIGHTS) TRINITY MEDICAL CTR EAST &TRINITY MEDICAL CTR WEST (Voluntary non-profit - Other, 380 SUMMIT AVENUE) Nursing Homes in Steubenville: CARRIAGE INN OF STEUBENVILLE (3102 ST CHARLES DRIVE) CATHERINE'S CARE CENTER, INC (717 NORTH SIXTH STREET) LABELLE VIEW NURSING CENTER (1336 MARYLAND AVENUE) LANCIA VILLA ROYALE (1852 SINCLAIR AVENUE) LAURELS OF STEUBENVILLE THE (500 STANTON BOULEVARD) RIVERVIEW NURSING HOME (925 NORTH FOURTH STREET) STEUBENVILLE CONVALESCENT CENTER INC (717 NORTH SIXTH STREET) STEUBENVILLE COUNTRY CLUB MANOR (575 LOVERS LANE) TRINITY SKILLED CARE CENTER (380 SUMMIT AVENUE) Dialysis Facilities in Steubenville: DAVITA - STEUBENVILLE DIALYSIS (4000 JOHNSON ROAD) DIALYSIS CLINIC INC. (4227 MALL DRIVE) Home Health Centers in Steubenville: TRINITY HOME HEALTH (4000 JOHNSON ROAD)
Colleges/Universities in Steubenville: Franciscan University of Steubenville Full-time enrollment: 2,572; Location: 1235 University Blvd; Private, not-for-profit; Website: www.franciscan.edu; Offers Master's degree )
Eastern Gateway Community College Full-time enrollment: 1,841; Location: 4000 Sunset Blvd; Public; Website: www.egcc.edu)
Trinity Health System School of Nursing Full-time enrollment: 135; Location: 380 Summit Ave; Private, not-for-profit; Website: www.trinityson.com)
Other colleges/universities with over 2000 students near Steubenville:
West Liberty University (about 15 miles; West Liberty, WV ; Full-time enrollment: 2,728)
Pittsburgh Technical Institute (about 24 miles; Oakdale, PA ; FT enrollment: 2,805)
Robert Morris University (about 25 miles; Moon Township, PA ; FT enrollment: 4,823)
Community College of Allegheny County (about 33 miles; Pittsburgh, PA ; FT enrollment: 13,486)
Point Park University (about 34 miles; Pittsburgh, PA ; FT enrollment: 3,525)
Duquesne University (about 34 miles; Pittsburgh, PA ; FT enrollment: 8,211)
The Art Institute of Pittsburgh-Online Division (about 35 miles; Pittsburgh, PA ; FT enrollment: 11,040)
Public high school in Steubenville:
Private high school in Steubenville: CATHOLIC CENTRAL HIGH SCHOOL Students: 263, Location: 320 WESTVIEW AVE, Grades: 9-12)
Public elementary/middle schools in Steubenville:
Private elementary/middle schools in Steubenville: BISHOP JOHN KING MUSSIO ELEM SCHOOL - ROSEMONT Students: 389, Location: 100 ETTA AVE, Grades: PK-6)
BISHOP JOHN KING MUSSIO CENTRAL JUNIOR HIGH SCHOOL Students: 133, Location: 320 W VIEW AVE STE 2, Grades: 7-8)
See full list of schools located in Steubenville Library in Steubenville: STEUBENVILLE & JEFFERSON COUNTY, PL OF Operating income: $3,138,382; Location: 407 S. 4TH ST.; 163,334 books ; 5,516 e-books ; 3,766 audio materials ; 20,819 video materials ; 9 local licensed databases ; 266 state licensed databases ; 193 print serial subscriptions ; 12 electronic serial subscriptions )
User-submitted facts and corrections:
Steubenville is the birthplace of Dean Martin, and celebrates a Dean Martin Festival in June of each year. Edwin M. Stanton, Secretary of War to President Abraham Lincoln was born in Steubenville.
Notable locations in Steubenville: (A) , Harding Stadium (B) , Ambulance Service (C) , John Paul II Library (D) , Schiappa Memorial Library (E) , Saint John Community Arena (F) , Steubenville and Jefferson County Public Library (G) , Steubenville City Hall (H) , Jefferson County Courthouse (I) , Jefferson County Historical Association Museum (J) , McCollough Childrens Home (K) , Steubenville Fire Department North Street Station (L) , Steubenville Fire Department Adams Street Station (M) , Steubenville Fire Department West End Station (N) , Trinity Hall (O) , Starvaggi Hall (P) , Saints Cosmos and Damian Science Hall (Q) , Saint Thomas Moore Hall (R) , Saint Joseph Center (S) , Saint Francis Hall (T) . Display/hide their locations on the map
Shopping Centers: (1) , Hollywood Shopping Center (2) . Display/hide their locations on the map
Churches in Steubenville include: (A) , Calvary United Methodist Church (B) , Church of the United Brethren in Christ (C) , Emmanuel Church of Christ in Christ (D) , Fifth Street United Methodist Church (E) , First Baptist Church of Steubenville (F) , First Christian Church (G) , First Church of the Nazarene (H) , First Westminster Presbyterian Church (I) . Display/hide their locations on the map
Cemeteries: (1) , Union Cemetery (2) , Holy Resurrection Cemetery (3) , Mount Calvary Cemetery (4) . Display/hide their locations on the map
Streams, rivers, and creeks: (A) , Permars Run (B) . Display/hide their locations on the map
Parks in Steubenville include: (1) , Steubenville Commercial Historic District (2) , Fort Steuben Historical Site (3) , Beatty Park Number 1 (4) , Beatty Park Number 2 (5) , Vaccaro Baseball Field (6) . Display/hide their locations on the map
Tourist attractions:
Hotel:
Courts:
Birthplace of: Traci Lords - (born 1968), ex-porn actress, Rollie Fingers - Baseball player, Richard C. Banks - Ornithologist, Edwin M. Stanton - Politician, Dean Martin - Singer, Weldy Walker - Major League Baseball player, Daniel DiNardo - Catholic cardinal, Mary Tappan Wright - Novelist, Martin and Lewis - Comedian, Eric Piatkowski - NBA player (Chicago Bulls, born : Sep 30, 1970).
Jefferson County has a predicted average indoor radon screening level greater than 4 pCi/L (pico curies per liter) - Highest Potential Average household size: This city:
2.2 peopleOhio:
2.4 people
Percentage of family households: This city:
55.9%Whole state:
65.0%
Percentage of households with unmarried partners: This city:
6.5%Whole state:
6.8%
Likely homosexual households (counted as self-reported same-sex unmarried-partner households)
Lesbian couples: 0.3% of all households Gay men: 0.2% of all households
People in group quarters in Steubenville in 2010:
1,312 people in college/university student housing
327 people in nursing facilities/skilled-nursing facilities
78 people in emergency and transitional shelters (with sleeping facilities) for people experiencing homelessness
52 people in local jails and other municipal confinement facilities
28 people in correctional facilities intended for juveniles
23 people in workers' group living quarters and job corps centers
22 people in other noninstitutional facilities
20 people in group homes intended for adults
4 people in group homes for juveniles (non-correctional)
People in group quarters in Steubenville in 2000:
319 people in nursing homes
148 people in local jails and other confinement facilities (including police lockups)
50 people in job corps and vocational training facilities
48 people in other noninstitutional group quarters
45 people in homes for the mentally ill
39 people in homes for the mentally retarded
32 people in other group homes
23 people in other nonhousehold living situations
2 people in college dormitories (includes college quarters off campus)
2 people in religious group quarters
Arena or stadium:
St. John Arena (Steubenville). Capacity: 5,400.
Banks with branches in Steubenville (2011 data):
PNC Bank, National Association: Drive-In Branch, Sunset Boulevard Branch, Steubenville Branch. Info updated 2012/03/20: Bank assets: $263,309.6 mil, Deposits: $197,343.0 mil, headquarters in Wilmington, DE, positive income , Commercial Lending Specialization, 3085 total offices , Holding Company: Pnc Financial Services Group, Inc., The
The Huntington National Bank: Steubenville at 100 North Fourth Street, branch established on 1985/05/18; Hollywood Branch at 325 South Hollywood Blvd, branch established on 1971/02/08. Info updated 2012/04/02: Bank assets: $54,183.4 mil, Deposits: $44,300.3 mil, headquarters in Columbus, OH, positive income , Commercial Lending Specialization, 878 total offices , Holding Company: Huntington Bancshares Incorporated
JPMorgan Chase Bank, National Association: Steubenville Branch at 401 Market Street, branch established on 1996/01/01; North Fourth Street Drive-In Branch at 238-240 North Fourth Street, branch established on 1972/12/01. Info updated 2011/11/10: Bank assets: $1,811,678.0 mil, Deposits: $1,190,738.0 mil, headquarters in Columbus, OH, positive income , International Specialization, 5577 total offices , Holding Company: Jpmorgan Chase & Co.
Wesbanco Bank, Inc.: Ft. Steuben Mall Branch at 100 Mall Drive, branch established on 1984/03/30. Info updated 2009/04/02: Bank assets: $5,520.2 mil, Deposits: $4,394.5 mil, headquarters in Wheeling, WV, positive income , Commercial Lending Specialization, 115 total offices , Holding Company: Wesbanco, Inc.
First National Bank of Pennsylvania: Hollywood Plaza Branch at 125 Stanton Blvd, branch established on 2002/09/18. Info updated 2012/01/10: Bank assets: $9,581.0 mil, Deposits: $7,462.2 mil, headquarters in Greenville, PA, positive income , Commercial Lending Specialization, 291 total offices , Holding Company: F.N.b. Corporation
For population 15 years and over in Steubenville:
Never married: 44.0%Now married: 34.7%Separated: 1.6%Widowed: 7.0%Divorced: 12.7% For population 25 years and over in Steubenville:
High school or higher: 91.8%Bachelor's degree or higher: 28.4%Graduate or professional degree: 12.9%Unemployed: 9.8%Mean travel time to work (commute): 15.9 minutes
Education Gini index (Inequality in education) Here:
11.0Ohio average:
11.0
Religion statistics for Steubenville, OH (based on Jefferson County data)
Religion Adherents Congregations Catholic 13,851 16 Mainline Protestant 10,273 71 Evangelical Protestant 5,548 49 Orthodox 1,089 5 Black Protestant 796 7 Other 612 5 None 37,540 -
Source: Clifford Grammich, Kirk Hadaway, Richard Houseal, Dale E.Jones, Alexei Krindatch, Richie Stanley and Richard H.Taylor. 2012. 2010 U.S.Religion Census: Religious Congregations & Membership Study. Association of Statisticians of American Religious Bodies. Jones, Dale E., et al. 2002. Congregations and Membership in the United States 2000. Nashville, TN: Glenmary Research Center. Graphs represent county-level data
Food Environment Statistics: Number of grocery stores : 21Jefferson County :
3.05 / 10,000 pop.Ohio :
1.89 / 10,000 pop.
Number of supercenters and club stores : 1This county :
0.15 / 10,000 pop.Ohio :
0.13 / 10,000 pop.
Number of convenience stores (no gas) : 13Here :
1.89 / 10,000 pop.State :
1.25 / 10,000 pop.
Number of convenience stores (with gas) : 24Here :
3.49 / 10,000 pop.Ohio :
2.93 / 10,000 pop.
Number of full-service restaurants : 54Here :
7.85 / 10,000 pop.Ohio :
6.25 / 10,000 pop.
Adult diabetes rate : This county :
12.4%Ohio :
10.3%
Adult obesity rate : This county :
30.8%Ohio :
29.1%
Low-income preschool obesity rate : This county :
10.4%Ohio :
11.9%
Health and Nutrition: Healthy diet rate : Steubenville:
51.0%Ohio:
50.4%
Average overall health of teeth and gums : Steubenville:
47.6%State:
47.8%
Average BMI : Steubenville:
28.8Ohio:
28.7
People feeling badly about themselves : People not drinking alcohol at all : Steubenville:
12.0%State:
10.4%
Average hours sleeping at night : Overweight people : Steubenville:
35.2%Ohio:
34.3%
General health condition : This city:
55.3%State:
57.0%
Average condition of hearing : This city:
77.1%State:
79.1%
More about Health and Nutrition of Steubenville, OH Residents
Local government employment and payroll (March 2022)
Function
Full-time employees
Monthly full-time payroll
Average yearly full-time wage
Part-time employees
Monthly part-time payroll
Firefighters
40 $212,113 $63,634 0 $0 Police Protection - Officers
38 $206,489 $65,207 0 $0 Water Supply
20 $145,986 $87,592 0 $0 Streets and Highways
17 $87,141 $61,511 0 $0 Sewerage
17 $75,377 $53,207 0 $0 Judicial and Legal
13 $49,742 $45,916 2 $4,141 Financial Administration
12 $51,327 $51,327 0 $0 Solid Waste Management
11 $41,153 $44,894 0 $0 Parks and Recreation
7 $22,962 $39,363 3 $2,662 Other Government Administration
7 $14,781 $25,339 8 $3,631 Police - Other
5 $18,170 $43,608 0 $0 Other and Unallocable
3 $18,013 $72,052 1 $1,423 Housing and Community Development (Local)
1 $4,154 $49,848 0 $0
Totals for Government
191 $947,407 $59,523 14 $11,857
Steubenville government finances - Expenditure in 2018 (per resident):
Construction - Sewerage: $3,344,000 ($185.47)
Current Operations - Sewerage: $4,588,000 ($254.46)
Police Protection: $4,223,000 ($234.22)Local Fire Protection: $3,499,000 ($194.07)Water Utilities: $2,821,000 ($156.46)Financial Administration: $2,531,000 ($140.38)Regular Highways: $2,053,000 ($113.87)Solid Waste Management: $1,555,000 ($86.25)Judicial and Legal Services: $993,000 ($55.07)Housing and Community Development: $962,000 ($53.36)Health - Other: $678,000 ($37.60)Parks and Recreation: $495,000 ($27.45)General Public Buildings: $433,000 ($24.02)Central Staff Services: $410,000 ($22.74)General - Other: $363,000 ($20.13)Public Welfare - Other: $13,000 ($0.72)General - Interest on Debt: $2,021,000 ($112.09)
Intergovernmental to State - Sewerage: $1,880,000 ($104.27)
General - Other: $50,000 ($2.77)Other Capital Outlay - Housing and Community Development: $1,059,000 ($58.74)
Solid Waste Management: $710,000 ($39.38)Regular Highways: $659,000 ($36.55)Water Utilities: $516,000 ($28.62)General - Other: $253,000 ($14.03)Parks and Recreation: $186,000 ($10.32)Judicial and Legal Services: $31,000 ($1.72)Financial Administration: $1,000 ($0.06)Total Salaries and Wages: $13,883,000 ($769.99)
Water Utilities - Interest on Debt: $1,078,000 ($59.79)
Steubenville government finances - Revenue in 2018 (per resident):
Charges - Sewerage: $4,491,000 ($249.08)
Solid Waste Management: $2,360,000 ($130.89)Other: $51,000 ($2.83)Parks and Recreation: $9,000 ($0.50)Federal Intergovernmental - Housing and Community Development: $586,000 ($32.50)
Miscellaneous - Interest Earnings: $2,426,000 ($134.55)
General Revenue - Other: $824,000 ($45.70)Fines and Forfeits: $639,000 ($35.44)Rents: $205,000 ($11.37)Donations From Private Sources: $78,000 ($4.33)Special Assessments: $47,000 ($2.61)Sale of Property: $11,000 ($0.61)Revenue - Water Utilities: $5,522,000 ($306.27)
State Intergovernmental - Sewerage: $3,073,000 ($170.44)
General Local Government Support: $1,308,000 ($72.55)Housing and Community Development: $1,190,000 ($66.00)Highways: $903,000 ($50.08)Other: $140,000 ($7.76)Tax - Individual Income: $12,038,000 ($667.67)
Property: $1,838,000 ($101.94)Other License: $1,282,000 ($71.10)Other Selective Sales: $99,000 ($5.49)
Steubenville government finances - Debt in 2018 (per resident):
Long Term Debt - Beginning Outstanding - Public Debt for Private Purpose: $34,985,000 ($1940.38)
Outstanding Nonguaranteed - Industrial Revenue: $33,460,000 ($1855.80)Beginning Outstanding - Unspecified Public Purpose: $5,094,000 ($282.53)Outstanding Unspecified Public Purpose: $4,620,000 ($256.24)Retired Nonguaranteed - Public Debt for Private Purpose: $1,525,000 ($84.58)Retired Unspecified Public Purpose: $474,000 ($26.29)
Steubenville government finances - Cash and Securities in 2018 (per resident):
Bond Funds - Cash and Securities: $3,784,000 ($209.87)
Other Funds - Cash and Securities: $17,295,000 ($959.23)
Sinking Funds - Cash and Securities: $45,436,000 ($2520.02)
Businesses in Steubenville, OH
Name Count Name Count
AT&T 2 Macy's 1 Advance Auto Parts 1 MasterBrand Cabinets 3 Applebee's 1 McDonald's 1 AutoZone 1 Motherhood Maternity 1 Bath & Body Works 1 Nike 6 Best Western 1 OfficeMax 1 CVS 1 Papa John's Pizza 1 Circle K 1 Payless 1 Cold Stone Creamery 1 Pizza Hut 1 Cricket Wireless 1 Quiznos 1 Dairy Queen 1 RadioShack 1 Decora Cabinetry 2 Rite Aid 2 Domino's Pizza 1 Sears 2 Fashion Bug 1 Subway 2 FedEx 4 Super 8 1 GNC 1 T-Mobile 2 GameStop 1 Taco Bell 1 H&R Block 2 Tim Hortons 1 Hilton 1 Toyota 1 Honda 1 Toys"R"Us 1 JCPenney 1 True Value 1 Jones New York 1 U-Haul 1 KFC 1 UPS 5 Kmart 1 Vans 1 Kroger 1 Verizon Wireless 1 Lane Furniture 2 Volkswagen 1 Long John Silver's 1 Walmart 1 Lowe's 1 Wendy's 1
Strongest AM radio stations in Steubenville:
WSTV (1340 AM; 1 kW; STEUBENVILLE, OH; Owner: KEYMARKET LICENSES, LLC)
WWVA (1170 AM; 53 kW; WHEELING, WV; Owner: CAPSTAR TX LIMITED PARTNERSHIP)
KDKA (1020 AM; 50 kW; PITTSBURGH, PA; Owner: INFINITY BROADCASTING OPERATIONS, INC.)
WDIG (950 AM; 1 kW; STEUBENVILLE, OH; Owner: WORLD WITNESS FOR CHRIST MINIST.,INC)
WEIR (1430 AM; 1 kW; WEIRTON, WV)
WWCS (540 AM; 5 kW; CANONSBURG, PA; Owner: BIRACH BROADCASTING CORPORATION)
WKKX (1600 AM; 5 kW; WHEELING, WV; Owner: SCOTT RADIO GROUP, LLC)
WKNR (850 AM; 50 kW; CLEVELAND, OH; Owner: CARON BROADCASTING, INC.)
WTAM (1100 AM; 50 kW; CLEVELAND, OH; Owner: JACOR BROADCASTING CORPORATION)
WHK (1220 AM; 50 kW; CLEVELAND, OH; Owner: CARON BROADCASTING, INC.)
WPIT (730 AM; 5 kW; PITTSBURGH, PA; Owner: PENNSYLVANIA MEDIA ASSOCIATES, INC.)
WTVN (610 AM; 50 kW; COLUMBUS, OH; Owner: CITICASTERS LICENSES, L.P.)
WKBN (570 AM; 5 kW; YOUNGSTOWN, OH; Owner: CITICASTERS LICENSES, L.P.)
Strongest FM radio stations in Steubenville:
WOGH (103.5 FM; BURGETTSTOWN, PA; Owner: KEYMARKET LICENSES, LLC)
W215BC (90.9 FM; STEUBENVILLE, OH; Owner: PENSACOLA CHRISTIAN COLLEGE, INC.)
WBJV (88.9 FM; STEUBENVILLE, OH; Owner: AMERICAN FAMILY ASSOCIATION)
WVNP (89.9 FM; WHEELING, WV; Owner: WEST VIRGINIA EDUCATIONAL BROADCASTING AUTHORITY)
WVBC (88.1 FM; BETHANY, WV; Owner: BETHANY COLLEGE)
WOVK (98.7 FM; WHEELING, WV; Owner: CAPSTAR TX LIMITED PARTNERSHIP)
WEGW (107.5 FM; WHEELING, WV; Owner: CAPSTAR TX LIMITED PARTNERSHIP)
WOGF (104.3 FM; EAST LIVERPOOL, OH; Owner: KEYMARKET LICENSES, LLC)
WEEL (95.7 FM; SHADYSIDE, OH; Owner: OHIO VALLEY COMMUNICATIONS, INC.)
WCDK (106.3 FM; CADIZ, OH; Owner: PRIORITY COMMUNICATIONS OHIO, LLC)
WSHH (99.7 FM; PITTSBURGH, PA; Owner: RENDA B/CING CORP. OF NEVADA)
WKWK-FM (97.3 FM; WHEELING, WV; Owner: CAPSTAR TX LIMITED PARTNERSHIP)
WLTJ (92.9 FM; PITTSBURGH, PA; Owner: WPNT, INC.)
WMXY (98.9 FM; YOUNGSTOWN, OH; Owner: CITICASTERS LICENSES, L.P.)
WDVE (102.5 FM; PITTSBURGH, PA; Owner: CAPSTAR TX LIMITED PARTNERSHIP)
WJJJ (104.7 FM; PITTSBURGH, PA; Owner: CAPSTAR TX LIMITED PARTNERSHIP)
WWSW-FM (94.5 FM; PITTSBURGH, PA; Owner: AMFM RADIO LICENSES, L.L.C.)
WDSY-FM (107.9 FM; PITTSBURGH, PA; Owner: INFINITY RADIO SUBSIDIARY OPERATIONS INC.)
WOMP-FM (100.5 FM; BELLAIRE, OH; Owner: KEYMARKET LICENSES, LLC)
WVKF (105.5 FM; BETHLEHEM, WV; Owner: CAPSTAR TX LIMITED PARTNERSHIP)
TV broadcast stations around Steubenville:
W25CI (Channel 25; STEUBENVILLE, OH; Owner: ABACUS TELEVISION)
W57BH (Channel 57; WEIRTON, WV; Owner: TURNPIKE TELEVISION)
WTOV-TV (Channel 9; STEUBENVILLE, OH; Owner: WTOV-TV HOLDINGS, INC.)
WTRF-TV (Channel 7; WHEELING, WV; Owner: WEST VIRGINIA MEDIA HOLDINGS, LLC)
WPXI (Channel 11; PITTSBURGH, PA; Owner: WPXI-TV HOLDINGS, INC.)
WOUC-TV (Channel 44; CAMBRIDGE, OH; Owner: OHIO UNIVERSITY)
WKBN-TV (Channel 27; YOUNGSTOWN, OH; Owner: PIEDMONT TELEVISION OF YOUNGSTOWN LICENSE LLC)
KDKA-TV (Channel 2; PITTSBURGH, PA; Owner: CBS BROADCASTING INC.)
WBGN-LP (Channel 59; PITTSBURGH, PA; Owner: BRUNO GOODWORTH NETWORK, INC.)
WPTG-LP (Channel 69; PITTSBURGH, PA; Owner: ABACUS TELEVISION)
WQEX (Channel 16; PITTSBURGH, PA; Owner: WQED MULTIMEDIA)
WTAE-TV (Channel 4; PITTSBURGH, PA; Owner: WTAE HEARST-ARGYLE TV, INC. (CA CORP.))
W65CG (Channel 65; PITTSBURGH, PA; Owner: TRINITY BROADCASTING NETWORK)
WPGH-TV (Channel 53; PITTSBURGH, PA; Owner: WPGH LICENSEE, LLC)
W66BQ (Channel 66; BEAVER, PA; Owner: BRUNO-GOODWORTH NETWORK, INC.)
WBPA-LP (Channel 29; PITTSBURGH, PA; Owner: VENTURE TECHNOLOGIES GROUP, LLC)
W28AS (Channel 28; BRIDGEPORT, OH; Owner: TURNPIKE TELEVISION)
W56DX (Channel 56; WHEELING,ETC., WV; Owner: ABACUS TELEVISION)
Medal of Honor Recipients
Medal of Honor Recipient born in Steubenville: William H. Surles.
National Bridge Inventory (NBI) Statistics 42 Number of bridges751ft / 229m Total length $448,143,000 Total costs442,573 Total average daily traffic40,570 Total average daily truck traffic
New bridges - historical statistics
3 1900-1909 1 1920-1929 2 1930-1939 1 1950-1959 4 1960-1969 8 1970-1979 19 1990-1999 4 2010-2019
See full National Bridge Inventory statistics for Steubenville, OH
Home Mortgage Disclosure Act Aggregated Statistics For Year 2009(Based on 5 full and 4 partial tracts) A) FHA, FSA/RHS & VA B) Conventional C) Refinancings D) Home Improvement Loans F) Non-occupant Loans on G) Loans On Manufactured Number Average Value Number Average Value Number Average Value Number Average Value Number Average Value Number Average Value
LOANS ORIGINATED 39 $78,920 31 $83,202 119 $100,508 18 $34,736 16 $44,291 0 $0 APPLICATIONS APPROVED, NOT ACCEPTED 1 $89,820 2 $50,785 10 $117,648 3 $9,323 1 $45,000 1 $56,570 APPLICATIONS DENIED 11 $71,265 2 $45,320 73 $79,462 18 $31,032 4 $42,552 0 $0 APPLICATIONS WITHDRAWN 2 $106,250 1 $151,760 24 $76,380 2 $25,435 0 $0 0 $0 FILES CLOSED FOR INCOMPLETENESS 1 $23,480 0 $0 8 $88,432 2 $75,410 0 $0 0 $0
Aggregated Statistics For Year 2008(Based on 5 full and 4 partial tracts) A) FHA, FSA/RHS & VA B) Conventional C) Refinancings D) Home Improvement Loans E) Loans on Dwellings For 5+ Families F) Non-occupant Loans on G) Loans On Manufactured Number Average Value Number Average Value Number Average Value Number Average Value Number Average Value Number Average Value Number Average Value
LOANS ORIGINATED 32 $89,824 68 $87,492 111 $86,671 26 $27,475 1 $397,710 27 $58,354 0 $0 APPLICATIONS APPROVED, NOT ACCEPTED 3 $74,570 6 $102,563 27 $61,959 2 $85,130 1 $319,000 4 $34,338 0 $0 APPLICATIONS DENIED 8 $69,588 15 $85,295 103 $75,262 25 $24,562 0 $0 14 $73,700 1 $67,790 APPLICATIONS WITHDRAWN 2 $43,535 4 $106,610 33 $108,749 4 $84,652 0 $0 0 $0 0 $0 FILES CLOSED FOR INCOMPLETENESS 3 $78,733 12 $64,163 13 $95,383 1 $26,350 0 $0 2 $36,960 0 $0
Aggregated Statistics For Year 2007(Based on 5 full and 4 partial tracts) A) FHA, FSA/RHS & VA B) Conventional C) Refinancings D) Home Improvement Loans E) Loans on Dwellings For 5+ Families F) Non-occupant Loans on G) Loans On Manufactured Number Average Value Number Average Value Number Average Value Number Average Value Number Average Value Number Average Value Number Average Value
LOANS ORIGINATED 16 $71,666 156 $80,326 145 $75,458 55 $31,315 3 $93,083 51 $59,839 3 $24,813 APPLICATIONS APPROVED, NOT ACCEPTED 1 $47,900 17 $62,010 37 $66,751 10 $29,733 1 $243,670 3 $40,967 2 $16,365 APPLICATIONS DENIED 1 $84,000 50 $63,125 163 $78,111 92 $42,931 0 $0 33 $69,266 7 $34,121 APPLICATIONS WITHDRAWN 0 $0 29 $65,424 55 $110,686 9 $79,006 1 $213,210 7 $49,076 0 $0 FILES CLOSED FOR INCOMPLETENESS 0 $0 7 $83,946 15 $116,488 0 $0 2 $127,535 4 $112,875 0 $0
Aggregated Statistics For Year 2006(Based on 5 full and 4 partial tracts) A) FHA, FSA/RHS & VA B) Conventional C) Refinancings D) Home Improvement Loans F) Non-occupant Loans on G) Loans On Manufactured Number Average Value Number Average Value Number Average Value Number Average Value Number Average Value Number Average Value
LOANS ORIGINATED 10 $80,644 136 $84,040 223 $75,977 67 $25,433 74 $47,131 2 $16,260 APPLICATIONS APPROVED, NOT ACCEPTED 2 $40,150 8 $92,908 47 $68,770 17 $30,442 9 $33,096 0 $0 APPLICATIONS DENIED 1 $58,880 34 $61,650 203 $78,885 76 $27,596 21 $51,177 1 $20,580 APPLICATIONS WITHDRAWN 1 $65,400 11 $93,603 78 $87,653 11 $55,364 5 $77,200 0 $0 FILES CLOSED FOR INCOMPLETENESS 2 $60,000 8 $82,270 37 $130,875 3 $63,127 2 $63,430 0 $0
Aggregated Statistics For Year 2005(Based on 5 full and 4 partial tracts) A) FHA, FSA/RHS & VA B) Conventional C) Refinancings D) Home Improvement Loans E) Loans on Dwellings For 5+ Families F) Non-occupant Loans on G) Loans On Manufactured Number Average Value Number Average Value Number Average Value Number Average Value Number Average Value Number Average Value Number Average Value
LOANS ORIGINATED 11 $73,304 168 $77,602 237 $67,291 56 $25,667 3 $402,417 74 $39,959 3 $50,867 APPLICATIONS APPROVED, NOT ACCEPTED 0 $0 21 $69,720 55 $66,309 9 $22,493 0 $0 8 $44,348 3 $32,607 APPLICATIONS DENIED 3 $107,707 42 $64,288 195 $68,366 66 $31,344 1 $99,800 10 $31,308 2 $26,630 APPLICATIONS WITHDRAWN 1 $35,250 16 $104,970 106 $96,913 14 $82,009 0 $0 8 $106,252 0 $0 FILES CLOSED FOR INCOMPLETENESS 3 $94,903 6 $58,627 11 $69,308 1 $37,640 0 $0 0 $0 0 $0
Aggregated Statistics For Year 2004(Based on 5 full and 4 partial tracts) A) FHA, FSA/RHS & VA B) Conventional C) Refinancings D) Home Improvement Loans E) Loans on Dwellings For 5+ Families F) Non-occupant Loans on G) Loans On Manufactured Number Average Value Number Average Value Number Average Value Number Average Value Number Average Value Number Average Value Number Average Value
LOANS ORIGINATED 11 $82,261 159 $79,213 281 $62,519 52 $33,769 2 $313,235 108 $34,770 1 $30,970 APPLICATIONS APPROVED, NOT ACCEPTED 1 $44,000 16 $62,454 74 $55,804 9 $38,483 0 $0 6 $52,273 0 $0 APPLICATIONS DENIED 2 $55,730 33 $57,862 257 $64,600 47 $27,562 0 $0 22 $43,123 6 $48,735 APPLICATIONS WITHDRAWN 0 $0 18 $65,298 132 $108,680 9 $56,816 0 $0 8 $517,301 0 $0 FILES CLOSED FOR INCOMPLETENESS 0 $0 6 $76,520 24 $118,342 1 $16,010 0 $0 3 $46,333 0 $0
Aggregated Statistics For Year 2003(Based on 5 full and 4 partial tracts) A) FHA, FSA/RHS & VA B) Conventional C) Refinancings D) Home Improvement Loans E) Loans on Dwellings For 5+ Families F) Non-occupant Loans on Number Average Value Number Average Value Number Average Value Number Average Value Number Average Value Number Average Value
LOANS ORIGINATED 18 $73,415 146 $73,945 538 $72,774 52 $18,947 4 $247,875 79 $50,051 APPLICATIONS APPROVED, NOT ACCEPTED 1 $81,000 9 $46,239 82 $87,215 7 $19,926 0 $0 6 $36,825 APPLICATIONS DENIED 1 $124,990 18 $49,195 210 $71,913 23 $16,211 0 $0 14 $37,974 APPLICATIONS WITHDRAWN 3 $61,267 11 $156,935 106 $74,789 2 $54,440 0 $0 6 $36,757 FILES CLOSED FOR INCOMPLETENESS 2 $54,875 3 $30,143 18 $88,490 0 $0 0 $0 3 $39,333
Aggregated Statistics For Year 2002(Based on 5 full and 4 partial tracts) A) FHA, FSA/RHS & VA B) Conventional C) Refinancings D) Home Improvement Loans E) Loans on Dwellings For 5+ Families F) Non-occupant Loans on Number Average Value Number Average Value Number Average Value Number Average Value Number Average Value Number Average Value
LOANS ORIGINATED 25 $68,940 154 $65,750 372 $73,483 44 $22,087 1 $83,070 69 $36,480 APPLICATIONS APPROVED, NOT ACCEPTED 0 $0 10 $62,677 99 $64,767 11 $19,108 0 $0 10 $35,972 APPLICATIONS DENIED 3 $58,670 27 $43,069 191 $58,203 32 $9,641 0 $0 20 $42,158 APPLICATIONS WITHDRAWN 1 $81,000 17 $110,726 85 $65,125 9 $7,180 0 $0 3 $31,933 FILES CLOSED FOR INCOMPLETENESS 1 $57,030 5 $58,030 35 $61,855 1 $11,980 0 $0 1 $6,460
Aggregated Statistics For Year 2001(Based on 5 full and 4 partial tracts) A) FHA, FSA/RHS & VA B) Conventional C) Refinancings D) Home Improvement Loans E) Loans on Dwellings For 5+ Families F) Non-occupant Loans on Number Average Value Number Average Value Number Average Value Number Average Value Number Average Value Number Average Value
LOANS ORIGINATED 24 $61,025 151 $65,044 390 $70,947 65 $18,041 1 $344,310 60 $42,890 APPLICATIONS APPROVED, NOT ACCEPTED 1 $38,000 7 $41,804 68 $51,114 17 $15,814 0 $0 2 $30,450 APPLICATIONS DENIED 3 $69,327 30 $46,931 224 $49,924 57 $11,962 0 $0 7 $34,006 APPLICATIONS WITHDRAWN 1 $17,750 13 $61,322 129 $63,462 8 $17,084 0 $0 8 $42,469 FILES CLOSED FOR INCOMPLETENESS 0 $0 3 $33,253 30 $56,116 0 $0 0 $0 1 $36,000
Aggregated Statistics For Year 2000(Based on 5 full and 4 partial tracts) A) FHA, FSA/RHS & VA B) Conventional C) Refinancings D) Home Improvement Loans E) Loans on Dwellings For 5+ Families F) Non-occupant Loans on Number Average Value Number Average Value Number Average Value Number Average Value Number Average Value Number Average Value
LOANS ORIGINATED 25 $64,561 178 $59,026 139 $56,241 79 $15,991 1 $110,000 56 $38,042 APPLICATIONS APPROVED, NOT ACCEPTED 2 $63,000 16 $56,566 48 $53,170 23 $17,298 0 $0 4 $40,362 APPLICATIONS DENIED 1 $69,950 59 $50,307 157 $46,055 76 $12,877 0 $0 15 $34,546 APPLICATIONS WITHDRAWN 0 $0 24 $66,873 78 $46,989 10 $15,727 1 $51,000 2 $48,230 FILES CLOSED FOR INCOMPLETENESS 0 $0 4 $47,812 19 $51,561 0 $0 0 $0 3 $23,667
Aggregated Statistics For Year 1999(Based on 7 full and 4 partial tracts) A) FHA, FSA/RHS & VA B) Conventional C) Refinancings D) Home Improvement Loans F) Non-occupant Loans on Number Average Value Number Average Value Number Average Value Number Average Value Number Average Value
LOANS ORIGINATED 17 $57,824 166 $65,778 244 $58,664 74 $17,531 53 $47,090 APPLICATIONS APPROVED, NOT ACCEPTED 0 $0 15 $36,106 62 $51,532 21 $12,321 3 $32,967 APPLICATIONS DENIED 2 $55,450 59 $41,914 141 $43,341 66 $14,265 5 $27,882 APPLICATIONS WITHDRAWN 0 $0 19 $59,412 109 $47,189 19 $29,029 9 $38,763 FILES CLOSED FOR INCOMPLETENESS 0 $0 4 $52,538 33 $47,053 2 $15,260 2 $26,990
Detailed mortgage data for all 9 tracts in Steubenville, OH
Private Mortgage Insurance Companies Aggregated Statistics For Year 2009(Based on 4 full and 2 partial tracts) A) Conventional B) Refinancings Number Average Value Number Average Value
LOANS ORIGINATED 10 $122,395 2 $126,035 APPLICATIONS APPROVED, NOT ACCEPTED 4 $182,378 0 $0 APPLICATIONS DENIED 3 $86,447 0 $0 APPLICATIONS WITHDRAWN 2 $263,355 0 $0 FILES CLOSED FOR INCOMPLETENESS 0 $0 0 $0
Aggregated Statistics For Year 2008(Based on 4 full and 3 partial tracts) A) Conventional B) Refinancings C) Non-occupant Loans on Number Average Value Number Average Value Number Average Value
LOANS ORIGINATED 26 $70,123 4 $75,380 5 $43,864 APPLICATIONS APPROVED, NOT ACCEPTED 3 $56,373 3 $87,447 0 $0 APPLICATIONS DENIED 3 $47,940 4 $39,615 4 $31,482 APPLICATIONS WITHDRAWN 0 $0 0 $0 0 $0 FILES CLOSED FOR INCOMPLETENESS 2 $73,655 1 $43,000 1 $43,000
Aggregated Statistics For Year 2007(Based on 5 full and 4 partial tracts) A) Conventional B) Refinancings C) Non-occupant Loans on Number Average Value Number Average Value Number Average Value
LOANS ORIGINATED 77 $75,558 15 $110,506 11 $43,318 APPLICATIONS APPROVED, NOT ACCEPTED 9 $76,092 4 $113,765 0 $0 APPLICATIONS DENIED 4 $79,725 1 $32,000 2 $63,725 APPLICATIONS WITHDRAWN 3 $69,190 3 $82,953 0 $0 FILES CLOSED FOR INCOMPLETENESS 0 $0 0 $0 0 $0
Aggregated Statistics For Year 2006(Based on 4 full and 4 partial tracts) A) Conventional B) Refinancings C) Non-occupant Loans on Number Average Value Number Average Value Number Average Value
LOANS ORIGINATED 51 $94,733 16 $104,222 10 $38,194 APPLICATIONS APPROVED, NOT ACCEPTED 2 $98,235 2 $70,650 1 $54,000 APPLICATIONS DENIED 0 $0 0 $0 0 $0 APPLICATIONS WITHDRAWN 0 $0 1 $56,350 0 $0 FILES CLOSED FOR INCOMPLETENESS 0 $0 0 $0 0 $0
Aggregated Statistics For Year 2005(Based on 5 full and 3 partial tracts) A) Conventional B) Refinancings C) Non-occupant Loans on Number Average Value Number Average Value Number Average Value
LOANS ORIGINATED 54 $81,214 19 $78,708 11 $34,539 APPLICATIONS APPROVED, NOT ACCEPTED 6 $133,100 4 $75,860 1 $26,510 APPLICATIONS DENIED 2 $417,420 1 $72,850 0 $0 APPLICATIONS WITHDRAWN 0 $0 1 $66,280 0 $0 FILES CLOSED FOR INCOMPLETENESS 0 $0 0 $0 0 $0
Aggregated Statistics For Year 2004(Based on 5 full and 4 partial tracts) A) Conventional B) Refinancings C) Non-occupant Loans on Number Average Value Number Average Value Number Average Value
LOANS ORIGINATED 54 $64,762 6 $68,065 5 $35,650 APPLICATIONS APPROVED, NOT ACCEPTED 13 $63,273 6 $66,042 0 $0 APPLICATIONS DENIED 0 $0 0 $0 0 $0 APPLICATIONS WITHDRAWN 1 $27,000 3 $63,227 1 $28,000 FILES CLOSED FOR INCOMPLETENESS 0 $0 0 $0 0 $0
Aggregated Statistics For Year 2003(Based on 4 full and 4 partial tracts) A) Conventional B) Refinancings C) Non-occupant Loans on Number Average Value Number Average Value Number Average Value
LOANS ORIGINATED 59 $83,194 32 $83,947 5 $33,736 APPLICATIONS APPROVED, NOT ACCEPTED 7 $86,267 8 $83,385 0 $0 APPLICATIONS DENIED 0 $0 0 $0 0 $0 APPLICATIONS WITHDRAWN 2 $93,945 3 $70,457 0 $0 FILES CLOSED FOR INCOMPLETENESS 0 $0 0 $0 0 $0
Aggregated Statistics For Year 2002(Based on 5 full and 4 partial tracts) A) Conventional B) Refinancings C) Non-occupant Loans on Number Average Value Number Average Value Number Average Value
LOANS ORIGINATED 62 $67,866 33 $89,702 16 $30,780 APPLICATIONS APPROVED, NOT ACCEPTED 5 $66,370 8 $61,209 2 $13,230 APPLICATIONS DENIED 1 $114,000 1 $63,000 1 $63,000 APPLICATIONS WITHDRAWN 4 $62,600 0 $0 2 $26,425 FILES CLOSED FOR INCOMPLETENESS 0 $0 1 $24,870 1 $20,000
Aggregated Statistics For Year 2001(Based on 5 full and 4 partial tracts) A) Conventional B) Refinancings C) Non-occupant Loans on Number Average Value Number Average Value Number Average Value
LOANS ORIGINATED 41 $62,748 26 $84,123 6 $48,000 APPLICATIONS APPROVED, NOT ACCEPTED 6 $119,855 7 $67,076 1 $41,000 APPLICATIONS DENIED 1 $35,350 0 $0 0 $0 APPLICATIONS WITHDRAWN 1 $74,000 2 $90,345 0 $0 FILES CLOSED FOR INCOMPLETENESS 2 $61,585 0 $0 1 $18,000
Aggregated Statistics For Year 2000(Based on 5 full and 4 partial tracts) A) Conventional B) Refinancings C) Non-occupant Loans on Number Average Value Number Average Value Number Average Value
LOANS ORIGINATED 55 $65,070 8 $58,841 4 $32,320 APPLICATIONS APPROVED, NOT ACCEPTED 1 $35,440 4 $81,472 0 $0 APPLICATIONS DENIED 0 $0 1 $47,610 0 $0 APPLICATIONS WITHDRAWN 1 $70,830 0 $0 0 $0 FILES CLOSED FOR INCOMPLETENESS 0 $0 0 $0 0 $0
Aggregated Statistics For Year 1999(Based on 5 full and 3 partial tracts) A) Conventional B) Refinancings C) Non-occupant Loans on Number Average Value Number Average Value Number Average Value
LOANS ORIGINATED 44 $65,062 11 $76,038 2 $19,850 APPLICATIONS APPROVED, NOT ACCEPTED 1 $62,520 5 $97,092 0 $0 APPLICATIONS DENIED 0 $0 0 $0 0 $0 APPLICATIONS WITHDRAWN 0 $0 0 $0 0 $0 FILES CLOSED FOR INCOMPLETENESS 0 $0 0 $0 0 $0
Fire-safe hotels and motels in Steubenville, Ohio:
Best Western University Inn Steubenville, 1401 University Blvd, Steubenville, Ohio 43952 Phone: (740) 282-0901, Fax: (740) 282-9540
Hampton Inn, 820 University Blvd, Steubenville, Ohio 43952 Phone: (740) 282-9800, Fax: (740) 282-9898
Microtel Inn & Suites Steubenville, 875 University Blvd, Steubenville, Ohio 43952 Phone: (727) 282-1800, Fax: (727) 282-1802
Best Western Plus The Inn at Franciscan Square, 200 Franciscan Sq, Steubenville, Ohio 43952 Phone: (740) 282-0901
All 4 fire-safe hotels and motels in Steubenville, Ohio
Most common first names in Steubenville, OH among deceased individuals Name Count Lived (average)
Mary 682 79.7 years John 648 73.7 years William 493 73.4 years James 374 72.4 years Joseph 314 75.0 years Robert 314 69.6 years Charles 299 73.0 years George 295 73.9 years Helen 261 79.2 years Anna 251 81.8 years
Most common last names in Steubenville, OH among deceased individuals Last name Count Lived (average)
Smith 182 74.3 years Brown 101 72.3 years Williams 81 72.7 years Miller 81 76.2 years Johnson 78 74.0 years Wilson 73 75.4 years Jones 70 72.0 years Thompson 68 74.5 years Davis 64 75.7 years Young 58 74.9 years
Steubenville compared to Ohio state average:
Median household income below state average. Median house value below state average. Foreign-born population percentage below state average. Length of stay since moving in significantly above state average. Number of college students above state average. Steubenville on our top lists :
#66 on the list of "Top 101 cities with the largest percentage of people in job corps and vocational training facilities (population 1,000+)"
#6 on the list of "Top 101 counties with the highest number of deaths per 1000 residents 2007-2013 (pop. 50,000+)"
#58 on the list of "Top 101 counties with the highest Particulate Matter (PM10 ) Annual air pollution readings in 2012 (µg/m3 )"
#68 on the list of "Top 101 counties with the largest number of people moving out compared to moving in (pop. 50,000+)"
#73 on the list of "Top 101 counties with the lowest percentage of residents relocating from other counties between 2010 and 2011"
#76 on the list of "Top 101 counties with the lowest percentage of residents relocating to other counties in 2011 (pop. 50,000+)"
Top Patent Applicants
Michael R. Riley (10)
Robert N. Hunt (5)
Mark V. Loen (3)
Joseph M. Staffilino, Sr. (1)
Roger Isla (1)
Charles S. Parker (1)
Michael R. Rlley (1)
William E. Pagett (1)
Jeffrey R. Hutchison (1)
Caitlin Abraham (1)
Total of 28 patent applications in 2008-2024.


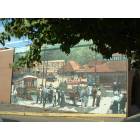
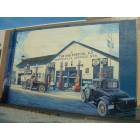

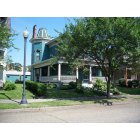
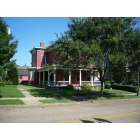

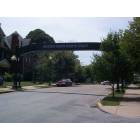
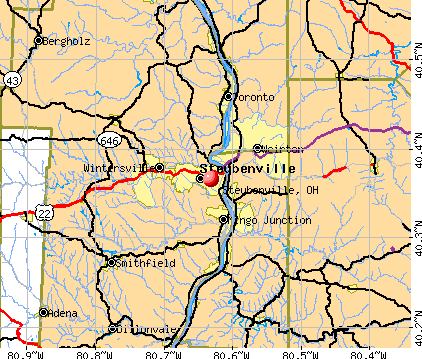


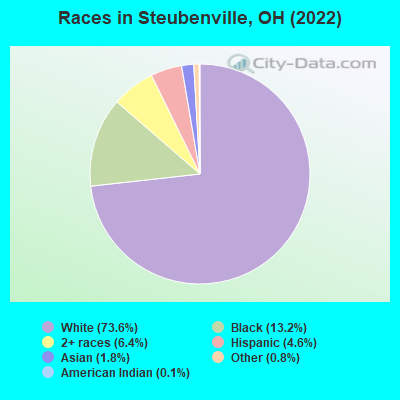
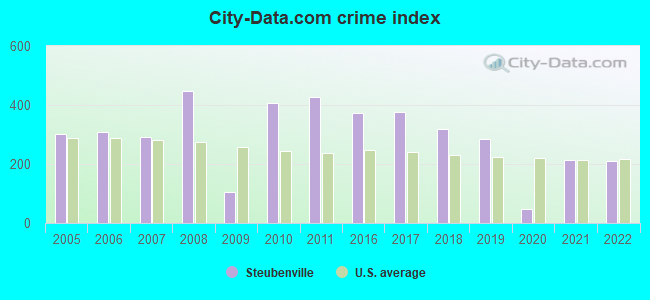
 Recent articles from our blog. Our writers, many of them Ph.D. graduates or candidates, create easy-to-read articles on a wide variety of topics.

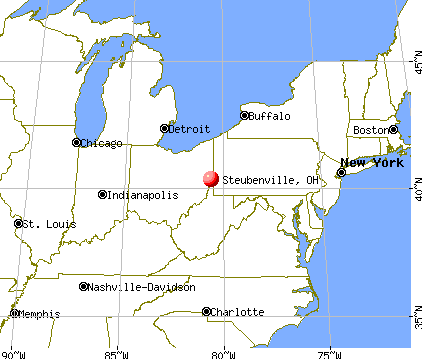
 (34.9 miles
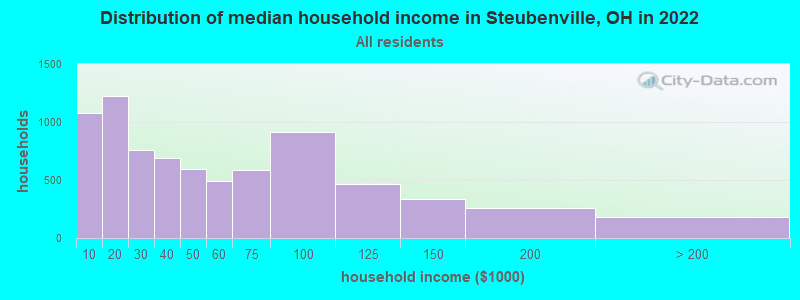
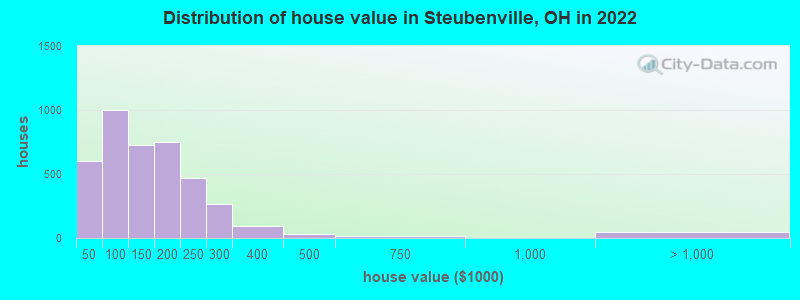

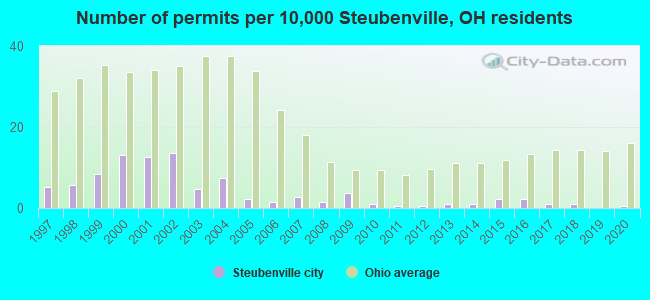
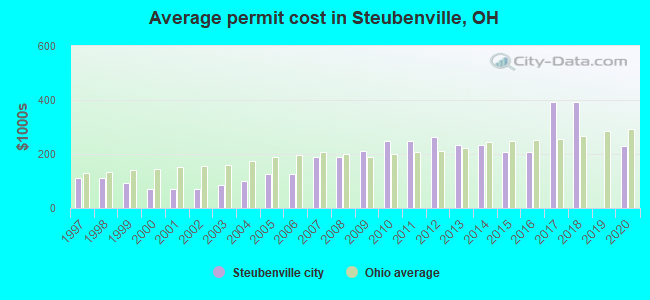
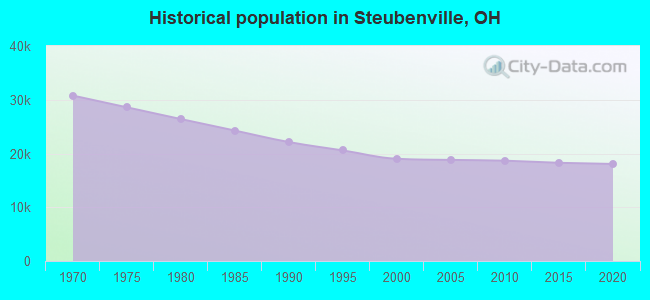
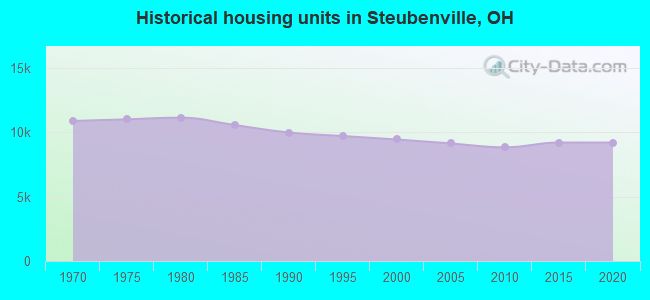
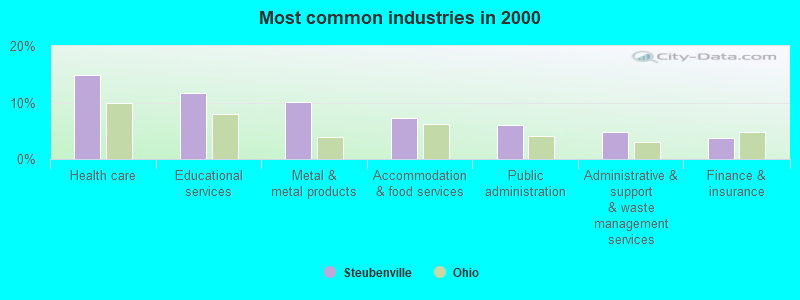

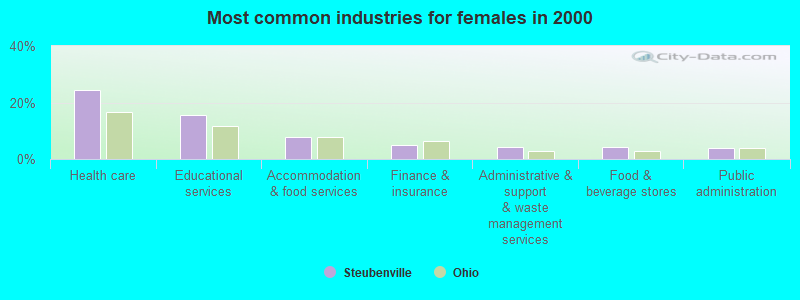
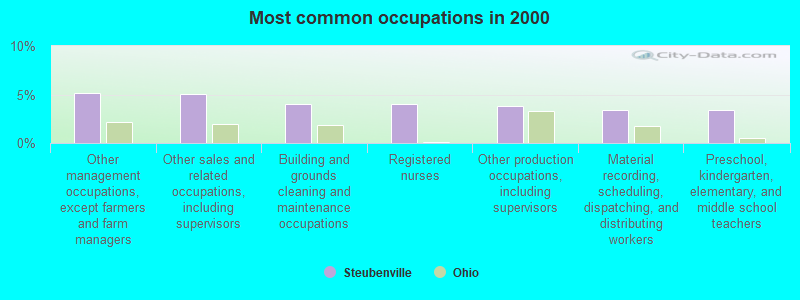

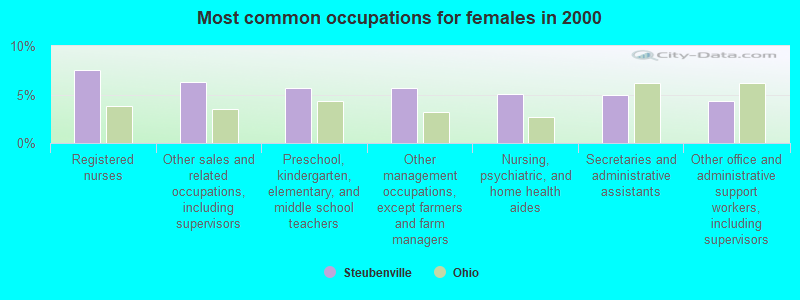
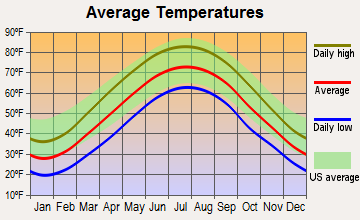


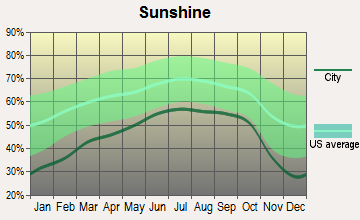
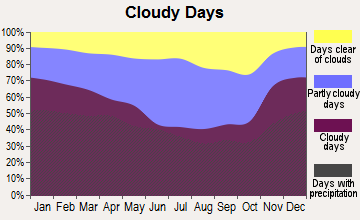
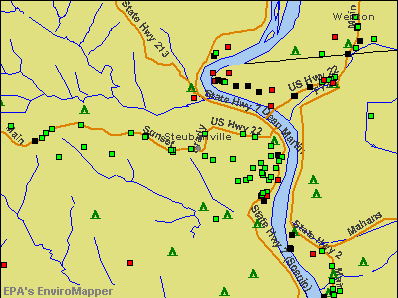

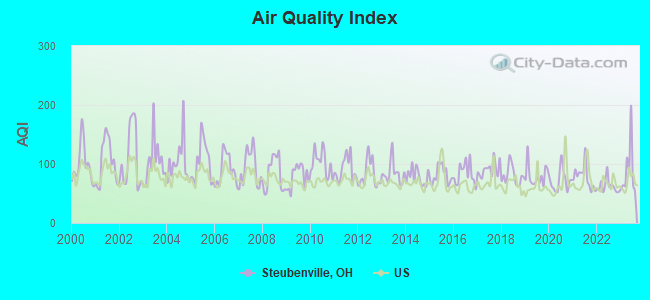
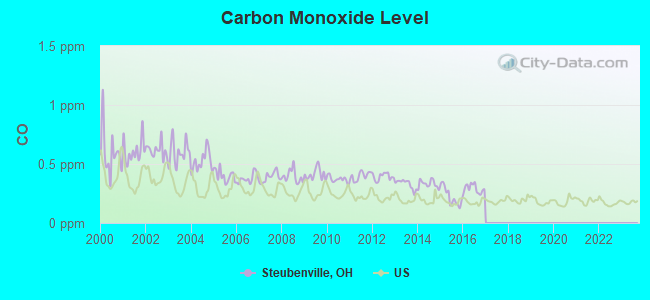
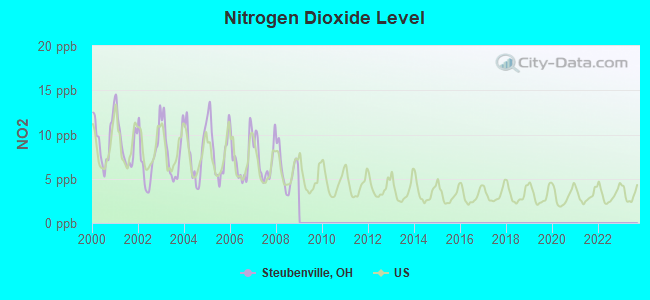
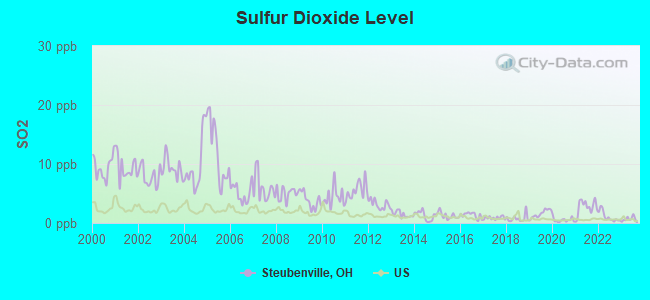
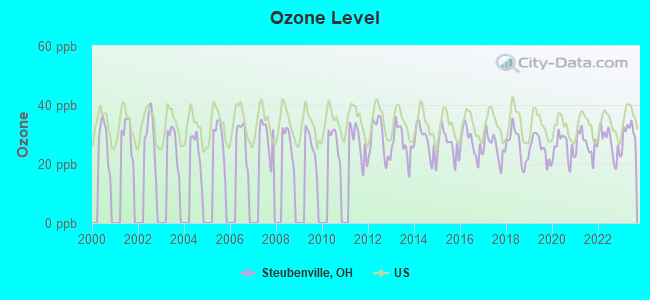
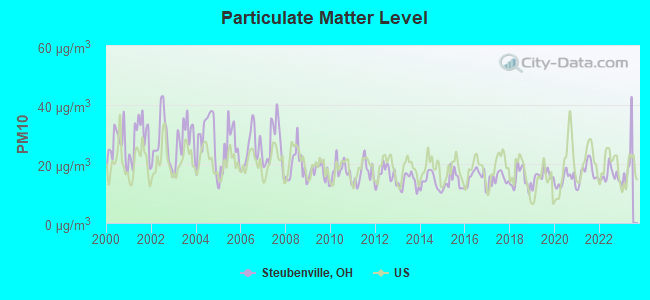

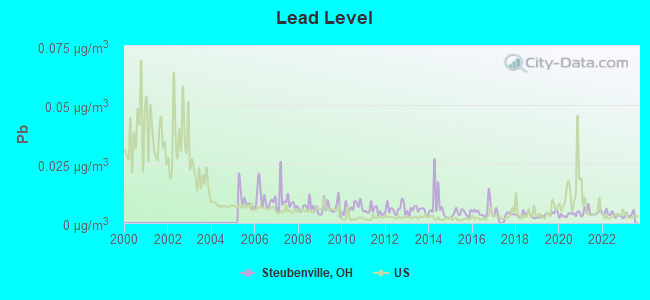
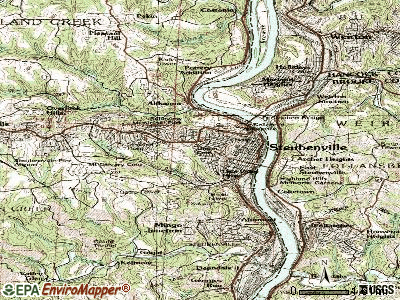
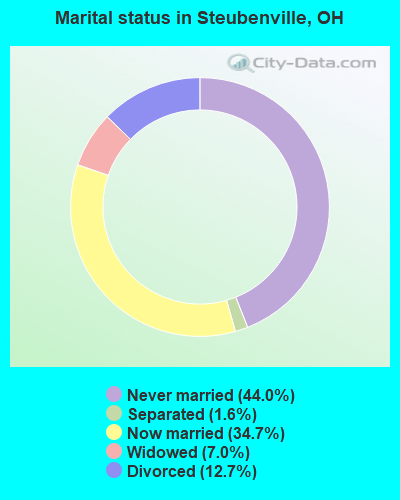
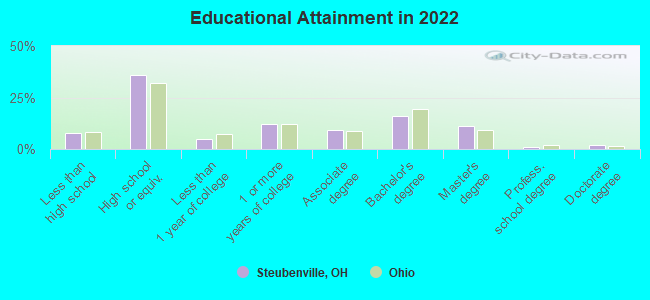
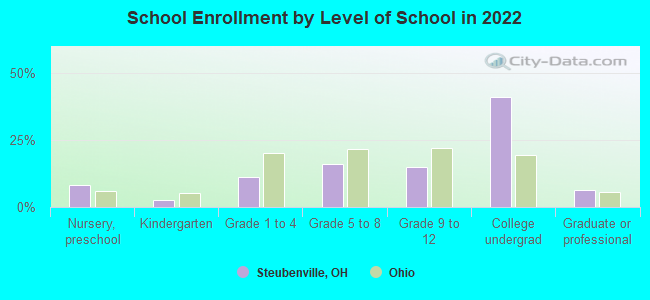
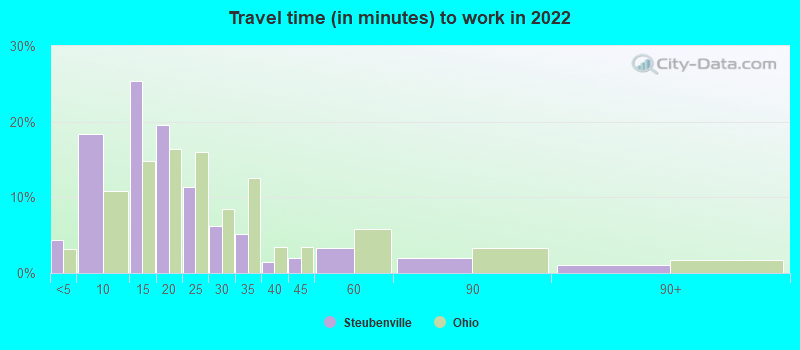
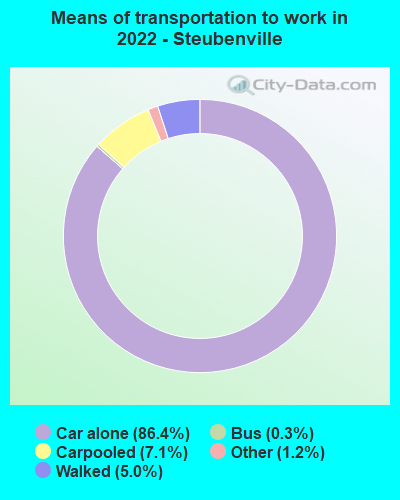
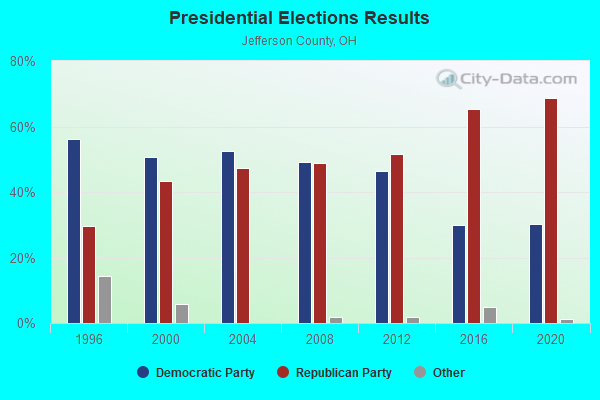
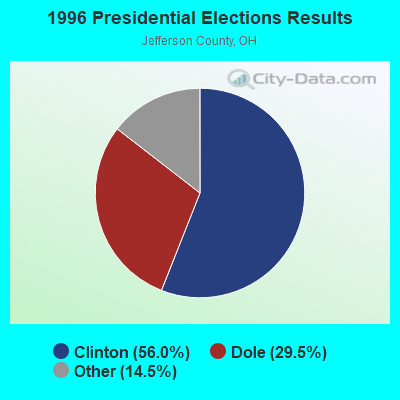
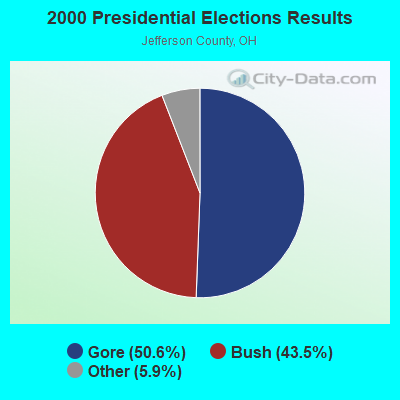
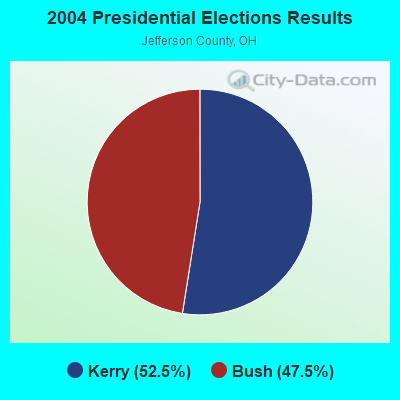
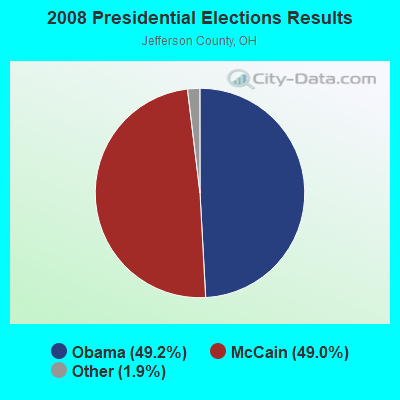
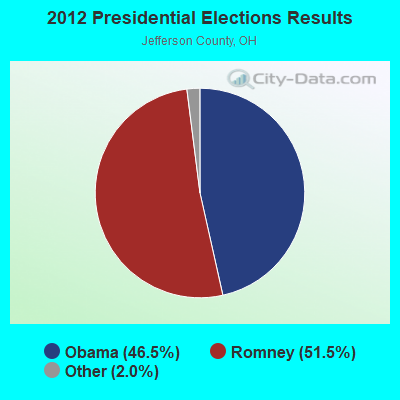
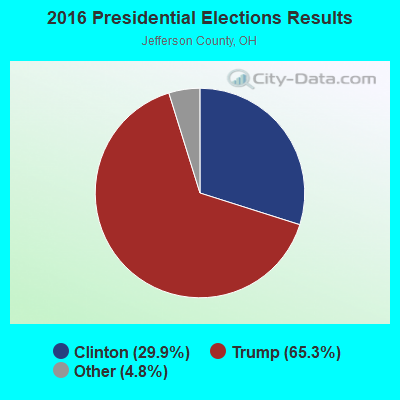
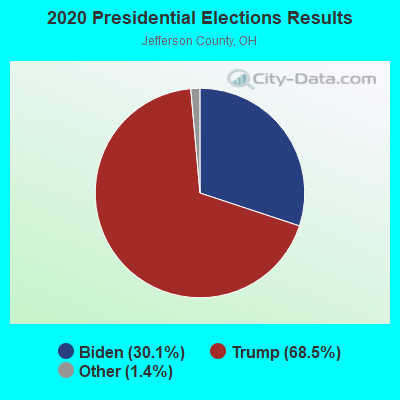
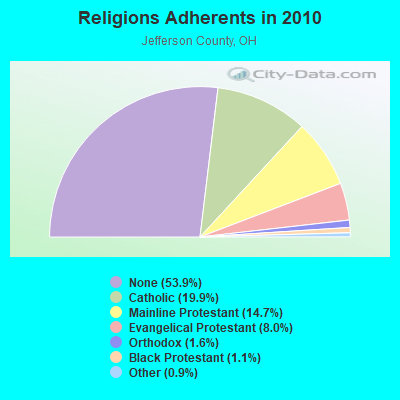
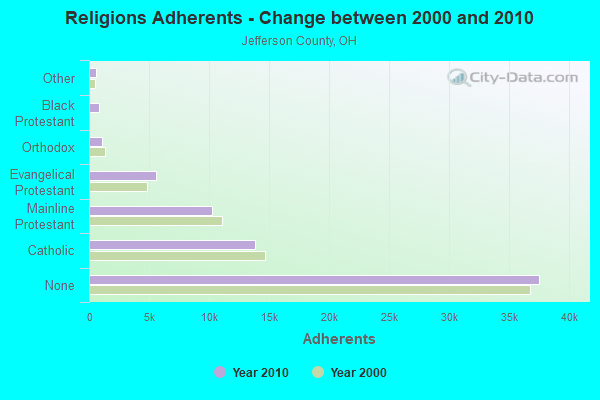
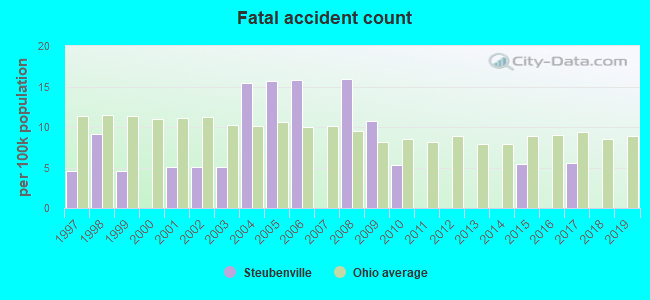
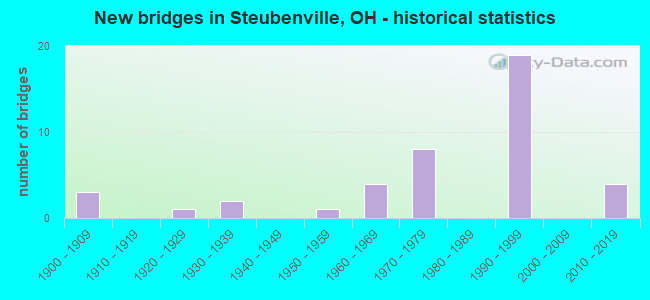
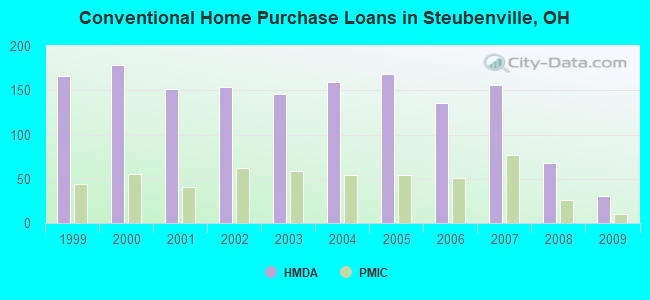
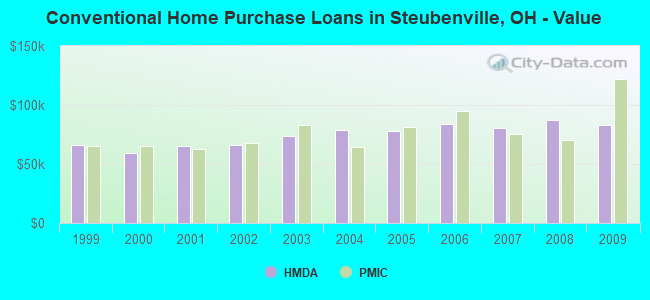
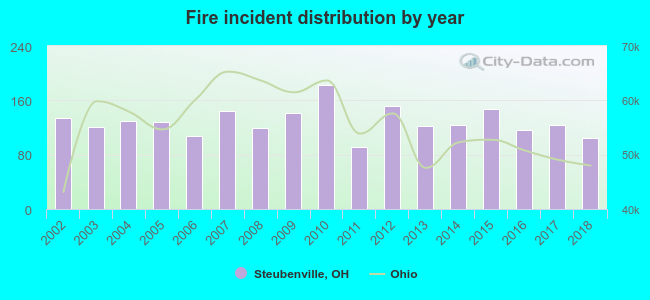 Based on the data from the years 2002 - 2018 the average number of fires per year is 129. The highest number of reported fires - 183 took place in 2010, and the least - 92 in 2011. The data has a dropping trend.
 When looking into fire subcategories, the most incidents belonged to: Structure Fires (51.3%), and Outside Fires (28.7%).