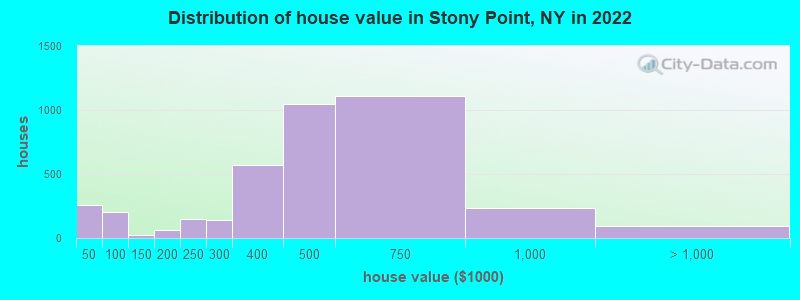
Estimated median house or condo value in 2022: $470,706 (it was $215,900 in 2000)
Stony Point:
$470,706
NY:
$400,400
Mean prices in 2022:all housing units: $511,294; detached houses: $554,316; townhouses or other attached units: $323,644; in 2-unit structures: $528,349; mobile homes: $72,767
Median gross rent in 2022: $1,496.
March 2022 cost of living index in Stony Point: 129.6 (high, U.S. average is 100)
Percentage of residents living in poverty in 2022: 3.1%
(2.2% for White Non-Hispanic residents, 0.2% for Black residents, 8.0% for Hispanic or Latino residents, 1.4% for other race residents)
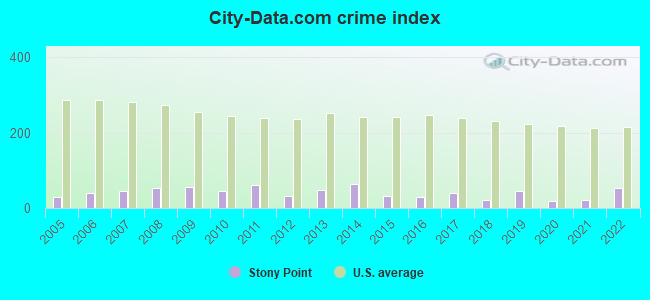
The City-Data.com crime index weighs serious crimes and violent crimes more heavily. Higher means more crime, U.S. average is 246.1. It adjusts for the number of visitors and daily workers commuting into cities.
Latest news from Stony Point, NY collected exclusively by city-data.com from local newspapers, TV, and radio stations
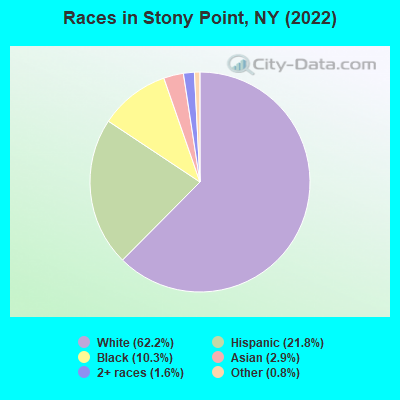
Ancestries: Italian (21.7%), Irish (12.8%), German (9.1%), American (5.9%), Haitian (3.9%), English (2.2%).
Current Local Time: EST time zone
Elevation: 116 feet
Land area: 5.50 square miles.
Population density: 2,208 people per square mile (low).
1,787 residents are foreign born (7.5% Latin America, 3.7% Europe, 2.0% Asia).
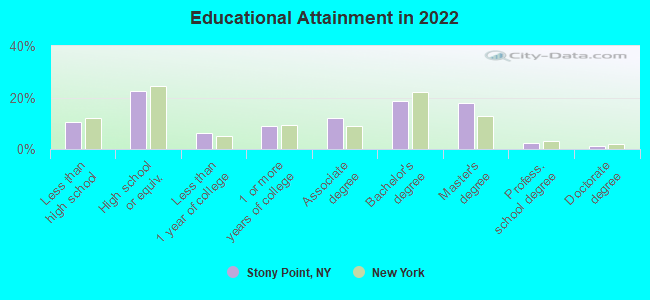
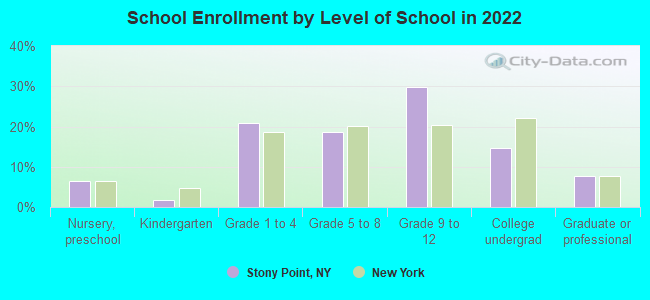
This place:
14.2%
New York:
22.6%
Median real estate property taxes paid for housing units with mortgages in 2022: $10,001 (2.1%) Median real estate property taxes paid for housing units with no mortgage in 2022: $10,001 (2.3%)
Nearest city with pop. 50,000+: Clarkstown, NY (7.0 miles , pop. 82,082).
Nearest city with pop. 200,000+: Bronx, NY (27.0 miles , pop. 1,332,650).
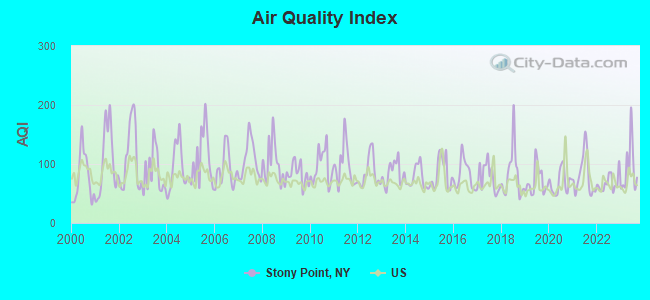
Air Quality Index (AQI) level in 2023 was 92.0. This is worse than average.
City:
92.0
U.S.:
72.6
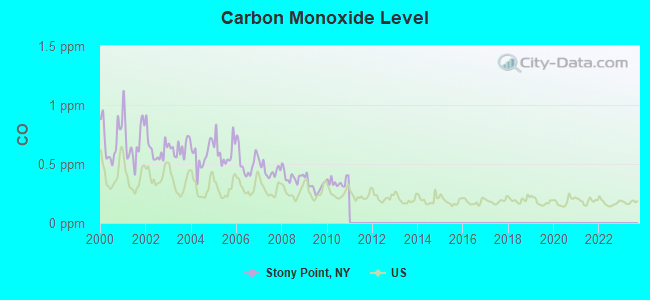
Carbon Monoxide (CO) [ppm] level in 2010 was 0.347. This is worse than average.Closest monitor was 22.2 miles away from the city center.
City:
0.347
U.S.:
0.251
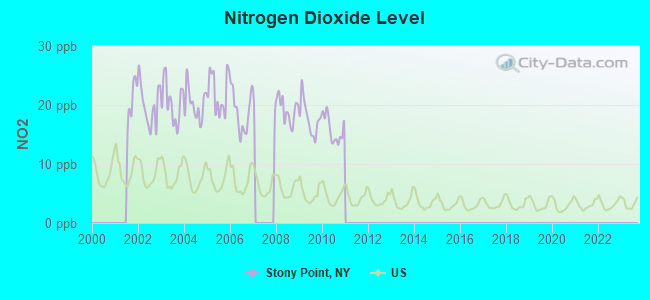
Nitrogen Dioxide (NO2) [ppb] level in 2010 was 15.9. This is significantly worse than average.Closest monitor was 17.0 miles away from the city center.
City:
15.9
U.S.:
5.1
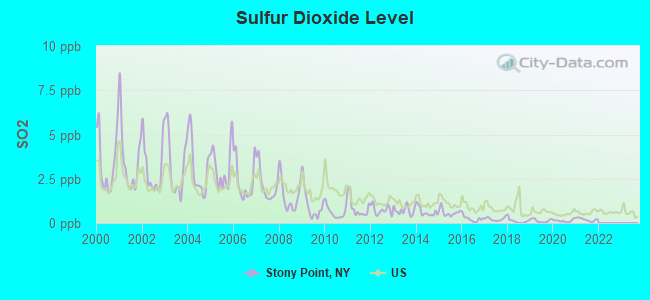
Sulfur Dioxide (SO2) [ppb] level in 2021 was 0.196. This is significantly better than average.Closest monitor was 1.4 miles away from the city center.
City:
0.196
U.S.:
1.515
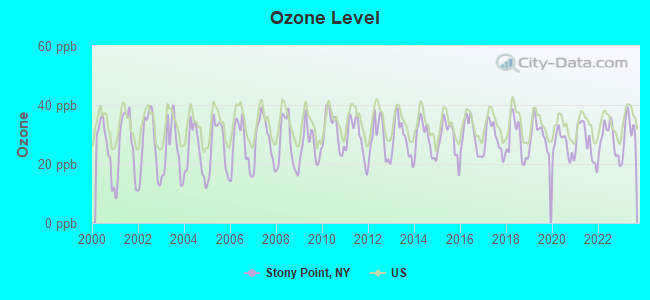
Ozone [ppb] level in 2023 was 30.9. This is about average.Closest monitor was 3.6 miles away from the city center.
City:
30.9
U.S.:
33.3
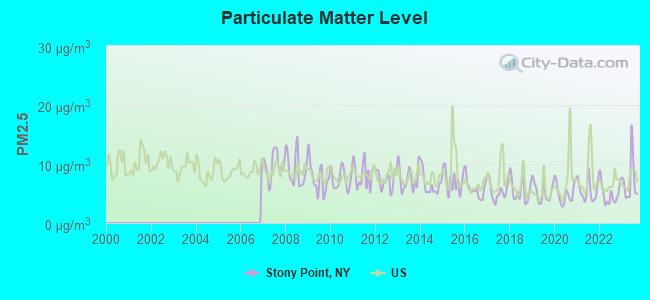
Particulate Matter (PM2.5) [µg/m3] level in 2023 was 7.12. This is about average.Closest monitor was 18.9 miles away from the city center.
City:
7.12
U.S.:
8.11
Tornado activity:
Stony Point-area historical tornado activity is above New York state average. It is 34% smaller than the overall U.S. average.
On 7/14/1988, a category F3 (max. wind speeds 158-206 mph) tornado 25.8 miles away from the Stony Point place center injured one personand causedbetween $500,000 and $5,000,000 in damages.
On 5/28/1973, a category F3 tornado 39.6 miles away from the place center causedbetween $50,000 and $500,000 in damages.
Earthquake activity:
Stony Point-area historical earthquake activity is significantly above New York state average. It is 68% smaller than the overall U.S. average.
On 10/7/1983 at 10:18:46, a magnitude 5.3 (5.1 MB, 5.3 LG, 5.1 ML, Class: Moderate, Intensity: VI - VII) earthquake occurred 189.4 miles away from Stony Point center On 8/23/2011 at 17:51:04, a magnitude 5.8 (5.8 MW, Depth: 3.7 mi) earthquake occurred 311.1 miles away from Stony Point center On 4/20/2002 at 10:50:47, a magnitude 5.3 (5.3 ML, Depth: 3.0 mi) earthquake occurred 227.8 miles away from the city center On 4/20/2002 at 10:50:47, a magnitude 5.2 (5.2 MB, 4.2 MS, 5.2 MW, 5.0 MW) earthquake occurred 226.0 miles away from Stony Point center On 1/16/1994 at 01:49:16, a magnitude 4.6 (4.6 MB, 4.6 LG, Depth: 3.1 mi, Class: Light, Intensity: IV - V) earthquake occurred 123.7 miles away from the city center On 1/19/1982 at 00:14:42, a magnitude 4.7 (4.5 MB, 4.7 MD, 4.5 LG) earthquake occurred 199.2 miles away from Stony Point center Magnitude types: regional Lg-wave magnitude (LG), body-wave magnitude (MB), duration magnitude (MD), local magnitude (ML), surface-wave magnitude (MS), moment magnitude (MW)
Natural disasters:
The number of natural disasters in Rockland County (23) is greater than the US average (15). Major Disasters (Presidential) Declared: 14 Emergencies Declared: 8
Causes of natural disasters: Hurricanes: 7, Floods: 6, Storms: 6, Blizzards: 2, Heavy Rains: 2, Tropical Storms: 2, Landslide: 1, Power Outage: 1, Snowstorm: 1, Water Shortage: 1, Other: 3 (Note: some incidents may be assigned to more than one category).
Hospitals and medical centers near Stony Point:
COMMUNITY BASED SERVICES, INC (Hospital, about 4 miles away; BUCHANAN, NY)
BETHEL NURSING AND REHAB CENTER (Nursing Home, about 4 miles away; CROTON ON HUDSON, NY)
VA HUDSON VALLEY HEALTHCARE SYSTEM (Hospital, Acute Care - Veterans Administration, about 4 miles away; MONTROSE, NY)
N Y S VETS HOME AT MONTROSE (Nursing Home, about 4 miles away; MONTROSE, NY)
CAMP VENTURE, INC (Hospital, about 4 miles away; POMONA, NY)
A AND T CERTIFIED HOME CARE, LLC (Home Health Center, about 5 miles away; NEW CITY, NY)
SKY VIEW REHABILITATION AND HEALTH CARE CENTER L L C (Nursing Home, about 5 miles away; CROTON ON HUDSON, NY)
Amtrak station near Stony Point:
7 miles: CROTON-HARMON (CROTON-ON-HUDSON, CROTON POINT AVE.) . Services: partially wheelchair accessible, enclosed waiting area, public restrooms, public payphones, snack bar, paid short-term parking, paid long-term parking, call for car rental service, call for taxi service, public transit connection.
Operable nuclear power plants near Stony Point:
4 miles: Indian Point 2 and 3 in Buchanan, NY.
Colleges/universities with over 2000 students nearest to Stony Point:
Rockland Community College (about 9 miles; Suffern, NY; Full-time enrollment: 6,026)
Nyack College (about 11 miles; Nyack, NY; FT enrollment: 2,590)
United States Military Academy (about 12 miles; West Point, NY; FT enrollment: 5,651)
SUNY Westchester Community College (about 16 miles; Valhalla, NY; FT enrollment: 10,278)
Mercy College (about 16 miles; Dobbs Ferry, NY; FT enrollment: 8,602)
Ramapo College of New Jersey (about 17 miles; Mahwah, NJ; FT enrollment: 5,864)
Bergen Community College (about 20 miles; Paramus, NJ; FT enrollment: 11,826)
ROSE MEMORIAL LIBRARY ASSOCIATION (Operating income: $591,271; Location: 79 EAST MAIN STREET; 26,690 books; 1,904 e-books; 2,726 audio materials; 2,724 video materials; 14 state licensed databases; 6 other licensed databases; 82 print serial subscriptions)
User-submitted facts and corrections:
HOT 97 (97.1 fm) and Power 105.1 (105.1 fm) added by Jesi
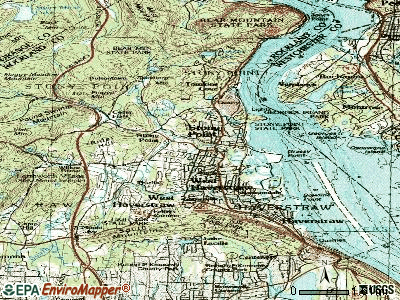
Notable locations in Stony Point: Stony Point Wastewater Treatment Plant (A), Stony Point Light House (B), Rose Memorial Library (C), Wayne Hose Company 1 (D). Display/hide their locations on the map
Churches in Stony Point include: Atonement Lutheran Church (A), First United Methodist Church (B), Immaculate Conception Church (C), Trinity United Methodist Church (D), Stony Point Presbyterian Church (E). Display/hide their locations on the map
Birthplace of: James Farley - 20th century businessman and federal politician, Mike Deane - Basketball player-coach, Stephanie Courtney - Actress and comedienne.
Rockland County has a predicted average indoor radon screening level less than 2 pCi/L (pico curies per liter) - Low Potential
Drinking water stations with addresses in Stony Point that have no violations reported:
GATE HILL DAY CAMP (Population served: 555,Primary Water Source Type: Groundwater)
Average household size:
This place:
2.8 people
New York:
2.6 people
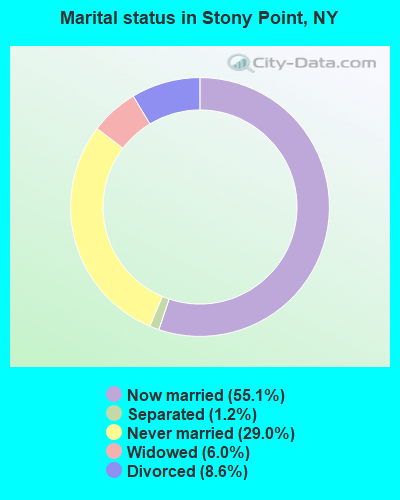
Percentage of family households:
This place:
76.5%
Whole state:
63.5%
Percentage of households with unmarried partners:
This place:
4.3%
Whole state:
6.8%
Likely homosexual households (counted as self-reported same-sex unmarried-partner households)
Lesbian couples: 0.3% of all households
Gay men: 0.2% of all households
People in group quarters in Stony Point in 2010:
35 people in group homes intended for adults
26 people in other noninstitutional facilities
13 people in workers' group living quarters and job corps centers
People in group quarters in Stony Point in 2000:
45 people in homes for the mentally retarded
32 people in religious group quarters
23 people in homes for the mentally ill
12 people in other group homes
Banks with branches in Stony Point (2011 data):
TD Bank, National Association: Stony Point Branch at 82 South Liberty Drive, branch established on 2004/12/21. Info updated 2010/10/04: Bank assets: $188,912.6 mil, Deposits: $153,149.8 mil, headquarters in Wilmington, DE, positive income, 1314 total offices, Holding Company: Toronto-Dominion Bank, The
Provident Bank: Stony Point Branch at 153 South Liberty Dr Route 9w, branch established on 1895/01/01. Info updated 2011/07/21: Bank assets: $3,075.6 mil, Deposits: $2,161.0 mil, headquarters in Montebello, NY, positive income, Commercial Lending Specialization, 36 total offices
JPMorgan Chase Bank, National Association: Stony Point Branch at 22 South Liberty Drive, branch established on 1966/06/09. Info updated 2011/11/10: Bank assets: $1,811,678.0 mil, Deposits: $1,190,738.0 mil, headquarters in Columbus, OH, positive income, International Specialization, 5577 total offices, Holding Company: Jpmorgan Chase & Co.
KeyBank National Association: Stony Point Branch at 35 South Liberty Drive (Route 9w), branch established on 1996/01/24. Info updated 2008/03/03: Bank assets: $86,198.8 mil, Deposits: $64,214.8 mil, headquarters in Cleveland, OH, positive income, Commercial Lending Specialization, 1067 total offices, Holding Company: Keycorp
HSBC Bank USA, National Association: Stony Point Branch at 180 Route 9w, branch established on 1969/06/07. Info updated 2010/11/30: Bank assets: $206,009.7 mil, Deposits: $149,026.8 mil, headquarters in Mc Lean, VA, positive income, 474 total offices, Holding Company: Hsbc Holdings Plc
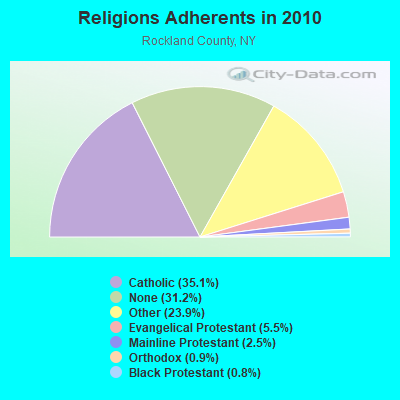
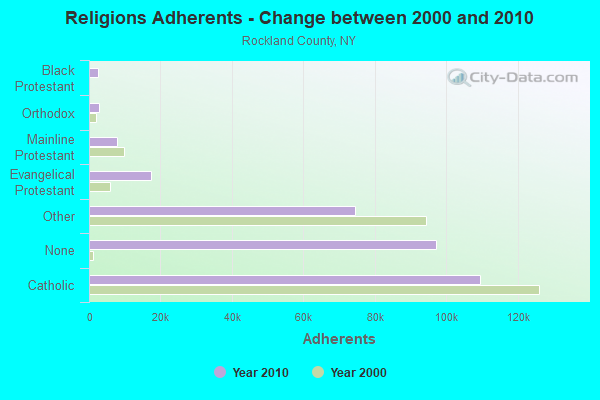
Religion statistics for Stony Point, NY (based on Rockland County data)
Religion
Adherents
Congregations
Catholic
109,386
21
Other
74,477
136
Evangelical Protestant
17,221
84
Mainline Protestant
7,852
48
Orthodox
2,909
14
Black Protestant
2,640
8
None
97,202
-
Source: Clifford Grammich, Kirk Hadaway, Richard Houseal, Dale E.Jones, Alexei Krindatch, Richie Stanley and Richard H.Taylor. 2012. 2010 U.S.Religion Census: Religious Congregations & Membership Study. Association of Statisticians of American Religious Bodies. Jones, Dale E., et al. 2002. Congregations and Membership in the United States 2000. Nashville, TN: Glenmary Research Center. Graphs represent county-level data
Aircraft: PIPER PA-24-180 (Category: Land, Seats: 4, Weight: Up to 12,499 Pounds, Speed: 120 mph), Engine: LYCOMING O&VO-360 SER (180 HP) (Reciprocating) N-Number: 7943P, N7943P, N-7943P, Serial Number: 24-3179, Year manufactured: 1962, Certificate Issue Date: 03/10/2000 Registrant (Individual): Andrew S Davie, 8 Harrison St, Stony Point, NY 10980
Aircraft: CIRRUS DESIGN CORP SR22 (Category: Land, Seats: 4, Weight: Up to 12,499 Pounds), Engine: CONT MOTOR IO-550-N (310 HP) (Reciprocating) N-Number: 915AS, N915AS, N-915AS, Serial Number: 4390, Year manufactured: 2016, Airworthiness Date: 09/15/2016, Certificate Issue Date: 10/25/2016 Registrant (LLC): Carolina Aircraft Co LLC, 3 Fillmore Dr, Stony Point, NY 10980
Aircraft: DJI INSPIRE 1 (Category: Land, Engines: 4), Engine: Electric N-Number: 597KW, N597KW, N-597KW, Serial Number: W13DCG29040033, Certificate Issue Date: 10/01/2015 Registrant (Individual): Peter J Zanlunghi, 65 Park Rd, Stony Point, NY 10980 Deregistered:Cancel Date: 03/23/2019
Home Mortgage Disclosure Act Aggregated Statistics For Year 2009 (Based on 2 full tracts)
A) FHA, FSA/RHS & VA Home Purchase Loans
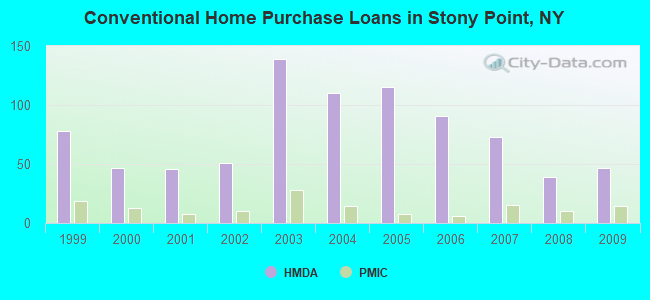
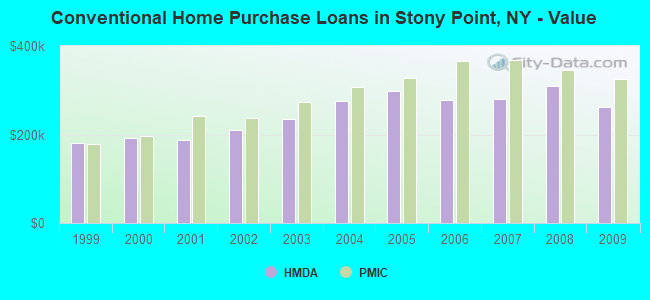
B) Conventional Home Purchase Loans
C) Refinancings
D) Home Improvement Loans
E) Loans on Dwellings For 5+ Families
F) Non-occupant Loans on < 5 Family Dwellings (A B C & D)
G) Loans On Manufactured Home Dwelling (A B C & D)
Number
Average Value
Number
Average Value
Number
Average Value
Number
Average Value
Number
Average Value
Number
Average Value
Number
Average Value
LOANS ORIGINATED
29
$329,391
47
$261,850
84
$245,836
19
$141,999
0
$0
1
$289,000
1
$70,930
APPLICATIONS APPROVED, NOT ACCEPTED
2
$295,500
9
$172,270
13
$266,105
2
$90,500
1
$1,445,550
0
$0
5
$69,162
APPLICATIONS DENIED
4
$355,648
10
$196,813
57
$307,639
10
$61,977
0
$0
5
$196,024
2
$79,920
APPLICATIONS WITHDRAWN
2
$289,500
5
$245,594
30
$282,575
4
$144,935
0
$0
1
$209,790
0
$0
FILES CLOSED FOR INCOMPLETENESS
2
$273,875
1
$339,660
21
$292,791
1
$29,970
0
$0
0
$0
0
$0
Aggregated Statistics For Year 2008 (Based on 2 full tracts)
A) FHA, FSA/RHS & VA Home Purchase Loans
B) Conventional Home Purchase Loans
C) Refinancings
D) Home Improvement Loans
E) Loans on Dwellings For 5+ Families
F) Non-occupant Loans on < 5 Family Dwellings (A B C & D)
G) Loans On Manufactured Home Dwelling (A B C & D)
Number
Average Value
Number
Average Value
Number
Average Value
Number
Average Value
Number
Average Value
Number
Average Value
Number
Average Value
LOANS ORIGINATED
14
$348,139
39
$309,559
59
$240,422
25
$75,702
1
$475,000
7
$192,001
3
$54,963
APPLICATIONS APPROVED, NOT ACCEPTED
1
$359,000
6
$458,207
17
$265,166
4
$180,325
0
$0
0
$0
1
$25,000
APPLICATIONS DENIED
1
$345,650
17
$260,668
63
$332,456
27
$71,395
0
$0
9
$318,026
3
$47,650
APPLICATIONS WITHDRAWN
0
$0
5
$297,602
25
$292,136
2
$10,990
0
$0
1
$179,000
0
$0
FILES CLOSED FOR INCOMPLETENESS
1
$481,000
4
$338,078
6
$289,048
1
$417,000
0
$0
1
$374,630
0
$0
Aggregated Statistics For Year 2007 (Based on 2 full tracts)
A) FHA, FSA/RHS & VA Home Purchase Loans
B) Conventional Home Purchase Loans
C) Refinancings
D) Home Improvement Loans
E) Loans on Dwellings For 5+ Families
F) Non-occupant Loans on < 5 Family Dwellings (A B C & D)
G) Loans On Manufactured Home Dwelling (A B C & D)
Number
Average Value
Number
Average Value
Number
Average Value
Number
Average Value
Number
Average Value
Number
Average Value
Number
Average Value
LOANS ORIGINATED
1
$371,000
73
$280,592
110
$230,819
49
$88,721
1
$363,000
9
$314,990
4
$58,952
APPLICATIONS APPROVED, NOT ACCEPTED
0
$0
13
$193,715
23
$262,788
7
$132,031
0
$0
3
$220,133
3
$103,640
APPLICATIONS DENIED
3
$361,637
30
$309,828
100
$350,981
24
$121,238
0
$0
15
$324,447
2
$68,930
APPLICATIONS WITHDRAWN
1
$367,630
12
$552,575
32
$248,617
4
$175,395
0
$0
6
$327,047
0
$0
FILES CLOSED FOR INCOMPLETENESS
0
$0
4
$318,415
20
$333,636
2
$84,415
0
$0
3
$414,887
0
$0
Aggregated Statistics For Year 2006 (Based on 2 full tracts)
A) FHA, FSA/RHS & VA Home Purchase Loans
B) Conventional Home Purchase Loans
C) Refinancings
D) Home Improvement Loans
E) Loans on Dwellings For 5+ Families
F) Non-occupant Loans on < 5 Family Dwellings (A B C & D)
G) Loans On Manufactured Home Dwelling (A B C & D)
Number
Average Value
Number
Average Value
Number
Average Value
Number
Average Value
Number
Average Value
Number
Average Value
Number
Average Value
LOANS ORIGINATED
1
$343,660
91
$276,902
120
$243,654
37
$108,115
1
$499,500
6
$296,610
2
$60,455
APPLICATIONS APPROVED, NOT ACCEPTED
0
$0
14
$244,759
37
$252,882
11
$100,196
0
$0
0
$0
0
$0
APPLICATIONS DENIED
0
$0
29
$269,988
99
$294,774
33
$113,205
0
$0
5
$447,656
6
$80,103
APPLICATIONS WITHDRAWN
0
$0
20
$233,092
74
$292,405
6
$128,645
0
$0
3
$270,107
0
$0
FILES CLOSED FOR INCOMPLETENESS
0
$0
7
$389,586
15
$297,394
1
$462,000
0
$0
1
$358,640
0
$0
Aggregated Statistics For Year 2005 (Based on 2 full tracts)
B) Conventional Home Purchase Loans
C) Refinancings
D) Home Improvement Loans
F) Non-occupant Loans on < 5 Family Dwellings (A B C & D)
G) Loans On Manufactured Home Dwelling (A B C & D)
Number
Average Value
Number
Average Value
Number
Average Value
Number
Average Value
Number
Average Value
LOANS ORIGINATED
115
$297,767
176
$245,913
58
$95,396
20
$277,393
2
$71,460
APPLICATIONS APPROVED, NOT ACCEPTED
14
$252,132
36
$266,649
10
$122,548
0
$0
5
$81,352
APPLICATIONS DENIED
32
$182,128
92
$256,951
22
$109,078
1
$170,000
12
$40,568
APPLICATIONS WITHDRAWN
8
$284,144
109
$251,327
13
$195,523
2
$281,000
0
$0
FILES CLOSED FOR INCOMPLETENESS
0
$0
16
$337,148
4
$90,215
0
$0
0
$0
Aggregated Statistics For Year 2004 (Based on 2 full tracts)
A) FHA, FSA/RHS & VA Home Purchase Loans
B) Conventional Home Purchase Loans
C) Refinancings
D) Home Improvement Loans
E) Loans on Dwellings For 5+ Families
F) Non-occupant Loans on < 5 Family Dwellings (A B C & D)
G) Loans On Manufactured Home Dwelling (A B C & D)
Number
Average Value
Number
Average Value
Number
Average Value
Number
Average Value
Number
Average Value
Number
Average Value
Number
Average Value
LOANS ORIGINATED
0
$0
110
$274,800
165
$243,687
34
$67,468
2
$2,836,500
17
$294,146
4
$35,982
APPLICATIONS APPROVED, NOT ACCEPTED
1
$163,840
17
$262,355
40
$184,058
10
$98,141
0
$0
1
$250,000
4
$57,692
APPLICATIONS DENIED
0
$0
25
$251,166
79
$246,295
20
$66,614
0
$0
4
$370,165
6
$52,452
APPLICATIONS WITHDRAWN
0
$0
11
$301,085
85
$241,143
11
$65,049
0
$0
2
$415,085
0
$0
FILES CLOSED FOR INCOMPLETENESS
1
$216,000
4
$183,418
20
$207,466
3
$169,170
0
$0
1
$82,920
0
$0
Aggregated Statistics For Year 2003 (Based on 2 full tracts)
A) FHA, FSA/RHS & VA Home Purchase Loans
B) Conventional Home Purchase Loans
C) Refinancings
D) Home Improvement Loans
E) Loans on Dwellings For 5+ Families
F) Non-occupant Loans on < 5 Family Dwellings (A B C & D)
Number
Average Value
Number
Average Value
Number
Average Value
Number
Average Value
Number
Average Value
Number
Average Value
LOANS ORIGINATED
2
$199,000
139
$235,878
466
$182,308
22
$66,188
3
$265,790
15
$190,151
APPLICATIONS APPROVED, NOT ACCEPTED
0
$0
19
$272,792
68
$180,146
7
$53,809
0
$0
0
$0
APPLICATIONS DENIED
0
$0
21
$161,317
97
$200,720
7
$29,976
0
$0
3
$121,213
APPLICATIONS WITHDRAWN
0
$0
17
$231,962
86
$195,247
8
$32,228
0
$0
0
$0
FILES CLOSED FOR INCOMPLETENESS
0
$0
3
$220,850
8
$206,565
0
$0
0
$0
0
$0
Aggregated Statistics For Year 2002 (Based on 1 full tract)
A) FHA, FSA/RHS & VA Home Purchase Loans
B) Conventional Home Purchase Loans
C) Refinancings
D) Home Improvement Loans
F) Non-occupant Loans on < 5 Family Dwellings (A B C & D)
Number
Average Value
Number
Average Value
Number
Average Value
Number
Average Value
Number
Average Value
LOANS ORIGINATED
1
$137,860
51
$209,849
160
$660,214
8
$27,722
9
$137,196
APPLICATIONS APPROVED, NOT ACCEPTED
0
$0
5
$195,604
25
$188,012
4
$56,195
3
$112,887
APPLICATIONS DENIED
0
$0
12
$107,642
40
$175,025
8
$48,576
4
$156,342
APPLICATIONS WITHDRAWN
2
$164,835
5
$247,552
29
$145,475
8
$64,311
1
$22,980
FILES CLOSED FOR INCOMPLETENESS
0
$0
1
$449,550
11
$168,286
0
$0
0
$0
Aggregated Statistics For Year 2001 (Based on 1 full tract)
A) FHA, FSA/RHS & VA Home Purchase Loans
B) Conventional Home Purchase Loans
C) Refinancings
D) Home Improvement Loans
E) Loans on Dwellings For 5+ Families
F) Non-occupant Loans on < 5 Family Dwellings (A B C & D)
Number
Average Value
Number
Average Value
Number
Average Value
Number
Average Value
Number
Average Value
Number
Average Value
LOANS ORIGINATED
3
$238,427
46
$186,683
105
$166,947
14
$44,027
1
$274,730
3
$154,513
APPLICATIONS APPROVED, NOT ACCEPTED
0
$0
4
$122,878
12
$131,618
6
$35,798
0
$0
0
$0
APPLICATIONS DENIED
1
$132,870
9
$89,133
27
$164,058
7
$33,110
0
$0
3
$146,853
APPLICATIONS WITHDRAWN
3
$157,177
5
$209,790
26
$137,785
5
$73,326
0
$0
1
$75,920
FILES CLOSED FOR INCOMPLETENESS
0
$0
1
$199,800
6
$149,850
0
$0
0
$0
0
$0
Aggregated Statistics For Year 2000 (Based on 1 full tract)
A) FHA, FSA/RHS & VA Home Purchase Loans
B) Conventional Home Purchase Loans
C) Refinancings
D) Home Improvement Loans
E) Loans on Dwellings For 5+ Families
F) Non-occupant Loans on < 5 Family Dwellings (A B C & D)
Number
Average Value
Number
Average Value
Number
Average Value
Number
Average Value
Number
Average Value
Number
Average Value
LOANS ORIGINATED
4
$181,818
47
$193,083
28
$125,446
15
$37,695
2
$66,935
4
$86,165
APPLICATIONS APPROVED, NOT ACCEPTED
1
$193,810
3
$44,623
10
$139,361
2
$42,955
0
$0
1
$16,980
APPLICATIONS DENIED
1
$183,820
13
$127,104
16
$91,533
6
$16,650
1
$229,770
1
$133,870
APPLICATIONS WITHDRAWN
3
$183,150
5
$131,268
21
$163,455
2
$19,980
0
$0
0
$0
FILES CLOSED FOR INCOMPLETENESS
0
$0
3
$242,757
7
$154,131
0
$0
0
$0
0
$0
Aggregated Statistics For Year 1999 (Based on 1 full and 1 partial tracts)
A) FHA, FSA/RHS & VA Home Purchase Loans
B) Conventional Home Purchase Loans
C) Refinancings
D) Home Improvement Loans
E) Loans on Dwellings For 5+ Families
F) Non-occupant Loans on < 5 Family Dwellings (A B C & D)
Detailed PMIC statistics for the following Tracts:0101.02
, 0102.00
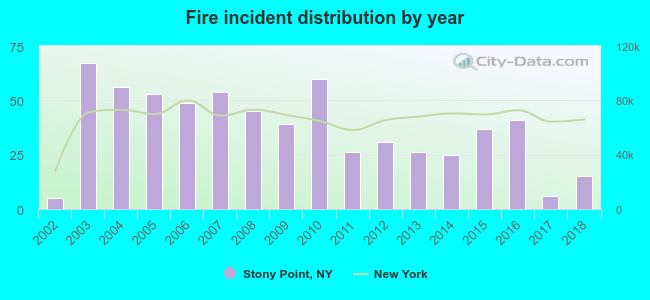
2002 - 2018 National Fire Incident Reporting System (NFIRS) incidents
Based on the data from the years 2002 - 2018 the average number of fires per year is 37. The highest number of reported fires - 67 took place in 2003, and the least - 5 in 2002. The data has an increasing trend.
When looking into fire subcategories, the most incidents belonged to: Structure Fires (54.2%), and Outside Fires (27.1%).
Fire incident types reported to NFIRS in Stony Point, NY
#24 on the list of "Top 101 cities with the most residents born in Barbados (population 500+)"
#52 on the list of "Top 101 cities with the most residents born in Portugal (population 500+)"
#57 on the list of "Top 101 cities with largest percentage of males in industries: broadcasting, internet publishing, and telecommunications services (population 5,000+)"
#57 on the list of "Top 101 cities with largest percentage of females in industries: broadcasting, internet publishing, and telecommunications services (population 5,000+)"
#57 on the list of "Top 101 cities with largest percentage of males in industries: wholesale electronic markets and agents and brokers (population 5,000+)"
#57 on the list of "Top 101 cities with largest percentage of females in industries: wholesale electronic markets and agents and brokers (population 5,000+)"
#59 on the list of "Top 101 cities with largest percentage of females in occupations: extraction workers (population 5,000+)"
#61 on the list of "Top 101 cities with the largest racial income disparity between any two races with at least 200 householders"
#92 on the list of "Top 101 cities with the most residents born in Southern Europe (population 500+)"
#93 on the list of "Top 101 cities with the most residents born in Greece (population 500+)"
#19 on the list of "Top 101 counties with the lowest number of infant deaths per 1000 residents 2007-2013 (pop. 50,000+)"
#32 on the list of "Top 101 counties with the most Other adherents"
#33 on the list of "Top 101 counties with the most Orthodox congregations"
#34 on the list of "Top 101 counties with the most Other congregations"
#45 on the list of "Top 101 counties with the lowest percentage of residents relocating from other counties between 2010 and 2011 (pop. 50,000+)"


 Recent articles from our blog. Our writers, many of them Ph.D. graduates or candidates, create easy-to-read articles on a wide variety of topics.

 (7.0 miles


 Based on the data from the years 2002 - 2018 the average number of fires per year is 37. The highest number of reported fires - 67 took place in 2003, and the least - 5 in 2002. The data has an increasing trend.
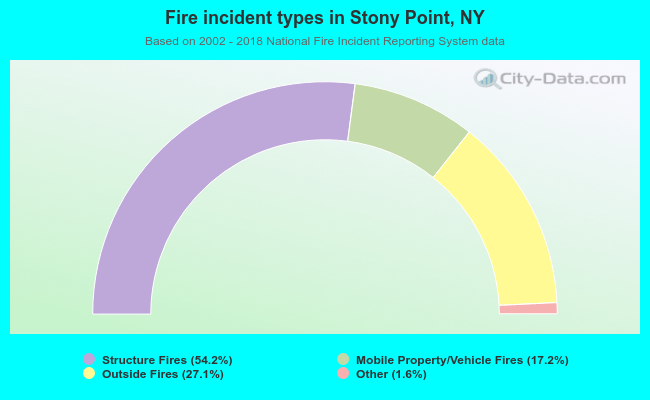 When looking into fire subcategories, the most incidents belonged to: Structure Fires (54.2%), and Outside Fires (27.1%).