Tarrant, Alabama Submit your own pictures of this city and show them to the world
OSM Map
General Map
Google Map
MSN Map
OSM Map
General Map
Google Map
MSN Map
OSM Map
General Map
Google Map
MSN Map
OSM Map
General Map
Google Map
MSN Map
Please wait while loading the map...
Population in 2022: 5,910 (98% urban, 2% rural). Population change since 2000: -15.8%Males: 2,869 Females: 3,041
March 2022 cost of living index in Tarrant: 86.3 (less than average, U.S. average is 100) Percentage of residents living in poverty in 2022: 28.6%for White Non-Hispanic residents , 30.2% for Black residents , 20.0% for Hispanic or Latino residents , 100.0% for American Indian residents , 12.1% for other race residents )Business Search - 14 Million verified businesses
Data:
Median household income ($)
Median household income (% change since 2000)
Household income diversity
Ratio of average income to average house value (%)
Ratio of average income to average rent
Median household income ($) - White
Median household income ($) - Black or African American
Median household income ($) - Asian
Median household income ($) - Hispanic or Latino
Median household income ($) - American Indian and Alaska Native
Median household income ($) - Multirace
Median household income ($) - Other Race
Median household income for houses/condos with a mortgage ($)
Median household income for apartments without a mortgage ($)
Races - White alone (%)
Races - White alone (% change since 2000)
Races - Black alone (%)
Races - Black alone (% change since 2000)
Races - American Indian alone (%)
Races - American Indian alone (% change since 2000)
Races - Asian alone (%)
Races - Asian alone (% change since 2000)
Races - Hispanic (%)
Races - Hispanic (% change since 2000)
Races - Native Hawaiian and Other Pacific Islander alone (%)
Races - Native Hawaiian and Other Pacific Islander alone (% change since 2000)
Races - Two or more races (%)
Races - Two or more races (% change since 2000)
Races - Other race alone (%)
Races - Other race alone (% change since 2000)
Racial diversity
Unemployment (%)
Unemployment (% change since 2000)
Unemployment (%) - White
Unemployment (%) - Black or African American
Unemployment (%) - Asian
Unemployment (%) - Hispanic or Latino
Unemployment (%) - American Indian and Alaska Native
Unemployment (%) - Multirace
Unemployment (%) - Other Race
Population density (people per square mile)
Population - Males (%)
Population - Females (%)
Population - Males (%) - White
Population - Males (%) - Black or African American
Population - Males (%) - Asian
Population - Males (%) - Hispanic or Latino
Population - Males (%) - American Indian and Alaska Native
Population - Males (%) - Multirace
Population - Males (%) - Other Race
Population - Females (%) - White
Population - Females (%) - Black or African American
Population - Females (%) - Asian
Population - Females (%) - Hispanic or Latino
Population - Females (%) - American Indian and Alaska Native
Population - Females (%) - Multirace
Population - Females (%) - Other Race
Coronavirus confirmed cases (Jun 15, 2024)
Deaths caused by coronavirus (Jun 15, 2024)
Coronavirus confirmed cases (per 100k population) (Jun 15, 2024)
Deaths caused by coronavirus (per 100k population) (Jun 15, 2024)
Daily increase in number of cases (Jun 15, 2024)
Weekly increase in number of cases (Jun 15, 2024)
Cases doubled (in days) (Jun 15, 2024)
Hospitalized patients (Apr 18, 2022)
Negative test results (Apr 18, 2022)
Total test results (Apr 18, 2022)
COVID Vaccine doses distributed (per 100k population) (Sep 19, 2023)
COVID Vaccine doses administered (per 100k population) (Sep 19, 2023)
COVID Vaccine doses distributed (Sep 19, 2023)
COVID Vaccine doses administered (Sep 19, 2023)
Likely homosexual households (%)
Likely homosexual households (% change since 2000)
Likely homosexual households - Lesbian couples (%)
Likely homosexual households - Lesbian couples (% change since 2000)
Likely homosexual households - Gay men (%)
Likely homosexual households - Gay men (% change since 2000)
Cost of living index
Median gross rent ($)
Median contract rent ($)
Median monthly housing costs ($)
Median house or condo value ($)
Median house or condo value ($ change since 2000)
Mean house or condo value by units in structure - 1, detached ($)
Mean house or condo value by units in structure - 1, attached ($)
Mean house or condo value by units in structure - 2 ($)
Mean house or condo value by units in structure by units in structure - 3 or 4 ($)
Mean house or condo value by units in structure - 5 or more ($)
Mean house or condo value by units in structure - Boat, RV, van, etc. ($)
Mean house or condo value by units in structure - Mobile home ($)
Median house or condo value ($) - White
Median house or condo value ($) - Black or African American
Median house or condo value ($) - Asian
Median house or condo value ($) - Hispanic or Latino
Median house or condo value ($) - American Indian and Alaska Native
Median house or condo value ($) - Multirace
Median house or condo value ($) - Other Race
Median resident age
Resident age diversity
Median resident age - Males
Median resident age - Females
Median resident age - White
Median resident age - Black or African American
Median resident age - Asian
Median resident age - Hispanic or Latino
Median resident age - American Indian and Alaska Native
Median resident age - Multirace
Median resident age - Other Race
Median resident age - Males - White
Median resident age - Males - Black or African American
Median resident age - Males - Asian
Median resident age - Males - Hispanic or Latino
Median resident age - Males - American Indian and Alaska Native
Median resident age - Males - Multirace
Median resident age - Males - Other Race
Median resident age - Females - White
Median resident age - Females - Black or African American
Median resident age - Females - Asian
Median resident age - Females - Hispanic or Latino
Median resident age - Females - American Indian and Alaska Native
Median resident age - Females - Multirace
Median resident age - Females - Other Race
Commute - mean travel time to work (minutes)
Travel time to work - Less than 5 minutes (%)
Travel time to work - Less than 5 minutes (% change since 2000)
Travel time to work - 5 to 9 minutes (%)
Travel time to work - 5 to 9 minutes (% change since 2000)
Travel time to work - 10 to 19 minutes (%)
Travel time to work - 10 to 19 minutes (% change since 2000)
Travel time to work - 20 to 29 minutes (%)
Travel time to work - 20 to 29 minutes (% change since 2000)
Travel time to work - 30 to 39 minutes (%)
Travel time to work - 30 to 39 minutes (% change since 2000)
Travel time to work - 40 to 59 minutes (%)
Travel time to work - 40 to 59 minutes (% change since 2000)
Travel time to work - 60 to 89 minutes (%)
Travel time to work - 60 to 89 minutes (% change since 2000)
Travel time to work - 90 or more minutes (%)
Travel time to work - 90 or more minutes (% change since 2000)
Marital status - Never married (%)
Marital status - Now married (%)
Marital status - Separated (%)
Marital status - Widowed (%)
Marital status - Divorced (%)
Median family income ($)
Median family income (% change since 2000)
Median non-family income ($)
Median non-family income (% change since 2000)
Median per capita income ($)
Median per capita income (% change since 2000)
Median family income ($) - White
Median family income ($) - Black or African American
Median family income ($) - Asian
Median family income ($) - Hispanic or Latino
Median family income ($) - American Indian and Alaska Native
Median family income ($) - Multirace
Median family income ($) - Other Race
Median year house/condo built
Median year apartment built
Year house built - Built 2005 or later (%)
Year house built - Built 2000 to 2004 (%)
Year house built - Built 1990 to 1999 (%)
Year house built - Built 1980 to 1989 (%)
Year house built - Built 1970 to 1979 (%)
Year house built - Built 1960 to 1969 (%)
Year house built - Built 1950 to 1959 (%)
Year house built - Built 1940 to 1949 (%)
Year house built - Built 1939 or earlier (%)
Average household size
Household density (households per square mile)
Average household size - White
Average household size - Black or African American
Average household size - Asian
Average household size - Hispanic or Latino
Average household size - American Indian and Alaska Native
Average household size - Multirace
Average household size - Other Race
Occupied housing units (%)
Vacant housing units (%)
Owner occupied housing units (%)
Renter occupied housing units (%)
Vacancy status - For rent (%)
Vacancy status - For sale only (%)
Vacancy status - Rented or sold, not occupied (%)
Vacancy status - For seasonal, recreational, or occasional use (%)
Vacancy status - For migrant workers (%)
Vacancy status - Other vacant (%)
Residents with income below the poverty level (%)
Residents with income below 50% of the poverty level (%)
Children below poverty level (%)
Poor families by family type - Married-couple family (%)
Poor families by family type - Male, no wife present (%)
Poor families by family type - Female, no husband present (%)
Poverty status for native-born residents (%)
Poverty status for foreign-born residents (%)
Poverty among high school graduates not in families (%)
Poverty among people who did not graduate high school not in families (%)
Residents with income below the poverty level (%) - White
Residents with income below the poverty level (%) - Black or African American
Residents with income below the poverty level (%) - Asian
Residents with income below the poverty level (%) - Hispanic or Latino
Residents with income below the poverty level (%) - American Indian and Alaska Native
Residents with income below the poverty level (%) - Multirace
Residents with income below the poverty level (%) - Other Race
Air pollution - Air Quality Index (AQI)
Air pollution - CO
Air pollution - NO2
Air pollution - SO2
Air pollution - Ozone
Air pollution - PM10
Air pollution - PM25
Air pollution - Pb
Crime - Murders per 100,000 population
Crime - Rapes per 100,000 population
Crime - Robberies per 100,000 population
Crime - Assaults per 100,000 population
Crime - Burglaries per 100,000 population
Crime - Thefts per 100,000 population
Crime - Auto thefts per 100,000 population
Crime - Arson per 100,000 population
Crime - City-data.com crime index
Crime - Violent crime index
Crime - Property crime index
Crime - Murders per 100,000 population (5 year average)
Crime - Rapes per 100,000 population (5 year average)
Crime - Robberies per 100,000 population (5 year average)
Crime - Assaults per 100,000 population (5 year average)
Crime - Burglaries per 100,000 population (5 year average)
Crime - Thefts per 100,000 population (5 year average)
Crime - Auto thefts per 100,000 population (5 year average)
Crime - Arson per 100,000 population (5 year average)
Crime - City-data.com crime index (5 year average)
Crime - Violent crime index (5 year average)
Crime - Property crime index (5 year average)
1996 Presidential Elections Results (%) - Democratic Party (Clinton)
1996 Presidential Elections Results (%) - Republican Party (Dole)
1996 Presidential Elections Results (%) - Other
2000 Presidential Elections Results (%) - Democratic Party (Gore)
2000 Presidential Elections Results (%) - Republican Party (Bush)
2000 Presidential Elections Results (%) - Other
2004 Presidential Elections Results (%) - Democratic Party (Kerry)
2004 Presidential Elections Results (%) - Republican Party (Bush)
2004 Presidential Elections Results (%) - Other
2008 Presidential Elections Results (%) - Democratic Party (Obama)
2008 Presidential Elections Results (%) - Republican Party (McCain)
2008 Presidential Elections Results (%) - Other
2012 Presidential Elections Results (%) - Democratic Party (Obama)
2012 Presidential Elections Results (%) - Republican Party (Romney)
2012 Presidential Elections Results (%) - Other
2016 Presidential Elections Results (%) - Democratic Party (Clinton)
2016 Presidential Elections Results (%) - Republican Party (Trump)
2016 Presidential Elections Results (%) - Other
2020 Presidential Elections Results (%) - Democratic Party (Biden)
2020 Presidential Elections Results (%) - Republican Party (Trump)
2020 Presidential Elections Results (%) - Other
Ancestries Reported - Arab (%)
Ancestries Reported - Czech (%)
Ancestries Reported - Danish (%)
Ancestries Reported - Dutch (%)
Ancestries Reported - English (%)
Ancestries Reported - French (%)
Ancestries Reported - French Canadian (%)
Ancestries Reported - German (%)
Ancestries Reported - Greek (%)
Ancestries Reported - Hungarian (%)
Ancestries Reported - Irish (%)
Ancestries Reported - Italian (%)
Ancestries Reported - Lithuanian (%)
Ancestries Reported - Norwegian (%)
Ancestries Reported - Polish (%)
Ancestries Reported - Portuguese (%)
Ancestries Reported - Russian (%)
Ancestries Reported - Scotch-Irish (%)
Ancestries Reported - Scottish (%)
Ancestries Reported - Slovak (%)
Ancestries Reported - Subsaharan African (%)
Ancestries Reported - Swedish (%)
Ancestries Reported - Swiss (%)
Ancestries Reported - Ukrainian (%)
Ancestries Reported - United States (%)
Ancestries Reported - Welsh (%)
Ancestries Reported - West Indian (%)
Ancestries Reported - Other (%)
Educational Attainment - No schooling completed (%)
Educational Attainment - Less than high school (%)
Educational Attainment - High school or equivalent (%)
Educational Attainment - Less than 1 year of college (%)
Educational Attainment - 1 or more years of college (%)
Educational Attainment - Associate degree (%)
Educational Attainment - Bachelor's degree (%)
Educational Attainment - Master's degree (%)
Educational Attainment - Professional school degree (%)
Educational Attainment - Doctorate degree (%)
School Enrollment - Nursery, preschool (%)
School Enrollment - Kindergarten (%)
School Enrollment - Grade 1 to 4 (%)
School Enrollment - Grade 5 to 8 (%)
School Enrollment - Grade 9 to 12 (%)
School Enrollment - College undergrad (%)
School Enrollment - Graduate or professional (%)
School Enrollment - Not enrolled in school (%)
School enrollment - Public schools (%)
School enrollment - Private schools (%)
School enrollment - Not enrolled (%)
Median number of rooms in houses and condos
Median number of rooms in apartments
Housing units lacking complete plumbing facilities (%)
Housing units lacking complete kitchen facilities (%)
Density of houses
Urban houses (%)
Rural houses (%)
Households with people 60 years and over (%)
Households with people 65 years and over (%)
Households with people 75 years and over (%)
Households with one or more nonrelatives (%)
Households with no nonrelatives (%)
Population in households (%)
Family households (%)
Nonfamily households (%)
Population in families (%)
Family households with own children (%)
Median number of bedrooms in owner occupied houses
Mean number of bedrooms in owner occupied houses
Median number of bedrooms in renter occupied houses
Mean number of bedrooms in renter occupied houses
Median number of vehichles in owner occupied houses
Mean number of vehichles in owner occupied houses
Median number of vehichles in renter occupied houses
Mean number of vehichles in renter occupied houses
Mortgage status - with mortgage (%)
Mortgage status - with second mortgage (%)
Mortgage status - with home equity loan (%)
Mortgage status - with both second mortgage and home equity loan (%)
Mortgage status - without a mortgage (%)
Average family size
Average family size - White
Average family size - Black or African American
Average family size - Asian
Average family size - Hispanic or Latino
Average family size - American Indian and Alaska Native
Average family size - Multirace
Average family size - Other Race
Geographical mobility - Same house 1 year ago (%)
Geographical mobility - Moved within same county (%)
Geographical mobility - Moved from different county within same state (%)
Geographical mobility - Moved from different state (%)
Geographical mobility - Moved from abroad (%)
Place of birth - Born in state of residence (%)
Place of birth - Born in other state (%)
Place of birth - Native, outside of US (%)
Place of birth - Foreign born (%)
Housing units in structures - 1, detached (%)
Housing units in structures - 1, attached (%)
Housing units in structures - 2 (%)
Housing units in structures - 3 or 4 (%)
Housing units in structures - 5 to 9 (%)
Housing units in structures - 10 to 19 (%)
Housing units in structures - 20 to 49 (%)
Housing units in structures - 50 or more (%)
Housing units in structures - Mobile home (%)
Housing units in structures - Boat, RV, van, etc. (%)
House/condo owner moved in on average (years ago)
Renter moved in on average (years ago)
Year householder moved into unit - Moved in 1999 to March 2000 (%)
Year householder moved into unit - Moved in 1995 to 1998 (%)
Year householder moved into unit - Moved in 1990 to 1994 (%)
Year householder moved into unit - Moved in 1980 to 1989 (%)
Year householder moved into unit - Moved in 1970 to 1979 (%)
Year householder moved into unit - Moved in 1969 or earlier (%)
Means of transportation to work - Drove car alone (%)
Means of transportation to work - Carpooled (%)
Means of transportation to work - Public transportation (%)
Means of transportation to work - Bus or trolley bus (%)
Means of transportation to work - Streetcar or trolley car (%)
Means of transportation to work - Subway or elevated (%)
Means of transportation to work - Railroad (%)
Means of transportation to work - Ferryboat (%)
Means of transportation to work - Taxicab (%)
Means of transportation to work - Motorcycle (%)
Means of transportation to work - Bicycle (%)
Means of transportation to work - Walked (%)
Means of transportation to work - Other means (%)
Working at home (%)
Industry diversity
Most Common Industries - Agriculture, forestry, fishing and hunting, and mining (%)
Most Common Industries - Agriculture, forestry, fishing and hunting (%)
Most Common Industries - Mining, quarrying, and oil and gas extraction (%)
Most Common Industries - Construction (%)
Most Common Industries - Manufacturing (%)
Most Common Industries - Wholesale trade (%)
Most Common Industries - Retail trade (%)
Most Common Industries - Transportation and warehousing, and utilities (%)
Most Common Industries - Transportation and warehousing (%)
Most Common Industries - Utilities (%)
Most Common Industries - Information (%)
Most Common Industries - Finance and insurance, and real estate and rental and leasing (%)
Most Common Industries - Finance and insurance (%)
Most Common Industries - Real estate and rental and leasing (%)
Most Common Industries - Professional, scientific, and management, and administrative and waste management services (%)
Most Common Industries - Professional, scientific, and technical services (%)
Most Common Industries - Management of companies and enterprises (%)
Most Common Industries - Administrative and support and waste management services (%)
Most Common Industries - Educational services, and health care and social assistance (%)
Most Common Industries - Educational services (%)
Most Common Industries - Health care and social assistance (%)
Most Common Industries - Arts, entertainment, and recreation, and accommodation and food services (%)
Most Common Industries - Arts, entertainment, and recreation (%)
Most Common Industries - Accommodation and food services (%)
Most Common Industries - Other services, except public administration (%)
Most Common Industries - Public administration (%)
Occupation diversity
Most Common Occupations - Management, business, science, and arts occupations (%)
Most Common Occupations - Management, business, and financial occupations (%)
Most Common Occupations - Management occupations (%)
Most Common Occupations - Business and financial operations occupations (%)
Most Common Occupations - Computer, engineering, and science occupations (%)
Most Common Occupations - Computer and mathematical occupations (%)
Most Common Occupations - Architecture and engineering occupations (%)
Most Common Occupations - Life, physical, and social science occupations (%)
Most Common Occupations - Education, legal, community service, arts, and media occupations (%)
Most Common Occupations - Community and social service occupations (%)
Most Common Occupations - Legal occupations (%)
Most Common Occupations - Education, training, and library occupations (%)
Most Common Occupations - Arts, design, entertainment, sports, and media occupations (%)
Most Common Occupations - Healthcare practitioners and technical occupations (%)
Most Common Occupations - Health diagnosing and treating practitioners and other technical occupations (%)
Most Common Occupations - Health technologists and technicians (%)
Most Common Occupations - Service occupations (%)
Most Common Occupations - Healthcare support occupations (%)
Most Common Occupations - Protective service occupations (%)
Most Common Occupations - Fire fighting and prevention, and other protective service workers including supervisors (%)
Most Common Occupations - Law enforcement workers including supervisors (%)
Most Common Occupations - Food preparation and serving related occupations (%)
Most Common Occupations - Building and grounds cleaning and maintenance occupations (%)
Most Common Occupations - Personal care and service occupations (%)
Most Common Occupations - Sales and office occupations (%)
Most Common Occupations - Sales and related occupations (%)
Most Common Occupations - Office and administrative support occupations (%)
Most Common Occupations - Natural resources, construction, and maintenance occupations (%)
Most Common Occupations - Farming, fishing, and forestry occupations (%)
Most Common Occupations - Construction and extraction occupations (%)
Most Common Occupations - Installation, maintenance, and repair occupations (%)
Most Common Occupations - Production, transportation, and material moving occupations (%)
Most Common Occupations - Production occupations (%)
Most Common Occupations - Transportation occupations (%)
Most Common Occupations - Material moving occupations (%)
People in Group quarters - Institutionalized population (%)
People in Group quarters - Correctional institutions (%)
People in Group quarters - Federal prisons and detention centers (%)
People in Group quarters - Halfway houses (%)
People in Group quarters - Local jails and other confinement facilities (including police lockups) (%)
People in Group quarters - Military disciplinary barracks (%)
People in Group quarters - State prisons (%)
People in Group quarters - Other types of correctional institutions (%)
People in Group quarters - Nursing homes (%)
People in Group quarters - Hospitals/wards, hospices, and schools for the handicapped (%)
People in Group quarters - Hospitals/wards and hospices for chronically ill (%)
People in Group quarters - Hospices or homes for chronically ill (%)
People in Group quarters - Military hospitals or wards for chronically ill (%)
People in Group quarters - Other hospitals or wards for chronically ill (%)
People in Group quarters - Hospitals or wards for drug/alcohol abuse (%)
People in Group quarters - Mental (Psychiatric) hospitals or wards (%)
People in Group quarters - Schools, hospitals, or wards for the mentally retarded (%)
People in Group quarters - Schools, hospitals, or wards for the physically handicapped (%)
People in Group quarters - Institutions for the deaf (%)
People in Group quarters - Institutions for the blind (%)
People in Group quarters - Orthopedic wards and institutions for the physically handicapped (%)
People in Group quarters - Wards in general hospitals for patients who have no usual home elsewhere (%)
People in Group quarters - Wards in military hospitals for patients who have no usual home elsewhere (%)
People in Group quarters - Juvenile institutions (%)
People in Group quarters - Long-term care (%)
People in Group quarters - Homes for abused, dependent, and neglected children (%)
People in Group quarters - Residential treatment centers for emotionally disturbed children (%)
People in Group quarters - Training schools for juvenile delinquents (%)
People in Group quarters - Short-term care, detention or diagnostic centers for delinquent children (%)
People in Group quarters - Type of juvenile institution unknown (%)
People in Group quarters - Noninstitutionalized population (%)
People in Group quarters - College dormitories (includes college quarters off campus) (%)
People in Group quarters - Military quarters (%)
People in Group quarters - On base (%)
People in Group quarters - Barracks, unaccompanied personnel housing (UPH), (Enlisted/Officer), ;and similar group living quarters for military personnel (%)
People in Group quarters - Transient quarters for temporary residents (%)
People in Group quarters - Military ships (%)
People in Group quarters - Group homes (%)
People in Group quarters - Homes or halfway houses for drug/alcohol abuse (%)
People in Group quarters - Homes for the mentally ill (%)
People in Group quarters - Homes for the mentally retarded (%)
People in Group quarters - Homes for the physically handicapped (%)
People in Group quarters - Other group homes (%)
People in Group quarters - Religious group quarters (%)
People in Group quarters - Dormitories (%)
People in Group quarters - Agriculture workers' dormitories on farms (%)
People in Group quarters - Job Corps and vocational training facilities (%)
People in Group quarters - Other workers' dormitories (%)
People in Group quarters - Crews of maritime vessels (%)
People in Group quarters - Other nonhousehold living situations (%)
People in Group quarters - Other noninstitutional group quarters (%)
Residents speaking English at home (%)
Residents speaking English at home - Born in the United States (%)
Residents speaking English at home - Native, born elsewhere (%)
Residents speaking English at home - Foreign born (%)
Residents speaking Spanish at home (%)
Residents speaking Spanish at home - Born in the United States (%)
Residents speaking Spanish at home - Native, born elsewhere (%)
Residents speaking Spanish at home - Foreign born (%)
Residents speaking other language at home (%)
Residents speaking other language at home - Born in the United States (%)
Residents speaking other language at home - Native, born elsewhere (%)
Residents speaking other language at home - Foreign born (%)
Class of Workers - Employee of private company (%)
Class of Workers - Self-employed in own incorporated business (%)
Class of Workers - Private not-for-profit wage and salary workers (%)
Class of Workers - Local government workers (%)
Class of Workers - State government workers (%)
Class of Workers - Federal government workers (%)
Class of Workers - Self-employed workers in own not incorporated business and Unpaid family workers (%)
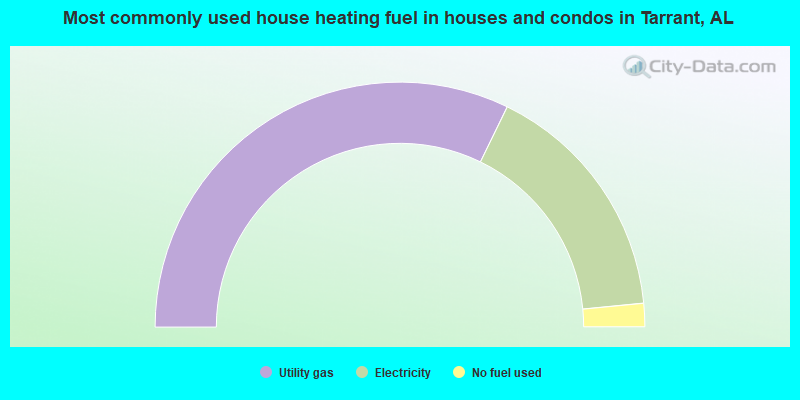
House heating fuel used in houses and condos - Utility gas (%)
House heating fuel used in houses and condos - Bottled, tank, or LP gas (%)
House heating fuel used in houses and condos - Electricity (%)
House heating fuel used in houses and condos - Fuel oil, kerosene, etc. (%)
House heating fuel used in houses and condos - Coal or coke (%)
House heating fuel used in houses and condos - Wood (%)
House heating fuel used in houses and condos - Solar energy (%)
House heating fuel used in houses and condos - Other fuel (%)
House heating fuel used in houses and condos - No fuel used (%)
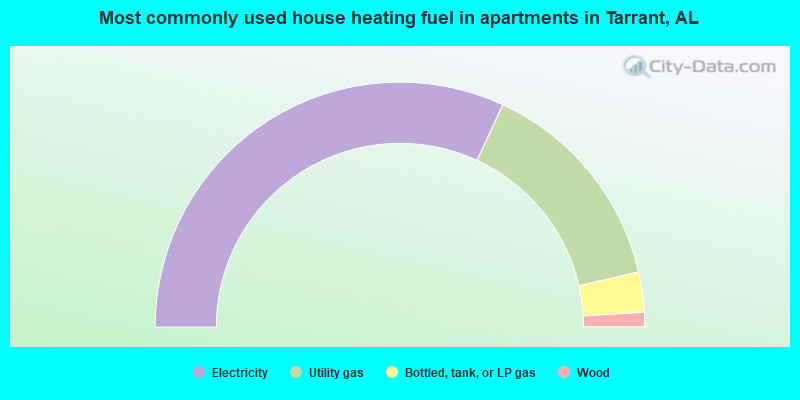
House heating fuel used in apartments - Utility gas (%)
House heating fuel used in apartments - Bottled, tank, or LP gas (%)
House heating fuel used in apartments - Electricity (%)
House heating fuel used in apartments - Fuel oil, kerosene, etc. (%)
House heating fuel used in apartments - Coal or coke (%)
House heating fuel used in apartments - Wood (%)
House heating fuel used in apartments - Solar energy (%)
House heating fuel used in apartments - Other fuel (%)
House heating fuel used in apartments - No fuel used (%)
Armed forces status - In Armed Forces (%)
Armed forces status - Civilian (%)
Armed forces status - Civilian - Veteran (%)
Armed forces status - Civilian - Nonveteran (%)
Fatal accidents locations in years 2005-2021
Fatal accidents locations in 2005
Fatal accidents locations in 2006
Fatal accidents locations in 2007
Fatal accidents locations in 2008
Fatal accidents locations in 2009
Fatal accidents locations in 2010
Fatal accidents locations in 2011
Fatal accidents locations in 2012
Fatal accidents locations in 2013
Fatal accidents locations in 2014
Fatal accidents locations in 2015
Fatal accidents locations in 2016
Fatal accidents locations in 2017
Fatal accidents locations in 2018
Fatal accidents locations in 2019
Fatal accidents locations in 2020
Fatal accidents locations in 2021
Alcohol use - People drinking some alcohol every month (%)
Alcohol use - People not drinking at all (%)
Alcohol use - Average days/month drinking alcohol
Alcohol use - Average drinks/week
Alcohol use - Average days/year people drink much
Audiometry - Average condition of hearing (%)
Audiometry - People that can hear a whisper from across a quiet room (%)
Audiometry - People that can hear normal voice from across a quiet room (%)
Audiometry - Ears ringing, roaring, buzzing (%)
Audiometry - Had a job exposure to loud noise (%)
Audiometry - Had off-work exposure to loud noise (%)
Blood Pressure & Cholesterol - Has high blood pressure (%)
Blood Pressure & Cholesterol - Checking blood pressure at home (%)
Blood Pressure & Cholesterol - Frequently checking blood cholesterol (%)
Blood Pressure & Cholesterol - Has high cholesterol level (%)
Consumer Behavior - Money monthly spent on food at supermarket/grocery store
Consumer Behavior - Money monthly spent on food at other stores
Consumer Behavior - Money monthly spent on eating out
Consumer Behavior - Money monthly spent on carryout/delivered foods
Consumer Behavior - Income spent on food at supermarket/grocery store (%)
Consumer Behavior - Income spent on food at other stores (%)
Consumer Behavior - Income spent on eating out (%)
Consumer Behavior - Income spent on carryout/delivered foods (%)
Current Health Status - General health condition (%)
Current Health Status - Blood donors (%)
Current Health Status - Has blood ever tested for HIV virus (%)
Current Health Status - Left-handed people (%)
Dermatology - People using sunscreen (%)
Diabetes - Diabetics (%)
Diabetes - Had a blood test for high blood sugar (%)
Diabetes - People taking insulin (%)
Diet Behavior & Nutrition - Diet health (%)
Diet Behavior & Nutrition - Milk product consumption (# of products/month)
Diet Behavior & Nutrition - Meals not home prepared (#/week)
Diet Behavior & Nutrition - Meals from fast food or pizza place (#/week)
Diet Behavior & Nutrition - Ready-to-eat foods (#/month)
Diet Behavior & Nutrition - Frozen meals/pizza (#/month)
Drug Use - People that ever used marijuana or hashish (%)
Drug Use - Ever used hard drugs (%)
Drug Use - Ever used any form of cocaine (%)
Drug Use - Ever used heroin (%)
Drug Use - Ever used methamphetamine (%)
Health Insurance - People covered by health insurance (%)
Kidney Conditions-Urology - Avg. # of times urinating at night
Medical Conditions - People with asthma (%)
Medical Conditions - People with anemia (%)
Medical Conditions - People with psoriasis (%)
Medical Conditions - People with overweight (%)
Medical Conditions - Elderly people having difficulties in thinking or remembering (%)
Medical Conditions - People who ever received blood transfusion (%)
Medical Conditions - People having trouble seeing even with glass/contacts (%)
Medical Conditions - People with arthritis (%)
Medical Conditions - People with gout (%)
Medical Conditions - People with congestive heart failure (%)
Medical Conditions - People with coronary heart disease (%)
Medical Conditions - People with angina pectoris (%)
Medical Conditions - People who ever had heart attack (%)
Medical Conditions - People who ever had stroke (%)
Medical Conditions - People with emphysema (%)
Medical Conditions - People with thyroid problem (%)
Medical Conditions - People with chronic bronchitis (%)
Medical Conditions - People with any liver condition (%)
Medical Conditions - People who ever had cancer or malignancy (%)
Mental Health - People who have little interest in doing things (%)
Mental Health - People feeling down, depressed, or hopeless (%)
Mental Health - People who have trouble sleeping or sleeping too much (%)
Mental Health - People feeling tired or having little energy (%)
Mental Health - People with poor appetite or overeating (%)
Mental Health - People feeling bad about themself (%)
Mental Health - People who have trouble concentrating on things (%)
Mental Health - People moving or speaking slowly or too fast (%)
Mental Health - People having thoughts they would be better off dead (%)
Oral Health - Average years since last visit a dentist
Oral Health - People embarrassed because of mouth (%)
Oral Health - People with gum disease (%)
Oral Health - General health of teeth and gums (%)
Oral Health - Average days a week using dental floss/device
Oral Health - Average days a week using mouthwash for dental problem
Oral Health - Average number of teeth
Pesticide Use - Households using pesticides to control insects (%)
Pesticide Use - Households using pesticides to kill weeds (%)
Physical Activity - People doing vigorous-intensity work activities (%)
Physical Activity - People doing moderate-intensity work activities (%)
Physical Activity - People walking or bicycling (%)
Physical Activity - People doing vigorous-intensity recreational activities (%)
Physical Activity - People doing moderate-intensity recreational activities (%)
Physical Activity - Average hours a day doing sedentary activities
Physical Activity - Average hours a day watching TV or videos
Physical Activity - Average hours a day using computer
Physical Functioning - People having limitations keeping them from working (%)
Physical Functioning - People limited in amount of work they can do (%)
Physical Functioning - People that need special equipment to walk (%)
Physical Functioning - People experiencing confusion/memory problems (%)
Physical Functioning - People requiring special healthcare equipment (%)
Prescription Medications - Average number of prescription medicines taking
Preventive Aspirin Use - Adults 40+ taking low-dose aspirin (%)
Reproductive Health - Vaginal deliveries (%)
Reproductive Health - Cesarean deliveries (%)
Reproductive Health - Deliveries resulted in a live birth (%)
Reproductive Health - Pregnancies resulted in a delivery (%)
Reproductive Health - Women breastfeeding newborns (%)
Reproductive Health - Women that had a hysterectomy (%)
Reproductive Health - Women that had both ovaries removed (%)
Reproductive Health - Women that have ever taken birth control pills (%)
Reproductive Health - Women taking birth control pills (%)
Reproductive Health - Women that have ever used Depo-Provera or injectables (%)
Reproductive Health - Women that have ever used female hormones (%)
Sexual Behavior - People 18+ that ever had sex (vaginal, anal, or oral) (%)
Sexual Behavior - Males 18+ that ever had vaginal sex with a woman (%)
Sexual Behavior - Males 18+ that ever performed oral sex on a woman (%)
Sexual Behavior - Males 18+ that ever had anal sex with a woman (%)
Sexual Behavior - Males 18+ that ever had any sex with a man (%)
Sexual Behavior - Females 18+ that ever had vaginal sex with a man (%)
Sexual Behavior - Females 18+ that ever performed oral sex on a man (%)
Sexual Behavior - Females 18+ that ever had anal sex with a man (%)
Sexual Behavior - Females 18+ that ever had any kind of sex with a woman (%)
Sexual Behavior - Average age people first had sex
Sexual Behavior - Average number of female sex partners in lifetime (males 18+)
Sexual Behavior - Average number of female vaginal sex partners in lifetime (males 18+)
Sexual Behavior - Average age people first performed oral sex on a woman (18+)
Sexual Behavior - Average number of woman performed oral sex on in lifetime (18+)
Sexual Behavior - Average number of male sex partners in lifetime (males 18+)
Sexual Behavior - Average number of male anal sex partners in lifetime (males 18+)
Sexual Behavior - Average age people first performed oral sex on a man (18+)
Sexual Behavior - Average number of male oral sex partners in lifetime (18+)
Sexual Behavior - People using protection when performing oral sex (%)
Sexual Behavior - Average number of times people have vaginal or anal sex a year
Sexual Behavior - People having sex without condom (%)
Sexual Behavior - Average number of male sex partners in lifetime (females 18+)
Sexual Behavior - Average number of male vaginal sex partners in lifetime (females 18+)
Sexual Behavior - Average number of female sex partners in lifetime (females 18+)
Sexual Behavior - Circumcised males 18+ (%)
Sleep Disorders - Average hours sleeping at night
Sleep Disorders - People that has trouble sleeping (%)
Smoking-Cigarette Use - People smoking cigarettes (%)
Taste & Smell - People 40+ having problems with smell (%)
Taste & Smell - People 40+ having problems with taste (%)
Taste & Smell - People 40+ that ever had wisdom teeth removed (%)
Taste & Smell - People 40+ that ever had tonsils teeth removed (%)
Taste & Smell - People 40+ that ever had a loss of consciousness because of a head injury (%)
Taste & Smell - People 40+ that ever had a broken nose or other serious injury to face or skull (%)
Taste & Smell - People 40+ that ever had two or more sinus infections (%)
Weight - Average height (inches)
Weight - Average weight (pounds)
Weight - Average BMI
Weight - People that are obese (%)
Weight - People that ever were obese (%)
Weight - People trying to lose weight (%)
3,027 50.3% Black alone 2,064 34.3% White alone 854 14.2% Hispanic 63 1.0% Other race alone 43 0.7% Two or more races 5 0.08% American Indian alone
According to our research of Alabama and other state lists, there were 5 registered sex offenders living in Tarrant, Alabama as of June 15, 2024 . The ratio of all residents to sex offenders in Tarrant is 1,255 to 1.The ratio of registered sex offenders to all residents in this city is much lower than the state average.
Officers per 1,000 residents here:
5.62Alabama average:
2.40
Latest news from Tarrant, AL collected exclusively by city-data.com from local newspapers, TV, and radio stations
Ancestries: American (15.4%), Scottish (3.7%), German (3.1%), Italian (3.0%), English (1.6%).
Current Local Time:
Land area: 6.36 square miles.
Population density: 930 people per square mile (low).
518 residents are foreign born (8.3% Latin America ).
This city:
8.6%Alabama:
3.5%
Median real estate property taxes paid for housing units with mortgages in 2022: $737 (0.6%)Median real estate property taxes paid for housing units with no mortgage in 2022: $606 (0.6%)
Nearest city with pop. 50,000+: Birmingham, AL
Nearest city with pop. 1,000,000+: Houston, TX
Nearest cities:
Latitude: 33.59 N, Longitude: 86.77 W
Daytime population change due to commuting: +1,162 (+19.3%)Workers who live and work in this city: 414 (14.5%)
Area code commonly used in this area: 205
Single-family new house construction building permits:
2014: 1 building , cost: $50,0002011: 1 building , cost: $72,0002006: 3 buildings , average cost: $54,4002005: 5 buildings , average cost: $54,0002004: 4 buildings , average cost: $55,0002003: 6 buildings , average cost: $67,6002002: 6 buildings , average cost: $42,4002001: 19 buildings , average cost: $40,1002000: 3 buildings , average cost: $66,7001999: 1 building , cost: $25,0001997: 2 buildings , average cost: $64,100Unemployment in December 2023:
Most common occupations in Tarrant, AL (%)
Both Males Females
Driver/sales workers and truck drivers (6.8%)
Laborers and material movers, hand (6.3%)
Other sales and related occupations, including supervisors (5.8%)
Other office and administrative support workers, including supervisors (4.9%)
Electrical equipment mechanics and other installation, maintenance, and repair workers, including supervisors (4.0%)
Construction traders workers except carpenters, electricians, painters, plumbers, and construction laborers (3.7%)
Retail sales workers, except cashiers (3.4%)
Driver/sales workers and truck drivers (11.6%)
Laborers and material movers, hand (8.5%)
Electrical equipment mechanics and other installation, maintenance, and repair workers, including supervisors (7.0%)
Construction traders workers except carpenters, electricians, painters, plumbers, and construction laborers (6.8%)
Material recording, scheduling, dispatching, and distributing workers (4.5%)
Building and grounds cleaning and maintenance occupations (4.4%)
Other sales and related occupations, including supervisors (3.7%)
Other office and administrative support workers, including supervisors (10.8%)
Other sales and related occupations, including supervisors (8.3%)
Customer service representatives (5.1%)
Secretaries and administrative assistants (4.9%)
Retail sales workers, except cashiers (4.8%)
Other financial specialists (4.1%)
Other management occupations, except farmers and farm managers (4.0%)
Tornado activity:
Tarrant-area historical tornado activity is slightly above Alabama state average. It is 157% greater than the overall U.S. average.
On 4/4/1977, a category F5 (max. wind speeds 261-318 mph) tornado 3.9 miles away from the Tarrant city center killed 22 people and injured 130 people and caused between $5,000,000 and $50,000,000 in damages.
On 4/8/1998, a category F5 tornado 6.0 miles away from the city center killed 32 people and injured 259 people and caused $200 million in damages.
Earthquake activity:
Tarrant-area historical earthquake activity is significantly above Alabama state average. It is 130% greater than the overall U.S. average. On 1/18/1999 at 07:00:53, a magnitude 4.8 (4.8 MB, 4.0 LG, Depth: 0.6 mi, Class: Light, Intensity: IV - V) earthquake occurred 30.9 miles away from the city center On 4/29/2003 at 08:59:39, a magnitude 4.9 (4.4 MB, 4.6 MW, 4.9 LG) earthquake occurred 90.4 miles away from the city center On 6/24/1975 at 11:11:36, a magnitude 4.5 (4.5 MB) earthquake occurred 62.5 miles away from Tarrant center On 4/29/2003 at 08:59:39, a magnitude 4.6 (4.6 MW, Depth: 12.3 mi) earthquake occurred 90.4 miles away from the city center On 10/24/1997 at 08:35:17, a magnitude 4.9 (4.8 MB, 4.2 MS, 4.9 LG, Depth: 6.2 mi) earthquake occurred 173.0 miles away from Tarrant center On 11/7/2004 at 11:20:21, a magnitude 4.3 (4.3 MW, Depth: 3.1 mi) earthquake occurred 93.7 miles away from the city center Magnitude types: regional Lg-wave magnitude (LG), body-wave magnitude (MB), surface-wave magnitude (MS), moment magnitude (MW) Natural disasters: The number of natural disasters in Jefferson County (32) is a lot greater than the US average (15).Major Disasters (Presidential) Declared: 24Emergencies Declared: 6Storms: 18, Tornadoes: 16, Floods: 14, Hurricanes: 6, Winds: 6, Drought: 1, Fire: 1, Heavy Rain: 1, Snowfall: 1, Winter Storm: 1, Other: 1 (Note: some incidents may be assigned to more than one category). Hospitals and medical centers near Tarrant: JEFFERSON CO NH (Nursing Home, about 2 miles away; BIRMINGHAM, AL)
JEFFERSON REHABILITATION AND HEALTH CENTER (Nursing Home, about 2 miles away; BIRMINGHAM, AL)
DCI BIRMINGHAM (Dialysis Facility, about 3 miles away; BIRMINGHAM, AL)
CROWN DIALYSIS (Dialysis Facility, about 4 miles away; BIRMINGHAM, AL)
CARRAWAY METHODIST MEDICAL CTR HOSPICE (Hospital, about 5 miles away; BIRMINGHAM, AL)
HOPE HOSPICE, INC (Hospital, about 5 miles away; BIRMINGHAM, AL)
FAMILY COMFORT HOSPICE, LLC (Hospital, about 5 miles away; BIRMINGHAM, AL)
Amtrak station near Tarrant: 6 miles: BIRMINGHAM (1819 MORRIS AVE.) Services: ticket office, partially wheelchair accessible, enclosed waiting area, public restrooms, public payphones, vending machines, paid short-term parking, paid long-term parking, call for taxi service.
Colleges/universities with over 2000 students nearest to Tarrant:
Jefferson State Community College (about 6 miles; Birmingham, AL ; Full-time enrollment: 6,041)
University of Alabama at Birmingham (about 7 miles; Birmingham, AL ; FT enrollment: 14,853)
Samford University (about 9 miles; Birmingham, AL ; FT enrollment: 3,829)
Virginia College-Birmingham (about 9 miles; Birmingham, AL ; FT enrollment: 8,167)
Lawson State Community College-Birmingham Campus (about 12 miles; Birmingham, AL ; FT enrollment: 2,695)
Bevill State Community College (about 34 miles; Jasper, AL ; FT enrollment: 2,970)
George C Wallace State Community College-Hanceville (about 34 miles; Hanceville, AL ; FT enrollment: 4,486)
Public high school in Tarrant:
Public elementary/middle schools in Tarrant: TARRANT ELEM SCH Students: 535, Location: 1269 PORTLAND ST, Grades: KG-2)TARRANT INTERMEDIATE SCH Location: 1 WILDCAT DRIVE, Grades: 3-6)
See full list of schools located in Tarrant Library in Tarrant: TARRANT PUBLIC LIBRARY Operating income: $196,030; Location: 1143 FORD AVENUE; 38,721 books ; 460 audio materials ; 852 video materials ; 81 state licensed databases ; 82 print serial subscriptions )
Notable locations in Tarrant: (A) , Tarrant City Hall (B) , Tarrant Fire and Rescue (C) . Display/hide their locations on the map
Shopping Center: (1) . Display/hide its location on the map
Churches in Tarrant include: (A) , Boyles Baptist Church (B) , First Baptist Church of Tarrant (C) , Dixon Memorial Presbyterian Church (D) , Independent Methodist Church of Tarrant (E) , Central Baptist Church (F) , Black Creek Church (G) , Kingdom Hall of Jehovahs Witnesses (H) , Lakeside Church of Tarrant City (I) . Display/hide their locations on the map
Cemetery: (1) . Display/hide its location on the map
Lakes and reservoirs: (A) , North Lake (B) . Display/hide their locations on the map
Streams, rivers, and creeks: (A) . Display/hide its location on the map
Birthplace of: Marquis Maze - Football player.
Jefferson County has a predicted average indoor radon screening level between 2 and 4 pCi/L (pico curies per liter) - Moderate Potential Average household size: This city:
2.7 peopleAlabama:
2.5 people
Percentage of family households: This city:
65.9%Whole state:
67.8%
Percentage of households with unmarried partners: This city:
6.7%Whole state:
4.7%
Likely homosexual households (counted as self-reported same-sex unmarried-partner households)
Lesbian couples: 0.3% of all households Gay men: 0.3% of all households
127 people in nursing facilities/skilled-nursing facilities in 2010people in other types of correctional institutions in 2000
For population 15 years and over in Tarrant:
Never married: 39.0%Now married: 30.8%Separated: 1.8%Widowed: 11.2%Divorced: 17.2% For population 25 years and over in Tarrant:
High school or higher: 80.3%Bachelor's degree or higher: 7.5%Graduate or professional degree: 2.7%Unemployed: 6.0%Mean travel time to work (commute): 23.7 minutes
Education Gini index (Inequality in education) Here:
9.4Alabama average:
11.5
Religion statistics for Tarrant, AL (based on Jefferson County data)
Religion Adherents Congregations Evangelical Protestant 308,984 710 Black Protestant 106,653 257 Mainline Protestant 67,037 150 Catholic 55,083 32 Other 13,073 45 Orthodox 1,424 4 None 106,212 -
Source: Clifford Grammich, Kirk Hadaway, Richard Houseal, Dale E.Jones, Alexei Krindatch, Richie Stanley and Richard H.Taylor. 2012. 2010 U.S.Religion Census: Religious Congregations & Membership Study. Association of Statisticians of American Religious Bodies. Jones, Dale E., et al. 2002. Congregations and Membership in the United States 2000. Nashville, TN: Glenmary Research Center. Graphs represent county-level data
Food Environment Statistics: Number of grocery stores : 135Jefferson County :
2.05 / 10,000 pop.Alabama :
1.89 / 10,000 pop.
Number of supercenters and club stores : 12Here :
0.18 / 10,000 pop.Alabama :
0.20 / 10,000 pop.
Number of convenience stores (no gas) : 65Jefferson County :
0.99 / 10,000 pop.State :
0.65 / 10,000 pop.
Number of convenience stores (with gas) : 380This county :
5.77 / 10,000 pop.Alabama :
6.32 / 10,000 pop.
Number of full-service restaurants : 357Jefferson County :
5.42 / 10,000 pop.State :
5.75 / 10,000 pop.
Low-income preschool obesity rate : Jefferson County :
12.0%Alabama :
13.5%
Health and Nutrition: Healthy diet rate : Tarrant:
46.1%Alabama:
49.0%
Average overall health of teeth and gums : Tarrant:
40.2%Alabama:
45.7%
People feeling badly about themselves : This city:
22.2%State:
20.7%
People not drinking alcohol at all : This city:
12.2%Alabama:
11.0%
Average hours sleeping at night : Overweight people : Tarrant:
33.6%Alabama:
34.4%
General health condition : Tarrant:
50.7%Alabama:
55.2%
Average condition of hearing : Tarrant:
76.2%Alabama:
79.3%
More about Health and Nutrition of Tarrant, AL Residents
Local government employment and payroll (March 2022)
Function
Full-time employees
Monthly full-time payroll
Average yearly full-time wage
Part-time employees
Monthly part-time payroll
Solid Waste Management
21 $78,188 $44,679 0 $0 Police Protection - Officers
18 $104,027 $69,351 0 $0 Electric Power
16 $71,680 $53,760 0 $0 Firefighters
12 $49,023 $49,023 0 $0 Other Government Administration
10 $21,468 $25,762 0 $0 Police - Other
5 $23,774 $57,058 0 $0 Parks and Recreation
4 $14,076 $42,228 1 $1,022 Financial Administration
3 $17,471 $69,884 0 $0 Local Libraries
2 $6,585 $39,510 0 $0 Judicial and Legal
2 $8,563 $51,378 0 $0
Totals for Government
93 $394,854 $50,949 1 $1,022
Tarrant government finances - Expenditure in 2021 (per resident):
Current Operations - Police Protection: $1,939,000 ($328.09)
Local Fire Protection: $1,376,000 ($232.83)Regular Highways: $1,169,000 ($197.80)Central Staff Services: $1,057,000 ($178.85)Parks and Recreation: $350,000 ($59.22)Financial Administration: $340,000 ($57.53)Judicial and Legal Services: $254,000 ($42.98)Libraries: $162,000 ($27.41)Transit Utilities: $27,000 ($4.57)General - Interest on Debt: $225,000 ($38.07)
Other Capital Outlay - Central Staff Services: $54,000 ($9.14)
Parks and Recreation: $9,000 ($1.52)Total Salaries and Wages: $4,489,000 ($759.56)
Tarrant government finances - Revenue in 2021 (per resident):
Charges - Regular Highways: $76,000 ($12.86)
Parks and Recreation: $11,000 ($1.86)Federal Intergovernmental - Natural Resources: $276,000 ($46.70)
Local Intergovernmental - Electric Utilities: $342,000 ($57.87)
Miscellaneous - Fines and Forfeits: $177,000 ($29.95)
Rents: $75,000 ($12.69)General Revenue - Other: $74,000 ($12.52)Interest Earnings: $22,000 ($3.72)Donations From Private Sources: $6,000 ($1.02)Tax - General Sales and Gross Receipts: $4,218,000 ($713.71)
Occupation and Business License - Other: $2,245,000 ($379.86)Property: $1,237,000 ($209.31)Other Selective Sales: $648,000 ($109.64)Public Utilities Sales: $376,000 ($63.62)Other License: $194,000 ($32.83)Motor Fuels Sales: $44,000 ($7.45)Alcoholic Beverage Sales: $32,000 ($5.41)Tobacco Products Sales: $8,000 ($1.35)
Tarrant government finances - Debt in 2021 (per resident):
Long Term Debt - Beginning Outstanding - Unspecified Public Purpose: $6,065,000 ($1026.23)
Outstanding Unspecified Public Purpose: $5,035,000 ($851.95)Retired Unspecified Public Purpose: $1,030,000 ($174.28)
Tarrant government finances - Cash and Securities in 2021 (per resident):
Bond Funds - Cash and Securities: $307,000 ($51.95)
Other Funds - Cash and Securities: $2,007,000 ($339.59)
6.20% of this county's 2020 resident taxpayers moved to other counties in 2021 ($76,918 average adjusted gross income )
Here:
6.20%Alabama average:
6.41%
0.01% of residents moved to foreign countries ($73 average AGI )Jefferson County:
0.01%Alabama average:
0.02%
Top counties to which taxpayers relocated from this county between 2020 and 2021: Businesses in Tarrant, AL
Strongest AM radio stations in Tarrant:
WDJC (850 AM; 50 kW; BIRMINGHAM, AL; Owner: KIMTRON, INC.)
WAPI (1070 AM; 50 kW; BIRMINGHAM, AL; Owner: CITADEL BROADCASTING COMPANY)
WJOX (690 AM; 50 kW; BIRMINGHAM, AL; Owner: CITADEL BROADCASTING COMPANY)
WYDE (1260 AM; 5 kW; BIRMINGHAM, AL; Owner: KIMTRON, INC.)
WERC (960 AM; 5 kW; BIRMINGHAM, AL; Owner: CAPSTAR TX LIMITED PARTNERSHIP)
WRJS (1320 AM; 5 kW; BIRMINGHAM, AL; Owner: CXR HOLDINGS, INC.)
WLPH (1480 AM; daytime; 5 kW; IRONDALE, AL; Owner: BIRMINGHAM CHRISTIAN RADIO, INC.)
WATV (900 AM; 1 kW; BIRMINGHAM, AL)
WNSI (810 AM; 50 kW; JACKSONVILLE, AL; Owner: UNITED BROADCASTING NETWORK, INC.)
WAYE (1220 AM; 1 kW; BIRMINGHAM, AL; Owner: BIRMINGHAM CHRISTIAN RADIO, INC.)
WCOC (1010 AM; 5 kW; DORA, AL; Owner: AZTECA COMMUNICATIONS OF ALABAMA, INC.)
WJLD (1400 AM; 1 kW; FAIRFIELD, AL; Owner: RICHARDSON BROADCASTING CORPORATION)
WKNG (1060 AM; daytime; 50 kW; TALLAPOOSA, GA; Owner: WKNG, INC.)
Strongest FM radio stations in Tarrant:
WENN (105.9 FM; TRUSSVILLE, AL; Owner: CAPSTAR TX LIMITED PARTNERSHIP)
WBPT (106.9 FM; BIRMINGHAM, AL; Owner: CXR HOLDINGS, INC.)
WBHK (98.7 FM; WARRIOR, AL; Owner: CXR HOLDINGS, INC.)
WZZK-FM (104.7 FM; BIRMINGHAM, AL; Owner: CXR HOLDINGS, INC.)
WBHM (90.3 FM; BIRMINGHAM, AL; Owner: BD OF TRUSTEES/U OF AL AT BIRMINGHAM)
WODL (97.3 FM; HOMEWOOD, AL; Owner: CXR HOLDINGS, INC.)
WYSF (94.5 FM; BIRMINGHAM, AL; Owner: CITADEL BROADCASTING COMPANY)
WRAX (107.7 FM; BIRMINGHAM, AL; Owner: CITADEL BROADCASTING COMPANY)
WBFR (89.5 FM; BIRMINGHAM, AL; Owner: FAMILY STATIONS, INC.)
WMJJ (96.5 FM; BIRMINGHAM, AL; Owner: CAPSTAR TX LIMITED PARTNERSHIP)
WQEN (103.7 FM; GADSDEN, AL; Owner: CAPSTAR TX LIMITED PARTNERSHIP)
WDJC-FM (93.7 FM; BIRMINGHAM, AL; Owner: KIMTRON, INC.)
WZRR (99.5 FM; BIRMINGHAM, AL; Owner: CITADEL BROADCASTING COMPANY)
WGIB (91.9 FM; BIRMINGHAM, AL; Owner: GLEN IRIS BAPTIST SCHOOL)
WVSU-FM (91.1 FM; BIRMINGHAM, AL; Owner: SAMFORD UNIVERSITY)
WJSR (91.1 FM; BIRMINGHAM, AL; Owner: JEFFERSON STATE COMMUNITY COLLEGE)
W281AB (104.1 FM; MOUNTAIN BROOK, AL; Owner: FAMILY STATIONS, INC.)
WLJR (88.5 FM; BIRMINGHAM, AL; Owner: BRIARWOOD PRESBYTERIAN CHURCH)
WDXB (102.5 FM; JASPER, AL; Owner: CAPSTAR TX LIMITED PARTNERSHIP)
WYDE-FM (101.1 FM; CULLMAN, AL; Owner: KIMTRON, INC.)
TV broadcast stations around Tarrant:
WIAT (Channel 42; BIRMINGHAM, AL; Owner: MEDIA GENERAL COMMUNICATIONS, INC.)
WBRC (Channel 6; BIRMINGHAM, AL; Owner: WBRC LICENSE, INC.)
WVTM-TV (Channel 13; BIRMINGHAM, AL; Owner: BIRMINGHAM BROADCASTING (WVTM-TV), LLC)
WBIQ (Channel 10; BIRMINGHAM, AL; Owner: ALABAMA EDUCATIONAL TELEVISION COMMISSION)
WTTO (Channel 21; HOMEWOOD, AL; Owner: WTTO LICENSEE, LLC)
W46DK (Channel 46; BIRMINGHAM, AL; Owner: TRINITY BROADCASTING NETWORK)
WABM (Channel 68; BIRMINGHAM, AL; Owner: BIRMINGHAM (WABM-TV) LICENSEE, INC.)
W27CM (Channel 27; BIRMINGHAM, AL; Owner: EQUITY BROADCASTING CORPORATION)
WBXA-CA (Channel 2; BIRMINGHAM, AL; Owner: THE BOX WORLDWIDE LLC)
W34BI (Channel 34; BIRMINGHAM, AL; Owner: VENTANA TELEVISION, INC.)
WBMA-LP (Channel 58; BIRMINGHAM, AL; Owner: TV ALABAMA, INC.)
WDBB (Channel 17; BESSEMER, AL; Owner: WDBB-TV, INC.)
WCFT-TV (Channel 33; TUSCALOOSA, AL; Owner: TV ALABAMA, INCORPORATED)
W49AY (Channel 49; BIRMINGHAM, AL; Owner: GLEN IRIS BAPTIST SCHOOL)
W62BG (Channel 62; BIRMINGHAM, AL; Owner: WTTO LICENSEE, LLC)
WTJP (Channel 60; GADSDEN, AL; Owner: TRINITY BROADCASTING NETWORK)
WJSU-TV (Channel 40; ANNISTON, AL; Owner: TV ALABAMA, INC.)
WPXH (Channel 44; GADSDEN, AL; Owner: PAXSON COMMUNICATIONS LICENSE COMPANY, LLC)
National Bridge Inventory (NBI) Statistics 8 Number of bridges95ft / 29.2m Total length $8,599,000 Total costs105,267 Total average daily traffic8,373 Total average daily truck traffic129,529 Total future (year 2038) average daily traffic
FCC Registered Antenna Towers: 46 (
See the full list of FCC Registered Antenna Towers in Tarrant )
FCC Registered Private Land Mobile Towers: 3 (
See the full list of FCC Registered Private Land Mobile Towers in Tarrant, AL )
FCC Registered Broadcast Land Mobile Towers: 9 (
See the full list of FCC Registered Broadcast Land Mobile Towers )
FCC Registered Microwave Towers: 7
TARRANT CIT, 700 Skyline Dr (Lat: 33.590389 Lon: -86.787222), Type: Tower, Structure height: 49.7 m, Call Sign: WMM486, Assigned Frequencies: 11095.0 MHz, 10735.0 MHz, Grant Date: 01/25/2011, Expiration Date: 02/01/2021, Cancellation Date: 05/07/2014, Certifier: John T Scott Iii, Registrant: Verizon Wireless, 1120 Sanctuary Pkwy, #150 Gasa5reg, Alpharetta, GA 30009-7630, Phone: (770) 797-1070, Fax: (770) 797-1036, Email:
STATION, 666 Springdale Rd (Lat: 33.592861 Lon: -86.768861), Overall height: 85 m, Call Sign: WNTB976, Assigned Frequencies: 928.281 MHz, 952.281 MHz, Grant Date: 02/23/2010, Expiration Date: 03/28/2020, Cancellation Date: 06/17/2019, Certifier: Gary S Wester, Registrant: Southern Natural Gas Company, L. L. C., 2 N Nevada Avenue, Colorado Springs, CO 80903, Phone: (866) 775-5785, Email:
666 Springdale Rd (Lat: 33.592861 Lon: -86.768861), Overall height: 85 m, Call Sign: WPNA774, Assigned Frequencies: 1855.00 MHz, Grant Date: 01/31/1997, Expiration Date: 01/31/2002, Cancellation Date: 11/02/1998, Phone: (816) 559-5202 666 Springdale Rd (Lat: 33.592861 Lon: -86.768861), Overall height: 85 m, Call Sign: WPND809, Assigned Frequencies: 1885.00 MHz, Grant Date: 03/28/1997, Expiration Date: 03/28/2002, Cancellation Date: 10/17/1997, Phone: (202) 328-4500 9BH0116A, 2851 Seaboard Road (009113 / Birmingham) (Lat: 33.589861 Lon: -86.787778), Type: Ltower, Structure height: 45.7 m, Overall height: 47.5 m, Call Sign: WPTY894, Assigned Frequencies: 6197.24 MHz, 21375.0 MHz, 21375.0 MHz, 21375.0 MHz, 21375.0 MHz, 21375.0 MHz, 21375.0 MHz, 21375.0 MHz, Grant Date: 02/28/2012, Expiration Date: 01/15/2022, Cancellation Date: 01/26/2018, Certifier: Dan Menser, Registrant: T-Mobile Usa, Inc., 12920 Se 38th Street, Bellevue, WA 98006, Phone: (425) 383-8401, Fax: (425) 383-4040, Email:
BHAMAIRPORT, On Technology Lane At Birmingham Airport (Lat: 33.569500 Lon: -86.760417), Type: Mtower, Structure height: 36.6 m, Overall height: 38.1 m, Call Sign: WQVH474, Assigned Frequencies: 10815.0 MHz, 10815.0 MHz, 10815.0 MHz, 10815.0 MHz, 10815.0 MHz, 10815.0 MHz, 10815.0 MHz, 10815.0 MHz, Grant Date: 02/12/2015, Expiration Date: 02/12/2025, Certifier: Larry F Butts, Registrant: Southern Company Services, 600 N. 18th St / Bin 5n-5409, Birmingham, AL 35203, Phone: (205) 257-7600, Fax: (205) 257-2134, Email:
STATION, 666 Springdale Rd (Lat: 33.592861 Lon: -86.768861), Structure height: 121.9 m, Overall height: 85 m, Call Sign: KWV24, Assigned Frequencies: 6765.00 MHz, Grant Date: 08/25/2000, Expiration Date: 09/20/2010, Cancellation Date: 04/16/2009, Registrant: Southern Natural Gas Company, 569 Brookwood Village Suite 501, Birmingham, AL 35209, Phone: (205) 325-7328, Fax: (205) 325-3730, Email:
FCC Registered Amateur Radio Licenses: 25 (
See the full list of FCC Registered Amateur Radio Licenses in Tarrant )
Home Mortgage Disclosure Act Aggregated Statistics For Year 2009(Based on 1 full and 2 partial tracts) A) FHA, FSA/RHS & VA B) Conventional C) Refinancings D) Home Improvement Loans F) Non-occupant Loans on Number Average Value Number Average Value Number Average Value Number Average Value Number Average Value
LOANS ORIGINATED 13 $89,275 9 $95,063 56 $77,986 5 $15,352 23 $56,825 APPLICATIONS APPROVED, NOT ACCEPTED 1 $64,000 1 $73,070 5 $85,514 2 $45,070 1 $73,070 APPLICATIONS DENIED 4 $74,395 4 $109,782 47 $87,285 10 $20,798 6 $41,815 APPLICATIONS WITHDRAWN 1 $115,180 2 $43,080 25 $94,419 2 $134,120 0 $0 FILES CLOSED FOR INCOMPLETENESS 2 $60,500 0 $0 5 $81,908 1 $53,420 0 $0
Aggregated Statistics For Year 2008(Based on 1 full and 2 partial tracts) A) FHA, FSA/RHS & VA B) Conventional C) Refinancings D) Home Improvement Loans E) Loans on Dwellings For 5+ Families F) Non-occupant Loans on G) Loans On Manufactured Number Average Value Number Average Value Number Average Value Number Average Value Number Average Value Number Average Value Number Average Value
LOANS ORIGINATED 24 $95,260 40 $99,958 88 $72,704 5 $36,074 1 $3,018,000 58 $57,286 1 $29,170 APPLICATIONS APPROVED, NOT ACCEPTED 4 $53,132 3 $145,483 15 $71,419 0 $0 0 $0 1 $56,610 3 $42,570 APPLICATIONS DENIED 14 $75,246 25 $69,485 108 $86,215 18 $35,174 0 $0 33 $58,985 1 $40,840 APPLICATIONS WITHDRAWN 4 $96,472 8 $77,405 28 $79,659 2 $75,635 0 $0 9 $56,919 0 $0 FILES CLOSED FOR INCOMPLETENESS 0 $0 1 $116,170 8 $93,992 0 $0 0 $0 0 $0 0 $0
Aggregated Statistics For Year 2007(Based on 1 full and 2 partial tracts) A) FHA, FSA/RHS & VA B) Conventional C) Refinancings D) Home Improvement Loans F) Non-occupant Loans on G) Loans On Manufactured Number Average Value Number Average Value Number Average Value Number Average Value Number Average Value Number Average Value
LOANS ORIGINATED 12 $73,449 83 $97,067 114 $71,656 13 $26,141 50 $53,219 3 $26,900 APPLICATIONS APPROVED, NOT ACCEPTED 2 $43,000 6 $84,625 18 $74,167 0 $0 1 $47,000 0 $0 APPLICATIONS DENIED 9 $90,318 50 $80,153 121 $77,526 32 $58,490 16 $74,124 5 $49,950 APPLICATIONS WITHDRAWN 2 $64,500 17 $77,844 55 $79,971 4 $65,520 5 $60,864 0 $0 FILES CLOSED FOR INCOMPLETENESS 0 $0 5 $108,414 14 $86,691 1 $76,300 2 $96,955 0 $0
Aggregated Statistics For Year 2006(Based on 1 full and 2 partial tracts) A) FHA, FSA/RHS & VA B) Conventional C) Refinancings D) Home Improvement Loans E) Loans on Dwellings For 5+ Families F) Non-occupant Loans on G) Loans On Manufactured Number Average Value Number Average Value Number Average Value Number Average Value Number Average Value Number Average Value Number Average Value
LOANS ORIGINATED 14 $83,699 109 $71,194 146 $71,507 15 $25,229 2 $187,500 73 $60,093 2 $50,435 APPLICATIONS APPROVED, NOT ACCEPTED 0 $0 16 $59,891 27 $71,300 2 $66,155 0 $0 5 $56,686 1 $33,520 APPLICATIONS DENIED 5 $84,750 61 $74,716 134 $75,947 33 $40,643 0 $0 25 $63,459 6 $56,963 APPLICATIONS WITHDRAWN 3 $96,227 38 $64,029 58 $74,122 6 $48,773 0 $0 22 $54,435 0 $0 FILES CLOSED FOR INCOMPLETENESS 0 $0 8 $69,335 24 $93,603 0 $0 0 $0 3 $67,627 0 $0
Aggregated Statistics For Year 2005(Based on 1 full and 2 partial tracts) A) FHA, FSA/RHS & VA B) Conventional C) Refinancings D) Home Improvement Loans E) Loans on Dwellings For 5+ Families F) Non-occupant Loans on G) Loans On Manufactured Number Average Value Number Average Value Number Average Value Number Average Value Number Average Value Number Average Value Number Average Value
LOANS ORIGINATED 9 $92,997 116 $71,465 137 $70,716 12 $39,362 2 $169,000 71 $57,752 0 $0 APPLICATIONS APPROVED, NOT ACCEPTED 0 $0 11 $67,879 39 $65,065 5 $20,410 0 $0 4 $36,500 0 $0 APPLICATIONS DENIED 4 $90,268 54 $62,627 92 $77,030 34 $30,456 0 $0 22 $57,774 6 $37,370 APPLICATIONS WITHDRAWN 1 $112,000 36 $81,279 58 $76,401 11 $118,567 0 $0 14 $62,959 0 $0 FILES CLOSED FOR INCOMPLETENESS 0 $0 12 $60,183 25 $94,854 1 $86,000 0 $0 1 $62,000 0 $0
Aggregated Statistics For Year 2004(Based on 1 full and 2 partial tracts) A) FHA, FSA/RHS & VA B) Conventional C) Refinancings D) Home Improvement Loans E) Loans on Dwellings For 5+ Families F) Non-occupant Loans on G) Loans On Manufactured Number Average Value Number Average Value Number Average Value Number Average Value Number Average Value Number Average Value Number Average Value
LOANS ORIGINATED 14 $66,905 91 $71,523 153 $69,367 13 $22,428 2 $123,500 75 $56,011 4 $45,510 APPLICATIONS APPROVED, NOT ACCEPTED 1 $90,840 31 $73,266 51 $69,653 4 $23,868 0 $0 11 $61,642 2 $59,880 APPLICATIONS DENIED 5 $52,672 56 $59,732 139 $68,403 23 $17,655 0 $0 21 $49,450 7 $42,184 APPLICATIONS WITHDRAWN 1 $115,860 23 $83,314 57 $69,726 4 $50,902 0 $0 10 $58,351 0 $0 FILES CLOSED FOR INCOMPLETENESS 0 $0 11 $77,363 28 $86,094 0 $0 0 $0 4 $53,920 0 $0
Aggregated Statistics For Year 2003(Based on 1 full and 2 partial tracts) A) FHA, FSA/RHS & VA B) Conventional C) Refinancings D) Home Improvement Loans F) Non-occupant Loans on Number Average Value Number Average Value Number Average Value Number Average Value Number Average Value
LOANS ORIGINATED 17 $77,065 72 $62,347 187 $65,842 15 $32,130 68 $52,466 APPLICATIONS APPROVED, NOT ACCEPTED 0 $0 8 $54,504 36 $71,987 2 $57,625 1 $52,140 APPLICATIONS DENIED 3 $77,860 30 $49,254 133 $66,091 34 $26,679 15 $48,853 APPLICATIONS WITHDRAWN 3 $62,000 11 $64,286 48 $84,446 2 $34,180 5 $50,424 FILES CLOSED FOR INCOMPLETENESS 0 $0 9 $77,248 12 $71,716 0 $0 0 $0
Aggregated Statistics For Year 2002(Based on 1 full and 2 partial tracts) A) FHA, FSA/RHS & VA B) Conventional C) Refinancings D) Home Improvement Loans E) Loans on Dwellings For 5+ Families F) Non-occupant Loans on Number Average Value Number Average Value Number Average Value Number Average Value Number Average Value Number Average Value
LOANS ORIGINATED 19 $67,608 49 $59,119 153 $59,262 11 $13,439 1 $109,000 73 $47,983 APPLICATIONS APPROVED, NOT ACCEPTED 2 $71,560 7 $56,047 31 $53,534 3 $9,673 0 $0 6 $45,998 APPLICATIONS DENIED 5 $61,092 25 $61,996 93 $63,720 13 $25,146 0 $0 11 $47,809 APPLICATIONS WITHDRAWN 2 $59,180 13 $66,815 44 $67,391 1 $64,140 0 $0 5 $45,200 FILES CLOSED FOR INCOMPLETENESS 0 $0 4 $156,100 19 $65,890 0 $0 0 $0 0 $0
Aggregated Statistics For Year 2001(Based on 1 full and 2 partial tracts) A) FHA, FSA/RHS & VA B) Conventional C) Refinancings D) Home Improvement Loans F) Non-occupant Loans on Number Average Value Number Average Value Number Average Value Number Average Value Number Average Value
LOANS ORIGINATED 34 $69,873 44 $54,121 104 $60,439 16 $12,009 16 $38,772 APPLICATIONS APPROVED, NOT ACCEPTED 2 $60,830 8 $48,850 25 $68,610 1 $25,250 2 $52,260 APPLICATIONS DENIED 1 $94,450 34 $39,354 101 $62,458 20 $9,219 11 $48,101 APPLICATIONS WITHDRAWN 2 $55,000 7 $52,459 31 $55,589 2 $19,775 1 $77,260 FILES CLOSED FOR INCOMPLETENESS 1 $75,850 2 $97,650 17 $68,774 0 $0 0 $0
Aggregated Statistics For Year 2000(Based on 1 full and 2 partial tracts) A) FHA, FSA/RHS & VA B) Conventional C) Refinancings D) Home Improvement Loans F) Non-occupant Loans on Number Average Value Number Average Value Number Average Value Number Average Value Number Average Value
LOANS ORIGINATED 37 $58,795 40 $55,857 62 $54,719 12 $13,215 11 $40,377 APPLICATIONS APPROVED, NOT ACCEPTED 3 $79,423 17 $56,334 7 $46,714 3 $7,190 0 $0 APPLICATIONS DENIED 7 $49,630 49 $41,794 58 $53,226 16 $16,754 3 $34,293 APPLICATIONS WITHDRAWN 6 $60,107 18 $58,135 13 $59,470 2 $27,930 1 $53,050 FILES CLOSED FOR INCOMPLETENESS 0 $0 4 $85,050 24 $49,052 0 $0 0 $0
Aggregated Statistics For Year 1999(Based on 1 full and 2 partial tracts) A) FHA, FSA/RHS & VA B) Conventional C) Refinancings D) Home Improvement Loans F) Non-occupant Loans on Number Average Value Number Average Value Number Average Value Number Average Value Number Average Value
LOANS ORIGINATED 27 $65,062 49 $61,004 77 $52,365 20 $13,258 24 $38,904 APPLICATIONS APPROVED, NOT ACCEPTED 2 $79,185 16 $52,294 8 $53,286 8 $14,768 2 $40,320 APPLICATIONS DENIED 8 $68,641 66 $49,536 57 $49,325 33 $13,078 16 $53,848 APPLICATIONS WITHDRAWN 4 $80,232 11 $80,225 27 $60,543 1 $20,960 3 $30,550 FILES CLOSED FOR INCOMPLETENESS 0 $0 2 $178,100 15 $42,649 0 $0 4 $38,370
Detailed HMDA statistics for the following Tracts:
0109.00
, 0119.01 , 0119.02
Private Mortgage Insurance Companies Aggregated Statistics For Year 2009(Based on 1 full and 1 partial tracts) A) Conventional B) Refinancings C) Non-occupant Loans on Number Average Value Number Average Value Number Average Value
LOANS ORIGINATED 0 $0 0 $0 0 $0 APPLICATIONS APPROVED, NOT ACCEPTED 0 $0 0 $0 0 $0 APPLICATIONS DENIED 1 $66,020 0 $0 0 $0 APPLICATIONS WITHDRAWN 0 $0 0 $0 0 $0 FILES CLOSED FOR INCOMPLETENESS 0 $0 2 $88,135 1 $67,000
Aggregated Statistics For Year 2008(Based on 1 full and 2 partial tracts) A) Conventional B) Refinancings C) Non-occupant Loans on Number Average Value Number Average Value Number Average Value
LOANS ORIGINATED 10 $59,619 9 $74,624 10 $59,835 APPLICATIONS APPROVED, NOT ACCEPTED 6 $71,413 5 $92,132 2 $86,870 APPLICATIONS DENIED 3 $107,667 0 $0 1 $131,000 APPLICATIONS WITHDRAWN 3 $101,667 1 $75,000 2 $67,000 FILES CLOSED FOR INCOMPLETENESS 0 $0 0 $0 0 $0
Aggregated Statistics For Year 2007(Based on 1 full and 2 partial tracts) A) Conventional B) Refinancings C) Non-occupant Loans on Number Average Value Number Average Value Number Average Value
LOANS ORIGINATED 47 $77,469 14 $84,391 4 $59,075 APPLICATIONS APPROVED, NOT ACCEPTED 10 $51,806 6 $77,907 6 $65,833 APPLICATIONS DENIED 2 $63,500 0 $0 1 $68,000 APPLICATIONS WITHDRAWN 0 $0 2 $140,345 0 $0 FILES CLOSED FOR INCOMPLETENESS 1 $47,140 0 $0 0 $0
Aggregated Statistics For Year 2006(Based on 1 full and 2 partial tracts) A) Conventional B) Refinancings C) Non-occupant Loans on Number Average Value Number Average Value Number Average Value
LOANS ORIGINATED 30 $77,187 11 $85,361 6 $63,568 APPLICATIONS APPROVED, NOT ACCEPTED 2 $76,000 1 $68,000 0 $0 APPLICATIONS DENIED 1 $57,000 0 $0 1 $57,000 APPLICATIONS WITHDRAWN 2 $68,840 2 $84,000 1 $55,000 FILES CLOSED FOR INCOMPLETENESS 0 $0 0 $0 0 $0
Aggregated Statistics For Year 2005(Based on 1 full and 2 partial tracts) A) Conventional B) Refinancings C) Non-occupant Loans on Number Average Value Number Average Value Number Average Value
LOANS ORIGINATED 17 $68,319 13 $74,487 7 $52,000 APPLICATIONS APPROVED, NOT ACCEPTED 4 $112,750 0 $0 1 $53,000 APPLICATIONS DENIED 0 $0 0 $0 0 $0 APPLICATIONS WITHDRAWN 0 $0 1 $85,000 0 $0 FILES CLOSED FOR INCOMPLETENESS 0 $0 0 $0 0 $0
Aggregated Statistics For Year 2004(Based on 1 full and 2 partial tracts) A) Conventional B) Refinancings C) Non-occupant Loans on Number Average Value Number Average Value Number Average Value
LOANS ORIGINATED 28 $64,471 13 $72,872 8 $48,375 APPLICATIONS APPROVED, NOT ACCEPTED 6 $67,377 1 $124,380 3 $41,667 APPLICATIONS DENIED 0 $0 0 $0 0 $0 APPLICATIONS WITHDRAWN 2 $127,110 1 $96,050 0 $0 FILES CLOSED FOR INCOMPLETENESS 0 $0 0 $0 0 $0
Aggregated Statistics For Year 2003(Based on 1 full and 2 partial tracts) A) Conventional B) Refinancings C) Non-occupant Loans on Number Average Value Number Average Value Number Average Value
LOANS ORIGINATED 15 $74,061 20 $83,778 2 $71,735 APPLICATIONS APPROVED, NOT ACCEPTED 2 $40,000 4 $95,355 1 $40,000 APPLICATIONS DENIED 0 $0 0 $0 0 $0 APPLICATIONS WITHDRAWN 0 $0 3 $59,473 2 $63,500 FILES CLOSED FOR INCOMPLETENESS 2 $77,000 0 $0 0 $0
Aggregated Statistics For Year 2002(Based on 1 full and 2 partial tracts) A) Conventional B) Refinancings C) Non-occupant Loans on Number Average Value Number Average Value Number Average Value
LOANS ORIGINATED 15 $89,296 20 $70,712 6 $50,028 APPLICATIONS APPROVED, NOT ACCEPTED 2 $148,365 6 $61,707 0 $0 APPLICATIONS DENIED 0 $0 0 $0 0 $0 APPLICATIONS WITHDRAWN 3 $49,373 1 $122,130 1 $89,130 FILES CLOSED FOR INCOMPLETENESS 0 $0 0 $0 0 $0
Aggregated Statistics For Year 2001(Based on 1 full and 2 partial tracts) A) Conventional B) Refinancings C) Non-occupant Loans on Number Average Value Number Average Value Number Average Value
LOANS ORIGINATED 9 $63,097 14 $67,527 4 $38,695 APPLICATIONS APPROVED, NOT ACCEPTED 3 $69,667 3 $100,390 0 $0 APPLICATIONS DENIED 0 $0 1 $145,080 0 $0 APPLICATIONS WITHDRAWN 0 $0 1 $59,000 0 $0 FILES CLOSED FOR INCOMPLETENESS 0 $0 0 $0 0 $0
Aggregated Statistics For Year 2000(Based on 1 full and 2 partial tracts) A) Conventional B) Refinancings C) Non-occupant Loans on Number Average Value Number Average Value Number Average Value
LOANS ORIGINATED 14 $66,259 4 $86,860 1 $43,000 APPLICATIONS APPROVED, NOT ACCEPTED 1 $62,000 0 $0 0 $0 APPLICATIONS DENIED 0 $0 0 $0 0 $0 APPLICATIONS WITHDRAWN 1 $99,000 0 $0 0 $0 FILES CLOSED FOR INCOMPLETENESS 0 $0 0 $0 0 $0
Aggregated Statistics For Year 1999(Based on 1 full and 2 partial tracts) A) Conventional B) Refinancings C) Non-occupant Loans on Number Average Value Number Average Value Number Average Value
LOANS ORIGINATED 9 $68,510 12 $58,559 2 $56,245 APPLICATIONS APPROVED, NOT ACCEPTED 1 $29,770 2 $48,715 1 $42,670 APPLICATIONS DENIED 1 $40,290 0 $0 0 $0 APPLICATIONS WITHDRAWN 0 $0 0 $0 0 $0 FILES CLOSED FOR INCOMPLETENESS 0 $0 0 $0 0 $0
Detailed PMIC statistics for the following Tracts:
0109.00
, 0119.01 , 0119.02 Tarrant compared to Alabama state average:
Median household income below state average. Median house value below state average. Unemployed percentage below state average. Hispanic race population percentage above state average. Median age significantly below state average. Foreign-born population percentage above state average. Length of stay since moving in significantly above state average. House age above state average. Percentage of population with a bachelor's degree or higher significantly below state average.
#3 on the list of "Top 101 cities with the largest percentage of divorced people (15+ years)(population 5,000+)"
#34 on the list of "Top 101 cities with the largest city-data.com crime index decrease from 2011 to 2012 (population 5,000+)"
#43 on the list of "Top 101 cities with the highest number of burglaries per 100,000 residents, excludes tourist destinations and others with a lot of outsiders visiting based on city industries data (population 5,000+)"
#65 on the list of "Top 101 cities with largest percentage of males in occupations: building and grounds cleaning and maintenance occupations (population 5,000+)"
#97 on the list of "Top 101 cities with the highest percentage of single-parent households, population 5,000+"
#5 on the list of "Top 101 counties with the highest number of infant deaths per 1000 residents 2007-2013 (pop. 50,000+)"
#5 on the list of "Top 101 counties with the most Black Protestant adherents"
#5 on the list of "Top 101 counties with the most Black Protestant congregations"
#9 on the list of "Top 101 counties with the highest average weight of females"
#9 on the list of "Top 101 counties with the most Evangelical Protestant adherents"
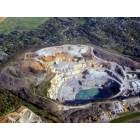
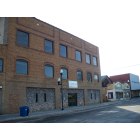
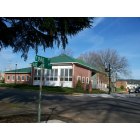
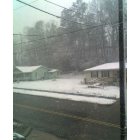
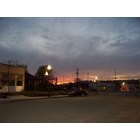

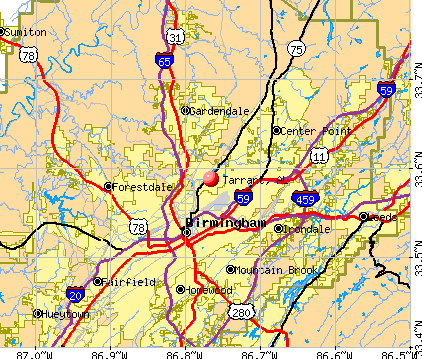


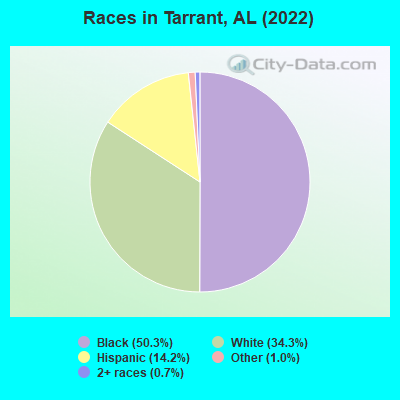
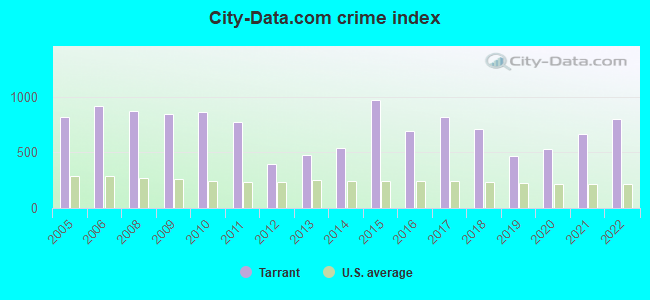
 Recent articles from our blog. Our writers, many of them Ph.D. graduates or candidates, create easy-to-read articles on a wide variety of topics.

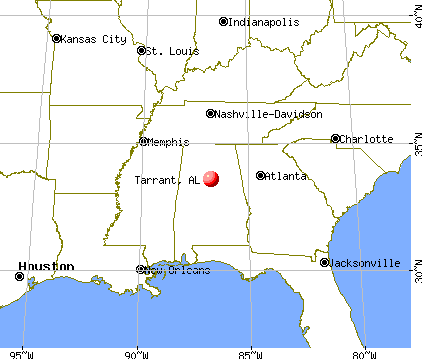
 (5.1 miles
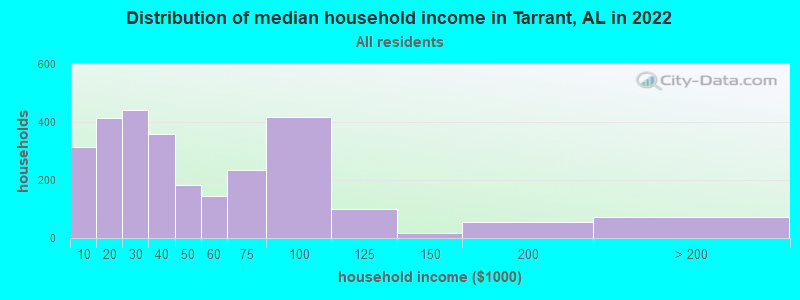
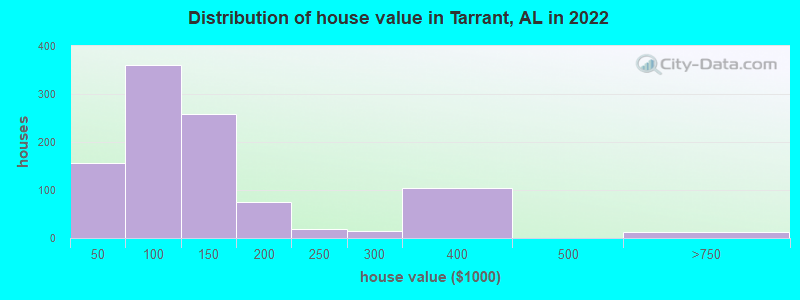
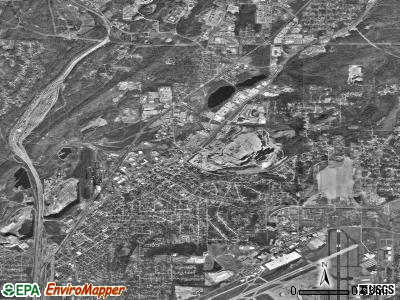
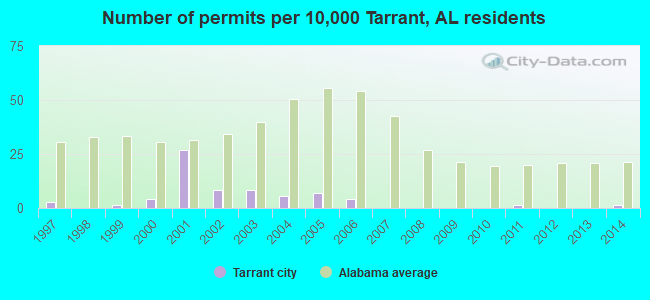
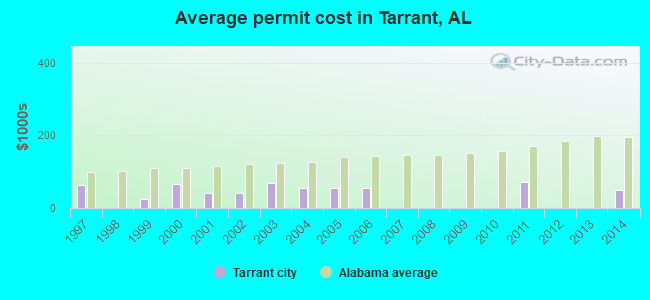
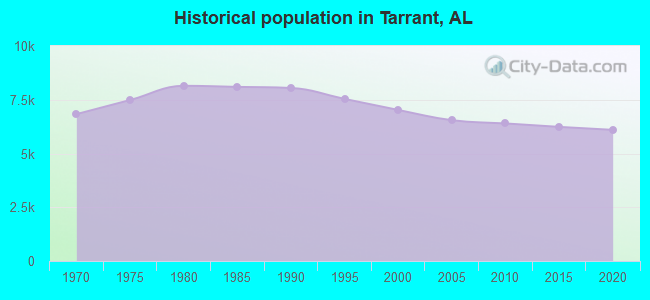
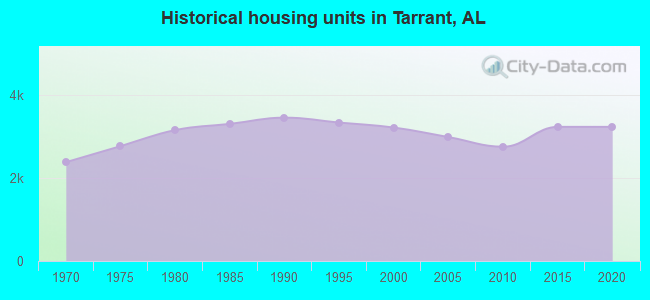
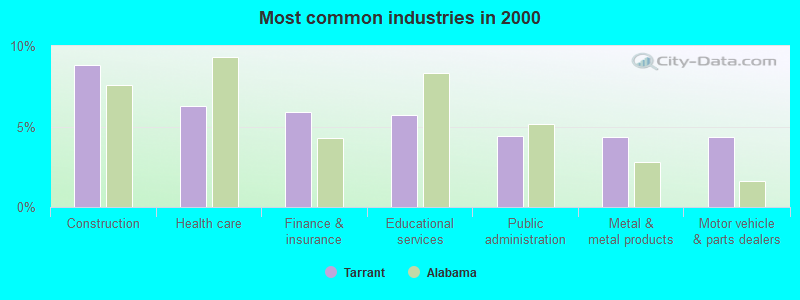
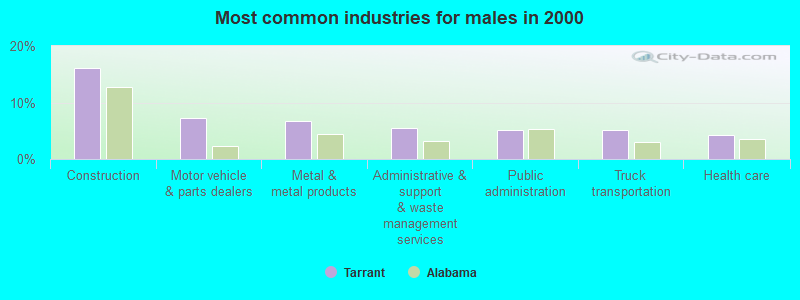
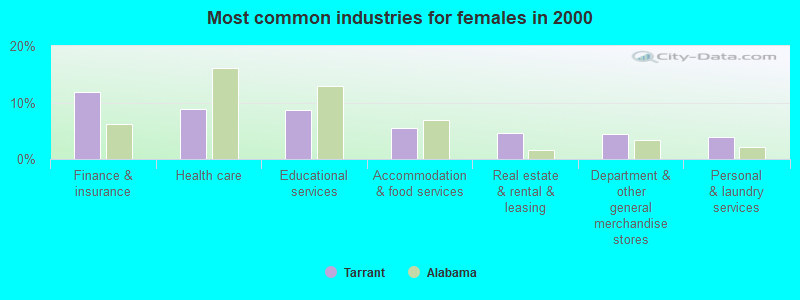
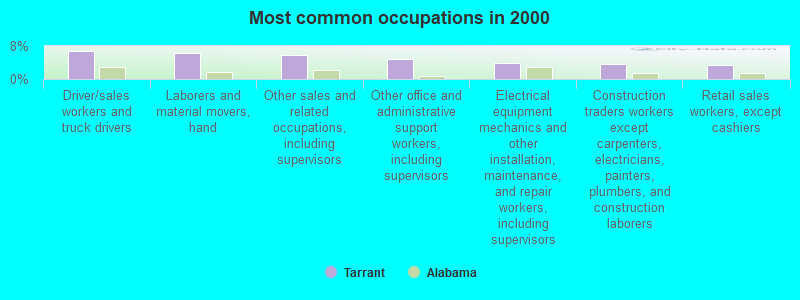
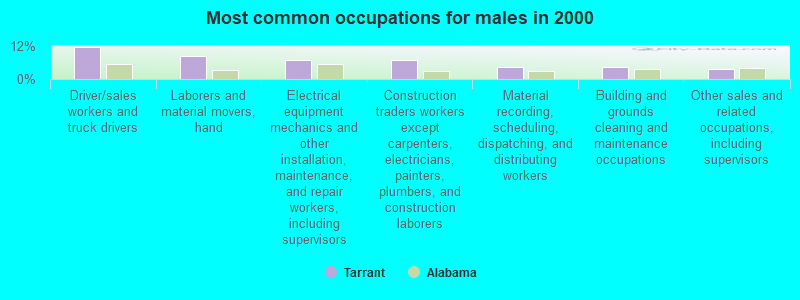
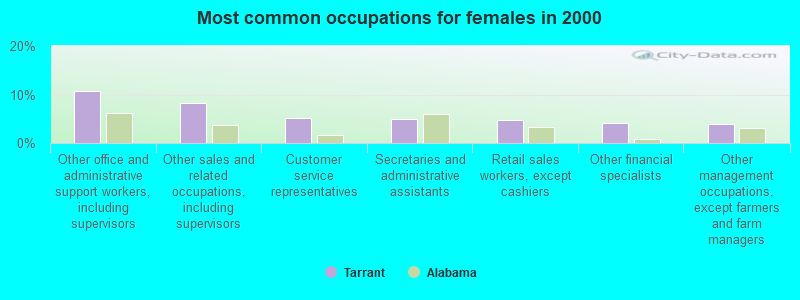
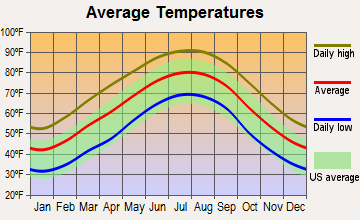


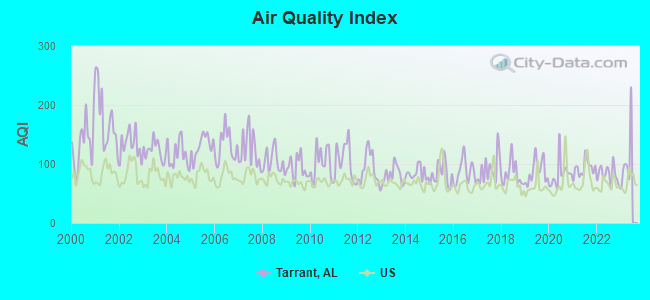
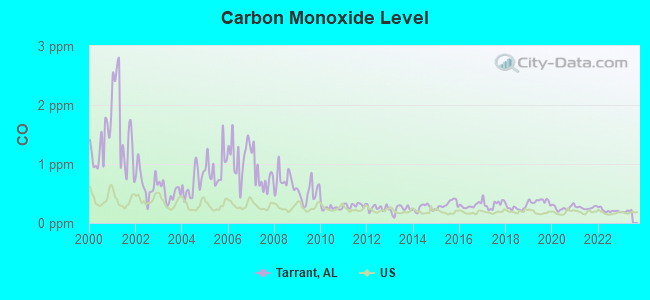
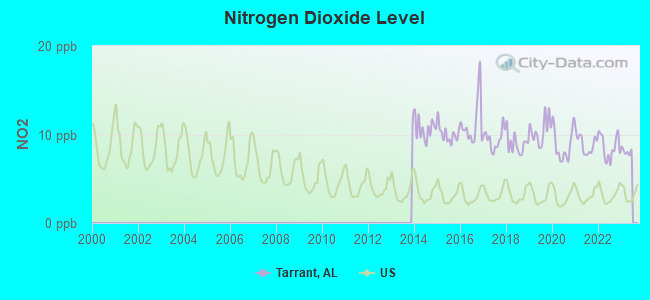
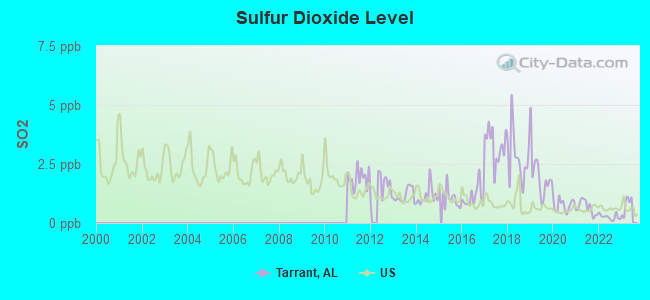
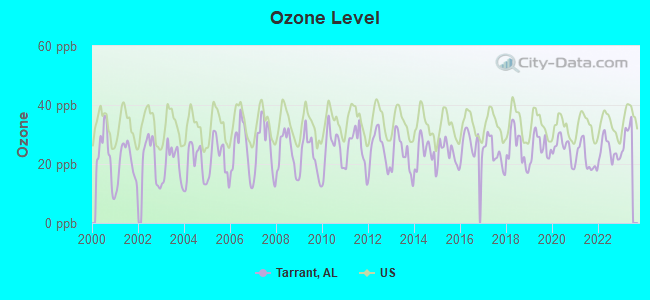
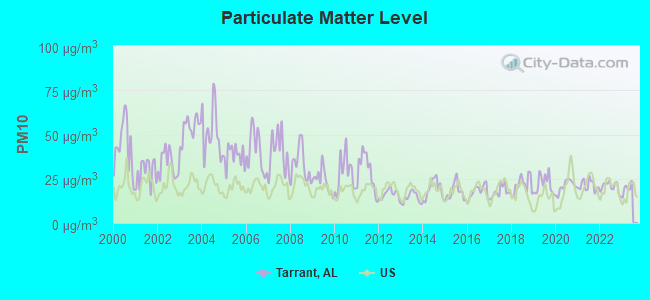
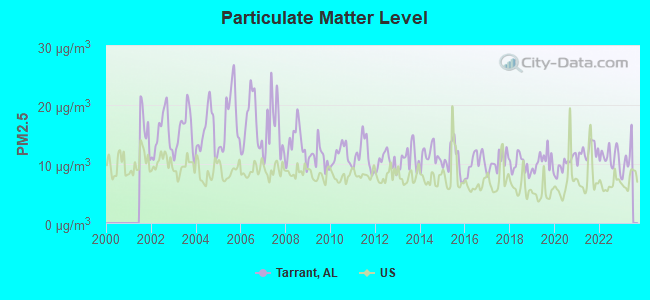
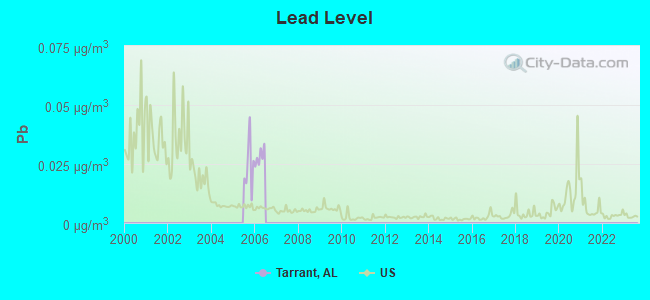

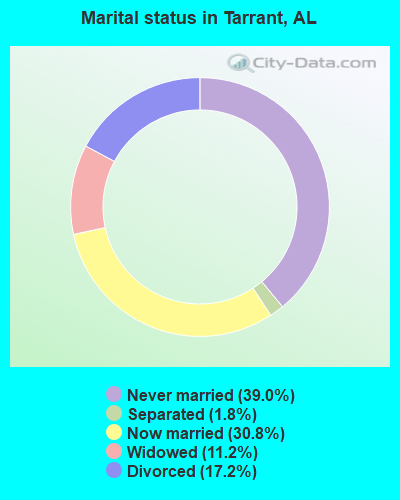
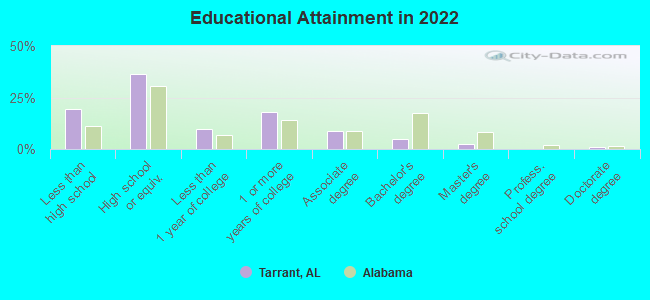
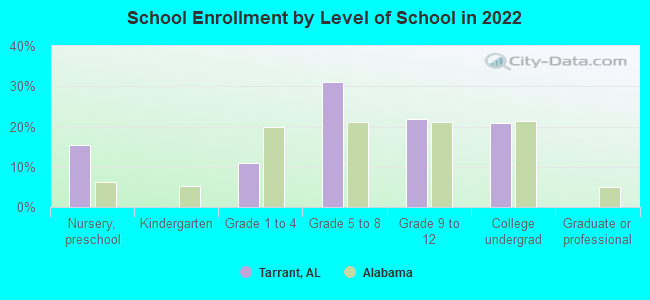
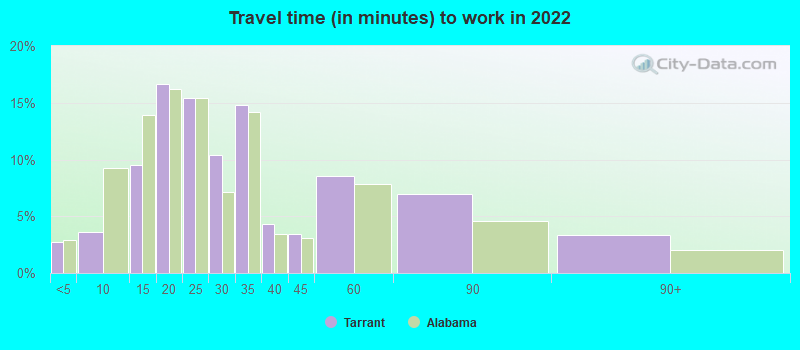
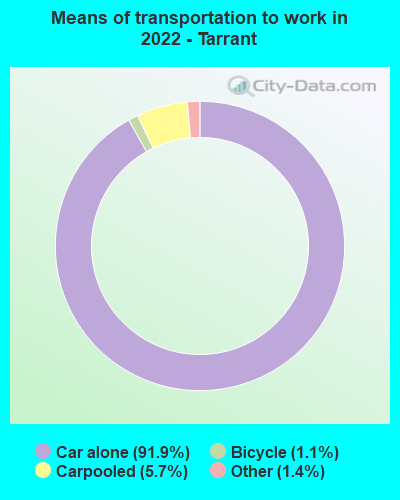
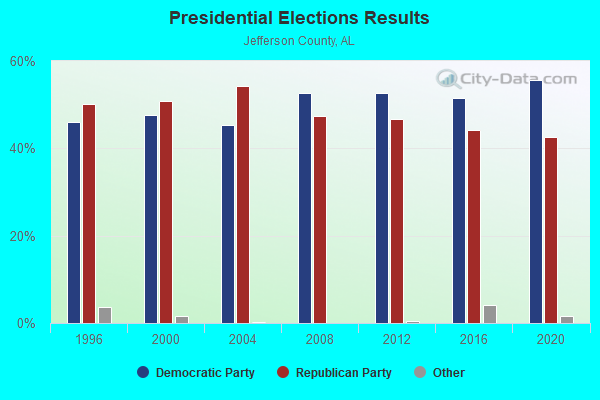
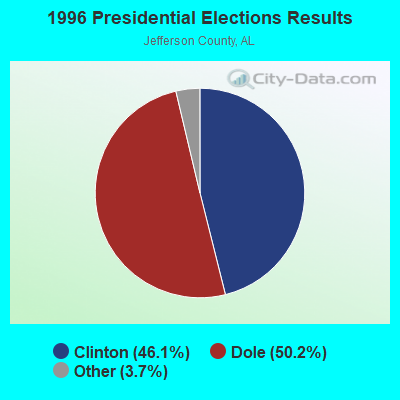
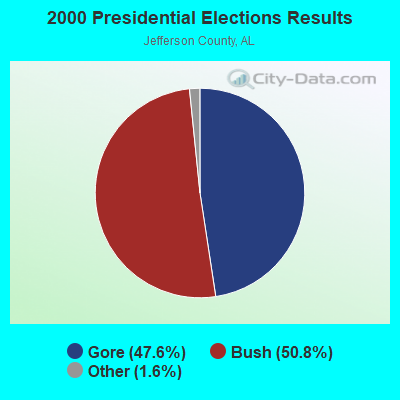
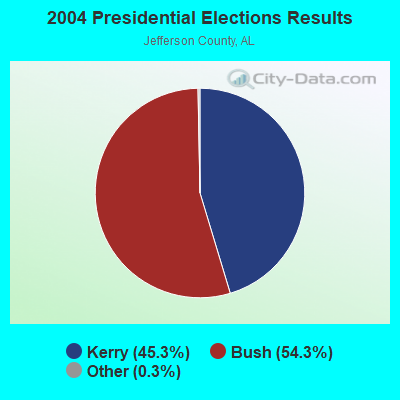
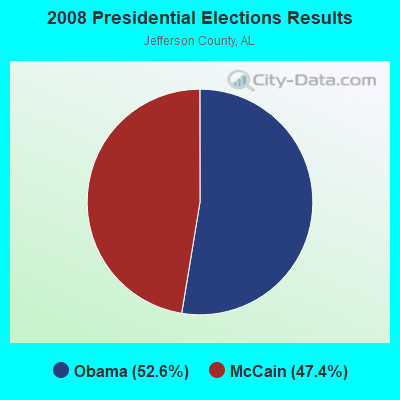
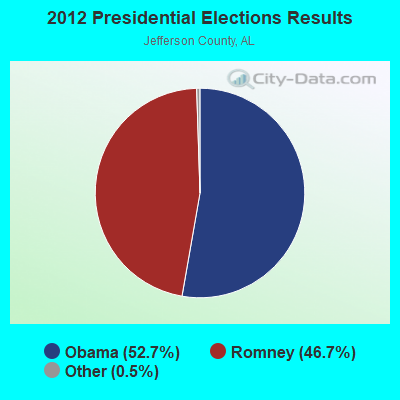
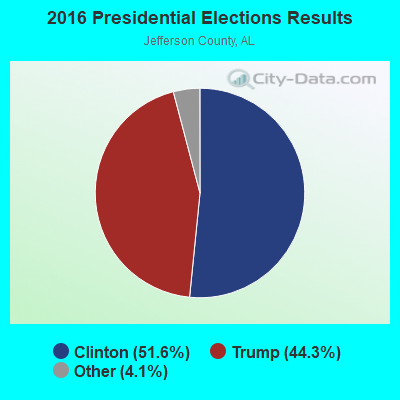
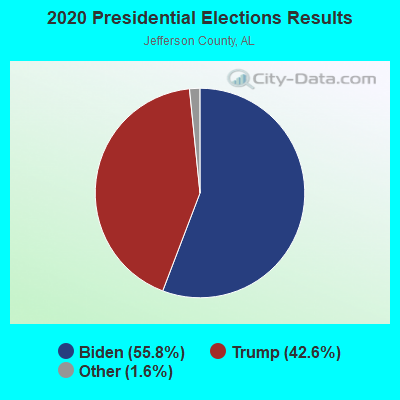
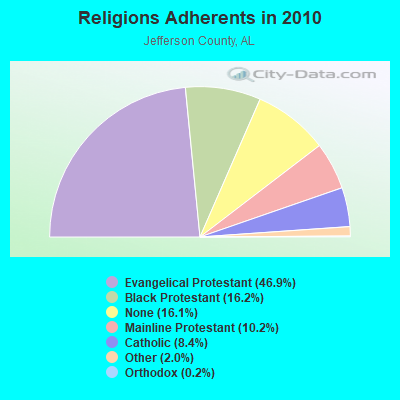
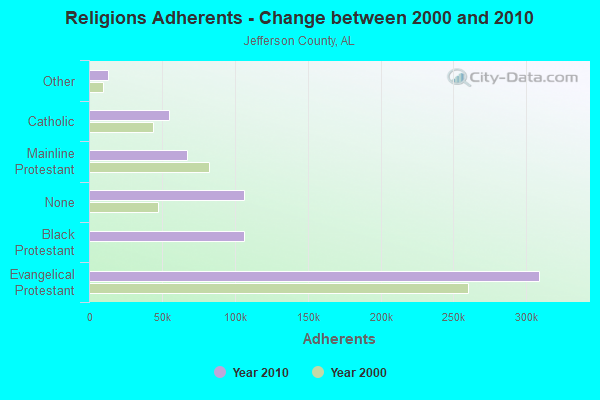
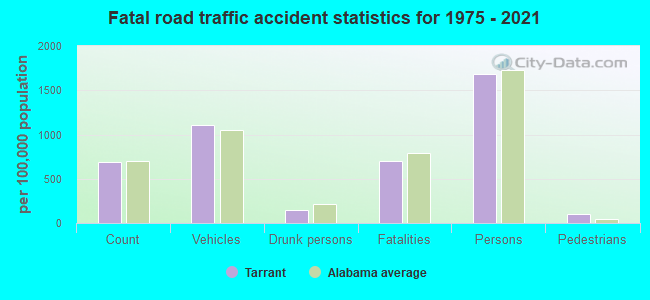
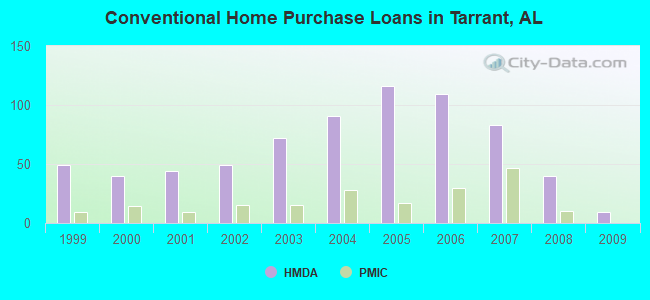
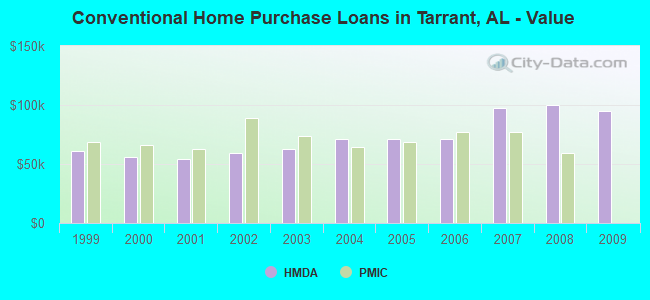
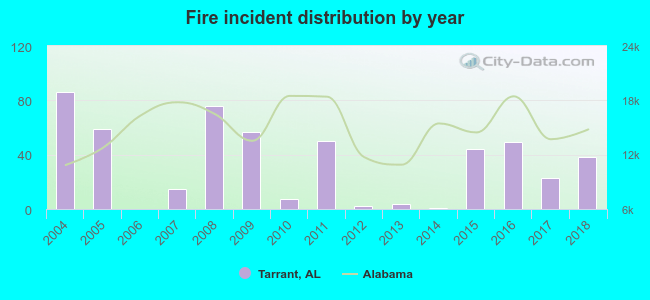 Based on the data from the years 2004 - 2018 the average number of fires per year is 34. The highest number of reported fire incidents - 86 took place in 2004, and the least - 0 in 2006. The data has a declining trend.
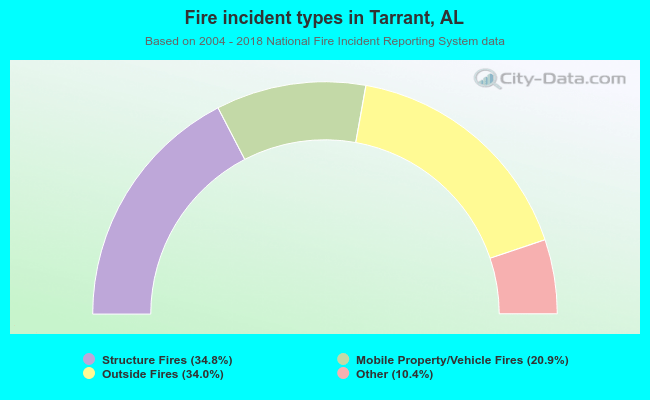 When looking into fire subcategories, the most incidents belonged to: Structure Fires (34.8%), and Outside Fires (34.0%).