Texas City, Texas Submit your own pictures of this city and show them to the world
OSM Map
General Map
Google Map
MSN Map
OSM Map
General Map
Google Map
MSN Map
OSM Map
General Map
Google Map
MSN Map
OSM Map
General Map
Google Map
MSN Map
Please wait while loading the map...
Population in 2022: 55,667 (96% urban, 4% rural). Population change since 2000: +34.1%Males: 26,615 Females: 29,052
March 2022 cost of living index in Texas City: 95.5 (near average, U.S. average is 100) Percentage of residents living in poverty in 2022: 15.4%for White Non-Hispanic residents , 25.2% for Black residents , 10.9% for Hispanic or Latino residents , 34.5% for American Indian residents , 12.2% for other race residents , 7.9% for two or more races residents )
Profiles of local businesses
Business Search - 14 Million verified businesses
Data:
Median household income ($)
Median household income (% change since 2000)
Household income diversity
Ratio of average income to average house value (%)
Ratio of average income to average rent
Median household income ($) - White
Median household income ($) - Black or African American
Median household income ($) - Asian
Median household income ($) - Hispanic or Latino
Median household income ($) - American Indian and Alaska Native
Median household income ($) - Multirace
Median household income ($) - Other Race
Median household income for houses/condos with a mortgage ($)
Median household income for apartments without a mortgage ($)
Races - White alone (%)
Races - White alone (% change since 2000)
Races - Black alone (%)
Races - Black alone (% change since 2000)
Races - American Indian alone (%)
Races - American Indian alone (% change since 2000)
Races - Asian alone (%)
Races - Asian alone (% change since 2000)
Races - Hispanic (%)
Races - Hispanic (% change since 2000)
Races - Native Hawaiian and Other Pacific Islander alone (%)
Races - Native Hawaiian and Other Pacific Islander alone (% change since 2000)
Races - Two or more races (%)
Races - Two or more races (% change since 2000)
Races - Other race alone (%)
Races - Other race alone (% change since 2000)
Racial diversity
Unemployment (%)
Unemployment (% change since 2000)
Unemployment (%) - White
Unemployment (%) - Black or African American
Unemployment (%) - Asian
Unemployment (%) - Hispanic or Latino
Unemployment (%) - American Indian and Alaska Native
Unemployment (%) - Multirace
Unemployment (%) - Other Race
Population density (people per square mile)
Population - Males (%)
Population - Females (%)
Population - Males (%) - White
Population - Males (%) - Black or African American
Population - Males (%) - Asian
Population - Males (%) - Hispanic or Latino
Population - Males (%) - American Indian and Alaska Native
Population - Males (%) - Multirace
Population - Males (%) - Other Race
Population - Females (%) - White
Population - Females (%) - Black or African American
Population - Females (%) - Asian
Population - Females (%) - Hispanic or Latino
Population - Females (%) - American Indian and Alaska Native
Population - Females (%) - Multirace
Population - Females (%) - Other Race
Coronavirus confirmed cases (Jun 16, 2024)
Deaths caused by coronavirus (Jun 16, 2024)
Coronavirus confirmed cases (per 100k population) (Jun 16, 2024)
Deaths caused by coronavirus (per 100k population) (Jun 16, 2024)
Daily increase in number of cases (Jun 16, 2024)
Weekly increase in number of cases (Jun 16, 2024)
Cases doubled (in days) (Jun 16, 2024)
Hospitalized patients (Apr 18, 2022)
Negative test results (Apr 18, 2022)
Total test results (Apr 18, 2022)
COVID Vaccine doses distributed (per 100k population) (Sep 19, 2023)
COVID Vaccine doses administered (per 100k population) (Sep 19, 2023)
COVID Vaccine doses distributed (Sep 19, 2023)
COVID Vaccine doses administered (Sep 19, 2023)
Likely homosexual households (%)
Likely homosexual households (% change since 2000)
Likely homosexual households - Lesbian couples (%)
Likely homosexual households - Lesbian couples (% change since 2000)
Likely homosexual households - Gay men (%)
Likely homosexual households - Gay men (% change since 2000)
Cost of living index
Median gross rent ($)
Median contract rent ($)
Median monthly housing costs ($)
Median house or condo value ($)
Median house or condo value ($ change since 2000)
Mean house or condo value by units in structure - 1, detached ($)
Mean house or condo value by units in structure - 1, attached ($)
Mean house or condo value by units in structure - 2 ($)
Mean house or condo value by units in structure by units in structure - 3 or 4 ($)
Mean house or condo value by units in structure - 5 or more ($)
Mean house or condo value by units in structure - Boat, RV, van, etc. ($)
Mean house or condo value by units in structure - Mobile home ($)
Median house or condo value ($) - White
Median house or condo value ($) - Black or African American
Median house or condo value ($) - Asian
Median house or condo value ($) - Hispanic or Latino
Median house or condo value ($) - American Indian and Alaska Native
Median house or condo value ($) - Multirace
Median house or condo value ($) - Other Race
Median resident age
Resident age diversity
Median resident age - Males
Median resident age - Females
Median resident age - White
Median resident age - Black or African American
Median resident age - Asian
Median resident age - Hispanic or Latino
Median resident age - American Indian and Alaska Native
Median resident age - Multirace
Median resident age - Other Race
Median resident age - Males - White
Median resident age - Males - Black or African American
Median resident age - Males - Asian
Median resident age - Males - Hispanic or Latino
Median resident age - Males - American Indian and Alaska Native
Median resident age - Males - Multirace
Median resident age - Males - Other Race
Median resident age - Females - White
Median resident age - Females - Black or African American
Median resident age - Females - Asian
Median resident age - Females - Hispanic or Latino
Median resident age - Females - American Indian and Alaska Native
Median resident age - Females - Multirace
Median resident age - Females - Other Race
Commute - mean travel time to work (minutes)
Travel time to work - Less than 5 minutes (%)
Travel time to work - Less than 5 minutes (% change since 2000)
Travel time to work - 5 to 9 minutes (%)
Travel time to work - 5 to 9 minutes (% change since 2000)
Travel time to work - 10 to 19 minutes (%)
Travel time to work - 10 to 19 minutes (% change since 2000)
Travel time to work - 20 to 29 minutes (%)
Travel time to work - 20 to 29 minutes (% change since 2000)
Travel time to work - 30 to 39 minutes (%)
Travel time to work - 30 to 39 minutes (% change since 2000)
Travel time to work - 40 to 59 minutes (%)
Travel time to work - 40 to 59 minutes (% change since 2000)
Travel time to work - 60 to 89 minutes (%)
Travel time to work - 60 to 89 minutes (% change since 2000)
Travel time to work - 90 or more minutes (%)
Travel time to work - 90 or more minutes (% change since 2000)
Marital status - Never married (%)
Marital status - Now married (%)
Marital status - Separated (%)
Marital status - Widowed (%)
Marital status - Divorced (%)
Median family income ($)
Median family income (% change since 2000)
Median non-family income ($)
Median non-family income (% change since 2000)
Median per capita income ($)
Median per capita income (% change since 2000)
Median family income ($) - White
Median family income ($) - Black or African American
Median family income ($) - Asian
Median family income ($) - Hispanic or Latino
Median family income ($) - American Indian and Alaska Native
Median family income ($) - Multirace
Median family income ($) - Other Race
Median year house/condo built
Median year apartment built
Year house built - Built 2005 or later (%)
Year house built - Built 2000 to 2004 (%)
Year house built - Built 1990 to 1999 (%)
Year house built - Built 1980 to 1989 (%)
Year house built - Built 1970 to 1979 (%)
Year house built - Built 1960 to 1969 (%)
Year house built - Built 1950 to 1959 (%)
Year house built - Built 1940 to 1949 (%)
Year house built - Built 1939 or earlier (%)
Average household size
Household density (households per square mile)
Average household size - White
Average household size - Black or African American
Average household size - Asian
Average household size - Hispanic or Latino
Average household size - American Indian and Alaska Native
Average household size - Multirace
Average household size - Other Race
Occupied housing units (%)
Vacant housing units (%)
Owner occupied housing units (%)
Renter occupied housing units (%)
Vacancy status - For rent (%)
Vacancy status - For sale only (%)
Vacancy status - Rented or sold, not occupied (%)
Vacancy status - For seasonal, recreational, or occasional use (%)
Vacancy status - For migrant workers (%)
Vacancy status - Other vacant (%)
Residents with income below the poverty level (%)
Residents with income below 50% of the poverty level (%)
Children below poverty level (%)
Poor families by family type - Married-couple family (%)
Poor families by family type - Male, no wife present (%)
Poor families by family type - Female, no husband present (%)
Poverty status for native-born residents (%)
Poverty status for foreign-born residents (%)
Poverty among high school graduates not in families (%)
Poverty among people who did not graduate high school not in families (%)
Residents with income below the poverty level (%) - White
Residents with income below the poverty level (%) - Black or African American
Residents with income below the poverty level (%) - Asian
Residents with income below the poverty level (%) - Hispanic or Latino
Residents with income below the poverty level (%) - American Indian and Alaska Native
Residents with income below the poverty level (%) - Multirace
Residents with income below the poverty level (%) - Other Race
Air pollution - Air Quality Index (AQI)
Air pollution - CO
Air pollution - NO2
Air pollution - SO2
Air pollution - Ozone
Air pollution - PM10
Air pollution - PM25
Air pollution - Pb
Crime - Murders per 100,000 population
Crime - Rapes per 100,000 population
Crime - Robberies per 100,000 population
Crime - Assaults per 100,000 population
Crime - Burglaries per 100,000 population
Crime - Thefts per 100,000 population
Crime - Auto thefts per 100,000 population
Crime - Arson per 100,000 population
Crime - City-data.com crime index
Crime - Violent crime index
Crime - Property crime index
Crime - Murders per 100,000 population (5 year average)
Crime - Rapes per 100,000 population (5 year average)
Crime - Robberies per 100,000 population (5 year average)
Crime - Assaults per 100,000 population (5 year average)
Crime - Burglaries per 100,000 population (5 year average)
Crime - Thefts per 100,000 population (5 year average)
Crime - Auto thefts per 100,000 population (5 year average)
Crime - Arson per 100,000 population (5 year average)
Crime - City-data.com crime index (5 year average)
Crime - Violent crime index (5 year average)
Crime - Property crime index (5 year average)
1996 Presidential Elections Results (%) - Democratic Party (Clinton)
1996 Presidential Elections Results (%) - Republican Party (Dole)
1996 Presidential Elections Results (%) - Other
2000 Presidential Elections Results (%) - Democratic Party (Gore)
2000 Presidential Elections Results (%) - Republican Party (Bush)
2000 Presidential Elections Results (%) - Other
2004 Presidential Elections Results (%) - Democratic Party (Kerry)
2004 Presidential Elections Results (%) - Republican Party (Bush)
2004 Presidential Elections Results (%) - Other
2008 Presidential Elections Results (%) - Democratic Party (Obama)
2008 Presidential Elections Results (%) - Republican Party (McCain)
2008 Presidential Elections Results (%) - Other
2012 Presidential Elections Results (%) - Democratic Party (Obama)
2012 Presidential Elections Results (%) - Republican Party (Romney)
2012 Presidential Elections Results (%) - Other
2016 Presidential Elections Results (%) - Democratic Party (Clinton)
2016 Presidential Elections Results (%) - Republican Party (Trump)
2016 Presidential Elections Results (%) - Other
2020 Presidential Elections Results (%) - Democratic Party (Biden)
2020 Presidential Elections Results (%) - Republican Party (Trump)
2020 Presidential Elections Results (%) - Other
Ancestries Reported - Arab (%)
Ancestries Reported - Czech (%)
Ancestries Reported - Danish (%)
Ancestries Reported - Dutch (%)
Ancestries Reported - English (%)
Ancestries Reported - French (%)
Ancestries Reported - French Canadian (%)
Ancestries Reported - German (%)
Ancestries Reported - Greek (%)
Ancestries Reported - Hungarian (%)
Ancestries Reported - Irish (%)
Ancestries Reported - Italian (%)
Ancestries Reported - Lithuanian (%)
Ancestries Reported - Norwegian (%)
Ancestries Reported - Polish (%)
Ancestries Reported - Portuguese (%)
Ancestries Reported - Russian (%)
Ancestries Reported - Scotch-Irish (%)
Ancestries Reported - Scottish (%)
Ancestries Reported - Slovak (%)
Ancestries Reported - Subsaharan African (%)
Ancestries Reported - Swedish (%)
Ancestries Reported - Swiss (%)
Ancestries Reported - Ukrainian (%)
Ancestries Reported - United States (%)
Ancestries Reported - Welsh (%)
Ancestries Reported - West Indian (%)
Ancestries Reported - Other (%)
Educational Attainment - No schooling completed (%)
Educational Attainment - Less than high school (%)
Educational Attainment - High school or equivalent (%)
Educational Attainment - Less than 1 year of college (%)
Educational Attainment - 1 or more years of college (%)
Educational Attainment - Associate degree (%)
Educational Attainment - Bachelor's degree (%)
Educational Attainment - Master's degree (%)
Educational Attainment - Professional school degree (%)
Educational Attainment - Doctorate degree (%)
School Enrollment - Nursery, preschool (%)
School Enrollment - Kindergarten (%)
School Enrollment - Grade 1 to 4 (%)
School Enrollment - Grade 5 to 8 (%)
School Enrollment - Grade 9 to 12 (%)
School Enrollment - College undergrad (%)
School Enrollment - Graduate or professional (%)
School Enrollment - Not enrolled in school (%)
School enrollment - Public schools (%)
School enrollment - Private schools (%)
School enrollment - Not enrolled (%)
Median number of rooms in houses and condos
Median number of rooms in apartments
Housing units lacking complete plumbing facilities (%)
Housing units lacking complete kitchen facilities (%)
Density of houses
Urban houses (%)
Rural houses (%)
Households with people 60 years and over (%)
Households with people 65 years and over (%)
Households with people 75 years and over (%)
Households with one or more nonrelatives (%)
Households with no nonrelatives (%)
Population in households (%)
Family households (%)
Nonfamily households (%)
Population in families (%)
Family households with own children (%)
Median number of bedrooms in owner occupied houses
Mean number of bedrooms in owner occupied houses
Median number of bedrooms in renter occupied houses
Mean number of bedrooms in renter occupied houses
Median number of vehichles in owner occupied houses
Mean number of vehichles in owner occupied houses
Median number of vehichles in renter occupied houses
Mean number of vehichles in renter occupied houses
Mortgage status - with mortgage (%)
Mortgage status - with second mortgage (%)
Mortgage status - with home equity loan (%)
Mortgage status - with both second mortgage and home equity loan (%)
Mortgage status - without a mortgage (%)
Average family size
Average family size - White
Average family size - Black or African American
Average family size - Asian
Average family size - Hispanic or Latino
Average family size - American Indian and Alaska Native
Average family size - Multirace
Average family size - Other Race
Geographical mobility - Same house 1 year ago (%)
Geographical mobility - Moved within same county (%)
Geographical mobility - Moved from different county within same state (%)
Geographical mobility - Moved from different state (%)
Geographical mobility - Moved from abroad (%)
Place of birth - Born in state of residence (%)
Place of birth - Born in other state (%)
Place of birth - Native, outside of US (%)
Place of birth - Foreign born (%)
Housing units in structures - 1, detached (%)
Housing units in structures - 1, attached (%)
Housing units in structures - 2 (%)
Housing units in structures - 3 or 4 (%)
Housing units in structures - 5 to 9 (%)
Housing units in structures - 10 to 19 (%)
Housing units in structures - 20 to 49 (%)
Housing units in structures - 50 or more (%)
Housing units in structures - Mobile home (%)
Housing units in structures - Boat, RV, van, etc. (%)
House/condo owner moved in on average (years ago)
Renter moved in on average (years ago)
Year householder moved into unit - Moved in 1999 to March 2000 (%)
Year householder moved into unit - Moved in 1995 to 1998 (%)
Year householder moved into unit - Moved in 1990 to 1994 (%)
Year householder moved into unit - Moved in 1980 to 1989 (%)
Year householder moved into unit - Moved in 1970 to 1979 (%)
Year householder moved into unit - Moved in 1969 or earlier (%)
Means of transportation to work - Drove car alone (%)
Means of transportation to work - Carpooled (%)
Means of transportation to work - Public transportation (%)
Means of transportation to work - Bus or trolley bus (%)
Means of transportation to work - Streetcar or trolley car (%)
Means of transportation to work - Subway or elevated (%)
Means of transportation to work - Railroad (%)
Means of transportation to work - Ferryboat (%)
Means of transportation to work - Taxicab (%)
Means of transportation to work - Motorcycle (%)
Means of transportation to work - Bicycle (%)
Means of transportation to work - Walked (%)
Means of transportation to work - Other means (%)
Working at home (%)
Industry diversity
Most Common Industries - Agriculture, forestry, fishing and hunting, and mining (%)
Most Common Industries - Agriculture, forestry, fishing and hunting (%)
Most Common Industries - Mining, quarrying, and oil and gas extraction (%)
Most Common Industries - Construction (%)
Most Common Industries - Manufacturing (%)
Most Common Industries - Wholesale trade (%)
Most Common Industries - Retail trade (%)
Most Common Industries - Transportation and warehousing, and utilities (%)
Most Common Industries - Transportation and warehousing (%)
Most Common Industries - Utilities (%)
Most Common Industries - Information (%)
Most Common Industries - Finance and insurance, and real estate and rental and leasing (%)
Most Common Industries - Finance and insurance (%)
Most Common Industries - Real estate and rental and leasing (%)
Most Common Industries - Professional, scientific, and management, and administrative and waste management services (%)
Most Common Industries - Professional, scientific, and technical services (%)
Most Common Industries - Management of companies and enterprises (%)
Most Common Industries - Administrative and support and waste management services (%)
Most Common Industries - Educational services, and health care and social assistance (%)
Most Common Industries - Educational services (%)
Most Common Industries - Health care and social assistance (%)
Most Common Industries - Arts, entertainment, and recreation, and accommodation and food services (%)
Most Common Industries - Arts, entertainment, and recreation (%)
Most Common Industries - Accommodation and food services (%)
Most Common Industries - Other services, except public administration (%)
Most Common Industries - Public administration (%)
Occupation diversity
Most Common Occupations - Management, business, science, and arts occupations (%)
Most Common Occupations - Management, business, and financial occupations (%)
Most Common Occupations - Management occupations (%)
Most Common Occupations - Business and financial operations occupations (%)
Most Common Occupations - Computer, engineering, and science occupations (%)
Most Common Occupations - Computer and mathematical occupations (%)
Most Common Occupations - Architecture and engineering occupations (%)
Most Common Occupations - Life, physical, and social science occupations (%)
Most Common Occupations - Education, legal, community service, arts, and media occupations (%)
Most Common Occupations - Community and social service occupations (%)
Most Common Occupations - Legal occupations (%)
Most Common Occupations - Education, training, and library occupations (%)
Most Common Occupations - Arts, design, entertainment, sports, and media occupations (%)
Most Common Occupations - Healthcare practitioners and technical occupations (%)
Most Common Occupations - Health diagnosing and treating practitioners and other technical occupations (%)
Most Common Occupations - Health technologists and technicians (%)
Most Common Occupations - Service occupations (%)
Most Common Occupations - Healthcare support occupations (%)
Most Common Occupations - Protective service occupations (%)
Most Common Occupations - Fire fighting and prevention, and other protective service workers including supervisors (%)
Most Common Occupations - Law enforcement workers including supervisors (%)
Most Common Occupations - Food preparation and serving related occupations (%)
Most Common Occupations - Building and grounds cleaning and maintenance occupations (%)
Most Common Occupations - Personal care and service occupations (%)
Most Common Occupations - Sales and office occupations (%)
Most Common Occupations - Sales and related occupations (%)
Most Common Occupations - Office and administrative support occupations (%)
Most Common Occupations - Natural resources, construction, and maintenance occupations (%)
Most Common Occupations - Farming, fishing, and forestry occupations (%)
Most Common Occupations - Construction and extraction occupations (%)
Most Common Occupations - Installation, maintenance, and repair occupations (%)
Most Common Occupations - Production, transportation, and material moving occupations (%)
Most Common Occupations - Production occupations (%)
Most Common Occupations - Transportation occupations (%)
Most Common Occupations - Material moving occupations (%)
People in Group quarters - Institutionalized population (%)
People in Group quarters - Correctional institutions (%)
People in Group quarters - Federal prisons and detention centers (%)
People in Group quarters - Halfway houses (%)
People in Group quarters - Local jails and other confinement facilities (including police lockups) (%)
People in Group quarters - Military disciplinary barracks (%)
People in Group quarters - State prisons (%)
People in Group quarters - Other types of correctional institutions (%)
People in Group quarters - Nursing homes (%)
People in Group quarters - Hospitals/wards, hospices, and schools for the handicapped (%)
People in Group quarters - Hospitals/wards and hospices for chronically ill (%)
People in Group quarters - Hospices or homes for chronically ill (%)
People in Group quarters - Military hospitals or wards for chronically ill (%)
People in Group quarters - Other hospitals or wards for chronically ill (%)
People in Group quarters - Hospitals or wards for drug/alcohol abuse (%)
People in Group quarters - Mental (Psychiatric) hospitals or wards (%)
People in Group quarters - Schools, hospitals, or wards for the mentally retarded (%)
People in Group quarters - Schools, hospitals, or wards for the physically handicapped (%)
People in Group quarters - Institutions for the deaf (%)
People in Group quarters - Institutions for the blind (%)
People in Group quarters - Orthopedic wards and institutions for the physically handicapped (%)
People in Group quarters - Wards in general hospitals for patients who have no usual home elsewhere (%)
People in Group quarters - Wards in military hospitals for patients who have no usual home elsewhere (%)
People in Group quarters - Juvenile institutions (%)
People in Group quarters - Long-term care (%)
People in Group quarters - Homes for abused, dependent, and neglected children (%)
People in Group quarters - Residential treatment centers for emotionally disturbed children (%)
People in Group quarters - Training schools for juvenile delinquents (%)
People in Group quarters - Short-term care, detention or diagnostic centers for delinquent children (%)
People in Group quarters - Type of juvenile institution unknown (%)
People in Group quarters - Noninstitutionalized population (%)
People in Group quarters - College dormitories (includes college quarters off campus) (%)
People in Group quarters - Military quarters (%)
People in Group quarters - On base (%)
People in Group quarters - Barracks, unaccompanied personnel housing (UPH), (Enlisted/Officer), ;and similar group living quarters for military personnel (%)
People in Group quarters - Transient quarters for temporary residents (%)
People in Group quarters - Military ships (%)
People in Group quarters - Group homes (%)
People in Group quarters - Homes or halfway houses for drug/alcohol abuse (%)
People in Group quarters - Homes for the mentally ill (%)
People in Group quarters - Homes for the mentally retarded (%)
People in Group quarters - Homes for the physically handicapped (%)
People in Group quarters - Other group homes (%)
People in Group quarters - Religious group quarters (%)
People in Group quarters - Dormitories (%)
People in Group quarters - Agriculture workers' dormitories on farms (%)
People in Group quarters - Job Corps and vocational training facilities (%)
People in Group quarters - Other workers' dormitories (%)
People in Group quarters - Crews of maritime vessels (%)
People in Group quarters - Other nonhousehold living situations (%)
People in Group quarters - Other noninstitutional group quarters (%)
Residents speaking English at home (%)
Residents speaking English at home - Born in the United States (%)
Residents speaking English at home - Native, born elsewhere (%)
Residents speaking English at home - Foreign born (%)
Residents speaking Spanish at home (%)
Residents speaking Spanish at home - Born in the United States (%)
Residents speaking Spanish at home - Native, born elsewhere (%)
Residents speaking Spanish at home - Foreign born (%)
Residents speaking other language at home (%)
Residents speaking other language at home - Born in the United States (%)
Residents speaking other language at home - Native, born elsewhere (%)
Residents speaking other language at home - Foreign born (%)
Class of Workers - Employee of private company (%)
Class of Workers - Self-employed in own incorporated business (%)
Class of Workers - Private not-for-profit wage and salary workers (%)
Class of Workers - Local government workers (%)
Class of Workers - State government workers (%)
Class of Workers - Federal government workers (%)
Class of Workers - Self-employed workers in own not incorporated business and Unpaid family workers (%)
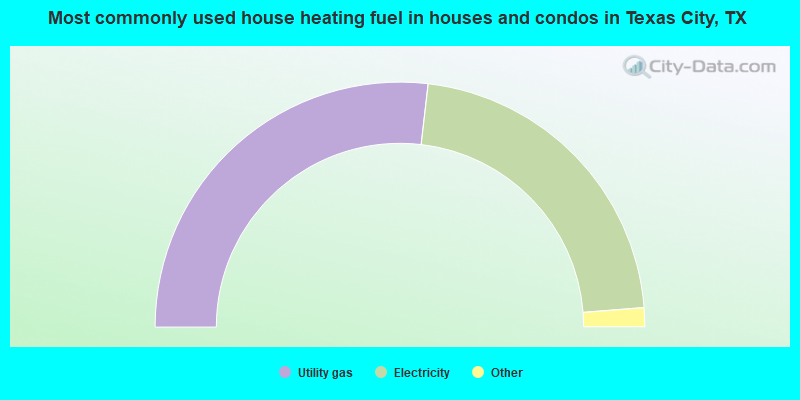
House heating fuel used in houses and condos - Utility gas (%)
House heating fuel used in houses and condos - Bottled, tank, or LP gas (%)
House heating fuel used in houses and condos - Electricity (%)
House heating fuel used in houses and condos - Fuel oil, kerosene, etc. (%)
House heating fuel used in houses and condos - Coal or coke (%)
House heating fuel used in houses and condos - Wood (%)
House heating fuel used in houses and condos - Solar energy (%)
House heating fuel used in houses and condos - Other fuel (%)
House heating fuel used in houses and condos - No fuel used (%)
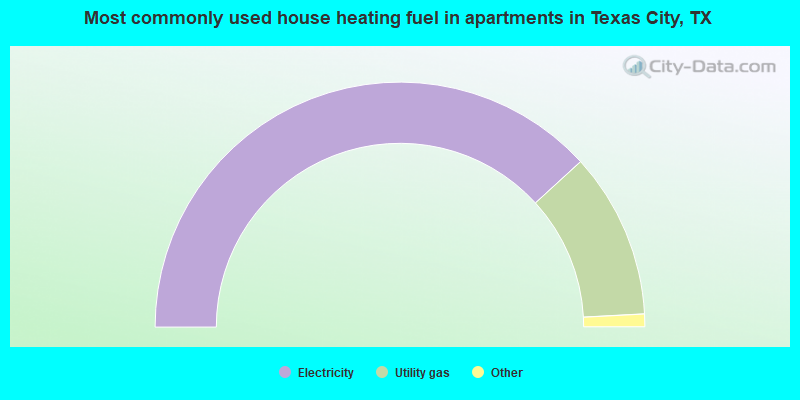
House heating fuel used in apartments - Utility gas (%)
House heating fuel used in apartments - Bottled, tank, or LP gas (%)
House heating fuel used in apartments - Electricity (%)
House heating fuel used in apartments - Fuel oil, kerosene, etc. (%)
House heating fuel used in apartments - Coal or coke (%)
House heating fuel used in apartments - Wood (%)
House heating fuel used in apartments - Solar energy (%)
House heating fuel used in apartments - Other fuel (%)
House heating fuel used in apartments - No fuel used (%)
Armed forces status - In Armed Forces (%)
Armed forces status - Civilian (%)
Armed forces status - Civilian - Veteran (%)
Armed forces status - Civilian - Nonveteran (%)
Fatal accidents locations in years 2005-2021
Fatal accidents locations in 2005
Fatal accidents locations in 2006
Fatal accidents locations in 2007
Fatal accidents locations in 2008
Fatal accidents locations in 2009
Fatal accidents locations in 2010
Fatal accidents locations in 2011
Fatal accidents locations in 2012
Fatal accidents locations in 2013
Fatal accidents locations in 2014
Fatal accidents locations in 2015
Fatal accidents locations in 2016
Fatal accidents locations in 2017
Fatal accidents locations in 2018
Fatal accidents locations in 2019
Fatal accidents locations in 2020
Fatal accidents locations in 2021
Alcohol use - People drinking some alcohol every month (%)
Alcohol use - People not drinking at all (%)
Alcohol use - Average days/month drinking alcohol
Alcohol use - Average drinks/week
Alcohol use - Average days/year people drink much
Audiometry - Average condition of hearing (%)
Audiometry - People that can hear a whisper from across a quiet room (%)
Audiometry - People that can hear normal voice from across a quiet room (%)
Audiometry - Ears ringing, roaring, buzzing (%)
Audiometry - Had a job exposure to loud noise (%)
Audiometry - Had off-work exposure to loud noise (%)
Blood Pressure & Cholesterol - Has high blood pressure (%)
Blood Pressure & Cholesterol - Checking blood pressure at home (%)
Blood Pressure & Cholesterol - Frequently checking blood cholesterol (%)
Blood Pressure & Cholesterol - Has high cholesterol level (%)
Consumer Behavior - Money monthly spent on food at supermarket/grocery store
Consumer Behavior - Money monthly spent on food at other stores
Consumer Behavior - Money monthly spent on eating out
Consumer Behavior - Money monthly spent on carryout/delivered foods
Consumer Behavior - Income spent on food at supermarket/grocery store (%)
Consumer Behavior - Income spent on food at other stores (%)
Consumer Behavior - Income spent on eating out (%)
Consumer Behavior - Income spent on carryout/delivered foods (%)
Current Health Status - General health condition (%)
Current Health Status - Blood donors (%)
Current Health Status - Has blood ever tested for HIV virus (%)
Current Health Status - Left-handed people (%)
Dermatology - People using sunscreen (%)
Diabetes - Diabetics (%)
Diabetes - Had a blood test for high blood sugar (%)
Diabetes - People taking insulin (%)
Diet Behavior & Nutrition - Diet health (%)
Diet Behavior & Nutrition - Milk product consumption (# of products/month)
Diet Behavior & Nutrition - Meals not home prepared (#/week)
Diet Behavior & Nutrition - Meals from fast food or pizza place (#/week)
Diet Behavior & Nutrition - Ready-to-eat foods (#/month)
Diet Behavior & Nutrition - Frozen meals/pizza (#/month)
Drug Use - People that ever used marijuana or hashish (%)
Drug Use - Ever used hard drugs (%)
Drug Use - Ever used any form of cocaine (%)
Drug Use - Ever used heroin (%)
Drug Use - Ever used methamphetamine (%)
Health Insurance - People covered by health insurance (%)
Kidney Conditions-Urology - Avg. # of times urinating at night
Medical Conditions - People with asthma (%)
Medical Conditions - People with anemia (%)
Medical Conditions - People with psoriasis (%)
Medical Conditions - People with overweight (%)
Medical Conditions - Elderly people having difficulties in thinking or remembering (%)
Medical Conditions - People who ever received blood transfusion (%)
Medical Conditions - People having trouble seeing even with glass/contacts (%)
Medical Conditions - People with arthritis (%)
Medical Conditions - People with gout (%)
Medical Conditions - People with congestive heart failure (%)
Medical Conditions - People with coronary heart disease (%)
Medical Conditions - People with angina pectoris (%)
Medical Conditions - People who ever had heart attack (%)
Medical Conditions - People who ever had stroke (%)
Medical Conditions - People with emphysema (%)
Medical Conditions - People with thyroid problem (%)
Medical Conditions - People with chronic bronchitis (%)
Medical Conditions - People with any liver condition (%)
Medical Conditions - People who ever had cancer or malignancy (%)
Mental Health - People who have little interest in doing things (%)
Mental Health - People feeling down, depressed, or hopeless (%)
Mental Health - People who have trouble sleeping or sleeping too much (%)
Mental Health - People feeling tired or having little energy (%)
Mental Health - People with poor appetite or overeating (%)
Mental Health - People feeling bad about themself (%)
Mental Health - People who have trouble concentrating on things (%)
Mental Health - People moving or speaking slowly or too fast (%)
Mental Health - People having thoughts they would be better off dead (%)
Oral Health - Average years since last visit a dentist
Oral Health - People embarrassed because of mouth (%)
Oral Health - People with gum disease (%)
Oral Health - General health of teeth and gums (%)
Oral Health - Average days a week using dental floss/device
Oral Health - Average days a week using mouthwash for dental problem
Oral Health - Average number of teeth
Pesticide Use - Households using pesticides to control insects (%)
Pesticide Use - Households using pesticides to kill weeds (%)
Physical Activity - People doing vigorous-intensity work activities (%)
Physical Activity - People doing moderate-intensity work activities (%)
Physical Activity - People walking or bicycling (%)
Physical Activity - People doing vigorous-intensity recreational activities (%)
Physical Activity - People doing moderate-intensity recreational activities (%)
Physical Activity - Average hours a day doing sedentary activities
Physical Activity - Average hours a day watching TV or videos
Physical Activity - Average hours a day using computer
Physical Functioning - People having limitations keeping them from working (%)
Physical Functioning - People limited in amount of work they can do (%)
Physical Functioning - People that need special equipment to walk (%)
Physical Functioning - People experiencing confusion/memory problems (%)
Physical Functioning - People requiring special healthcare equipment (%)
Prescription Medications - Average number of prescription medicines taking
Preventive Aspirin Use - Adults 40+ taking low-dose aspirin (%)
Reproductive Health - Vaginal deliveries (%)
Reproductive Health - Cesarean deliveries (%)
Reproductive Health - Deliveries resulted in a live birth (%)
Reproductive Health - Pregnancies resulted in a delivery (%)
Reproductive Health - Women breastfeeding newborns (%)
Reproductive Health - Women that had a hysterectomy (%)
Reproductive Health - Women that had both ovaries removed (%)
Reproductive Health - Women that have ever taken birth control pills (%)
Reproductive Health - Women taking birth control pills (%)
Reproductive Health - Women that have ever used Depo-Provera or injectables (%)
Reproductive Health - Women that have ever used female hormones (%)
Sexual Behavior - People 18+ that ever had sex (vaginal, anal, or oral) (%)
Sexual Behavior - Males 18+ that ever had vaginal sex with a woman (%)
Sexual Behavior - Males 18+ that ever performed oral sex on a woman (%)
Sexual Behavior - Males 18+ that ever had anal sex with a woman (%)
Sexual Behavior - Males 18+ that ever had any sex with a man (%)
Sexual Behavior - Females 18+ that ever had vaginal sex with a man (%)
Sexual Behavior - Females 18+ that ever performed oral sex on a man (%)
Sexual Behavior - Females 18+ that ever had anal sex with a man (%)
Sexual Behavior - Females 18+ that ever had any kind of sex with a woman (%)
Sexual Behavior - Average age people first had sex
Sexual Behavior - Average number of female sex partners in lifetime (males 18+)
Sexual Behavior - Average number of female vaginal sex partners in lifetime (males 18+)
Sexual Behavior - Average age people first performed oral sex on a woman (18+)
Sexual Behavior - Average number of woman performed oral sex on in lifetime (18+)
Sexual Behavior - Average number of male sex partners in lifetime (males 18+)
Sexual Behavior - Average number of male anal sex partners in lifetime (males 18+)
Sexual Behavior - Average age people first performed oral sex on a man (18+)
Sexual Behavior - Average number of male oral sex partners in lifetime (18+)
Sexual Behavior - People using protection when performing oral sex (%)
Sexual Behavior - Average number of times people have vaginal or anal sex a year
Sexual Behavior - People having sex without condom (%)
Sexual Behavior - Average number of male sex partners in lifetime (females 18+)
Sexual Behavior - Average number of male vaginal sex partners in lifetime (females 18+)
Sexual Behavior - Average number of female sex partners in lifetime (females 18+)
Sexual Behavior - Circumcised males 18+ (%)
Sleep Disorders - Average hours sleeping at night
Sleep Disorders - People that has trouble sleeping (%)
Smoking-Cigarette Use - People smoking cigarettes (%)
Taste & Smell - People 40+ having problems with smell (%)
Taste & Smell - People 40+ having problems with taste (%)
Taste & Smell - People 40+ that ever had wisdom teeth removed (%)
Taste & Smell - People 40+ that ever had tonsils teeth removed (%)
Taste & Smell - People 40+ that ever had a loss of consciousness because of a head injury (%)
Taste & Smell - People 40+ that ever had a broken nose or other serious injury to face or skull (%)
Taste & Smell - People 40+ that ever had two or more sinus infections (%)
Weight - Average height (inches)
Weight - Average weight (pounds)
Weight - Average BMI
Weight - People that are obese (%)
Weight - People that ever were obese (%)
Weight - People trying to lose weight (%)
According to our research of Texas and other state lists, there were 91 registered sex offenders living in Texas City, Texas as of June 16, 2024 . The ratio of all residents to sex offenders in Texas City is 539 to 1.The ratio of registered sex offenders to all residents in this city is lower than the state average.
The City-Data.com crime index weighs serious crimes and violent crimes more heavily. Higher means more crime, U.S. average is 246.1. It adjusts for the number of visitors and daily workers commuting into cities.
- means the value is smaller than the state average.
- means the value is about the same as the state average.
- means the value is bigger than the state average.
- means the value is much bigger than the state average.
Crime rate in Texas City detailed stats: murders, rapes, robberies, assaults, burglaries, thefts, arson Officers per 1,000 residents here:
1.65Texas average:
2.07
Latest news from Texas City, TX collected exclusively by city-data.com from local newspapers, TV, and radio stations
Ancestries: German (5.7%), American (3.6%), English (3.3%), Irish (3.3%), French (1.3%).
Current Local Time:
Land area: 62.4 square miles.
Population density: 893 people per square mile (low).
4,176 residents are foreign born (5.6% Latin America , 1.1% Asia ).
This city:
7.7%Texas:
17.1%
Median real estate property taxes paid for housing units with mortgages in 2022: $2,966 (1.4%)Median real estate property taxes paid for housing units with no mortgage in 2022: $1,650 (1.0%)
Nearest city with pop. 50,000+: Galveston, TX
Nearest city with pop. 200,000+: Houston, TX
Nearest cities:
Latitude: 29.40 N, Longitude: 94.93 W
Texas City nicknames or aliases (official or unofficial):
City By the Bay, Toxic CityDaytime population change due to commuting: -1,642 (-3.0%)Workers who live and work in this city: 7,947 (33.9%)
Single-family new house construction building permits:
2022: 481 buildings , average cost: $251,0002021: 829 buildings , average cost: $233,9002020: 778 buildings , average cost: $185,5002019: 496 buildings , average cost: $153,3002018: 510 buildings , average cost: $153,9002017: 379 buildings , average cost: $163,2002016: 188 buildings , average cost: $168,6002015: 177 buildings , average cost: $142,6002014: 364 buildings , average cost: $123,4002013: 104 buildings , average cost: $159,6002012: 103 buildings , average cost: $137,2002011: 144 buildings , average cost: $91,7002010: 35 buildings , average cost: $110,5002009: 26 buildings , average cost: $129,0002008: 83 buildings , average cost: $127,2002007: 158 buildings , average cost: $131,9002006: 146 buildings , average cost: $122,8002005: 346 buildings , average cost: $85,4002004: 394 buildings , average cost: $87,8002003: 216 buildings , average cost: $100,8002002: 65 buildings , average cost: $85,4002001: 78 buildings , average cost: $102,2002000: 367 buildings , average cost: $68,0001999: 120 buildings , average cost: $92,0001998: 102 buildings , average cost: $91,4001997: 100 buildings , average cost: $90,300Unemployment in December 2023:
Population change in the 1990s: +532 (+1.3%).
Most common occupations in Texas City, TX (%)
Both Males Females
Other production occupations, including supervisors (5.4%)
Other office and administrative support workers, including supervisors (4.7%)
Building and grounds cleaning and maintenance occupations (4.5%)
Retail sales workers, except cashiers (3.8%)
Electrical equipment mechanics and other installation, maintenance, and repair workers, including supervisors (3.4%)
Secretaries and administrative assistants (3.3%)
Other sales and related occupations, including supervisors (3.3%)
Other production occupations, including supervisors (9.5%)
Electrical equipment mechanics and other installation, maintenance, and repair workers, including supervisors (6.1%)
Building and grounds cleaning and maintenance occupations (4.9%)
Driver/sales workers and truck drivers (4.3%)
Other sales and related occupations, including supervisors (3.6%)
Other management occupations, except farmers and farm managers (3.5%)
Metal workers and plastic workers (3.5%)
Other office and administrative support workers, including supervisors (7.7%)
Secretaries and administrative assistants (6.4%)
Cashiers (5.3%)
Preschool, kindergarten, elementary, and middle school teachers (4.6%)
Registered nurses (4.2%)
Building and grounds cleaning and maintenance occupations (4.1%)
Retail sales workers, except cashiers (4.0%)
Tornado activity:
Texas City-area historical tornado activity is slightly above Texas state average. It is 57% greater than the overall U.S. average.
On 9/12/1961, a category F4 (max. wind speeds 207-260 mph) tornado 10.8 miles away from the Texas City city center killed 8 people and injured 200 people .
On 8/18/1967, a category F3 (max. wind speeds 158-206 mph) tornado 1.6 miles away from the city center .
Earthquake activity:
Texas City-area historical earthquake activity is significantly above Texas state average. It is 43% smaller than the overall U.S. average. On 5/17/2012 at 08:12:00, a magnitude 4.8 (4.8 MW, Depth: 3.1 mi, Class: Light, Intensity: IV - V) earthquake occurred 177.9 miles away from the city center On 10/20/2011 at 12:24:41, a magnitude 4.8 (4.8 MW, Depth: 3.1 mi) earthquake occurred 193.6 miles away from Texas City center On 9/2/2013 at 23:51:15, a magnitude 4.3 (4.3 MW, Depth: 2.9 mi) earthquake occurred 176.2 miles away from Texas City center On 4/9/1993 at 12:29:19, a magnitude 4.3 (4.1 MB, 4.3 LG, Depth: 3.1 mi) earthquake occurred 197.0 miles away from Texas City center On 9/2/2013 at 21:52:38, a magnitude 4.2 (4.2 MW, Depth: 3.0 mi) earthquake occurred 179.1 miles away from the city center On 1/25/2013 at 07:01:19, a magnitude 4.1 (4.1 MB, Depth: 3.1 mi) earthquake occurred 173.2 miles away from the city center Magnitude types: regional Lg-wave magnitude (LG), body-wave magnitude (MB), moment magnitude (MW) Natural disasters: The number of natural disasters in Galveston County (23) is greater than the US average (15).Major Disasters (Presidential) Declared: 14Emergencies Declared: 7Hurricanes: 11, Storms: 7, Floods: 6, Fires: 2, Tornadoes: 2, Tropical Storms: 2, Flash Flood: 1, Wind: 1, Other: 1 (Note: some incidents may be assigned to more than one category). Hospitals in Texas City: AMED COMMUNITY HOSPICE (8901 EMMETT F LOWRY SUITE B) HOSPICE CARE TEAM INC (1708 AMBURN SUITE C) MAINLAND MEDICAL CENTER (provides emergency services, 6801 EMMETT LOWRY EXPRESSWAY) Nursing Homes in Texas City: ASHTON PARKE CARE CENTER INC (210 GULF FREEWAY) AVALON PLACE TEXAS CITY (210 GULF FREEWAY) BAY BROOK VILLA (501 EIGHTH AVENUE NORTH) BAY OAKS HEALTH CARE CENTER (424 N TARPEY RD) COLONIAL CARE CENTER (815 FIFTH AVENUE NORTH) DANFORTH HOSPITAL (519 9TH AVE) GULF HEALTH CARE CENTER TEXAS CITY (1720 N LOGAN ST) OCEANVIEW TRANSITIONAL CARE CENTER (519 NINTH AVE N) SEABREEZE NURSING AND REHABILITATION LP (6602 MEMORIAL DR) Dialysis Facilities in Texas City: SNG - SANDCASTLE DIALYSIS CENTER (8900 EMMETT F. LOWRY EXP) TEXAS CITY DIALYSIS, LP (3557 PALMER HWY) Home Health Centers in Texas City: AMED HOME HEALTH (8900 E F LOWRY EXPRESSWAY SUITE 102) Amtrak stations near Texas City: 3 miles: LAMARQUE (725 OAK) - Bus Station 12 miles: GALVESTON (BEACH CENTRAL STA., 21ST AT SEAWALL) - Bus Station
College/University in Texas City: College of the Mainland Full-time enrollment: 2,739; Location: 1200 Amburn Road; Public; Website: www.com.edu)
Other colleges/universities with over 2000 students near Texas City:
The University of Texas Medical Branch (about 12 miles; Galveston, TX ; Full-time enrollment: 2,314)
University of Houston-Clear Lake (about 17 miles; Houston, TX ; FT enrollment: 5,833)
Alvin Community College (about 19 miles; Alvin, TX ; FT enrollment: 3,953)
San Jacinto Community College (about 22 miles; Pasadena, TX ; FT enrollment: 13,517)
Lee College (about 24 miles; Baytown, TX ; FT enrollment: 4,278)
University of Houston (about 34 miles; Houston, TX ; FT enrollment: 31,888)
Texas Southern University (about 35 miles; Houston, TX ; FT enrollment: 7,053)
Public high schools in Texas City: TEXAS CITY H S Students: 1,621, Location: 1431 NINTH AVE N, Grades: 9-12)WOODROW WILSON DAEP Students: 35, Location: 300 14TH AVE N, Grades: 6-12)GALVESTON CO J J A E P Location: 6105 ATTWATER AVE, Grades: 11-12)
COASTAL ALTERNATIVE PROGRAM (CAP) Location: 300 14TH AVE N, Grades: 8-10)
Private high school in Texas City: TRINITY BAPTIST CHRISTIAN SCHOOL Students: 18, Location: 2220 29TH ST N, Grades: 1-12)
Public elementary/middle schools in Texas City: FRY INT Students: 910, Location: 300 TWENTY FIFTH AVE N, Grades: 5-6)BLOCKER MIDDLE Students: 867, Location: 500 14TH AVE N, Grades: 7-8)HEIGHTS EL Students: 750, Location: 300 N LOGAN ST, Grades: PK-4)ROOSEVELT-WILSON EL Students: 632, Location: 301 16TH AVE N, Grades: KG-4)NORTHSIDE EL Students: 631, Location: 2300 21ST ST N, Grades: PK-4)KOHFELDT EL Students: 525, Location: 1705 13TH AVE N, Grades: KG-4)Private elementary/middle school in Texas City: OUR LADY OF FATIMA CATHOLIC SCHOOL Students: 128, Location: 1600 9TH AVE N, Grades: PK-6)
See full list of schools located in Texas City Library in Texas City: MOORE MEMORIAL PUBLIC LIBRARY Operating income: $1,103,691; Location: 1701 9TH AVE N; 143,841 books ; 2 e-books ; 5,649 audio materials ; 4,793 video materials ; 3 local licensed databases ; 50 state licensed databases ; 2 other licensed databases ; 145 print serial subscriptions )
User-submitted facts and corrections:
Texas City blew up in 1947.
the new web address for College of the Mainland is http://www.com.edu
I would like to know how our church can be included in the posting of churches. The Crossing Foursquare Church, offices at 1718 N. Amburn, Suite B, Texas City, TX 77591, 409-933-4820, on the web at thecrossing4square.com.
Our Lady of Fatima Catholic School in Texas City, TX has 206 students and can be visited at their website www.fatimatc.org
Notable locations in Texas City: (A) , Davison Home (B) , Moses Lake Marina (C) , Campbell Bayou Wastewater Treatment Facility (D) , Carl Nessler Civic Center (E) , Texas City Industrial Complex (F) , Hulen Park (G) , Humble Camp (H) , San Leon Station (I) , Texas City Fire Department Station 3 (J) , Texas City Fire Department Station 1 (K) , Texas City Fire Department Station 2 (L) , Frank B Davison House (M) , Texas City Fire Department Administration (N) , Texas City Police Department (O) , Main Land Museum of Texas City (P) , Colonel Hugh B and Helen Moore House (Q) . Display/hide their locations on the map
Shopping Center: (1) . Display/hide its location on the map
Churches in Texas City include: (A) , Greater Macedonia Baptist Church (B) , First Mexican Baptist Church (C) , College View Baptist Church (D) , Glad Tidings Assembly of God Church (E) , El Salvador Assembly of God Church (F) , Apostolic Assembly Church (G) , Saint Marys Church (H) , Church of Christ Westward Street (I) . Display/hide their locations on the map
Cemeteries: (1) , Texas City Memorial Cemetery (2) , Phillips Memorial Cemetery (3) . Display/hide their locations on the map
Lakes and reservoirs: (A) , Moses Lake (B) , Salt Lake (C) , Swan Lake (D) , Galveston County Industrial Water Reservoir (E) , Galveston County Water Reservoir (F) . Display/hide their locations on the map
Streams, rivers, and creeks: (A) , Windmill Bayou (B) , Dickinson Bayou (C) . Display/hide their locations on the map
Parks in Texas City include: (1) , Kohfeldt Park (2) , Trahan Park (3) , Walker Park (4) , Noble Park (5) , Carver Park (6) , Heights Park (7) , Eastside Park (8) , Nuckols Park (9) . Display/hide their locations on the map
Hotels: (1) , Best Budgeting (928 8th Avenue North) (2) , City Motel (702 4th Avenue North) (3) , Cabana Motel (2601 Texas Avenue) (4) . Display/hide their approximate locations on the map
Courts: (1) , Galveston-County - Precinct No 3-Stephen Holmes- Stephen Holmes Precinct 3- Commissioners C (2516 Texas Avenue) (2) , Texas City-City - Municipal Court (1004 9th Avenue North) (3) , Galveston-County - Courts- Justice Of The Peace Courts- Jp Court No 5- Consta (2516 Texas Avenue) (4) . Display/hide their approximate locations on the map
Birthplace of: Ben Emanuel - 2005 NFL player (Carolina Panthers, born : Jun 18, 1982), Charles Brown (musician) - Blues singer, Claude Terrell - 2005 NFL player (St. Louis Rams, born : Apr 20, 1982), George Ducas (singer) - Country singer, Joe Caldwell - Basketball player, John Carona - Dallas, Mike McFarland - Voice actor, Robin Armstrong - Physician, Ron Raines - Male singer, Andy Hassler - Baseball player.
Galveston County has a predicted average indoor radon screening level less than 2 pCi/L (pico curies per liter) - Low Potential Drinking water stations with addresses in Texas City that have no violations reported:
TEXAS CITY TERMINAL RAILWAY CO (Population served: 450, Primary Water Source Type: Purch surface water)
Average household size: This city:
2.7 peopleTexas:
2.8 people
Percentage of family households: This city:
68.7%Whole state:
69.9%
Percentage of households with unmarried partners: This city:
7.4%Whole state:
6.0%
Likely homosexual households (counted as self-reported same-sex unmarried-partner households)
Lesbian couples: 0.4% of all households Gay men: 0.2% of all households
People in group quarters in Texas City in 2010:
470 people in nursing facilities/skilled-nursing facilities
417 people in state prisons
29 people in correctional facilities intended for juveniles
16 people in maritime/merchant vessels
4 people in emergency and transitional shelters (with sleeping facilities) for people experiencing homelessness
People in group quarters in Texas City in 2000:
473 people in nursing homes
363 people in state prisons
35 people in short-term care, detention or diagnostic centers for delinquent children
34 people in homes or halfway houses for drug/alcohol abuse
11 people in homes for the mentally ill
4 people in other noninstitutional group quarters
2 people in religious group quarters
Banks with branches in Texas City (2011 data):
Bank of America, National Association: Texas City Branch at 3334 Palmer Highway, branch established on 1924/01/01. Info updated 2009/11/18: Bank assets: $1,451,969.3 mil, Deposits: $1,077,176.8 mil, headquarters in Charlotte, NC, positive income , 5782 total offices , Holding Company: Bank Of America Corporation
Texas First Bank: at 3232 Palmer Highway, branch established on 1982/04/23. Info updated 2011/05/16: Bank assets: $692.5 mil, Deposits: $616.8 mil, local headquarters , positive income , Commercial Lending Specialization, 20 total offices , Holding Company: Texas Independent Bancshares, Inc.
Mainland Bank: at 2831 Palmer Highway, branch established on 1945/09/14. Info updated 2010/04/22: Bank assets: $90.3 mil, Deposits: $75.4 mil, local headquarters , positive income , Commercial Lending Specialization, 2 total offices
Regions Bank: Palmer Branch at 25th And Palmer, branch established on 1993/08/01. Info updated 2011/02/24: Bank assets: $123,368.2 mil, Deposits: $98,301.3 mil, headquarters in Birmingham, AL, positive income , Commercial Lending Specialization, 1778 total offices , Holding Company: Regions Financial Corporation
Amegy Bank National Association: Texas City Branch at 2501 Palmer Highway, branch established on 1957/01/01. Info updated 2007/09/24: Bank assets: $12,197.6 mil, Deposits: $9,733.2 mil, headquarters in Houston, TX, positive income , Commercial Lending Specialization, 97 total offices , Holding Company: Zions Bancorporation
Compass Bank: Texas City Branch at 2131 Palmer Highway, branch established on 1938/04/14. Info updated 2011/02/24: Bank assets: $63,107.0 mil, Deposits: $46,232.4 mil, headquarters in Birmingham, AL, negative income in the last year , Commercial Lending Specialization, 720 total offices , Holding Company: Banco Bilbao Vizcaya Argentaria, S.A.
The Moody National Bank: Texas City Banking Center at 7940 Emmett Lowry Expressway, branch established on 1991/05/20. Info updated 2006/11/03: Bank assets: $856.2 mil, Deposits: $712.3 mil, headquarters in Galveston, TX, positive income , Commercial Lending Specialization, 21 total offices , Holding Company: Moody Bancshares, Inc.
For population 15 years and over in Texas City:
Never married: 30.4%Now married: 46.9%Separated: 2.4%Widowed: 6.1%Divorced: 14.2% For population 25 years and over in Texas City:
High school or higher: 85.3%Bachelor's degree or higher: 18.7%Graduate or professional degree: 5.5%Unemployed: 7.7%Mean travel time to work (commute): 22.8 minutes
Education Gini index (Inequality in education) Here:
11.4Texas average:
14.0
Religion statistics for Texas City, TX (based on Galveston County data)
Religion Adherents Congregations Evangelical Protestant 61,765 195 Catholic 57,907 8 Mainline Protestant 18,373 50 Other 13,728 26 Black Protestant 5,373 17 Orthodox 559 3 None 133,604 -
Source: Clifford Grammich, Kirk Hadaway, Richard Houseal, Dale E.Jones, Alexei Krindatch, Richie Stanley and Richard H.Taylor. 2012. 2010 U.S.Religion Census: Religious Congregations & Membership Study. Association of Statisticians of American Religious Bodies. Jones, Dale E., et al. 2002. Congregations and Membership in the United States 2000. Nashville, TN: Glenmary Research Center. Graphs represent county-level data
Food Environment Statistics: Number of grocery stores : 48This county :
1.70 / 10,000 pop.State :
1.47 / 10,000 pop.
Number of supercenters and club stores : 5This county :
0.18 / 10,000 pop.Texas :
0.14 / 10,000 pop.
Number of convenience stores (no gas) : 40Galveston County :
1.41 / 10,000 pop.Texas :
1.11 / 10,000 pop.
Number of convenience stores (with gas) : 126Here :
4.45 / 10,000 pop.State :
3.95 / 10,000 pop.
Number of full-service restaurants : 195Here :
6.89 / 10,000 pop.Texas :
6.13 / 10,000 pop.
Adult diabetes rate : This county :
10.1%State :
8.9%
Low-income preschool obesity rate : Health and Nutrition:
Average overall health of teeth and gums : Texas City:
45.7%Texas:
47.4%
Average BMI : Texas City:
29.1Texas:
28.5
People feeling badly about themselves : People not drinking alcohol at all : Texas City:
11.7%State:
10.3%
Average hours sleeping at night : Overweight people : This city:
34.8%Texas:
33.1%
General health condition : Texas City:
54.4%Texas:
56.2%
Average condition of hearing : Texas City:
80.1%Texas:
80.7%
More about Health and Nutrition of Texas City, TX Residents
Local government employment and payroll (March 2022)
Function
Full-time employees
Monthly full-time payroll
Average yearly full-time wage
Part-time employees
Monthly part-time payroll
Police Protection - Officers
86 $649,209 $90,587 0 $0 Firefighters
75 $554,922 $88,788 0 $0 Streets and Highways
54 $251,773 $55,950 0 $0 Parks and Recreation
48 $223,373 $55,843 49 $108,465 Police - Other
29 $134,976 $55,852 0 $0 Solid Waste Management
28 $127,970 $54,844 3 $4,964 Water Supply
23 $115,070 $60,037 3 $3,842 Sewerage
22 $109,519 $59,738 0 $0 Other and Unallocable
19 $99,313 $62,724 0 $0 Financial Administration
17 $86,714 $61,210 0 $0 Local Libraries
13 $44,501 $41,078 2 $2,367 Other Government Administration
11 $80,356 $87,661 9 $2,906 Judicial and Legal
11 $43,664 $47,633 0 $0 Natural Resources
6 $29,913 $59,826 0 $0 Housing and Community Development (Local)
4 $24,269 $72,807 0 $0 Health
3 $13,166 $52,664 0 $0 Fire - Other
3 $20,464 $81,856 0 $0
Totals for Government
452 $2,609,170 $69,270 66 $122,544
Texas City government finances - Expenditure in 2021 (per resident):
Construction - Water Utilities: $3,176,000 ($57.05)
Sewerage: $2,897,000 ($52.04)Local Fire Protection: $2,565,000 ($46.08)Regular Highways: $1,742,000 ($31.29)Housing and Community Development: $199,000 ($3.57)Parks and Recreation: $100,000 ($1.80)Police Protection: $89,000 ($1.60)Solid Waste Management: $34,000 ($0.61)Current Operations - Police Protection: $14,004,000 ($251.57)
Local Fire Protection: $9,095,000 ($163.38)Regular Highways: $8,414,000 ($151.15)Parks and Recreation: $8,398,000 ($150.86)Water Utilities: $7,631,000 ($137.08)Financial Administration: $6,614,000 ($118.81)Solid Waste Management: $5,601,000 ($100.62)Sewerage: $3,981,000 ($71.51)Judicial and Legal Services: $1,288,000 ($23.14)Libraries: $1,196,000 ($21.48)General - Other: $1,048,000 ($18.83)Protective Inspection and Regulation - Other: $594,000 ($10.67)Central Staff Services: $567,000 ($10.19)Health - Other: $486,000 ($8.73)Housing and Community Development: $368,000 ($6.61)General - Interest on Debt: $673,000 ($12.09)
Other Capital Outlay - Regular Highways: $686,000 ($12.32)
Police Protection: $500,000 ($8.98)Parks and Recreation: $426,000 ($7.65)Solid Waste Management: $410,000 ($7.37)Sewerage: $279,000 ($5.01)Local Fire Protection: $155,000 ($2.78)Water Utilities: $94,000 ($1.69)General - Other: $35,000 ($0.63)Total Salaries and Wages: $28,418,000 ($510.50)
Water Utilities - Interest on Debt: $367,000 ($6.59)
Texas City government finances - Revenue in 2021 (per resident):
Charges - Sewerage: $6,777,000 ($121.74)
Solid Waste Management: $4,323,000 ($77.66)Parks and Recreation: $1,141,000 ($20.50)Federal Intergovernmental - Other: $722,000 ($12.97)
Housing and Community Development: $357,000 ($6.41)Local Intergovernmental - Other: $68,000 ($1.22)
Public Welfare: $23,000 ($0.41)Miscellaneous - General Revenue - Other: $3,369,000 ($60.52)
Fines and Forfeits: $1,825,000 ($32.78)Sale of Property: $1,231,000 ($22.11)Interest Earnings: $885,000 ($15.90)Rents: $307,000 ($5.51)Donations From Private Sources: $46,000 ($0.83)Revenue - Water Utilities: $12,875,000 ($231.29)
State Intergovernmental - Highways: $111,000 ($1.99)
General Local Government Support: $69,000 ($1.24)Other: $16,000 ($0.29)Tax - Property: $28,404,000 ($510.25)
General Sales and Gross Receipts: $23,987,000 ($430.90)Public Utilities Sales: $6,716,000 ($120.65)Other: $638,000 ($11.46)Alcoholic Beverage License: $11,000 ($0.20)
Texas City government finances - Debt in 2021 (per resident):
Long Term Debt - Beginning Outstanding - Unspecified Public Purpose: $42,723,000 ($767.47)
Outstanding Unspecified Public Purpose: $36,872,000 ($662.37)Retired Unspecified Public Purpose: $9,778,000 ($175.65)Issue, Unspecified Public Purpose: $3,928,000 ($70.56)
Texas City government finances - Cash and Securities in 2021 (per resident):
Other Funds - Cash and Securities: $91,231,000 ($1638.87)
8.54% of this county's 2021 resident taxpayers lived in other counties in 2020 ($73,500 average adjusted gross income )
Here:
8.54%Texas average:
8.12%
0.02% of residents moved from foreign countries ($187 average AGI )Galveston County:
0.02%Texas average:
0.04%
Top counties from which taxpayers relocated into this county between 2020 and 2021:
7.72% of this county's 2020 resident taxpayers moved to other counties in 2021 ($74,429 average adjusted gross income )
Here:
7.72%Texas average:
7.40%
0.02% of residents moved to foreign countries ($137 average AGI )Galveston County:
0.02%Texas average:
0.03%
Top counties to which taxpayers relocated from this county between 2020 and 2021:
Businesses in Texas City, TX
Name Count Name Count
AMF Bowling 1 La Quinta 1 Advance Auto Parts 1 Lane Bryant 1 AutoZone 1 Lane Furniture 1 Baskin-Robbins 1 Little Caesars Pizza 1 Bath & Body Works 1 Lowe's 1 Best Western 1 Macy's 1 Blockbuster 1 McDonald's 1 Budget Car Rental 1 Motherhood Maternity 1 Burger King 1 Nike 6 CVS 1 Office Depot 1 Chevrolet 1 Olive Garden 1 Church's Chicken 1 Papa John's Pizza 1 Cinnabon 1 Payless 1 Cricket Wireless 6 Pizza Hut 1 Dennys 1 Popeyes 2 Discount Tire 2 RadioShack 1 Domino's Pizza 2 Ryan's Grill 1 Dressbarn 1 SONIC Drive-In 1 FedEx 5 Sam's Club 1 Finish Line 1 Sears 2 Firestone Complete Auto Care 1 Starbucks 1 GNC 1 Subway 4 Goodwill 1 T-Mobile 2 H&R Block 2 Taco Bell 1 Hilton 1 Toyota 1 Holiday Inn 2 UPS 1 Justice 1 Walgreens 1 KFC 1 Wendy's 1 Kroger 1
Strongest AM radio stations in Texas City:
KYST (920 AM; 5 kW; TEXAS CITY, TX; Owner: HISPANIC BROADCASTING, INC.)
KTRH (740 AM; 50 kW; HOUSTON, TX; Owner: AMFM TEXAS LICENSES LIMITED PARTNERSHIP)
KILE (1560 AM; 50 kW; BELLAIRE, TX; Owner: THE RAFTT CORPORATION)
KGBC (1540 AM; 2 kW; GALVESTON, TX; Owner: SIGA BROADCASTING CORP.)
KGOL (1180 AM; 50 kW; HUMBLE, TX; Owner: ENTRAVISION HOLDINGS, LLC)
KTEK (1110 AM; daytime; 2 kW; ALVIN, TX; Owner: SOUTH TEXAS BROADCASTING, INC.)
KLAT (1010 AM; 10 kW; HOUSTON, TX; Owner: TICHENOR LICENSE CORPORATION ("TLC"))
KXYZ (1320 AM; 5 kW; HOUSTON, TX; Owner: BLAYA INC.)
KWWJ (1360 AM; 5 kW; BAYTOWN, TX; Owner: SALT OF THE EARTH BROADCASTING, INC.)
KEYH (850 AM; 10 kW; HOUSTON, TX; Owner: LIBERMAN BROADCASTING OF HOUSTON LICENSE CORP.)
KHCB (1400 AM; 1 kW; GALVESTON, TX; Owner: HOUSTON CHRISTIAN BROADCASTERS, INC.)
KSEV (700 AM; 15 kW; TOMBALL, TX; Owner: LIBERMAN BROADCASTING OF HOUSTON LICENSE CORP.)
KPRC (950 AM; 5 kW; HOUSTON, TX; Owner: CCB TEXAS LICENSES, L.P.)
Strongest FM radio stations in Texas City:
KJIC (90.5 FM; SANTA FE, TX; Owner: COMMUNITY RADIO, INC.)
KOVE-FM (106.5 FM; GALVESTON, TX; Owner: HBC LICENSE CORPORATION)
KLDE (107.5 FM; LAKE JACKSON, TX; Owner: CXR HOLDINGS, INC.)
K247AF (97.3 FM; GALVESTON, TX; Owner: THE KSBJ EDUCATIONAL FOUNDATION)
KRBE (104.1 FM; HOUSTON, TX; Owner: KRBE LICO, INC.)
KBXX (97.9 FM; HOUSTON, TX; Owner: RADIO ONE LICENSES, LLC)
KHJZ-FM (95.7 FM; HOUSTON, TX; Owner: TEXAS INFINITY BROADCASTING L.P.)
KHMX (96.5 FM; HOUSTON, TX; Owner: CITICASTERS LICENSES, L.P.)
KILT-FM (100.3 FM; HOUSTON, TX; Owner: TEXAS INFINITY BROADCASTING L.P.)
KKBQ-FM (92.9 FM; PASADENA, TX; Owner: CXR HOLDINGS, INC.)
KLOL (101.1 FM; HOUSTON, TX; Owner: AMFM TEXAS LICENSES LIMITED PARTNERSHIP)
KODA (99.1 FM; HOUSTON, TX; Owner: AMFM TEXAS LICENSES LIMITED PARTNERSHIP)
KTBZ-FM (94.5 FM; HOUSTON, TX; Owner: AMFM TEXAS LICENSES LIMITED PARTNERSHIP)
KUHF (88.7 FM; HOUSTON, TX; Owner: UNIVERSITY OF HOUSTON SYSTEM)
KLTO (105.3 FM; CRYSTAL BEACH, TX; Owner: TICHENOR LICENSE CORPORATION ("TLC"))
KKRW (93.7 FM; HOUSTON, TX; Owner: CAPSTAR TX LIMITED PARTNERSHIP)
K201DZ (88.1 FM; PORT BOLIVAR, TX; Owner: ALELUYA CHRISTIAN BROADCASTING, INC.)
KHCB-FM (105.7 FM; HOUSTON, TX; Owner: HOUSTON CHRISTIAN BROADCASTERS, INC.)
KMJQ (102.1 FM; HOUSTON, TX; Owner: RADIO ONE LICENSES, LLC)
KOBT (100.7 FM; WINNIE, TX; Owner: TICHENOR LICENSE CORPORATION ("TLC"))
TV broadcast stations around Texas City:
KJIB-LP (Channel 5; CLEAR LAKE CITY, TX; Owner: FAR EASTERN TELECASTERS)
KLTJ (Channel 22; GALVESTON, TX; Owner: WORD OF GOD FELLOWSHIP, INC.)
KTMD (Channel 48; GALVESTON, TX; Owner: TELEMUNDO OF TEXAS PARTNERSHIP, LP)
KAZH (Channel 57; BAYTOWN, TX; Owner: KAZH LICENSE, LLC)
KHOU-TV (Channel 11; HOUSTON, TX; Owner: KHOU-TV, L.P.)
KPRC-TV (Channel 2; HOUSTON, TX; Owner: POST-NEWSWEEK STATIONS, HOUSTON, LP)
KNWS-TV (Channel 51; KATY, TX; Owner: JOHNSON BROADCASTING, INC.)
KRIV (Channel 26; HOUSTON, TX; Owner: FOX TELEVISION STATIONS, INC.)
KHWB (Channel 39; HOUSTON, TX; Owner: KHWB, INC.)
KXLN-TV (Channel 45; ROSENBERG, TX; Owner: KXLN LICENSE PARTNERSHIP, L.P.)
KTRK-TV (Channel 13; HOUSTON, TX; Owner: KTRK TELEVISION, INC.)
KTBU (Channel 55; CONROE, TX; Owner: HUMANITY INTERESTED MEDIA, INC.)
KTXH (Channel 20; HOUSTON, TX; Owner: FOX TELEVISION STATIONS, INC.)
KPXB (Channel 49; CONROE, TX; Owner: PAXSON HOUSTON LICENSE, INC.)
KFTH (Channel 67; ALVIN, TX; Owner: TELEFUTURA HOUSTON LLC)
KZJL (Channel 61; HOUSTON, TX; Owner: KZJL LICENSE CORP.)
KETH (Channel 14; HOUSTON, TX; Owner: COMMUNITY EDUCATIONAL TV, INC.)
KUHT (Channel 8; HOUSTON, TX; Owner: UNIVERSITY OF HOUSTON SYSTEM)
KVDO-LP (Channel 69; CLEAR LAKE, TX; Owner: FAR EASTERN TELECASTERS)
KBPX-LP (Channel 33; HOUSTON, TX; Owner: PAXSON COMMUNICATIONS LPTV, INC.)
KHMV-LP (Channel 28; HOUSTON, TX; Owner: PAPPAS TELECASTING OF THE GULF COAST, A CALIFORNIA LP)
KVIT-LP (Channel 28; VICTORIA, TX; Owner: CLUB COMMUNICATIONS)
KVQT-LP (Channel 24; HOUSTON, TX; Owner: C. DOWEN JOHNSON)
KVVV-LP (Channel 53; HOUSTON, TX; Owner: KAZH LICENSE, LLC)
K30CV (Channel 30; HOUSTON, TX; Owner: BROADCASTING SYSTEMS, INC.)
National Bridge Inventory (NBI) Statistics 92 Number of bridges2,054ft / 626m Total length $885,000 Total costs1,246,617 Total average daily traffic54,678 Total average daily truck traffic
New bridges - historical statistics
4 1940-1949 3 1950-1959 3 1960-1969 27 1970-1979 27 1980-1989 5 1990-1999 14 2000-2009 9 2010-2019
See full National Bridge Inventory statistics for Texas City, TX
Home Mortgage Disclosure Act Aggregated Statistics For Year 2009(Based on 10 full and 3 partial tracts) A) FHA, FSA/RHS & VA B) Conventional C) Refinancings D) Home Improvement Loans E) Loans on Dwellings For 5+ Families F) Non-occupant Loans on G) Loans On Manufactured Number Average Value Number Average Value Number Average Value Number Average Value Number Average Value Number Average Value Number Average Value
LOANS ORIGINATED 240 $114,449 163 $109,438 245 $120,778 41 $39,057 4 $3,482,755 114 $127,436 4 $38,682 APPLICATIONS APPROVED, NOT ACCEPTED 13 $121,952 11 $134,199 29 $128,522 4 $15,840 0 $0 11 $160,107 1 $43,610 APPLICATIONS DENIED 30 $107,313 54 $79,591 172 $113,982 64 $26,552 0 $0 36 $100,111 7 $43,293 APPLICATIONS WITHDRAWN 19 $105,878 23 $104,273 93 $112,445 12 $51,078 1 $2,400,000 17 $123,829 0 $0 FILES CLOSED FOR INCOMPLETENESS 10 $99,909 6 $99,657 25 $129,888 4 $24,768 0 $0 5 $148,428 0 $0
Aggregated Statistics For Year 2008(Based on 10 full and 3 partial tracts) A) FHA, FSA/RHS & VA B) Conventional C) Refinancings D) Home Improvement Loans E) Loans on Dwellings For 5+ Families F) Non-occupant Loans on G) Loans On Manufactured Number Average Value Number Average Value Number Average Value Number Average Value Number Average Value Number Average Value Number Average Value
LOANS ORIGINATED 207 $113,019 309 $113,198 270 $111,792 86 $40,786 5 $2,280,522 227 $111,692 1 $94,240 APPLICATIONS APPROVED, NOT ACCEPTED 9 $97,211 44 $128,205 45 $108,714 18 $36,689 0 $0 26 $113,604 6 $100,205 APPLICATIONS DENIED 40 $110,567 107 $95,376 329 $110,715 156 $37,061 1 $100,000 73 $99,574 12 $64,242 APPLICATIONS WITHDRAWN 23 $107,748 41 $131,366 108 $115,373 19 $49,043 0 $0 27 $137,907 1 $79,590 FILES CLOSED FOR INCOMPLETENESS 10 $94,906 14 $116,141 28 $117,514 4 $48,350 0 $0 7 $80,089 0 $0
Aggregated Statistics For Year 2007(Based on 10 full and 3 partial tracts) A) FHA, FSA/RHS & VA B) Conventional C) Refinancings D) Home Improvement Loans E) Loans on Dwellings For 5+ Families F) Non-occupant Loans on G) Loans On Manufactured Number Average Value Number Average Value Number Average Value Number Average Value Number Average Value Number Average Value Number Average Value
LOANS ORIGINATED 117 $113,360 825 $104,748 376 $111,664 114 $41,220 12 $2,908,597 373 $110,221 9 $64,144 APPLICATIONS APPROVED, NOT ACCEPTED 4 $90,278 99 $117,733 78 $138,171 19 $33,401 0 $0 49 $144,749 7 $65,097 APPLICATIONS DENIED 29 $122,217 259 $101,044 582 $102,779 147 $37,896 0 $0 135 $98,771 6 $67,600 APPLICATIONS WITHDRAWN 20 $120,448 101 $104,482 248 $108,367 21 $64,536 1 $1,650,000 50 $96,441 0 $0 FILES CLOSED FOR INCOMPLETENESS 2 $97,455 36 $111,598 74 $115,359 6 $29,760 0 $0 12 $130,647 0 $0
Aggregated Statistics For Year 2006(Based on 10 full and 3 partial tracts) A) FHA, FSA/RHS & VA B) Conventional C) Refinancings D) Home Improvement Loans E) Loans on Dwellings For 5+ Families F) Non-occupant Loans on G) Loans On Manufactured Number Average Value Number Average Value Number Average Value Number Average Value Number Average Value Number Average Value Number Average Value
LOANS ORIGINATED 126 $119,411 1,213 $88,429 500 $97,739 119 $37,657 2 $1,138,400 485 $97,904 7 $42,317 APPLICATIONS APPROVED, NOT ACCEPTED 4 $143,745 214 $78,651 92 $94,537 33 $48,273 0 $0 65 $81,973 12 $60,198 APPLICATIONS DENIED 21 $120,112 419 $81,489 565 $90,089 205 $32,612 2 $992,500 195 $65,239 17 $51,678 APPLICATIONS WITHDRAWN 7 $109,844 169 $88,535 373 $91,341 32 $50,443 0 $0 43 $77,774 1 $33,110 FILES CLOSED FOR INCOMPLETENESS 4 $89,250 52 $99,623 77 $99,333 2 $78,495 0 $0 15 $87,425 0 $0
Aggregated Statistics For Year 2005(Based on 10 full and 3 partial tracts) A) FHA, FSA/RHS & VA B) Conventional C) Refinancings D) Home Improvement Loans E) Loans on Dwellings For 5+ Families F) Non-occupant Loans on G) Loans On Manufactured Number Average Value Number Average Value Number Average Value Number Average Value Number Average Value Number Average Value Number Average Value
LOANS ORIGINATED 191 $120,465 1,130 $105,964 583 $87,154 118 $58,401 7 $619,916 422 $99,011 4 $44,155 APPLICATIONS APPROVED, NOT ACCEPTED 12 $109,640 178 $77,539 105 $76,267 31 $45,212 0 $0 50 $89,999 10 $46,536 APPLICATIONS DENIED 61 $121,655 368 $76,282 646 $77,605 163 $31,084 1 $225,000 160 $67,821 20 $44,217 APPLICATIONS WITHDRAWN 20 $121,807 209 $87,529 375 $119,288 103 $192,629 0 $0 60 $82,343 0 $0 FILES CLOSED FOR INCOMPLETENESS 0 $0 48 $69,552 128 $96,113 5 $48,190 0 $0 21 $73,300 0 $0
Aggregated Statistics For Year 2004(Based on 10 full and 3 partial tracts) A) FHA, FSA/RHS & VA B) Conventional C) Refinancings D) Home Improvement Loans E) Loans on Dwellings For 5+ Families F) Non-occupant Loans on G) Loans On Manufactured Number Average Value Number Average Value Number Average Value Number Average Value Number Average Value Number Average Value Number Average Value
LOANS ORIGINATED 258 $107,189 909 $81,311 805 $79,073 134 $37,333 5 $2,209,062 398 $79,678 6 $62,420 APPLICATIONS APPROVED, NOT ACCEPTED 25 $105,285 173 $78,949 140 $75,374 27 $33,884 0 $0 42 $68,909 15 $46,728 APPLICATIONS DENIED 26 $96,543 237 $77,775 794 $72,419 159 $33,893 1 $215,000 123 $77,812 17 $42,562 APPLICATIONS WITHDRAWN 24 $91,941 119 $90,085 405 $77,353 17 $52,858 1 $155,480 45 $84,090 2 $59,640 FILES CLOSED FOR INCOMPLETENESS 0 $0 40 $85,103 159 $83,680 2 $19,000 0 $0 10 $73,147 0 $0
Aggregated Statistics For Year 2003(Based on 10 full and 3 partial tracts) A) FHA, FSA/RHS & VA B) Conventional C) Refinancings D) Home Improvement Loans E) Loans on Dwellings For 5+ Families F) Non-occupant Loans on Number Average Value Number Average Value Number Average Value Number Average Value Number Average Value Number Average Value
LOANS ORIGINATED 131 $82,323 593 $80,862 1,066 $83,957 87 $29,689 5 $452,904 333 $82,172 APPLICATIONS APPROVED, NOT ACCEPTED 7 $88,966 88 $75,900 145 $75,596 18 $24,993 1 $50,000 38 $81,255 APPLICATIONS DENIED 22 $80,923 148 $65,022 800 $73,218 101 $24,949 1 $23,000 72 $71,960 APPLICATIONS WITHDRAWN 14 $73,283 103 $77,000 356 $74,790 16 $45,036 0 $0 29 $69,490 FILES CLOSED FOR INCOMPLETENESS 1 $64,940 28 $95,062 62 $76,363 11 $31,163 0 $0 8 $66,265
Aggregated Statistics For Year 1999(Based on 10 full and 4 partial tracts) A) FHA, FSA/RHS & VA B) Conventional C) Refinancings D) Home Improvement Loans E) Loans on Dwellings For 5+ Families F) Non-occupant Loans on Number Average Value Number Average Value Number Average Value Number Average Value Number Average Value Number Average Value
LOANS ORIGINATED 175 $65,975 342 $63,514 245 $61,492 156 $15,837 6 $973,272 67 $35,967 APPLICATIONS APPROVED, NOT ACCEPTED 8 $60,445 74 $55,727 50 $59,156 35 $20,122 0 $0 9 $59,673 APPLICATIONS DENIED 11 $57,413 176 $53,799 130 $43,365 134 $12,797 1 $98,410 27 $42,370 APPLICATIONS WITHDRAWN 7 $78,513 50 $69,187 126 $53,378 7 $10,220 1 $10,000 10 $63,629 FILES CLOSED FOR INCOMPLETENESS 5 $79,020 20 $73,324 69 $53,491 2 $20,395 1 $1,008,290 5 $40,982
Detailed mortgage data for all 13 tracts in Texas City, TX
Private Mortgage Insurance Companies Aggregated Statistics For Year 2009(Based on 8 full and 3 partial tracts) A) Conventional B) Refinancings C) Non-occupant Loans on Number Average Value Number Average Value Number Average Value
LOANS ORIGINATED 14 $114,656 9 $153,569 2 $114,850 APPLICATIONS APPROVED, NOT ACCEPTED 7 $150,303 6 $123,802 1 $123,000 APPLICATIONS DENIED 2 $154,030 2 $127,380 1 $188,020 APPLICATIONS WITHDRAWN 0 $0 2 $177,830 0 $0 FILES CLOSED FOR INCOMPLETENESS 3 $72,553 0 $0 3 $58,623
Aggregated Statistics For Year 2008(Based on 9 full and 3 partial tracts) A) Conventional B) Refinancings C) Non-occupant Loans on Number Average Value Number Average Value Number Average Value
LOANS ORIGINATED 128 $119,001 22 $164,822 60 $118,316 APPLICATIONS APPROVED, NOT ACCEPTED 56 $111,718 12 $145,721 19 $86,057 APPLICATIONS DENIED 9 $141,966 1 $106,140 7 $153,204 APPLICATIONS WITHDRAWN 11 $131,765 1 $198,420 5 $141,462 FILES CLOSED FOR INCOMPLETENESS 7 $123,273 0 $0 3 $141,470
Aggregated Statistics For Year 2007(Based on 9 full and 3 partial tracts) A) Conventional B) Refinancings C) Non-occupant Loans on Number Average Value Number Average Value Number Average Value
LOANS ORIGINATED 305 $114,342 17 $128,866 81 $113,128 APPLICATIONS APPROVED, NOT ACCEPTED 35 $118,183 7 $179,681 7 $122,203 APPLICATIONS DENIED 9 $152,406 10 $94,000 6 $103,038 APPLICATIONS WITHDRAWN 14 $107,078 1 $120,140 2 $116,750 FILES CLOSED FOR INCOMPLETENESS 1 $85,490 1 $94,000 1 $52,000
Aggregated Statistics For Year 2006(Based on 10 full and 3 partial tracts) A) Conventional B) Refinancings C) Non-occupant Loans on Number Average Value Number Average Value Number Average Value
LOANS ORIGINATED 170 $103,986 17 $120,451 58 $100,480 APPLICATIONS APPROVED, NOT ACCEPTED 20 $104,001 4 $124,670 7 $139,004 APPLICATIONS DENIED 5 $60,116 1 $178,780 3 $47,873 APPLICATIONS WITHDRAWN 12 $97,466 0 $0 2 $124,950 FILES CLOSED FOR INCOMPLETENESS 0 $0 0 $0 0 $0
Aggregated Statistics For Year 2005(Based on 10 full and 3 partial tracts) A) Conventional B) Refinancings C) Non-occupant Loans on Number Average Value Number Average Value Number Average Value
LOANS ORIGINATED 163 $97,796 24 $106,710 68 $99,089 APPLICATIONS APPROVED, NOT ACCEPTED 29 $115,392 5 $136,344 9 $118,489 APPLICATIONS DENIED 2 $132,895 0 $0 2 $132,895 APPLICATIONS WITHDRAWN 7 $109,501 2 $156,920 0 $0 FILES CLOSED FOR INCOMPLETENESS 3 $142,457 0 $0 0 $0
Aggregated Statistics For Year 2004(Based on 10 full and 3 partial tracts) A) Conventional B) Refinancings C) Non-occupant Loans on Number Average Value Number Average Value Number Average Value
LOANS ORIGINATED 200 $92,166 30 $94,251 63 $68,541 APPLICATIONS APPROVED, NOT ACCEPTED 42 $99,999 12 $96,988 14 $84,554 APPLICATIONS DENIED 2 $106,530 0 $0 0 $0 APPLICATIONS WITHDRAWN 19 $120,416 5 $148,196 9 $104,897 FILES CLOSED FOR INCOMPLETENESS 2 $138,000 1 $94,000 0 $0
Aggregated Statistics For Year 2003(Based on 10 full and 3 partial tracts) A) Conventional B) Refinancings C) Non-occupant Loans on Number Average Value Number Average Value Number Average Value
LOANS ORIGINATED 167 $91,387 58 $103,246 53 $89,045 APPLICATIONS APPROVED, NOT ACCEPTED 38 $86,517 23 $96,185 15 $78,444 APPLICATIONS DENIED 5 $89,742 0 $0 2 $67,260 APPLICATIONS WITHDRAWN 10 $96,868 5 $91,538 3 $98,983 FILES CLOSED FOR INCOMPLETENESS 0 $0 1 $190,000 0 $0
Aggregated Statistics For Year 1999(Based on 10 full and 4 partial tracts) A) Conventional B) Refinancings C) Non-occupant Loans on Number Average Value Number Average Value Number Average Value
LOANS ORIGINATED 89 $77,139 15 $111,121 8 $54,012 APPLICATIONS APPROVED, NOT ACCEPTED 7 $71,656 4 $148,898 0 $0 APPLICATIONS DENIED 5 $88,732 2 $68,705 2 $49,830 APPLICATIONS WITHDRAWN 5 $99,058 0 $0 0 $0 FILES CLOSED FOR INCOMPLETENESS 0 $0 1 $63,300 0 $0
Fire-safe hotels and motels in Texas City, Texas:
Motel 6, 1121 Hwy 146 N, Texas City, Texas 77590 Phone: (409) 948-3101, Fax: (409) 945-4412
Texas City Fairfield Inn By Marriott, 10700 Emmett F Lowry, Texas City, Texas 77591 Phone: (409) 986-3866, Fax: (409) 986-3866
Texas City Hampton Inn, 2320 FM 2004, Texas City, Texas 77591 Phone: (409) 986-6686, Fax: (409) 986-1267
Holiday Inn Express Texas City, 2440 Gulf Fwy, Texas City, Texas 77591 Phone: (409) 986-6700, Fax: (409) 896-7700
Comfort Inn & Suites, 320 Hwy 146 N, Texas City, Texas 77590 Phone: (409) 945-5300, Fax: (409) 945-5301
Best Western Mainland Inn & Suites, 10620 FM 1764, Texas City, Texas 77590 Phone: (409) 986-6600, Fax: (409) 986-6648
Candlewood Suites Texas City, 1700 Hwy 146 N, Texas City, Texas 77590 Phone: (409) 945-6500, Fax: (409) 945-6501
Value Place Hotel Texas City, 11444 32nd Ave N, Texas City, Texas 77591 Phone: (409) 978-2300, Fax: (409) 978-2335
2 other hotels and motels
All 10 fire-safe hotels and motels in Texas City, Texas
Most common first names in Texas City, TX among deceased individuals Name Count Lived (average)
James 238 69.9 years John 227 72.0 years Mary 213 76.8 years William 189 72.3 years Robert 175 70.2 years Charles 123 72.7 years George 114 73.0 years Willie 101 76.0 years Dorothy 89 74.8 years Joseph 84 73.5 years
Most common last names in Texas City, TX among deceased individuals Last name Count Lived (average)
Johnson 146 73.8 years Williams 127 72.0 years Smith 107 74.7 years Jones 95 74.6 years Brown 87 73.3 years Davis 73 70.8 years Jackson 66 71.4 years Anderson 59 74.1 years Taylor 49 71.8 years Martin 43 74.1 years
Texas City compared to Texas state average:
Unemployed percentage below state average. Black race population percentage above state average. Median age above state average. Foreign-born population percentage below state average. Length of stay since moving in significantly above state average. Texas City on our top lists :
#19 on the list of "Top 101 cities with the smallest percentage of elementary and middle school students in private schools (5,000+ students)"
#79 on the list of "Top 101 cities with the largest city-data.com crime index decrease from 2002 to 2012 (population 5,000+)"
#14 on the list of "Top 101 counties with the largest decrease in the number of infant deaths per 1000 residents 2000-2006 to 2007-2013 (pop. 50,000+)"
#30 on the list of "Top 101 counties with the lowest number of infant deaths per 1000 residents 2007-2013 (pop. 50,000+)"
#35 on the list of "Top 101 counties with the lowest Nitrogen Dioxide air pollution readings in 2012 (ppm)"
#48 on the list of "Top 101 counties with the lowest surface withdrawal of fresh water for public supply"
#72 on the list of "Top 101 counties with the largest decrease in the number of deaths per 1000 residents 2000-2006 to 2007-2013 (pop. 50,000+)"
Top Patent Applicants
Amarnath Natarajan (4)
Melvin O. Castillo (3)
Michele L. Marquette (2)
William E. Mcgrady, Ii (2)
James Lee Williams (2)
Richard B. Voigt (2)
Jeffery Smith (2)
James M. Buschow (1)
Roy W. Livingston (1)
Clemon P. Prevost (1)
Total of 30 patent applications in 2008-2024.
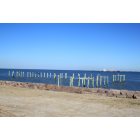

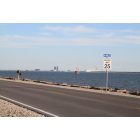
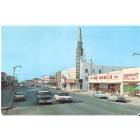

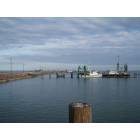
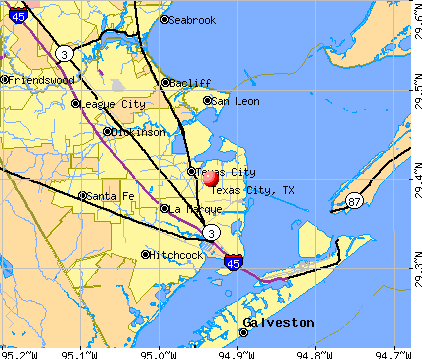


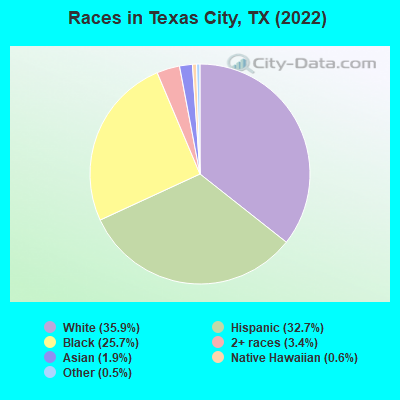
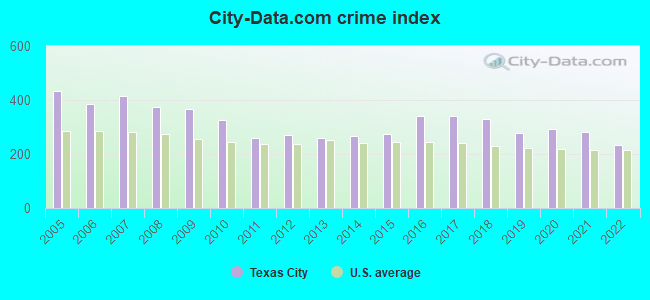
 Recent articles from our blog. Our writers, many of them Ph.D. graduates or candidates, create easy-to-read articles on a wide variety of topics.

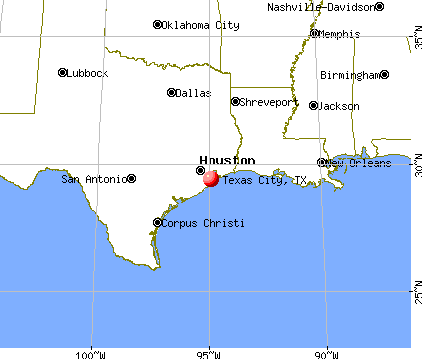
 (10.5 miles
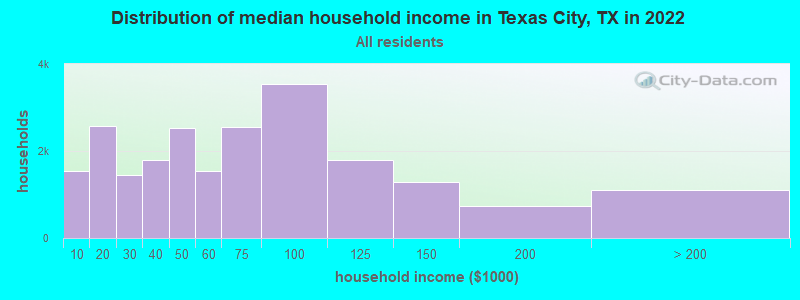
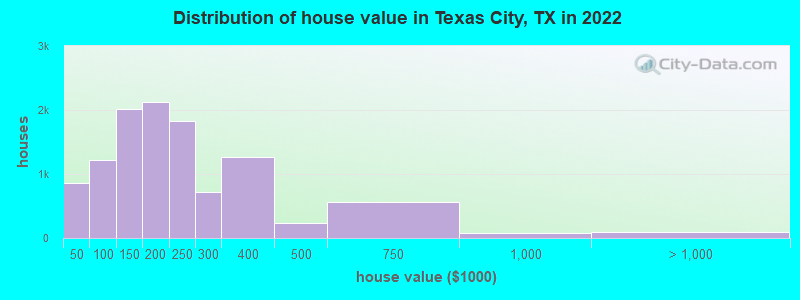

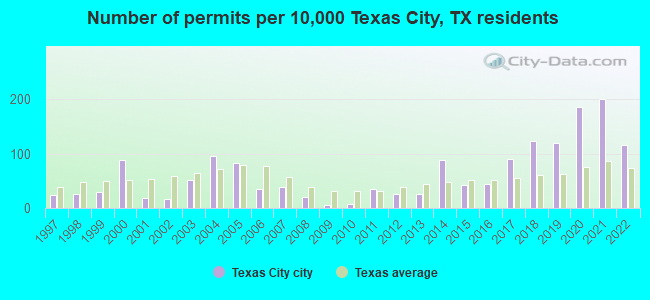
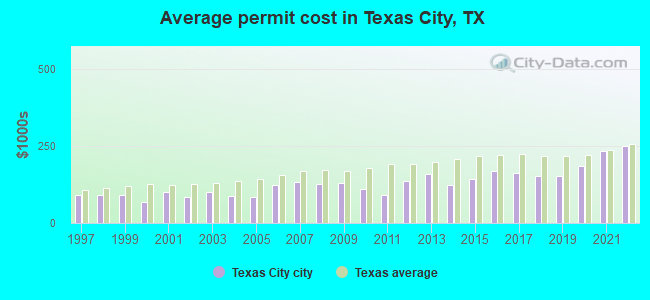

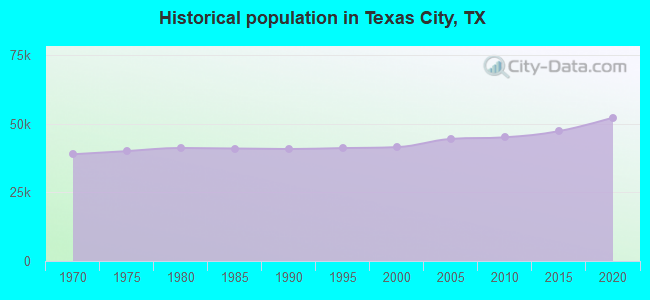
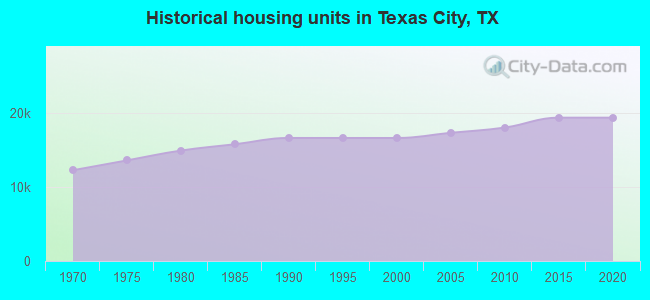
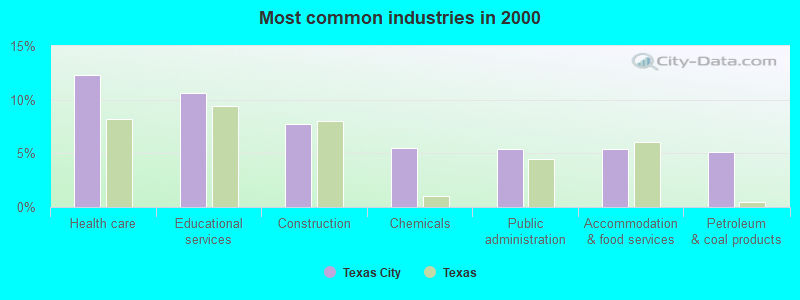
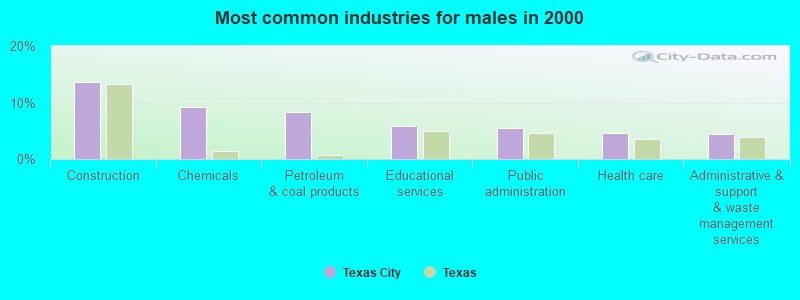
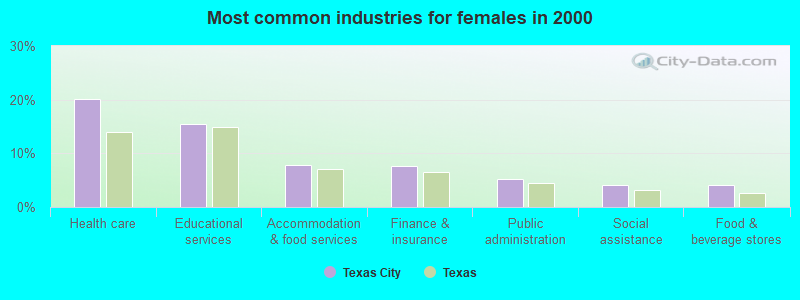

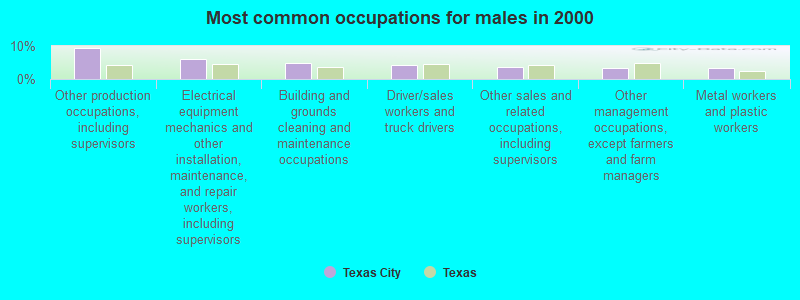
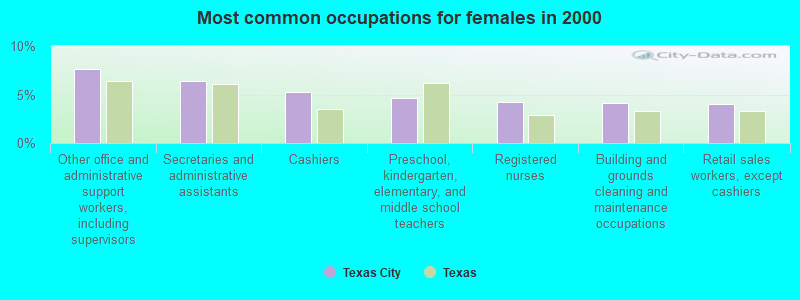


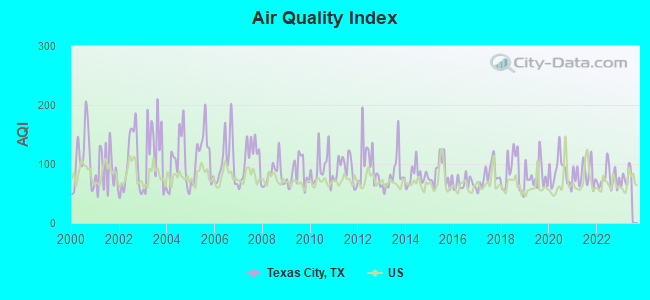
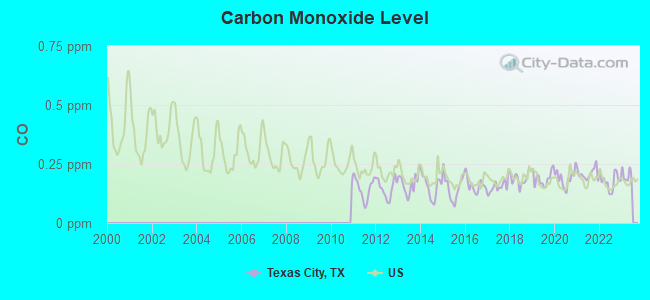
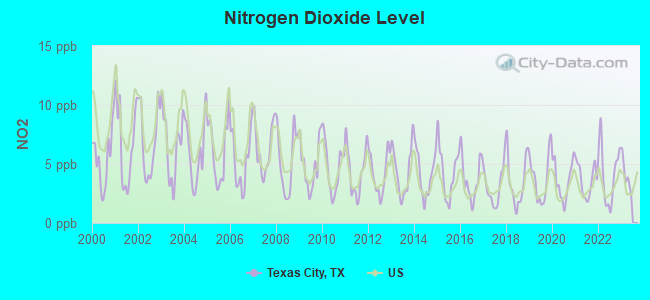
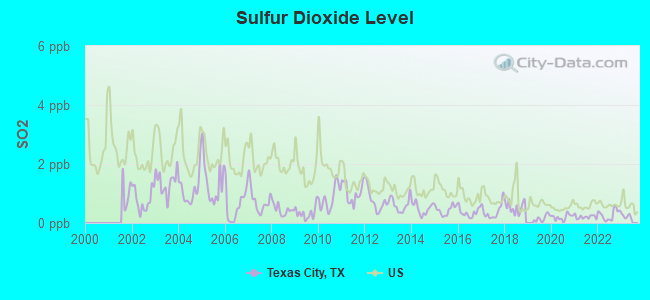
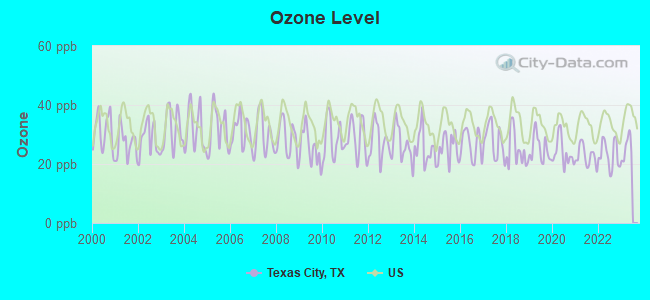
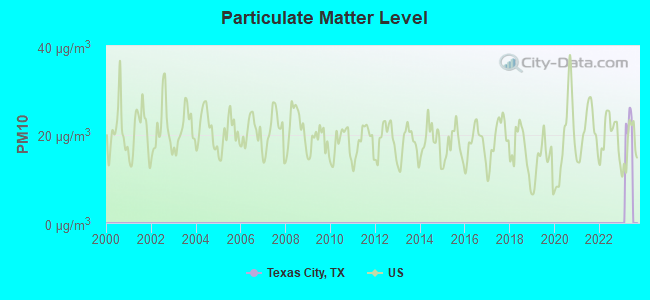
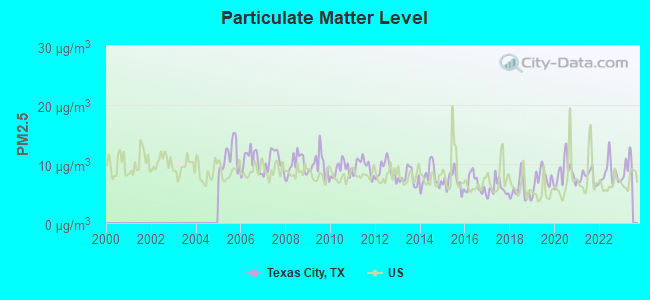

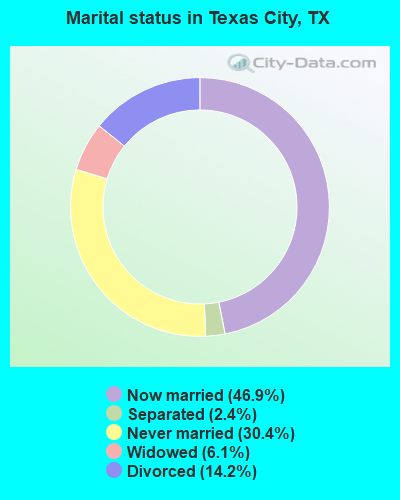
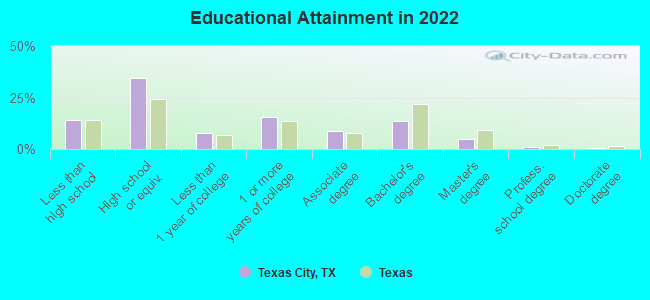
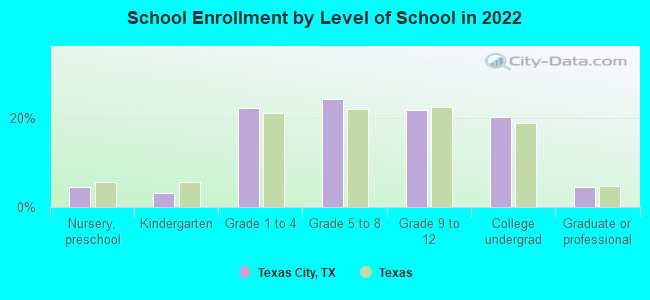
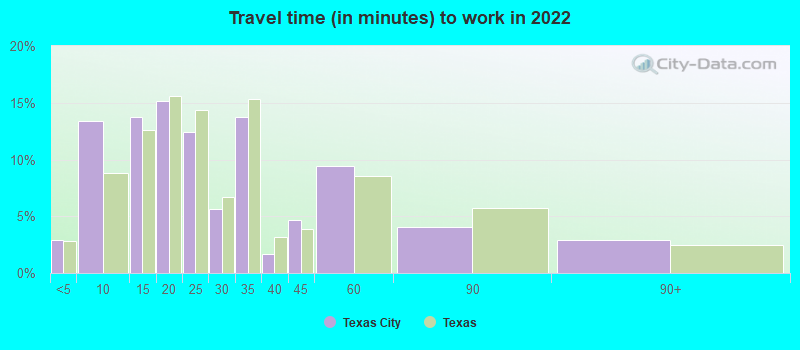
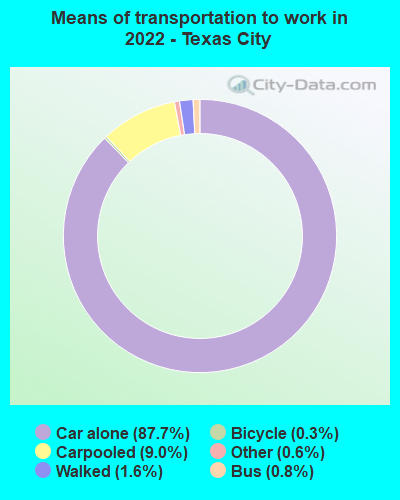
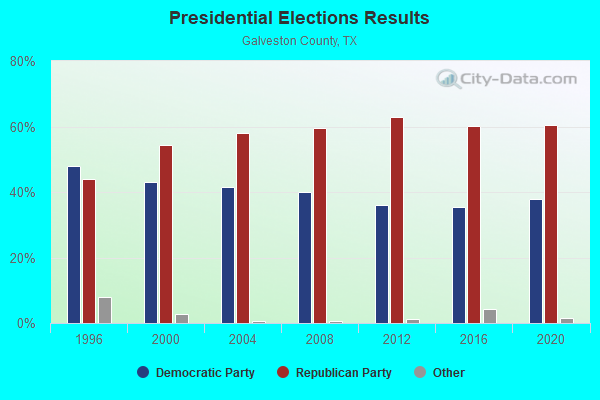
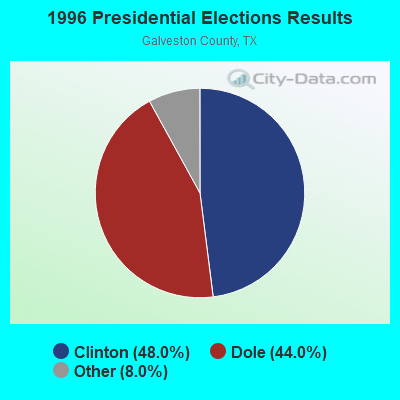
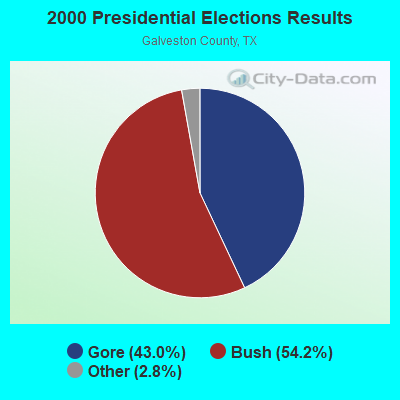
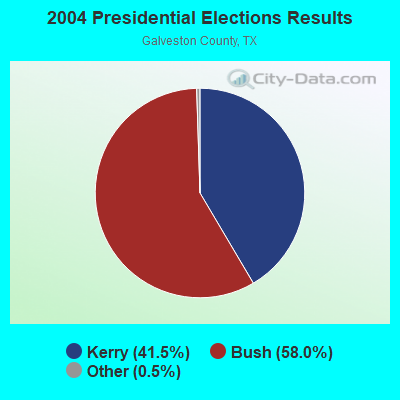
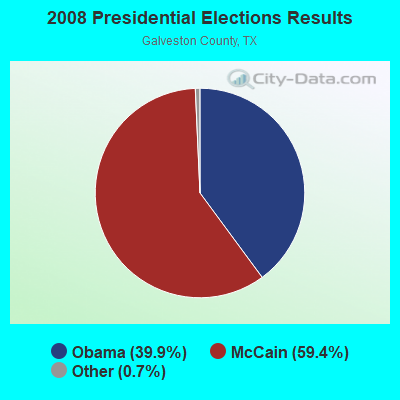
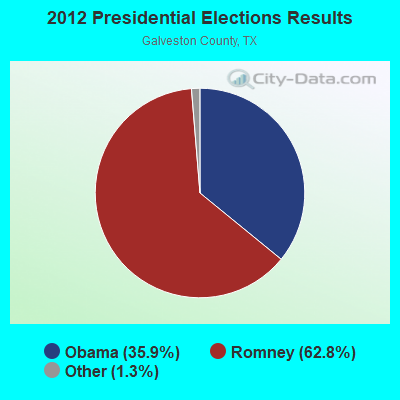
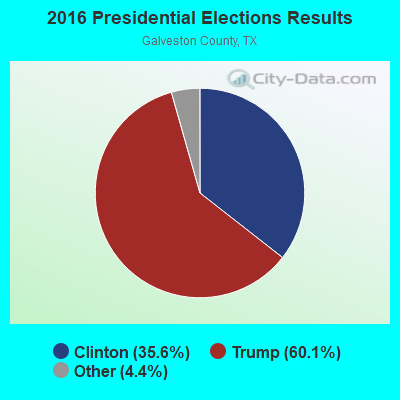
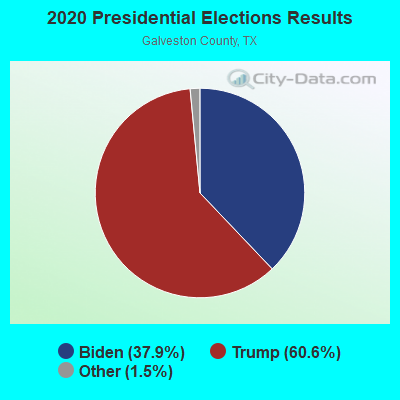
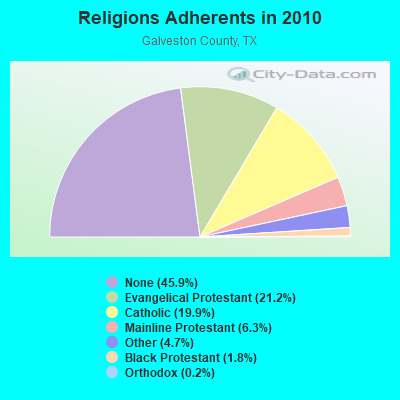
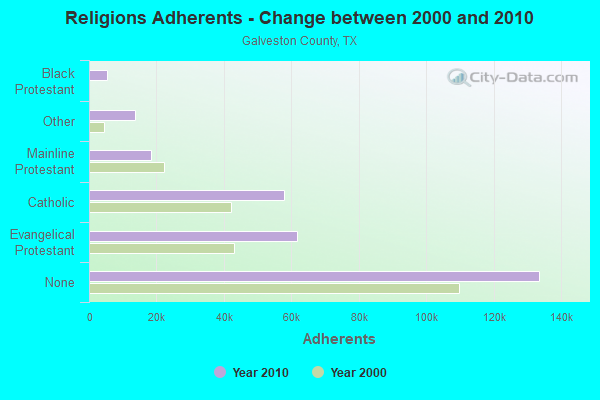
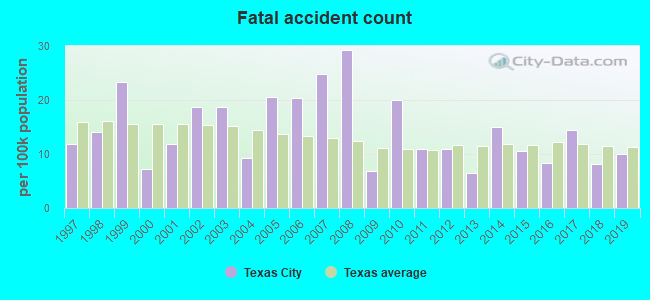
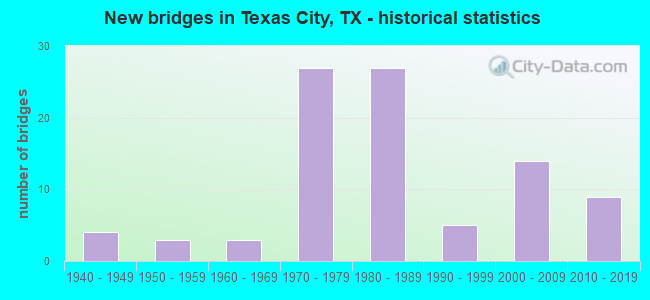
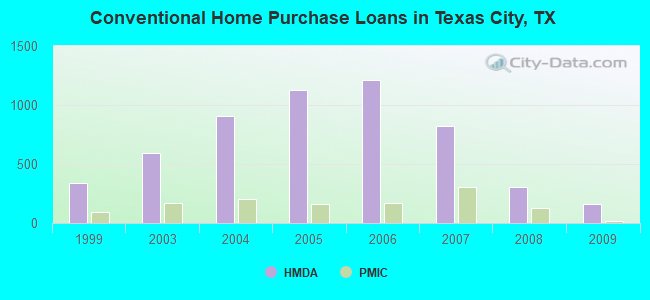
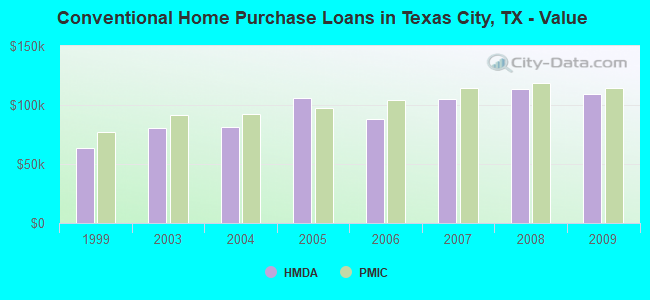
 According to the data from the years 2004 - 2018 the average number of fires per year is 175. The highest number of fires - 227 took place in 2011, and the least - 117 in 2004. The data has a growing trend.
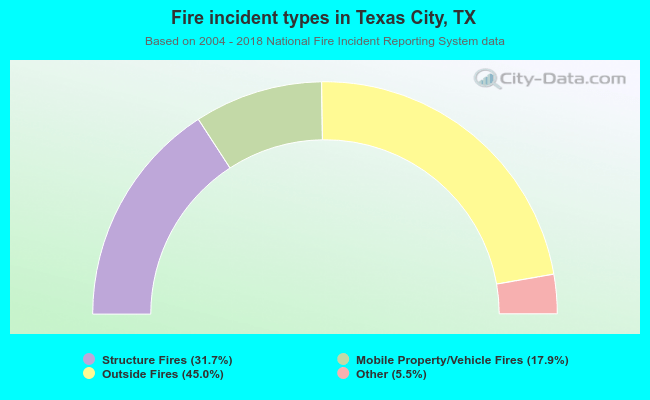 When looking into fire subcategories, the most reports belonged to: Outside Fires (45.0%), and Structure Fires (31.7%).