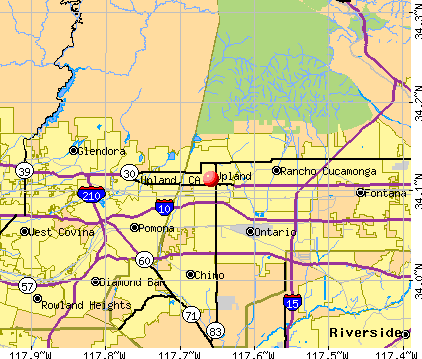
Upland, California
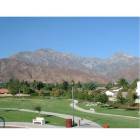
Upland: Baldy View
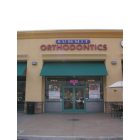
Upland: Summit Orthodontics at Colonies Crossroads in Upland, CA
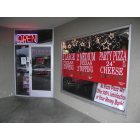
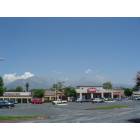
Upland: Rizza Pizza Foothill Blvd., Upland, CA
Upland: Big 5 Mouintain Avenue and Arrow Hwy, Upland, CA
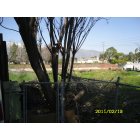
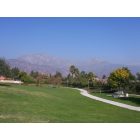
Upland: MTNS ABOVE UPLAND CA FROM MY BACKYARD
Upland: McCarthy Park
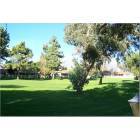
Upland: Upland Hills
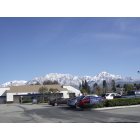
Upland: Mount Baldi
- add
your
Submit your own pictures of this city and show them to the world
- OSM Map
- General Map
- Google Map
- MSN Map
Population change since 2000: +15.3%
 |
| Males: 37,969 | |
| Females: 40,872 |
| Median resident age: | 37.1 years |
| California median age: | 37.9 years |
Zip codes: 91786.
| Upland: | $97,838 |
| CA: | $91,551 |
Estimated per capita income in 2022: $42,084 (it was $23,343 in 2000)
Upland city income, earnings, and wages data
Estimated median house or condo value in 2022: $701,100 (it was $203,100 in 2000)
| Upland: | $701,100 |
| CA: | $715,900 |
Mean prices in 2022: all housing units: $766,313; detached houses: $829,872; townhouses or other attached units: $613,515; in 3-to-4-unit structures: $327,018; in 5-or-more-unit structures: $418,019; mobile homes: $108,292
Median gross rent in 2022: $1,829.
(7.6% for White Non-Hispanic residents, 19.2% for Black residents, 13.4% for Hispanic or Latino residents, 12.9% for American Indian residents, 17.3% for Native Hawaiian and other Pacific Islander residents, 15.3% for other race residents, 9.5% for two or more races residents)
Detailed information about poverty and poor residents in Upland, CA


Compare current foreclosures in Upland, CA:
| Photo | Address | Area | Beds / Baths | Price | Details |
|---|---|---|---|---|---|

|
#1
Upland Hills Dr N
Upland, CA 91784
|
1,805 sq. feet
|
2 baths 2 beds |
show details | |

|
#2
Richards Pl
Upland, CA 91784
|
2,863 sq. feet
|
4 baths 4 beds |
show details | |

|
#3
N Kelly Ave
Upland, CA 91784
|
2,594 sq. feet
|
3 baths 4 beds |
show details | |

|
#4
W 14th St
Upland, CA 91786
|
2,751 sq. feet
|
3 baths 4 beds |
show details | |

|
#5
Sunrise Cir N
Upland, CA 91784
|
1,690 sq. feet
|
2 baths 3 beds |
show details | |

|
#6
Jonquil Dr
Upland, CA 91784
|
4,133 sq. feet
|
4 baths 4 beds |
show details | |

|
#7
W Clark St
Upland, CA 91784
|
3,555 sq. feet
|
3 baths 4 beds |
show details | |

|
#8
N 2nd Ave
Upland, CA 91786
|
2,134 sq. feet
|
3 baths 4 beds |
show details | |

|
#9
Omalley Ave
Upland, CA 91784
|
1,886 sq. feet
|
2 baths 4 beds |
show details | |

|
#10
Dickenson Ct
Upland, CA 91786
|
1,738 sq. feet
|
2 baths 5 beds |
show details |
| Photo | Address | Area | Beds / Baths | Price | Details |
|---|---|---|---|---|---|

|
#11
Omalley Ave
Upland, CA 91786
|
1,880 sq. feet
|
3 baths 4 beds |
show details | |

|
#12
W 20th St
Upland, CA 91784
|
3,316 sq. feet
|
4 baths 4 beds |
show details | |

|
#13
Olive Ave
Upland, CA 91786
|
1,525 sq. feet
|
3 baths 3 beds |
show details | |

|
#14
N 3rd Ave
Upland, CA 91786
|
2,307 sq. feet
|
3 baths 4 beds |
show details | |

|
#15
Cliff Rd
Upland, CA 91784
|
2,245 sq. feet
|
2 baths 5 beds |
show details | |

|
#16
E 24th St
Upland, CA 91784
|
2,708 sq. feet
|
3 baths 4 beds |
show details | |

|
#17
N 1st Ave
Upland, CA 91784
|
3,280 sq. feet
|
4 baths 4 beds |
show details | |

|
#18
Patassi Way
Upland, CA 91784
|
3,241 sq. feet
|
4 baths 3 beds |
show details | |

|
#19
W Arrow Hwy
Upland, CA 91786
|
1,473 sq. feet
|
2 baths 4 beds |
show details | |

|
#20
W 11th St
Upland, CA 91786
|
2,680 sq. feet
|
2 baths 6 beds |
show details |
| Photo | Address | Area | Beds / Baths | Price | Details |
|---|---|---|---|---|---|

|
#21
Hazel Ct
Upland, CA 91784
|
2,294 sq. feet
|
3 baths 4 beds |
show details | |

|
#22
N Kelly Ave
Upland, CA 91784
|
2,223 sq. feet
|
2 baths 4 beds |
show details | |

|
#23
W 8th St
Upland, CA 91786
|
1,304 sq. feet
|
1 baths 2 beds |
show details | |

|
#24
N Euclid Ave
Upland, CA 91786
|
2,968 sq. feet
|
2 baths 5 beds |
show details | |

|
#25
E 14th St
Upland, CA 91786
|
2,059 sq. feet
|
2 baths 4 beds |
show details | |

|
#26
Azure Ct
Upland, CA 91786
|
1,474 sq. feet
|
2 baths 4 beds |
show details | |

|
#27
Granada St
Upland, CA 91784
|
1,732 sq. feet
|
2 baths 3 beds |
show details | |

|
#28
Leggio Ln
Upland, CA 91784
|
3,241 sq. feet
|
3 baths 3 beds |
show details | |

|
#29
N Palm Ave
Upland, CA 91786
|
2,602 sq. feet
|
1 baths - beds |
show details | |

|
#30
Amsterdam Ct
Upland, CA 91786
|
1,504 sq. feet
|
2 baths 3 beds |
show details |
| Photo | Address | Area | Beds / Baths | Price | Details |
|---|---|---|---|---|---|

|
#31
N 1st Ave
Upland, CA 91786
|
1,496 sq. feet
|
2 baths 3 beds |
show details | |

|
#32
Salina St
Upland, CA 91786
|
726 sq. feet
|
1 baths 2 beds |
show details | |

|
#33
N 3rd Ave
Upland, CA 91786
|
1,354 sq. feet
|
2 baths 3 beds |
show details | |

|
#34
San Bernardino Rd Spc 122
Upland, CA 91786
|
1,320 sq. feet
|
2 baths 3 beds |
show details | |

|
#35
Blossom Cir
Upland, CA 91786
|
2,004 sq. feet
|
2 baths 4 beds |
show details | |

|
#36
W 11th St
Upland, CA 91786
|
1,346 sq. feet
|
2 baths 4 beds |
show details | |

|
#37
Loma Sola Ct
Upland, CA 91786
|
1,412 sq. feet
|
2 baths 3 beds |
show details | |

|
#38
Burt St
Upland, CA 91784
|
2,276 sq. feet
|
2 baths 3 beds |
show details | |

|
#39
Paris Cir
Upland, CA 91784
|
2,262 sq. feet
|
2 baths 3 beds |
show details | |

|
#40
Colfax Way
Upland, CA 91784
|
2,256 sq. feet
|
3 baths 4 beds |
show details |
| Photo | Address | Area | Beds / Baths | Price | Details |
|---|---|---|---|---|---|

|
#41
Winston Ct
Upland, CA 91786
|
2,048 sq. feet
|
3 baths 7 beds |
show details | |

|
#42
Springfield Way
Upland, CA 91786
|
1,504 sq. feet
|
2 baths 3 beds |
show details | |

|
#43
W 25th St
Upland, CA 91784
|
2,162 sq. feet
|
2 baths 3 beds |
show details | |

|
#44
N Ukiah Way
Upland, CA 91786
|
1,352 sq. feet
|
2 baths 4 beds |
show details | |

|
#45
Grayson Way
Upland, CA 91786
|
1,992 sq. feet
|
3 baths 4 beds |
show details | |

|
#46
Piedmont Dr
Upland, CA 91784
|
3,041 sq. feet
|
3 baths 4 beds |
show details | |

|
#47
N Rocky Rd
Upland, CA 91784
|
- sq. feet
|
- baths - beds |
show details | |

|
#48
E 9th St Apt 1
Upland, CA 91786
|
- sq. feet
|
- baths - beds |
show details | |

|
#49
E Foothill Blvd Spc 94
Upland, CA 91786
|
- sq. feet
|
- baths - beds |
show details | |

|
Check over 1 million property listings on Foreclosure.com!
|
browse all offers | |||


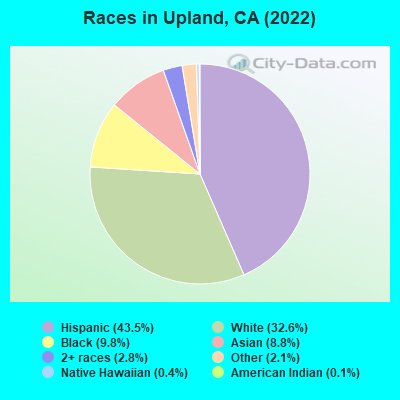
- 34,26443.5%Hispanic
- 25,71532.6%White alone
- 7,7049.8%Black alone
- 6,9078.8%Asian alone
- 2,2222.8%Two or more races
- 1,6342.1%Other race alone
- 3100.4%Native Hawaiian and Other
Pacific Islander alone - 950.1%American Indian alone
According to our research of California and other state lists, there were 79 registered sex offenders living in Upland, California as of June 16, 2024.
The ratio of all residents to sex offenders in Upland is 971 to 1.
The ratio of registered sex offenders to all residents in this city is lower than the state average.
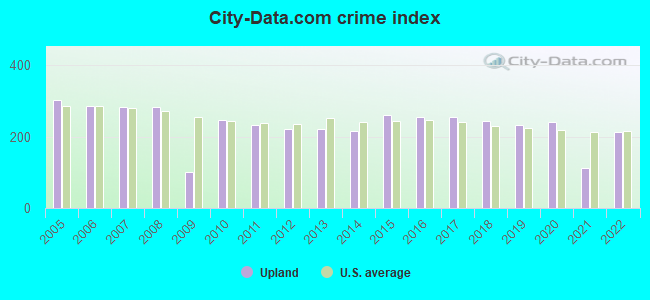
The City-Data.com crime index weighs serious crimes and violent crimes more heavily. Higher means more crime, U.S. average is 246.1. It adjusts for the number of visitors and daily workers commuting into cities.
- means the value is smaller than the state average.- means the value is about the same as the state average.
- means the value is bigger than the state average.
- means the value is much bigger than the state average.
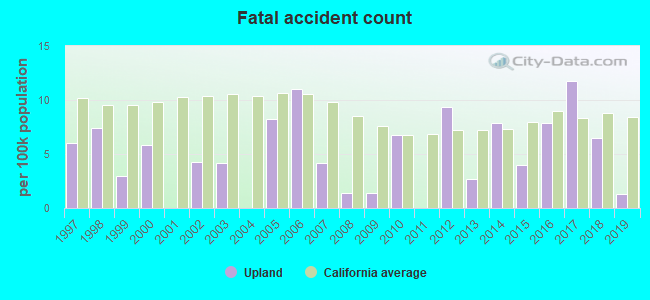
Crime rate in Upland detailed stats: murders, rapes, robberies, assaults, burglaries, thefts, arson
Full-time law enforcement employees in 2021, including police officers: 94 (65 officers - 58 male; 7 female).
| Officers per 1,000 residents here: | 0.83 |
| California average: | 2.30 |
 Recent articles from our blog. Our writers, many of them Ph.D. graduates or candidates, create easy-to-read articles on a wide variety of topics.

 | Anyone moved to Texas and moved back to LA? (220 replies) |
| Sage at Ninth (UPLAND) (1 reply) |
| Upland New Community Townhomes (2 replies) |
| Upland Vintage Photos of Homes (0 replies) |
| Commute from Rancho Cucamonga to Glendale (46 replies) |
| Tell me all about Rancho Cucamonga,Upland, Claremont (33 replies) |
Latest news from Upland, CA collected exclusively by city-data.com from local newspapers, TV, and radio stations
Ancestries: American (3.4%), German (2.7%), English (2.3%), Irish (2.2%), European (1.8%), Italian (1.8%).
Current Local Time: PST time zone
Elevation: 1300 feet
Land area: 15.1 square miles.
Population density: 5,215 people per square mile (average).
14,735 residents are foreign born (9.5% Latin America, 7.2% Asia).
| This city: | 18.6% |
| California: | 26.5% |
Median real estate property taxes paid for housing units with mortgages in 2022: $4,597 (0.7%)
Median real estate property taxes paid for housing units with no mortgage in 2022: $3,142 (0.4%)
Nearest city with pop. 200,000+: East San Gabriel Valley, CA  (12.2 miles , pop. 933,557).
Nearest city with pop. 1,000,000+: Los Angeles, CA (41.1 miles , pop. 3,694,820).
Nearest cities:
Latitude: 34.11 N, Longitude: 117.66 W
Daytime population change due to commuting: -1,178 (-1.5%)
Workers who live and work in this city: 10,698 (29.3%)
Area code: 909
Property values in Upland, CA

Upland tourist attractions:
Upland, California accommodation & food services, waste management - Economy and Business Data
Single-family new house construction building permits:
- 2022: 56 buildings, average cost: $249,000
- 2021: 50 buildings, average cost: $243,600
- 2020: 45 buildings, average cost: $230,400
- 2019: 134 buildings, average cost: $206,600
- 2018: 160 buildings, average cost: $269,800
- 2017: 77 buildings, average cost: $263,200
- 2016: 66 buildings, average cost: $262,500
- 2015: 67 buildings, average cost: $265,500
- 2014: 54 buildings, average cost: $262,800
- 2013: 58 buildings, average cost: $246,500
- 2012: 33 buildings, average cost: $264,500
- 2011: 49 buildings, average cost: $233,400
- 2010: 13 buildings, average cost: $226,400
- 2009: 4 buildings, average cost: $205,000
- 2008: 8 buildings, average cost: $163,700
- 2007: 86 buildings, average cost: $218,800
- 2006: 59 buildings, average cost: $170,200
- 2005: 136 buildings, average cost: $169,400
- 2004: 106 buildings, average cost: $171,500
- 2003: 233 buildings, average cost: $164,500
- 2002: 99 buildings, average cost: $158,800
- 2001: 40 buildings, average cost: $155,600
- 2000: 94 buildings, average cost: $143,600
- 1999: 257 buildings, average cost: $169,700
- 1998: 77 buildings, average cost: $130,800
- 1997: 67 buildings, average cost: $228,500
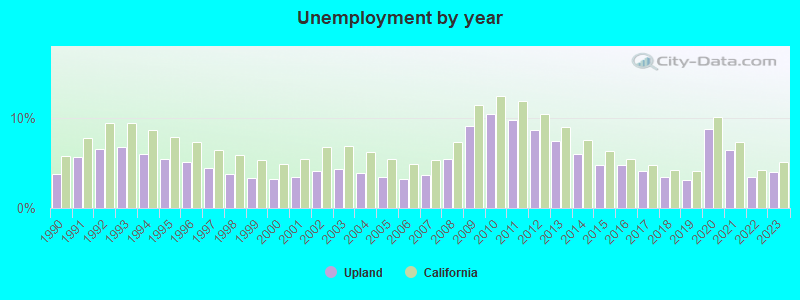
| Here: | 4.0% |
| California: | 5.1% |
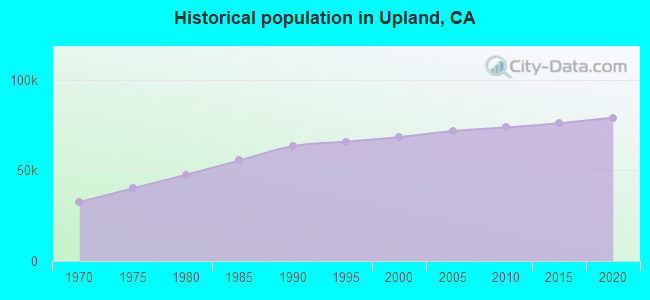
Population change in the 1990s: +4,177 (+6.5%).
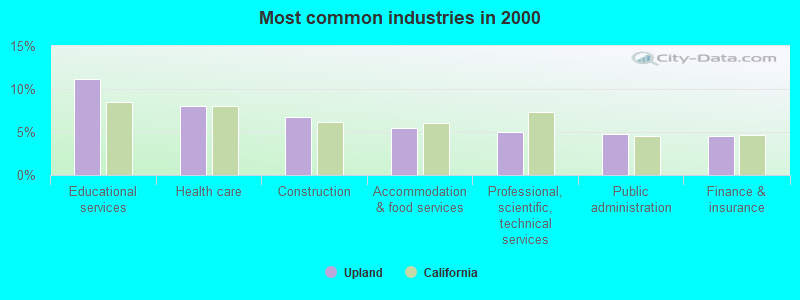
- Educational services (11.2%)
- Health care (8.0%)
- Construction (6.7%)
- Accommodation & food services (5.5%)
- Professional, scientific, technical services (5.0%)
- Public administration (4.8%)
- Finance & insurance (4.5%)
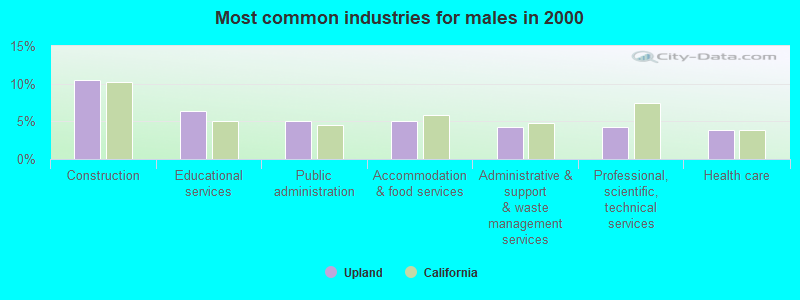
- Construction (10.5%)
- Educational services (6.3%)
- Public administration (5.1%)
- Accommodation & food services (5.0%)
- Administrative & support & waste management services (4.3%)
- Professional, scientific, technical services (4.3%)
- Health care (3.8%)
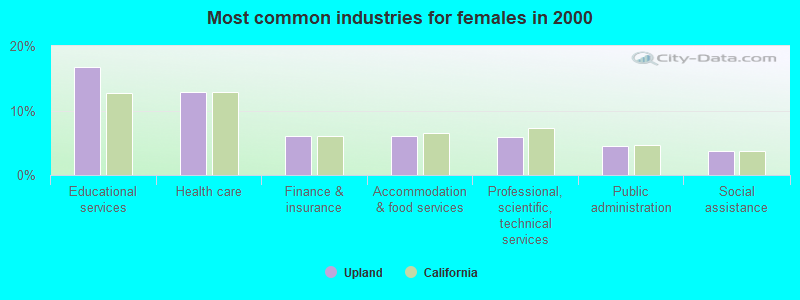
- Educational services (16.7%)
- Health care (12.8%)
- Finance & insurance (6.1%)
- Accommodation & food services (6.0%)
- Professional, scientific, technical services (5.9%)
- Public administration (4.5%)
- Social assistance (3.8%)
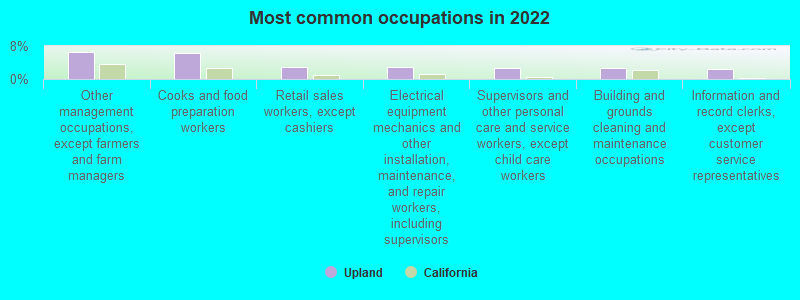
- Other management occupations, except farmers and farm managers (6.6%)
- Cooks and food preparation workers (6.4%)
- Retail sales workers, except cashiers (2.9%)
- Electrical equipment mechanics and other installation, maintenance, and repair workers, including supervisors (2.9%)
- Supervisors and other personal care and service workers, except child care workers (2.8%)
- Building and grounds cleaning and maintenance occupations (2.6%)
- Information and record clerks, except customer service representatives (2.4%)
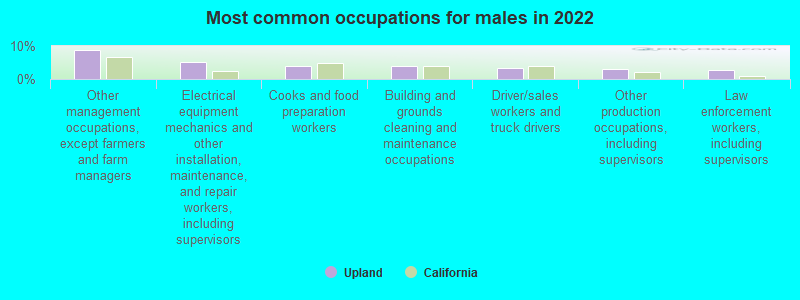
- Other management occupations, except farmers and farm managers (8.9%)
- Electrical equipment mechanics and other installation, maintenance, and repair workers, including supervisors (5.0%)
- Cooks and food preparation workers (4.0%)
- Building and grounds cleaning and maintenance occupations (3.9%)
- Driver/sales workers and truck drivers (3.5%)
- Other production occupations, including supervisors (2.9%)
- Law enforcement workers, including supervisors (2.8%)
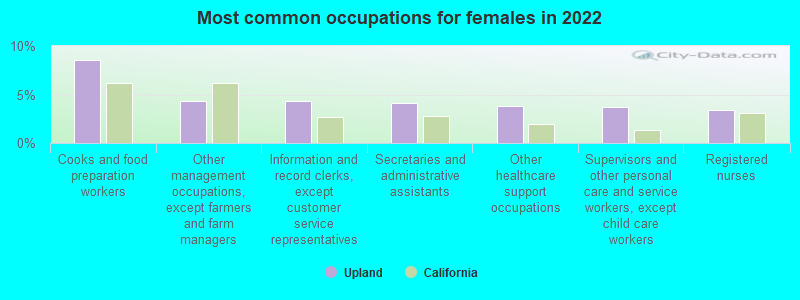
- Cooks and food preparation workers (8.6%)
- Other management occupations, except farmers and farm managers (4.4%)
- Information and record clerks, except customer service representatives (4.3%)
- Secretaries and administrative assistants (4.1%)
- Other healthcare support occupations (3.9%)
- Supervisors and other personal care and service workers, except child care workers (3.7%)
- Registered nurses (3.4%)
Average climate in Upland, California
Based on data reported by over 4,000 weather stations


|
|


(lower is better)
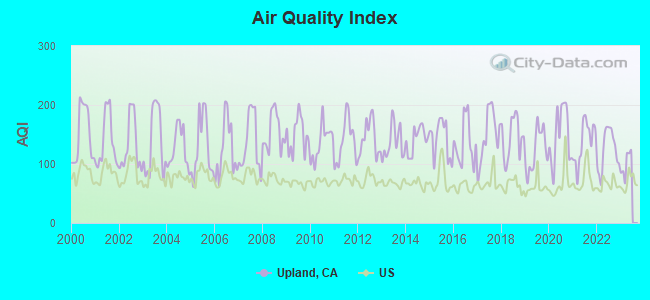
Air Quality Index (AQI) level in 2022 was 124. This is significantly worse than average.
| City: | 124 |
| U.S.: | 73 |
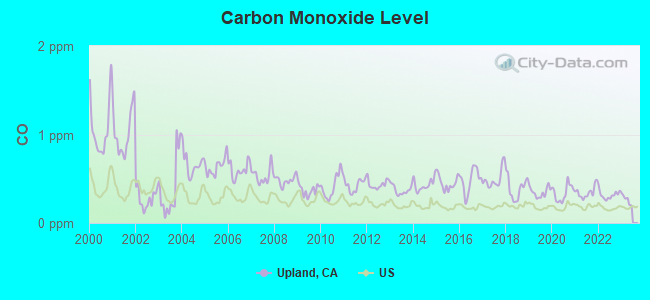
Carbon Monoxide (CO) [ppm] level in 2022 was 0.317. This is worse than average. Closest monitor was 1.1 miles away from the city center.
| City: | 0.317 |
| U.S.: | 0.251 |
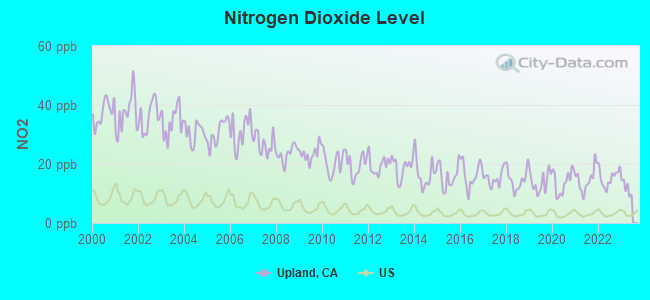
Nitrogen Dioxide (NO2) [ppb] level in 2022 was 15.3. This is significantly worse than average. Closest monitor was 1.1 miles away from the city center.
| City: | 15.3 |
| U.S.: | 5.1 |
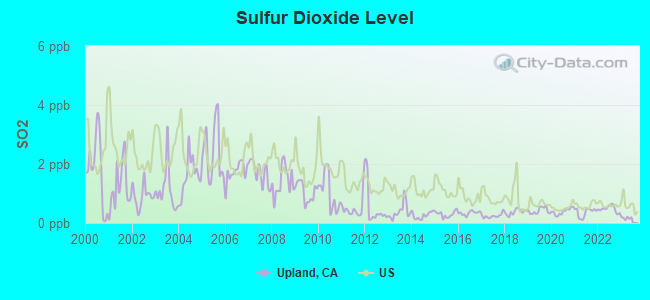
Sulfur Dioxide (SO2) [ppb] level in 2022 was 0.477. This is significantly better than average. Closest monitor was 1.8 miles away from the city center.
| City: | 0.477 |
| U.S.: | 1.515 |
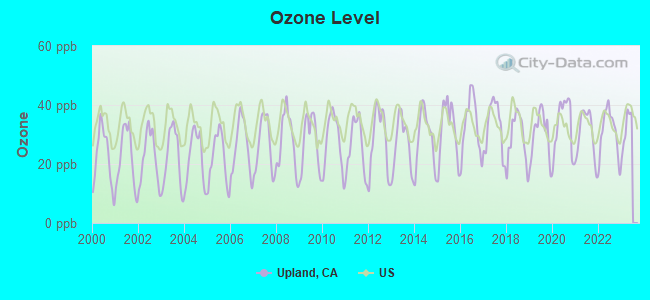
Ozone [ppb] level in 2022 was 30.7. This is about average. Closest monitor was 1.1 miles away from the city center.
| City: | 30.7 |
| U.S.: | 33.3 |
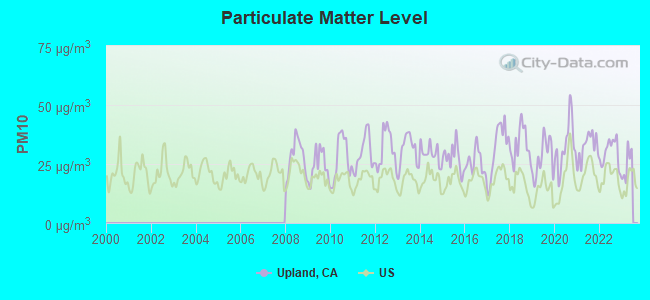
Particulate Matter (PM10) [µg/m3] level in 2022 was 29.8. This is significantly worse than average. Closest monitor was 1.8 miles away from the city center.
| City: | 29.8 |
| U.S.: | 19.2 |
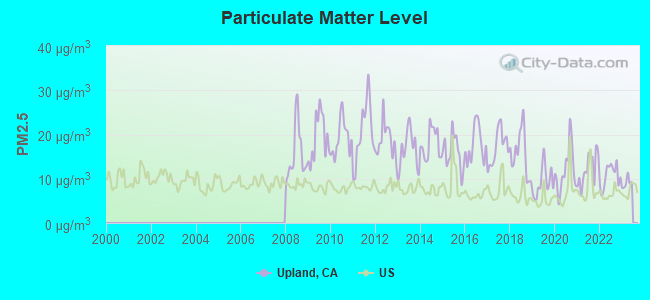
Particulate Matter (PM2.5) [µg/m3] level in 2022 was 10.7. This is worse than average. Closest monitor was 5.6 miles away from the city center.
| City: | 10.7 |
| U.S.: | 8.1 |
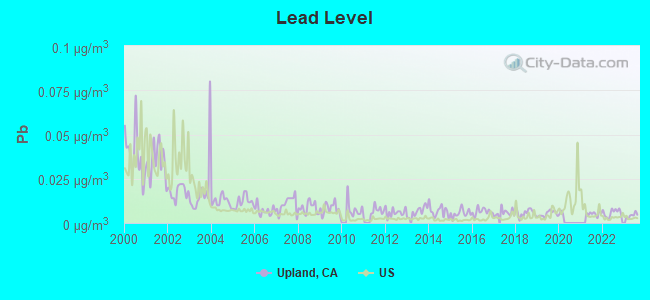
Lead (Pb) [µg/m3] level in 2023 was 0.00426. This is significantly better than average. Closest monitor was 1.8 miles away from the city center.
| City: | 0.00426 |
| U.S.: | 0.00931 |
Earthquake activity:
Upland-area historical earthquake activity is significantly above California state average. It is 7301% greater than the overall U.S. average.On 6/28/1992 at 11:57:34, a magnitude 7.6 (6.2 MB, 7.6 MS, 7.3 MW, Depth: 0.7 mi, Class: Major, Intensity: VIII - XII) earthquake occurred 64.7 miles away from Upland center, causing 3 deaths (1 shaking deaths, 2 other deaths) and 400 injuries, causing $100,000,000 total damage and $40,000,000 insured losses
On 7/21/1952 at 11:52:14, a magnitude 7.7 (7.7 UK) earthquake occurred 98.0 miles away from the city center, causing $50,000,000 total damage
On 10/16/1999 at 09:46:44, a magnitude 7.4 (6.3 MB, 7.4 MS, 7.2 MW, 7.3 ML) earthquake occurred 75.2 miles away from the city center
On 6/28/1992 at 15:05:30, a magnitude 6.9 (6.3 MB, 6.7 MS, 6.5 MW, 6.9 ME, Depth: 3.1 mi, Class: Strong, Intensity: VII - IX) earthquake occurred 49.6 miles away from the city center
On 4/21/1918 at 22:32:30, a magnitude 6.8 (6.8 UK) earthquake occurred 24.3 miles away from the city center
On 11/4/1927 at 13:51:53, a magnitude 7.5 (7.5 UK) earthquake occurred 200.0 miles away from the city center
Magnitude types: body-wave magnitude (MB), energy magnitude (ME), local magnitude (ML), surface-wave magnitude (MS), moment magnitude (MW)
Natural disasters:
The number of natural disasters in San Bernardino County (46) is a lot greater than the US average (15).Major Disasters (Presidential) Declared: 27
Emergencies Declared: 2
Causes of natural disasters: Fires: 24, Floods: 18, Storms: 9, Winter Storms: 6, Landslides: 5, Mudslides: 4, Heavy Rains: 2, Earthquake: 1, Flash Flood: 1, Freeze: 1, Hurricane: 1, Snow: 1, Tornado: 1, Tropical Storm: 1, Wind: 1, Other: 1 (Note: some incidents may be assigned to more than one category).

Hospitals in Upland:
- CASA #3 (1456 NORTH SECOND AVENUE)
- CASA #4 (1339 MONTE VERDE AVE)
- GIBBS DIVISION (1463 ALBRIGHT STREET)
- INDEP OPTS INC/THIRD AVENUE HO (1289 3RD AVENUE)
- SAN ANTONIO COMMUNITY HOSPITAL (Voluntary non-profit - Other, 999 SAN BERNARDINO RD)
- SHANGRILA HOSPICE (1126 W FOOTHILL BLVD, SUITE 235)
- SHEPHERD DIVISION (862 WEST 23RD STREET)
- YORKTOWN DIVISION (315 YORKTOWN)
Nursing Homes in Upland:
- HERITAGE PARK NURSING CENTER (275 GARNET WAY)
- UPLAND REHABILITATION AND CARE CENTER (1221 EAST ARROW HWY)
- VILLA MESA CARE CENTER (867 E. 11TH STREET)
Dialysis Facilities in Upland:
Home Health Centers in Upland:
- A AND E HOME HEALTH SERVICES, INC (2377 W FOOTHILL BLVD SUITE 14)
- AGAPE HOME CARE, INC (1004 W FOOTHILL BLVD STE 202)
- CELEBRITY HOMECARE (521 N MOUNTAIN AVENUE)
- DOUBLE ACE HOME HEALTH SERVICES INC (600 N MOUNTAIN AVENUE SUITE B205)
- EXCEL CARE HOME HEALTH SERVICES INC (222 N MOUNTAIN AVENUE SUITE 104)
- GOOD HOPE HOME HEALTH CARE (484 E FOOTHILL BLVD)
- NOVA HOME HEALTH INC (1551 W 13TH STREET SUITE 103)
- QUALITY FIRST HOME HEALTH CARE (600 NORTH MOUNTAIN AVENUE SUITE D105)
- RC HOME HEALTHCARE INC (600 N MOUNTAIN AVENUE STE B202)
- SENSICARE HOME HEALTH INC (222 N MOUNTAIN AVENUE)
- SUNSET HAVEN HOME HEALTH (275 GARNET WAY, SUITE B)
Airports and heliports located in Upland:
- Cable Airport (CCB) (Runways: 3, Itinerant Ops: 18,438, Local Ops: 73,751)
- San Antonio Community Hospital Heliport (99CA)
Amtrak stations near Upland:
- 4 miles: CLAREMONT (200 W. 1ST ST.) - Bus Station . Services: fully wheelchair accessible, public payphones, full-service food facilities, free short-term parking, free long-term parking, call for car rental service, call for taxi service, public transit connection.
- 4 miles: ONTARIO (228 S. PLUM ST.) . Services: fully wheelchair accessible, public payphones, vending machines, free short-term parking, call for taxi service.
- 7 miles: POMONA (156 W. COMMERCIAL ST.) . Services: partially wheelchair accessible, public payphones, free short-term parking, free long-term parking, call for taxi service, public transit connection.
Colleges/Universities in Upland:
Colleges/universities with over 2000 students nearest to Upland:
- Universal Technical Institute of California Inc (about 6 miles; Rancho Cucamonga, CA; Full-time enrollment: 4,158)
- Chaffey College (about 6 miles; Rancho Cucamonga, CA; FT enrollment: 10,496)
- University of La Verne (about 7 miles; La Verne, CA; FT enrollment: 6,983)
- DeVry University-California (about 10 miles; Pomona, CA; FT enrollment: 10,875)
- California State Polytechnic University-Pomona (about 11 miles; Pomona, CA; FT enrollment: 18,141)
- Mt San Antonio College (about 12 miles; Walnut, CA; FT enrollment: 19,891)
- Citrus College (about 14 miles; Glendora, CA; FT enrollment: 8,456)
Public high schools in Upland:
- UPLAND HIGH (Students: 2,580, Location: 565 W. 11TH ST., Grades: 9-12)
- HILLSIDE HIGH (Students: 81, Location: 1558 W. NINTH ST., Grades: 10-12)
Private high schools in Upland:
Biggest public elementary/middle schools in Upland:
- PIONEER JUNIOR HIGH (Students: 957, Location: 245 W. 18TH ST., Grades: 7-8)
- UPLAND JUNIOR HIGH (Students: 895, Location: 444 E. 11TH ST., Grades: 7-8)
- PEPPER TREE ELEMENTARY (Students: 545, Location: 1045 W. 18TH ST., Grades: KG-6)
- BALDY VIEW ELEMENTARY (Students: 491, Location: 979 W. 11TH ST., Grades: KG-6)
- CITRUS ELEMENTARY (Students: 471, Location: 925 W. SEVENTH ST., Grades: KG-6)
- CABRILLO ELEMENTARY (Students: 416, Location: 1562 W. 11TH ST., Grades: KG-6)
- UPLAND ELEMENTARY (Students: 376, Location: 444 E. 11TH ST., Grades: KG-6)
- FOOTHILL KNOLLS ELEMENTARY (Students: 338, Location: 1245 VETERANS CT., Grades: KG-6)
- SIERRA VISTA ELEMENTARY (Students: 276, Location: 253 E. 14TH ST., Grades: KG-6)
- SYCAMORE ELEMENTARY (Location: 1075 W. 13TH ST., Grades: KG-6)
Private elementary/middle schools in Upland:
Points of interest:
Notable locations in Upland: Weber Memorial Library (A), Upland Public Library (B), Upland Fire Department Station 164 (C), Upland Fire Department Station 163 (D), Upland Fire Department Station 162 (E), Upland City Hall (F), F C Crowell Memorial Hall (G), Upland Fire Department Station 161 (H). Display/hide their locations on the map
Shopping Centers: Mountain Green Center Shopping Center (1), Village Grove Shopping Center (2), Uptown and Country Shopping Center (3), Upland Village Square Shopping Center (4), Upland Village Shopping Center (5), Upland Square Shopping Center (6), Upland Shopping Center (7), Upland Country Village Shopping Center (8), The Plaza Shopping Center (9). Display/hide their locations on the map
Churches in Upland include: Saint George Orthodox Church (A), Brethren in Christ Church (B), Church of Christ (C), Church of the Nazarene (D), First Mennonite Church (E), First Methodist Church (F), First Presbyterian Church (G), Saint Josephs Roman Catholic Church (H), Saint Marks Episcopal Church (I). Display/hide their locations on the map
Reservoirs: Thirteenth Street Reservoir (A), Ontario Reservoir Number 1 (B). Display/hide their locations on the map
Parks in Upland include: Olive Dale Park (1), Upland Memorial Park (2), Pioneer Park (3), Fire Station Park (4), San Antonio Park (5), Baldy View Park (6), Citrus Park (7), Eleventh Street Park (8), Fern Reservoir Park (9). Display/hide their locations on the map
Tourist attraction: Chaffey Communities Cultural Center (Cultural Attractions- Events- & Facilities; 525 West 18th Street).
Hotel: Best Western Mountain View Inn (1191 East Foothill Boulevard).
Birthplace of: Eddie Lawson - Racing driver, Alexis Serna - Player of and football, Darren Spicer - Soccer player, Michael Bhatia - Anthropologist, Sean Tracey - Baseball player, Chad Cordero - 2005 Major League Baseball player (Washington Nationals, born: Mar 18, 1982), Chad Moeller - 2005 Major League Baseball player (Milwaukee Brewers, born: Feb 18, 1975), Chris Duke - Television personality, Jason Wright - 2005 NFL player (Atlanta Falcons, born: Jul 12, 1982), Steve Scott (athlete) - Athletics competitor.
Drinking water stations with addresses in Upland that have no violations reported:
- BIG PINE TRACT (Population served: 300, Primary Water Source Type: Groundwater)
| This city: | 2.8 people |
| California: | 2.9 people |
| This city: | 73.5% |
| Whole state: | 68.7% |
| This city: | 6.8% |
| Whole state: | 7.2% |
Likely homosexual households (counted as self-reported same-sex unmarried-partner households)
- Lesbian couples: 0.5% of all households
- Gay men: 0.3% of all households
People in group quarters in Upland in 2010:
- 359 people in nursing facilities/skilled-nursing facilities
- 128 people in group homes intended for adults
- 66 people in residential treatment centers for adults
- 45 people in workers' group living quarters and job corps centers
- 42 people in emergency and transitional shelters (with sleeping facilities) for people experiencing homelessness
- 24 people in other noninstitutional facilities
- 18 people in group homes for juveniles (non-correctional)
People in group quarters in Upland in 2000:
- 308 people in nursing homes
- 167 people in homes for the mentally retarded
- 44 people in other nonhousehold living situations
- 41 people in other noninstitutional group quarters
- 9 people in other group homes
- 8 people in homes for abused, dependent, and neglected children
- 8 people in religious group quarters
Banks with most branches in Upland (2011 data):
- Bank of America, National Association: North Upland Branch, Upland Branch, Colonies Crossroads Branch. Info updated 2009/11/18: Bank assets: $1,451,969.3 mil, Deposits: $1,077,176.8 mil, headquarters in Charlotte, NC, positive income, 5782 total offices, Holding Company: Bank Of America Corporation
- U.S. Bank National Association: West Foothill Boulevard Vons Branch, Upland Northwest Branch, Upland Branch. Info updated 2012/01/30: Bank assets: $330,470.8 mil, Deposits: $236,091.5 mil, headquarters in Cincinnati, OH, positive income, 3121 total offices, Holding Company: U.S. Bancorp
- JPMorgan Chase Bank, National Association: Upland Branch at 31 West Foothill Boulevard, branch established on 1993/02/26; Upland - Colonies Crossroads at 1905 North Campus Ave,, branch established on 2005/08/08. Info updated 2011/11/10: Bank assets: $1,811,678.0 mil, Deposits: $1,190,738.0 mil, headquarters in Columbus, OH, positive income, International Specialization, 5577 total offices, Holding Company: Jpmorgan Chase & Co.
- Golden State Bank: Administrative Office at 440 N. Mountain Avenue, branch established on 2006/02/10; at 1060 West Foothill Boulevard, branch established on 2003/12/01. Info updated 2011/04/13: Bank assets: $105.0 mil, Deposits: $98.0 mil, local headquarters, negative income in the last year, Commercial Lending Specialization, 3 total offices
- Wells Fargo Bank, National Association: Upland Colonies Branch at 1919 N Campus Ave, branch established on 2005/06/27; Foothill & Grand at 811 West Foothill Blvd, branch established on 2010/10/04. Info updated 2011/04/05: Bank assets: $1,161,490.0 mil, Deposits: $905,653.0 mil, headquarters in Sioux Falls, SD, positive income, 6395 total offices, Holding Company: Wells Fargo & Company
- Pacific Western Bank: Upland Branch at 569 North Mountain Avenue, branch established on 1974/03/25. Info updated 2011/03/14: Bank assets: $5,513.1 mil, Deposits: $4,614.5 mil, headquarters in Los Angeles, CA, positive income, Commercial Lending Specialization, 78 total offices, Holding Company: Capgen Capital Group Ii Lp
- Citizens Business Bank: Upland Branch at 818 North Mountain Avenue, branch established on 1980/09/15. Info updated 2011/03/30: Bank assets: $6,475.4 mil, Deposits: $4,625.6 mil, headquarters in Ontario, CA, positive income, Commercial Lending Specialization, 46 total offices, Holding Company: Cvb Financial Corp.
- Union Bank, National Association: Upland Branch at 188 N Euclid Ave Ste A, branch established on 1995/02/27. Info updated 2011/09/01: Bank assets: $88,967.5 mil, Deposits: $65,286.4 mil, headquarters in San Francisco, CA, positive income, Commercial Lending Specialization, 403 total offices, Holding Company: Mitsubishi Ufj Financial Group, Inc.
- California Bank & Trust: Upland Branch at 2009 West Foothill Boulevard, branch established on 1981/08/24. Info updated 2009/07/20: Bank assets: $10,894.1 mil, Deposits: $9,193.9 mil, headquarters in San Diego, CA, positive income, Commercial Lending Specialization, 109 total offices, Holding Company: Zions Bancorporation
For population 15 years and over in Upland:
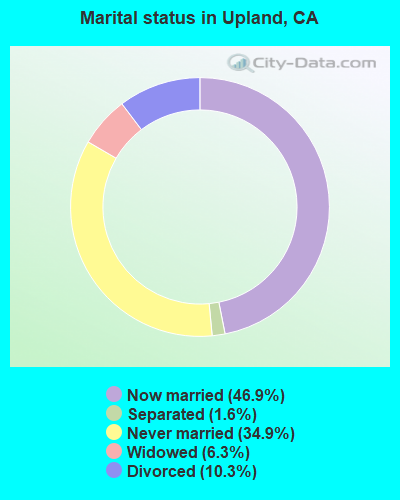
- Never married: 34.9%
- Now married: 46.9%
- Separated: 1.6%
- Widowed: 6.3%
- Divorced: 10.3%
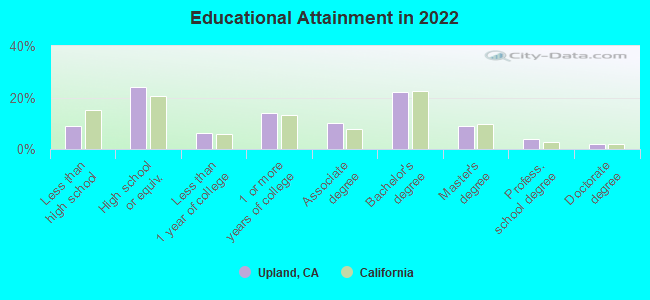
For population 25 years and over in Upland:
- High school or higher: 91.2%
- Bachelor's degree or higher: 37.2%
- Graduate or professional degree: 15.0%
- Unemployed: 5.7%
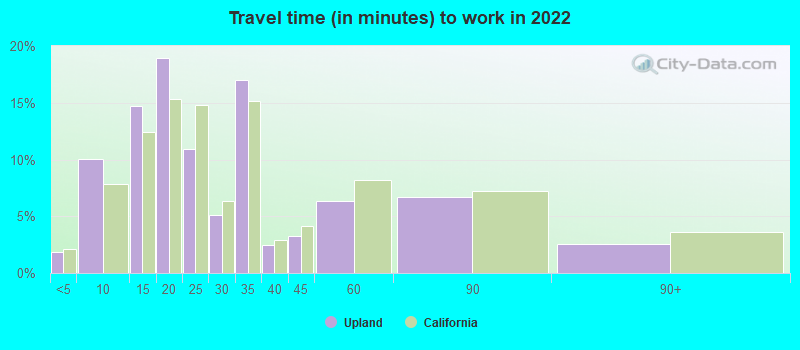
- Mean travel time to work (commute): 22.2 minutes
| Here: | 12.6 |
| California average: | 15.5 |
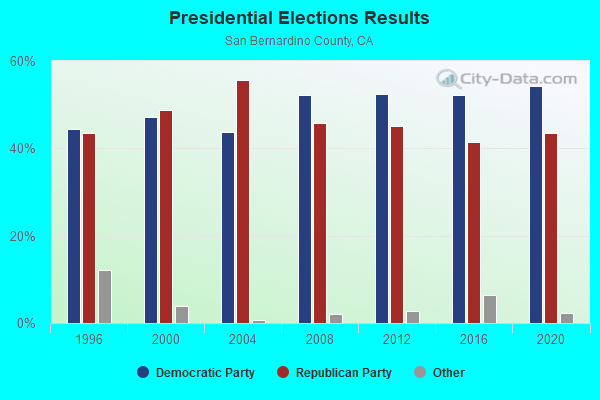
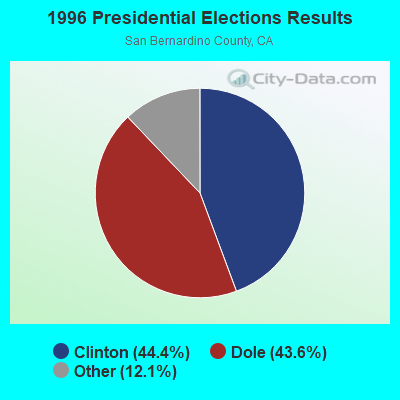
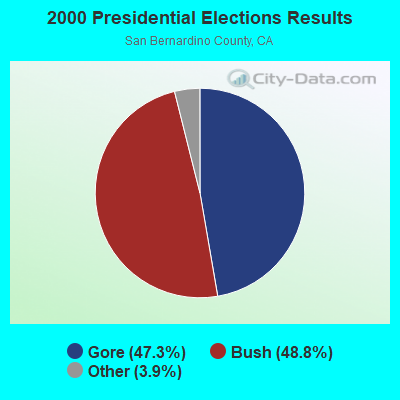
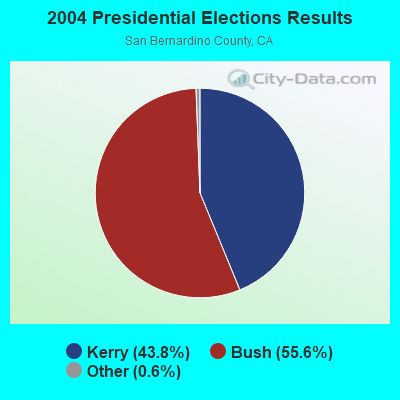
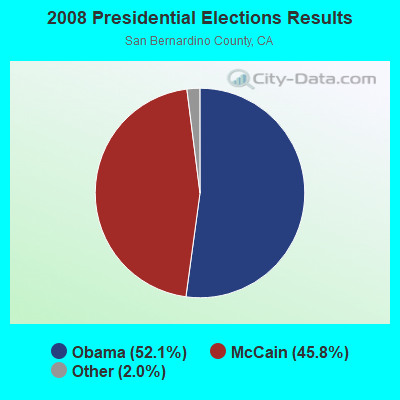
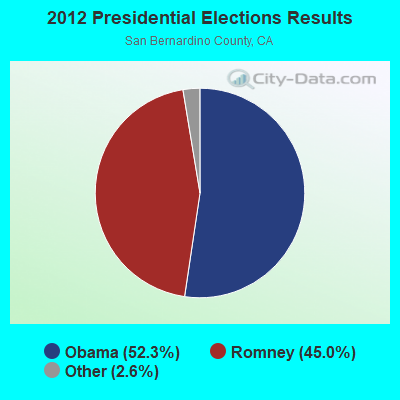
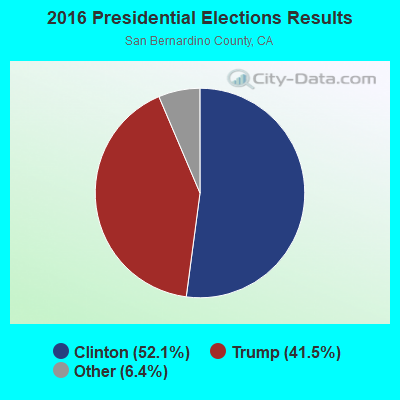
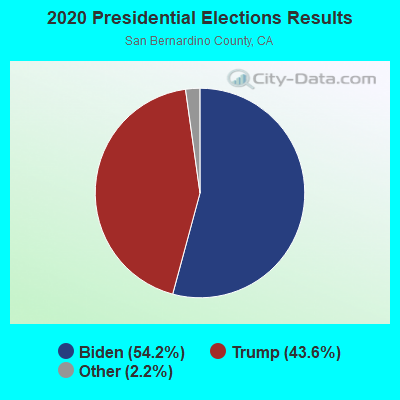
Graphs represent county-level data. Detailed 2008 Election Results
Neighborhoods in Upland:
(Upland, California Neighborhood Map)Religion statistics for Upland, CA (based on San Bernardino County data)
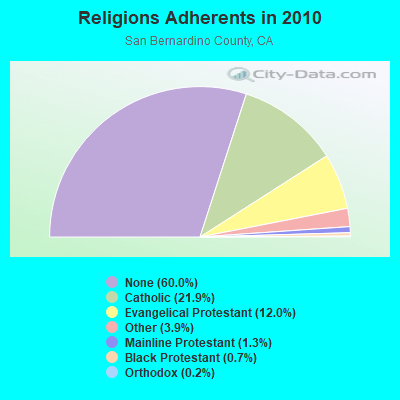
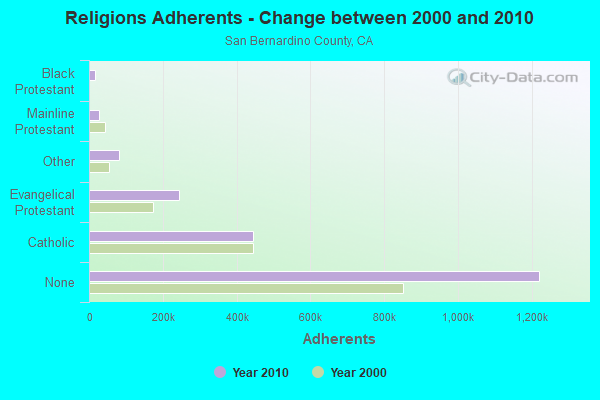
| Religion | Adherents | Congregations |
|---|---|---|
| Catholic | 445,334 | 55 |
| Evangelical Protestant | 243,524 | 832 |
| Other | 80,047 | 205 |
| Mainline Protestant | 26,062 | 135 |
| Black Protestant | 14,969 | 37 |
| Orthodox | 3,868 | 10 |
| None | 1,221,406 | - |
Food Environment Statistics:
| This county: | 1.50 / 10,000 pop. |
| California: | 2.14 / 10,000 pop. |
| San Bernardino County: | 0.05 / 10,000 pop. |
| State: | 0.04 / 10,000 pop. |
| San Bernardino County: | 0.57 / 10,000 pop. |
| State: | 0.62 / 10,000 pop. |
| Here: | 1.60 / 10,000 pop. |
| State: | 1.49 / 10,000 pop. |
| This county: | 4.69 / 10,000 pop. |
| State: | 7.42 / 10,000 pop. |
| San Bernardino County: | 7.4% |
| California: | 7.3% |
| Here: | 27.1% |
| California: | 21.3% |
| This county: | 16.2% |
| California: | 17.9% |
Health and Nutrition:
| This city: | 50.5% |
| California: | 49.4% |
| Upland: | 49.7% |
| California: | 48.0% |
| This city: | 28.4 |
| California: | 28.1 |
| This city: | 19.4% |
| California: | 20.2% |
| Upland: | 11.1% |
| State: | 11.2% |
| Here: | 6.8 |
| California: | 6.8 |
| Here: | 33.8% |
| State: | 31.5% |
| This city: | 57.7% |
| California: | 56.4% |
| Upland: | 81.0% |
| California: | 80.9% |
More about Health and Nutrition of Upland, CA Residents
| Local government employment and payroll (March 2022) | |||||
| Function | Full-time employees | Monthly full-time payroll | Average yearly full-time wage | Part-time employees | Monthly part-time payroll |
|---|---|---|---|---|---|
| Police Protection - Officers | 73 | $766,390 | $125,982 | 0 | $0 |
| Other and Unallocable | 56 | $371,568 | $79,622 | 3 | $5,173 |
| Police - Other | 33 | $164,269 | $59,734 | 3 | $4,796 |
| Financial Administration | 18 | $110,319 | $73,546 | 2 | $6,218 |
| Water Supply | 13 | $78,979 | $72,904 | 0 | $0 |
| Other Government Administration | 11 | $100,801 | $109,965 | 5 | $3,168 |
| Sewerage | 5 | $24,747 | $59,393 | 0 | $0 |
| Parks and Recreation | 5 | $32,346 | $77,630 | 18 | $23,468 |
| Health | 3 | $29,738 | $118,952 | 0 | $0 |
| Natural Resources | 2 | $15,888 | $95,328 | 0 | $0 |
| Housing and Community Development (Local) | 1 | $12,489 | $149,868 | 0 | $0 |
| Totals for Government | 220 | $1,707,533 | $93,138 | 31 | $42,823 |
Upland government finances - Expenditure in 2021 (per resident):
- Construction - Regular Highways: $5,498,000 ($69.74)
Water Utilities: $3,936,000 ($49.92)
Parks and Recreation: $860,000 ($10.91)
Police Protection: $771,000 ($9.78)
Sewerage: $238,000 ($3.02)
General Public Buildings: $224,000 ($2.84)
Libraries: $157,000 ($1.99)
Health - Other: $126,000 ($1.60)
Housing and Community Development: $66,000 ($0.84)
General - Other: $65,000 ($0.82)
Solid Waste Management: $55,000 ($0.70)
- Current Operations - Police Protection: $27,688,000 ($351.19)
Water Utilities: $21,867,000 ($277.36)
Solid Waste Management: $14,488,000 ($183.76)
Sewerage: $9,882,000 ($125.34)
Regular Highways: $8,615,000 ($109.27)
Central Staff Services: $4,715,000 ($59.80)
Housing and Community Development: $4,094,000 ($51.93)
Parks and Recreation: $2,134,000 ($27.07)
Libraries: $1,528,000 ($19.38)
Financial Administration: $1,362,000 ($17.28)
Protective Inspection and Regulation - Other: $869,000 ($11.02)
Judicial and Legal Services: $835,000 ($10.59)
Health - Other: $240,000 ($3.04)
Local Fire Protection: $47,000 ($0.60)
General - Other: $43,000 ($0.55)
- General - Interest on Debt: $1,568,000 ($19.89)
- Other Capital Outlay - Regular Highways: $730,000 ($9.26)
Police Protection: $480,000 ($6.09)
Water Utilities: $225,000 ($2.85)
General - Other: $195,000 ($2.47)
Sewerage: $68,000 ($0.86)
- Water Utilities - Interest on Debt: $329,000 ($4.17)
Upland government finances - Revenue in 2021 (per resident):
- Charges - Solid Waste Management: $14,644,000 ($185.74)
Sewerage: $10,404,000 ($131.96)
Housing and Community Development: $4,614,000 ($58.52)
Other: $2,016,000 ($25.57)
Parks and Recreation: $132,000 ($1.67)
Parking Facilities: $4,000 ($0.05)
- Federal Intergovernmental - Housing and Community Development: $359,000 ($4.55)
Other: $156,000 ($1.98)
- Local Intergovernmental - Other: $973,000 ($12.34)
- Miscellaneous - Special Assessments: $4,969,000 ($63.03)
General Revenue - Other: $3,113,000 ($39.48)
Interest Earnings: $911,000 ($11.55)
Rents: $877,000 ($11.12)
Fines and Forfeits: $558,000 ($7.08)
Sale of Property: $169,000 ($2.14)
Donations From Private Sources: $9,000 ($0.11)
- Revenue - Water Utilities: $29,333,000 ($372.05)
- State Intergovernmental - Other: $4,677,000 ($59.32)
Highways: $3,190,000 ($40.46)
General Local Government Support: $65,000 ($0.82)
- Tax - General Sales and Gross Receipts: $18,659,000 ($236.67)
Property: $18,187,000 ($230.68)
Other License: $3,949,000 ($50.09)
Occupation and Business License - Other: $1,534,000 ($19.46)
Public Utilities Sales: $1,306,000 ($16.56)
Documentary and Stock Transfer: $448,000 ($5.68)
Other: $307,000 ($3.89)
Other Selective Sales: $196,000 ($2.49)
Upland government finances - Debt in 2021 (per resident):
- Long Term Debt - Beginning Outstanding - Unspecified Public Purpose: $31,081,000 ($394.22)
Outstanding Unspecified Public Purpose: $28,503,000 ($361.53)
Retired Unspecified Public Purpose: $2,578,000 ($32.70)
Upland government finances - Cash and Securities in 2021 (per resident):
- Bond Funds - Cash and Securities: $21,351,000 ($270.81)
- Other Funds - Cash and Securities: $70,534,000 ($894.64)
- Sinking Funds - Cash and Securities: $3,262,000 ($41.37)
6.45% of this county's 2021 resident taxpayers lived in other counties in 2020 ($54,954 average adjusted gross income)
| Here: | 6.45% |
| California average: | 5.19% |
0.03% of residents moved from foreign countries ($259 average AGI)
San Bernardino County: 0.03% California average: 0.03%
Top counties from which taxpayers relocated into this county between 2020 and 2021:
| from Los Angeles County, CA | |
| from Riverside County, CA | |
| from Orange County, CA |
6.46% of this county's 2020 resident taxpayers moved to other counties in 2021 ($59,647 average adjusted gross income)
| Here: | 6.46% |
| California average: | 6.14% |
0.03% of residents moved to foreign countries ($253 average AGI)
San Bernardino County: 0.03% California average: 0.02%
Top counties to which taxpayers relocated from this county between 2020 and 2021:
| to Riverside County, CA | |
| to Los Angeles County, CA | |
| to Orange County, CA |
| Businesses in Upland, CA | ||||
| Name | Count | Name | Count | |
|---|---|---|---|---|
| 24 Hour Fitness | 1 | KFC | 1 | |
| 7-Eleven | 3 | Kohl's | 2 | |
| 99 Cents Only Stores | 1 | LA Fitness | 1 | |
| AT&T | 2 | Lowe's | 1 | |
| Ace Hardware | 1 | Marshalls | 1 | |
| Albertsons | 2 | MasterBrand Cabinets | 2 | |
| Arby's | 1 | McDonald's | 3 | |
| AutoZone | 1 | Nike | 3 | |
| Baskin-Robbins | 1 | Office Depot | 1 | |
| Bed Bath & Beyond | 1 | Outback | 1 | |
| Blockbuster | 1 | Outback Steakhouse | 1 | |
| Brunswick Bowling & Billiards | 1 | Payless | 2 | |
| Burger King | 1 | Penske | 1 | |
| CVS | 3 | PetSmart | 1 | |
| Carl\s Jr. | 3 | Pizza Hut | 1 | |
| Casual Male XL | 1 | Popeyes | 1 | |
| Chevrolet | 1 | Qdoba Mexican Grill | 1 | |
| Chick-Fil-A | 1 | Quiznos | 2 | |
| Chipotle | 1 | RadioShack | 1 | |
| Circle K | 3 | Safeway | 1 | |
| Cold Stone Creamery | 1 | Sprint Nextel | 2 | |
| Curves | 1 | Staples | 1 | |
| DHL | 1 | Starbucks | 4 | |
| Decora Cabinetry | 2 | Subway | 5 | |
| Dennys | 2 | Super 8 | 1 | |
| Discount Tire | 1 | T-Mobile | 5 | |
| Domino's Pizza | 1 | Taco Bell | 1 | |
| El Pollo Loco | 1 | Target | 1 | |
| Fashion Bug | 1 | Trader Joe's | 1 | |
| FedEx | 9 | U-Haul | 3 | |
| Firestone Complete Auto Care | 1 | UPS | 11 | |
| GameStop | 2 | Vans | 1 | |
| H&R Block | 2 | Verizon Wireless | 2 | |
| Home Depot | 2 | Vons | 1 | |
| IHOP | 1 | Walgreens | 1 | |
| Jack In The Box | 1 | Walmart | 1 | |
| Jamba Juice | 2 | Wendy's | 1 | |
| Jones New York | 2 | YMCA | 1 | |
Strongest AM radio stations in Upland:
- KSPA (1510 AM; 10 kW; ONTARIO, CA; Owner: ONTARIO BROADCASTING, LLC)
- KPLS (830 AM; 50 kW; ORANGE, CA; Owner: CRN LICENSES, LLC)
- KLAC (570 AM; 50 kW; LOS ANGELES, CA; Owner: AMFM RADIO LICENSES, L.L.C.)
- KTNQ (1020 AM; 50 kW; LOS ANGELES, CA; Owner: KTNQ-AM LICENSE CORP.)
- KDIS (1110 AM; 50 kW; PASADENA, CA; Owner: ABC,INC.)
- KXTA (1150 AM; 50 kW; LOS ANGELES, CA; Owner: CITICASTERS LICENSES, L.P.)
- KFI (640 AM; 50 kW; LOS ANGELES, CA; Owner: CAPSTAR TX LIMITED PARTNERSHIP)
- KMNY (1600 AM; 5 kW; POMONA, CA; Owner: MULTICULTURAL RADIO BROADCASTING, INC.)
- KFWB (980 AM; 50 kW; LOS ANGELES, CA; Owner: INFINITY BROADCASTING OPERATIONS, INC.)
- KMPC (1540 AM; 50 kW; LOS ANGELES, CA; Owner: ROSE CITY RADIO CORPORATION)
- KSPN (710 AM; 50 kW; LOS ANGELES, CA; Owner: KABC-AM RADIO, INC.)
- KBLA (1580 AM; 50 kW; SANTA MONICA, CA)
- KNX (1070 AM; 50 kW; LOS ANGELES, CA; Owner: INFINITY BROADCASTING OPERATIONS, INC.)
Strongest FM radio stations in Upland:
- K264AF (100.7 FM; GUASTI, CA; Owner: EDUCATIONAL MEDIA FOUNDATION)
- KRCV (98.3 FM; WEST COVINA, CA; Owner: HBC LICENSE CORPORATION)
- KCBS-FM (93.1 FM; LOS ANGELES, CA; Owner: INFINITY BROADCASTING OPERATIONS, INC.)
- K295AI (106.9 FM; MUSCOY, CA; Owner: ASSOCIATION FOR COMMUNITY EDUCATION, INC.)
- KSCA (101.9 FM; GLENDALE, CA; Owner: HBC LICENSE CORPORATION)
- KLOS (95.5 FM; LOS ANGELES, CA; Owner: KLOS-FM RADIO, INC.)
- KOST (103.5 FM; LOS ANGELES, CA; Owner: CAPSTAR TX LIMITED PARTNERSHIP)
- K212FA (90.3 FM; TEMPLE CITY, CA; Owner: EDUCATIONAL MEDIA FOUNDATION)
- KIIS-FM (102.7 FM; LOS ANGELES, CA; Owner: CITICASTERS LICENSES, L.P.)
- KLVE (107.5 FM; LOS ANGELES, CA; Owner: KLVE-FM LICENSE CORP.)
- KPCC (89.3 FM; PASADENA, CA; Owner: PASADENA AREA COMMUNITY COLLEGE DISTRICT)
- KHHT (92.3 FM; LOS ANGELES, CA; Owner: AMFM RADIO LICENSES, L.L.C.)
- KBIG-FM (104.3 FM; LOS ANGELES, CA; Owner: AMFM RADIO LICENSES, L.L.C.)
- KMZT-FM (105.1 FM; LOS ANGELES, CA; Owner: MOUNT WILSON FM BROADCASTERS, INC.)
- KTWV (94.7 FM; LOS ANGELES, CA; Owner: INFINITY BROADCASTING OPERATIONS, INC.)
- KPFK (90.7 FM; LOS ANGELES, CA; Owner: PACIFICA FOUNDATION, INC)
- K216EM (91.1 FM; ARCADIA, CA; Owner: LIFE ON THE WAY COMMUNICATIONS, INC.)
- KZLA-FM (93.9 FM; LOS ANGELES, CA; Owner: EMMIS RADIO LICENSE CORPORATION)
- KUOR-FM (89.1 FM; REDLANDS, CA; Owner: UNIVERSITY OF REDLANDS)
- KPWR (105.9 FM; LOS ANGELES, CA; Owner: EMMIS RADIO LICENSE CORPORATION)
TV broadcast stations around Upland:
- KTRO-LP (Channel 50; LANCASTER, CA; Owner: ROBERT D. ADELMAN)
- KRCA (Channel 62; RIVERSIDE, CA; Owner: KRCA LICENSE CORP.)
- KPXN (Channel 30; SAN BERNARDINO, CA; Owner: PAXSON LOS ANGELES LICENSE, INC.)
- KCBS-TV (Channel 2; LOS ANGELES, CA; Owner: CBS BROADCASTING INC.)
- KHIZ (Channel 64; BARSTOW, CA; Owner: SUNBELT TELEVISION, INC.)
- KTLA-TV (Channel 5; LOS ANGELES, CA; Owner: KTLA INC.)
- KABC-TV (Channel 7; LOS ANGELES, CA; Owner: ABC HOLDING COMPANY, INC.)
- KCAL-TV (Channel 9; LOS ANGELES, CA; Owner: VIACOM TELEVISION STATIONS GROUP OF LOS ANGELES LLC)
- KNBC (Channel 4; LOS ANGELES, CA; Owner: NBC SUBSIDIARY (KNBC-TV), INC.)
- KMEX-TV (Channel 34; LOS ANGELES, CA; Owner: KMEX LICENSE PARTNERSHIP, G.P.)
- KAZA-TV (Channel 54; AVALON, CA; Owner: PAPPAS SOUTHERN CALIFORNIA LICENSE LLC)
- KDOC-TV (Channel 56; ANAHEIM, CA; Owner: GOLDEN ORANGE BROADCASTING CO., INC.)
- KOCE-TV (Channel 50; HUNTINGTON BEACH, CA; Owner: BD. OF TRUSTEES, COAST COMMUNITY COLLEGE DIST.)
- KSCI (Channel 18; LONG BEACH, CA; Owner: KSLS, INC.)
- KXLA (Channel 44; RANCHO PALOS VERDES, CA; Owner: RANCHO PALOS VERDES BROADCASTERS, INC.)
- KCET (Channel 28; LOS ANGELES, CA; Owner: COMMUNITY TELEVISION OF SOUTHERN CALIFORNIA)
- KFTR (Channel 46; ONTARIO, CA; Owner: TELEFUTURA LOS ANGELES LLC)
- National Bridge Inventory (NBI) Statistics
- 26Number of bridges
- 243ft / 74.2mTotal length
- 2,499,320Total average daily traffic
- 147,720Total average daily truck traffic
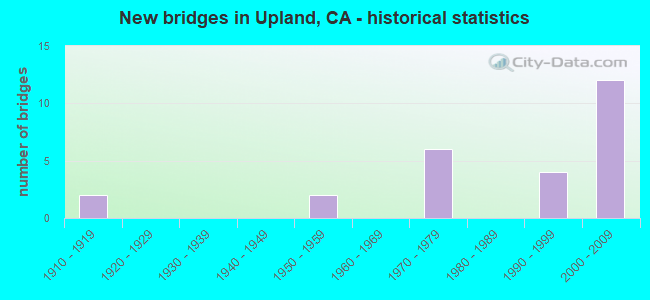
- New bridges - historical statistics
- 21910-1919
- 21950-1959
- 61970-1979
- 41990-1999
- 122000-2009
FCC Registered Antenna Towers: 497 (See the full list of FCC Registered Antenna Towers)
FCC Registered Private Land Mobile Towers: 4 (See the full list of FCC Registered Private Land Mobile Towers in Upland, CA)
FCC Registered Broadcast Land Mobile Towers: 31 (See the full list of FCC Registered Broadcast Land Mobile Towers)
FCC Registered Microwave Towers: 51 (See the full list of FCC Registered Microwave Towers in this town)
FCC Registered Paging Towers: 1 (See the full list of FCC Registered Paging Towers)
FCC Registered Maritime Coast & Aviation Ground Towers: 3 (See the full list of FCC Registered Maritime Coast & Aviation Ground Towers)
FCC Registered Amateur Radio Licenses: 560 (See the full list of FCC Registered Amateur Radio Licenses in Upland)
FAA Registered Aircraft Manufacturers and Dealers: 14 (See the full list of FAA Registered Manufacturers and Dealers in Upland)
FAA Registered Aircraft: 113 (See the full list of FAA Registered Aircraft)
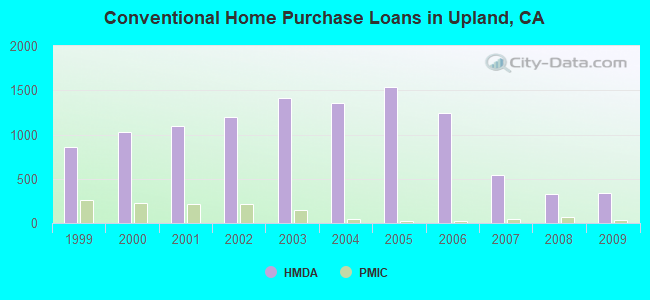
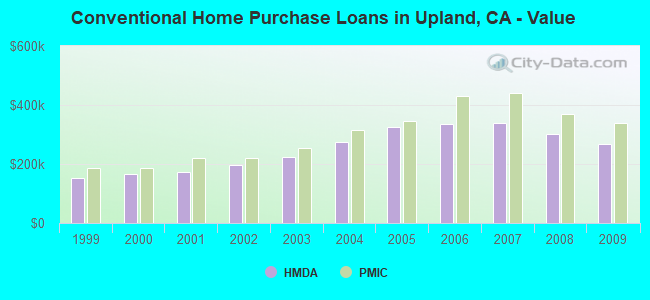
| Home Mortgage Disclosure Act Aggregated Statistics For Year 2009 (Based on 7 full and 1 partial tracts) | ||||||||||||||
| A) FHA, FSA/RHS & VA Home Purchase Loans | B) Conventional Home Purchase Loans | C) Refinancings | D) Home Improvement Loans | E) Loans on Dwellings For 5+ Families | F) Non-occupant Loans on < 5 Family Dwellings (A B C & D) | G) Loans On Manufactured Home Dwelling (A B C & D) | ||||||||
|---|---|---|---|---|---|---|---|---|---|---|---|---|---|---|
| Number | Average Value | Number | Average Value | Number | Average Value | Number | Average Value | Number | Average Value | Number | Average Value | Number | Average Value | |
| LOANS ORIGINATED | 217 | $309,362 | 335 | $266,410 | 1,159 | $268,478 | 48 | $195,542 | 7 | $1,563,450 | 82 | $218,862 | 5 | $63,188 |
| APPLICATIONS APPROVED, NOT ACCEPTED | 21 | $253,959 | 33 | $261,554 | 122 | $285,025 | 18 | $55,403 | 1 | $3,807,910 | 12 | $211,388 | 4 | $70,365 |
| APPLICATIONS DENIED | 33 | $276,908 | 64 | $244,841 | 385 | $295,975 | 24 | $105,688 | 5 | $949,902 | 34 | $248,102 | 15 | $73,347 |
| APPLICATIONS WITHDRAWN | 35 | $283,902 | 64 | $280,785 | 228 | $294,895 | 14 | $170,334 | 0 | $0 | 16 | $257,020 | 2 | $75,500 |
| FILES CLOSED FOR INCOMPLETENESS | 4 | $367,870 | 19 | $274,608 | 62 | $305,140 | 4 | $148,000 | 0 | $0 | 9 | $290,090 | 1 | $123,000 |
Detailed HMDA statistics for the following Tracts: 0008.05 , 0008.06, 0008.07, 0008.08, 0008.09, 0008.10, 0008.11, 0009.00
| Private Mortgage Insurance Companies Aggregated Statistics For Year 2009 (Based on 7 full and 1 partial tracts) | ||||
| A) Conventional Home Purchase Loans | B) Refinancings | |||
|---|---|---|---|---|
| Number | Average Value | Number | Average Value | |
| LOANS ORIGINATED | 35 | $339,345 | 10 | $307,414 |
| APPLICATIONS APPROVED, NOT ACCEPTED | 12 | $312,291 | 6 | $358,062 |
| APPLICATIONS DENIED | 8 | $392,441 | 7 | $342,387 |
| APPLICATIONS WITHDRAWN | 3 | $247,990 | 2 | $308,500 |
| FILES CLOSED FOR INCOMPLETENESS | 1 | $234,000 | 0 | $0 |
Detailed PMIC statistics for the following Tracts: 0008.05 , 0008.06, 0008.07, 0008.08, 0008.09, 0008.10, 0008.11, 0009.00
2005 - 2018 National Fire Incident Reporting System (NFIRS) incidents
- Fire incident types reported to NFIRS in Upland, CA
- 24751.5%Structure Fires
- 11624.2%Outside Fires
- 10020.8%Mobile Property/Vehicle Fires
- 173.5%Other
 Based on the data from the years 2005 - 2018 the average number of fire incidents per year is 34. The highest number of reported fire incidents - 94 took place in 2018, and the least - 17 in 2012. The data has a growing trend.
 When looking into fire subcategories, the most incidents belonged to: Structure Fires (51.5%), and Outside Fires (24.2%).
| Most common first names in Upland, CA among deceased individuals | ||
| Name | Count | Lived (average) |
|---|---|---|
| Mary | 319 | 80.9 years |
| John | 293 | 73.9 years |
| William | 228 | 75.4 years |
| Robert | 204 | 71.8 years |
| James | 186 | 72.9 years |
| Charles | 156 | 74.3 years |
| Margaret | 141 | 80.2 years |
| George | 139 | 76.4 years |
| Helen | 135 | 80.3 years |
| Ruth | 127 | 81.7 years |
| Most common last names in Upland, CA among deceased individuals | ||
| Last name | Count | Lived (average) |
|---|---|---|
| Smith | 144 | 76.6 years |
| Johnson | 60 | 74.1 years |
| Jones | 50 | 78.9 years |
| Wilson | 49 | 74.3 years |
| Miller | 49 | 78.2 years |
| Brown | 47 | 73.5 years |
| Anderson | 43 | 77.7 years |
| Davis | 42 | 77.1 years |
| Williams | 40 | 79.7 years |
| Martin | 39 | 77.4 years |
- 85.1%Utility gas
- 12.8%Electricity
- 0.9%Bottled, tank, or LP gas
- 0.7%Solar energy
- 0.3%No fuel used
- 62.2%Utility gas
- 32.7%Electricity
- 2.9%No fuel used
- 1.4%Bottled, tank, or LP gas
- 0.4%Solar energy
- 0.2%Other fuel
Upland compared to California state average:
- Unemployed percentage below state average.
- Black race population percentage above state average.
Upland on our top lists:
- #8 on the list of "Top 101 cities with largest percentage of females in occupations: installation, maintenance, and repair occupations (population 50,000+)"
- #24 on the list of "Top 101 cities with largest percentage of males in occupations: health technologists and technicians (population 50,000+)"
- #40 on the list of "Top 101 cities with the largest racial income disparity between any two races with at least 200 householders"
- #42 on the list of "Top 101 cities with the lowest number of police officers per 1000 residents (population 50,000+)"
- #46 on the list of "Top 101 cities with largest percentage of females in industries: wholesale trade (population 50,000+)"
- #68 on the list of "Top 101 cities with the smallest sunshine amount differences during a year (population 50,000+)"
- #70 on the list of "Top 101 cities with largest percentage of males in industries: health care and social assistance (population 50,000+)"
- #72 on the list of "Top 101 cities with the most cars per house, population 50,000+"
- #76 on the list of "Top 101 cities with largest percentage of males in occupations: personal care and service occupations (population 50,000+)"
- #82 on the list of "Top 101 cities with largest percentage of males in industries: utilities (population 50,000+)"
- #87 on the list of "Top 100 cities with highest ratio of median house value to median household income (pop. 50,000+)"
- #87 on the list of "Top 100 cities with longest commuting times (pop. 50,000+)"
- #99 on the list of "Top 101 cities with largest percentage of males in occupations: management occupations (population 50,000+)"
- #100 on the list of "Top 101 cities with largest percentage of females in industries: construction (population 50,000+)"
- #5 on the list of "Top 101 counties with the highest Nitrogen Dioxide air pollution readings in 2012 (ppm)"
- #5 on the list of "Top 101 counties with the highest ground withdrawal of fresh water for public supply"
- #10 on the list of "Top 101 counties with the most Evangelical Protestant congregations"
- #14 on the list of "Top 101 counties with the highest total withdrawal of fresh water for public supply"
- #15 on the list of "Top 101 counties with the most Evangelical Protestant adherents (pop. 50,000+)"

|
|
Total of 400 patent applications in 2008-2024.