West Fargo, North Dakota Submit your own pictures of this city and show them to the world
OSM Map
General Map
Google Map
MSN Map
OSM Map
General Map
Google Map
MSN Map
OSM Map
General Map
Google Map
MSN Map
OSM Map
General Map
Google Map
MSN Map
Please wait while loading the map...
Population in 2022: 39,985 (100% urban, 0% rural). Population change since 2000: +167.6%Males: 20,436 Females: 19,549
March 2022 cost of living index in West Fargo: 99.4 (near average, U.S. average is 100) Percentage of residents living in poverty in 2022: 6.8%for White Non-Hispanic residents , 46.2% for Black residents , 18.5% for Hispanic or Latino residents , 1.1% for American Indian residents , 29.7% for other race residents , 7.2% for two or more races residents )
Profiles of local businesses
Business Search - 14 Million verified businesses
Data:
Median household income ($)
Median household income (% change since 2000)
Household income diversity
Ratio of average income to average house value (%)
Ratio of average income to average rent
Median household income ($) - White
Median household income ($) - Black or African American
Median household income ($) - Asian
Median household income ($) - Hispanic or Latino
Median household income ($) - American Indian and Alaska Native
Median household income ($) - Multirace
Median household income ($) - Other Race
Median household income for houses/condos with a mortgage ($)
Median household income for apartments without a mortgage ($)
Races - White alone (%)
Races - White alone (% change since 2000)
Races - Black alone (%)
Races - Black alone (% change since 2000)
Races - American Indian alone (%)
Races - American Indian alone (% change since 2000)
Races - Asian alone (%)
Races - Asian alone (% change since 2000)
Races - Hispanic (%)
Races - Hispanic (% change since 2000)
Races - Native Hawaiian and Other Pacific Islander alone (%)
Races - Native Hawaiian and Other Pacific Islander alone (% change since 2000)
Races - Two or more races (%)
Races - Two or more races (% change since 2000)
Races - Other race alone (%)
Races - Other race alone (% change since 2000)
Racial diversity
Unemployment (%)
Unemployment (% change since 2000)
Unemployment (%) - White
Unemployment (%) - Black or African American
Unemployment (%) - Asian
Unemployment (%) - Hispanic or Latino
Unemployment (%) - American Indian and Alaska Native
Unemployment (%) - Multirace
Unemployment (%) - Other Race
Population density (people per square mile)
Population - Males (%)
Population - Females (%)
Population - Males (%) - White
Population - Males (%) - Black or African American
Population - Males (%) - Asian
Population - Males (%) - Hispanic or Latino
Population - Males (%) - American Indian and Alaska Native
Population - Males (%) - Multirace
Population - Males (%) - Other Race
Population - Females (%) - White
Population - Females (%) - Black or African American
Population - Females (%) - Asian
Population - Females (%) - Hispanic or Latino
Population - Females (%) - American Indian and Alaska Native
Population - Females (%) - Multirace
Population - Females (%) - Other Race
Coronavirus confirmed cases (Jun 16, 2024)
Deaths caused by coronavirus (Jun 16, 2024)
Coronavirus confirmed cases (per 100k population) (Jun 16, 2024)
Deaths caused by coronavirus (per 100k population) (Jun 16, 2024)
Daily increase in number of cases (Jun 16, 2024)
Weekly increase in number of cases (Jun 16, 2024)
Cases doubled (in days) (Jun 16, 2024)
Hospitalized patients (Apr 18, 2022)
Negative test results (Apr 18, 2022)
Total test results (Apr 18, 2022)
COVID Vaccine doses distributed (per 100k population) (Sep 19, 2023)
COVID Vaccine doses administered (per 100k population) (Sep 19, 2023)
COVID Vaccine doses distributed (Sep 19, 2023)
COVID Vaccine doses administered (Sep 19, 2023)
Likely homosexual households (%)
Likely homosexual households (% change since 2000)
Likely homosexual households - Lesbian couples (%)
Likely homosexual households - Lesbian couples (% change since 2000)
Likely homosexual households - Gay men (%)
Likely homosexual households - Gay men (% change since 2000)
Cost of living index
Median gross rent ($)
Median contract rent ($)
Median monthly housing costs ($)
Median house or condo value ($)
Median house or condo value ($ change since 2000)
Mean house or condo value by units in structure - 1, detached ($)
Mean house or condo value by units in structure - 1, attached ($)
Mean house or condo value by units in structure - 2 ($)
Mean house or condo value by units in structure by units in structure - 3 or 4 ($)
Mean house or condo value by units in structure - 5 or more ($)
Mean house or condo value by units in structure - Boat, RV, van, etc. ($)
Mean house or condo value by units in structure - Mobile home ($)
Median house or condo value ($) - White
Median house or condo value ($) - Black or African American
Median house or condo value ($) - Asian
Median house or condo value ($) - Hispanic or Latino
Median house or condo value ($) - American Indian and Alaska Native
Median house or condo value ($) - Multirace
Median house or condo value ($) - Other Race
Median resident age
Resident age diversity
Median resident age - Males
Median resident age - Females
Median resident age - White
Median resident age - Black or African American
Median resident age - Asian
Median resident age - Hispanic or Latino
Median resident age - American Indian and Alaska Native
Median resident age - Multirace
Median resident age - Other Race
Median resident age - Males - White
Median resident age - Males - Black or African American
Median resident age - Males - Asian
Median resident age - Males - Hispanic or Latino
Median resident age - Males - American Indian and Alaska Native
Median resident age - Males - Multirace
Median resident age - Males - Other Race
Median resident age - Females - White
Median resident age - Females - Black or African American
Median resident age - Females - Asian
Median resident age - Females - Hispanic or Latino
Median resident age - Females - American Indian and Alaska Native
Median resident age - Females - Multirace
Median resident age - Females - Other Race
Commute - mean travel time to work (minutes)
Travel time to work - Less than 5 minutes (%)
Travel time to work - Less than 5 minutes (% change since 2000)
Travel time to work - 5 to 9 minutes (%)
Travel time to work - 5 to 9 minutes (% change since 2000)
Travel time to work - 10 to 19 minutes (%)
Travel time to work - 10 to 19 minutes (% change since 2000)
Travel time to work - 20 to 29 minutes (%)
Travel time to work - 20 to 29 minutes (% change since 2000)
Travel time to work - 30 to 39 minutes (%)
Travel time to work - 30 to 39 minutes (% change since 2000)
Travel time to work - 40 to 59 minutes (%)
Travel time to work - 40 to 59 minutes (% change since 2000)
Travel time to work - 60 to 89 minutes (%)
Travel time to work - 60 to 89 minutes (% change since 2000)
Travel time to work - 90 or more minutes (%)
Travel time to work - 90 or more minutes (% change since 2000)
Marital status - Never married (%)
Marital status - Now married (%)
Marital status - Separated (%)
Marital status - Widowed (%)
Marital status - Divorced (%)
Median family income ($)
Median family income (% change since 2000)
Median non-family income ($)
Median non-family income (% change since 2000)
Median per capita income ($)
Median per capita income (% change since 2000)
Median family income ($) - White
Median family income ($) - Black or African American
Median family income ($) - Asian
Median family income ($) - Hispanic or Latino
Median family income ($) - American Indian and Alaska Native
Median family income ($) - Multirace
Median family income ($) - Other Race
Median year house/condo built
Median year apartment built
Year house built - Built 2005 or later (%)
Year house built - Built 2000 to 2004 (%)
Year house built - Built 1990 to 1999 (%)
Year house built - Built 1980 to 1989 (%)
Year house built - Built 1970 to 1979 (%)
Year house built - Built 1960 to 1969 (%)
Year house built - Built 1950 to 1959 (%)
Year house built - Built 1940 to 1949 (%)
Year house built - Built 1939 or earlier (%)
Average household size
Household density (households per square mile)
Average household size - White
Average household size - Black or African American
Average household size - Asian
Average household size - Hispanic or Latino
Average household size - American Indian and Alaska Native
Average household size - Multirace
Average household size - Other Race
Occupied housing units (%)
Vacant housing units (%)
Owner occupied housing units (%)
Renter occupied housing units (%)
Vacancy status - For rent (%)
Vacancy status - For sale only (%)
Vacancy status - Rented or sold, not occupied (%)
Vacancy status - For seasonal, recreational, or occasional use (%)
Vacancy status - For migrant workers (%)
Vacancy status - Other vacant (%)
Residents with income below the poverty level (%)
Residents with income below 50% of the poverty level (%)
Children below poverty level (%)
Poor families by family type - Married-couple family (%)
Poor families by family type - Male, no wife present (%)
Poor families by family type - Female, no husband present (%)
Poverty status for native-born residents (%)
Poverty status for foreign-born residents (%)
Poverty among high school graduates not in families (%)
Poverty among people who did not graduate high school not in families (%)
Residents with income below the poverty level (%) - White
Residents with income below the poverty level (%) - Black or African American
Residents with income below the poverty level (%) - Asian
Residents with income below the poverty level (%) - Hispanic or Latino
Residents with income below the poverty level (%) - American Indian and Alaska Native
Residents with income below the poverty level (%) - Multirace
Residents with income below the poverty level (%) - Other Race
Air pollution - Air Quality Index (AQI)
Air pollution - CO
Air pollution - NO2
Air pollution - SO2
Air pollution - Ozone
Air pollution - PM10
Air pollution - PM25
Air pollution - Pb
Crime - Murders per 100,000 population
Crime - Rapes per 100,000 population
Crime - Robberies per 100,000 population
Crime - Assaults per 100,000 population
Crime - Burglaries per 100,000 population
Crime - Thefts per 100,000 population
Crime - Auto thefts per 100,000 population
Crime - Arson per 100,000 population
Crime - City-data.com crime index
Crime - Violent crime index
Crime - Property crime index
Crime - Murders per 100,000 population (5 year average)
Crime - Rapes per 100,000 population (5 year average)
Crime - Robberies per 100,000 population (5 year average)
Crime - Assaults per 100,000 population (5 year average)
Crime - Burglaries per 100,000 population (5 year average)
Crime - Thefts per 100,000 population (5 year average)
Crime - Auto thefts per 100,000 population (5 year average)
Crime - Arson per 100,000 population (5 year average)
Crime - City-data.com crime index (5 year average)
Crime - Violent crime index (5 year average)
Crime - Property crime index (5 year average)
1996 Presidential Elections Results (%) - Democratic Party (Clinton)
1996 Presidential Elections Results (%) - Republican Party (Dole)
1996 Presidential Elections Results (%) - Other
2000 Presidential Elections Results (%) - Democratic Party (Gore)
2000 Presidential Elections Results (%) - Republican Party (Bush)
2000 Presidential Elections Results (%) - Other
2004 Presidential Elections Results (%) - Democratic Party (Kerry)
2004 Presidential Elections Results (%) - Republican Party (Bush)
2004 Presidential Elections Results (%) - Other
2008 Presidential Elections Results (%) - Democratic Party (Obama)
2008 Presidential Elections Results (%) - Republican Party (McCain)
2008 Presidential Elections Results (%) - Other
2012 Presidential Elections Results (%) - Democratic Party (Obama)
2012 Presidential Elections Results (%) - Republican Party (Romney)
2012 Presidential Elections Results (%) - Other
2016 Presidential Elections Results (%) - Democratic Party (Clinton)
2016 Presidential Elections Results (%) - Republican Party (Trump)
2016 Presidential Elections Results (%) - Other
2020 Presidential Elections Results (%) - Democratic Party (Biden)
2020 Presidential Elections Results (%) - Republican Party (Trump)
2020 Presidential Elections Results (%) - Other
Ancestries Reported - Arab (%)
Ancestries Reported - Czech (%)
Ancestries Reported - Danish (%)
Ancestries Reported - Dutch (%)
Ancestries Reported - English (%)
Ancestries Reported - French (%)
Ancestries Reported - French Canadian (%)
Ancestries Reported - German (%)
Ancestries Reported - Greek (%)
Ancestries Reported - Hungarian (%)
Ancestries Reported - Irish (%)
Ancestries Reported - Italian (%)
Ancestries Reported - Lithuanian (%)
Ancestries Reported - Norwegian (%)
Ancestries Reported - Polish (%)
Ancestries Reported - Portuguese (%)
Ancestries Reported - Russian (%)
Ancestries Reported - Scotch-Irish (%)
Ancestries Reported - Scottish (%)
Ancestries Reported - Slovak (%)
Ancestries Reported - Subsaharan African (%)
Ancestries Reported - Swedish (%)
Ancestries Reported - Swiss (%)
Ancestries Reported - Ukrainian (%)
Ancestries Reported - United States (%)
Ancestries Reported - Welsh (%)
Ancestries Reported - West Indian (%)
Ancestries Reported - Other (%)
Educational Attainment - No schooling completed (%)
Educational Attainment - Less than high school (%)
Educational Attainment - High school or equivalent (%)
Educational Attainment - Less than 1 year of college (%)
Educational Attainment - 1 or more years of college (%)
Educational Attainment - Associate degree (%)
Educational Attainment - Bachelor's degree (%)
Educational Attainment - Master's degree (%)
Educational Attainment - Professional school degree (%)
Educational Attainment - Doctorate degree (%)
School Enrollment - Nursery, preschool (%)
School Enrollment - Kindergarten (%)
School Enrollment - Grade 1 to 4 (%)
School Enrollment - Grade 5 to 8 (%)
School Enrollment - Grade 9 to 12 (%)
School Enrollment - College undergrad (%)
School Enrollment - Graduate or professional (%)
School Enrollment - Not enrolled in school (%)
School enrollment - Public schools (%)
School enrollment - Private schools (%)
School enrollment - Not enrolled (%)
Median number of rooms in houses and condos
Median number of rooms in apartments
Housing units lacking complete plumbing facilities (%)
Housing units lacking complete kitchen facilities (%)
Density of houses
Urban houses (%)
Rural houses (%)
Households with people 60 years and over (%)
Households with people 65 years and over (%)
Households with people 75 years and over (%)
Households with one or more nonrelatives (%)
Households with no nonrelatives (%)
Population in households (%)
Family households (%)
Nonfamily households (%)
Population in families (%)
Family households with own children (%)
Median number of bedrooms in owner occupied houses
Mean number of bedrooms in owner occupied houses
Median number of bedrooms in renter occupied houses
Mean number of bedrooms in renter occupied houses
Median number of vehichles in owner occupied houses
Mean number of vehichles in owner occupied houses
Median number of vehichles in renter occupied houses
Mean number of vehichles in renter occupied houses
Mortgage status - with mortgage (%)
Mortgage status - with second mortgage (%)
Mortgage status - with home equity loan (%)
Mortgage status - with both second mortgage and home equity loan (%)
Mortgage status - without a mortgage (%)
Average family size
Average family size - White
Average family size - Black or African American
Average family size - Asian
Average family size - Hispanic or Latino
Average family size - American Indian and Alaska Native
Average family size - Multirace
Average family size - Other Race
Geographical mobility - Same house 1 year ago (%)
Geographical mobility - Moved within same county (%)
Geographical mobility - Moved from different county within same state (%)
Geographical mobility - Moved from different state (%)
Geographical mobility - Moved from abroad (%)
Place of birth - Born in state of residence (%)
Place of birth - Born in other state (%)
Place of birth - Native, outside of US (%)
Place of birth - Foreign born (%)
Housing units in structures - 1, detached (%)
Housing units in structures - 1, attached (%)
Housing units in structures - 2 (%)
Housing units in structures - 3 or 4 (%)
Housing units in structures - 5 to 9 (%)
Housing units in structures - 10 to 19 (%)
Housing units in structures - 20 to 49 (%)
Housing units in structures - 50 or more (%)
Housing units in structures - Mobile home (%)
Housing units in structures - Boat, RV, van, etc. (%)
House/condo owner moved in on average (years ago)
Renter moved in on average (years ago)
Year householder moved into unit - Moved in 1999 to March 2000 (%)
Year householder moved into unit - Moved in 1995 to 1998 (%)
Year householder moved into unit - Moved in 1990 to 1994 (%)
Year householder moved into unit - Moved in 1980 to 1989 (%)
Year householder moved into unit - Moved in 1970 to 1979 (%)
Year householder moved into unit - Moved in 1969 or earlier (%)
Means of transportation to work - Drove car alone (%)
Means of transportation to work - Carpooled (%)
Means of transportation to work - Public transportation (%)
Means of transportation to work - Bus or trolley bus (%)
Means of transportation to work - Streetcar or trolley car (%)
Means of transportation to work - Subway or elevated (%)
Means of transportation to work - Railroad (%)
Means of transportation to work - Ferryboat (%)
Means of transportation to work - Taxicab (%)
Means of transportation to work - Motorcycle (%)
Means of transportation to work - Bicycle (%)
Means of transportation to work - Walked (%)
Means of transportation to work - Other means (%)
Working at home (%)
Industry diversity
Most Common Industries - Agriculture, forestry, fishing and hunting, and mining (%)
Most Common Industries - Agriculture, forestry, fishing and hunting (%)
Most Common Industries - Mining, quarrying, and oil and gas extraction (%)
Most Common Industries - Construction (%)
Most Common Industries - Manufacturing (%)
Most Common Industries - Wholesale trade (%)
Most Common Industries - Retail trade (%)
Most Common Industries - Transportation and warehousing, and utilities (%)
Most Common Industries - Transportation and warehousing (%)
Most Common Industries - Utilities (%)
Most Common Industries - Information (%)
Most Common Industries - Finance and insurance, and real estate and rental and leasing (%)
Most Common Industries - Finance and insurance (%)
Most Common Industries - Real estate and rental and leasing (%)
Most Common Industries - Professional, scientific, and management, and administrative and waste management services (%)
Most Common Industries - Professional, scientific, and technical services (%)
Most Common Industries - Management of companies and enterprises (%)
Most Common Industries - Administrative and support and waste management services (%)
Most Common Industries - Educational services, and health care and social assistance (%)
Most Common Industries - Educational services (%)
Most Common Industries - Health care and social assistance (%)
Most Common Industries - Arts, entertainment, and recreation, and accommodation and food services (%)
Most Common Industries - Arts, entertainment, and recreation (%)
Most Common Industries - Accommodation and food services (%)
Most Common Industries - Other services, except public administration (%)
Most Common Industries - Public administration (%)
Occupation diversity
Most Common Occupations - Management, business, science, and arts occupations (%)
Most Common Occupations - Management, business, and financial occupations (%)
Most Common Occupations - Management occupations (%)
Most Common Occupations - Business and financial operations occupations (%)
Most Common Occupations - Computer, engineering, and science occupations (%)
Most Common Occupations - Computer and mathematical occupations (%)
Most Common Occupations - Architecture and engineering occupations (%)
Most Common Occupations - Life, physical, and social science occupations (%)
Most Common Occupations - Education, legal, community service, arts, and media occupations (%)
Most Common Occupations - Community and social service occupations (%)
Most Common Occupations - Legal occupations (%)
Most Common Occupations - Education, training, and library occupations (%)
Most Common Occupations - Arts, design, entertainment, sports, and media occupations (%)
Most Common Occupations - Healthcare practitioners and technical occupations (%)
Most Common Occupations - Health diagnosing and treating practitioners and other technical occupations (%)
Most Common Occupations - Health technologists and technicians (%)
Most Common Occupations - Service occupations (%)
Most Common Occupations - Healthcare support occupations (%)
Most Common Occupations - Protective service occupations (%)
Most Common Occupations - Fire fighting and prevention, and other protective service workers including supervisors (%)
Most Common Occupations - Law enforcement workers including supervisors (%)
Most Common Occupations - Food preparation and serving related occupations (%)
Most Common Occupations - Building and grounds cleaning and maintenance occupations (%)
Most Common Occupations - Personal care and service occupations (%)
Most Common Occupations - Sales and office occupations (%)
Most Common Occupations - Sales and related occupations (%)
Most Common Occupations - Office and administrative support occupations (%)
Most Common Occupations - Natural resources, construction, and maintenance occupations (%)
Most Common Occupations - Farming, fishing, and forestry occupations (%)
Most Common Occupations - Construction and extraction occupations (%)
Most Common Occupations - Installation, maintenance, and repair occupations (%)
Most Common Occupations - Production, transportation, and material moving occupations (%)
Most Common Occupations - Production occupations (%)
Most Common Occupations - Transportation occupations (%)
Most Common Occupations - Material moving occupations (%)
People in Group quarters - Institutionalized population (%)
People in Group quarters - Correctional institutions (%)
People in Group quarters - Federal prisons and detention centers (%)
People in Group quarters - Halfway houses (%)
People in Group quarters - Local jails and other confinement facilities (including police lockups) (%)
People in Group quarters - Military disciplinary barracks (%)
People in Group quarters - State prisons (%)
People in Group quarters - Other types of correctional institutions (%)
People in Group quarters - Nursing homes (%)
People in Group quarters - Hospitals/wards, hospices, and schools for the handicapped (%)
People in Group quarters - Hospitals/wards and hospices for chronically ill (%)
People in Group quarters - Hospices or homes for chronically ill (%)
People in Group quarters - Military hospitals or wards for chronically ill (%)
People in Group quarters - Other hospitals or wards for chronically ill (%)
People in Group quarters - Hospitals or wards for drug/alcohol abuse (%)
People in Group quarters - Mental (Psychiatric) hospitals or wards (%)
People in Group quarters - Schools, hospitals, or wards for the mentally retarded (%)
People in Group quarters - Schools, hospitals, or wards for the physically handicapped (%)
People in Group quarters - Institutions for the deaf (%)
People in Group quarters - Institutions for the blind (%)
People in Group quarters - Orthopedic wards and institutions for the physically handicapped (%)
People in Group quarters - Wards in general hospitals for patients who have no usual home elsewhere (%)
People in Group quarters - Wards in military hospitals for patients who have no usual home elsewhere (%)
People in Group quarters - Juvenile institutions (%)
People in Group quarters - Long-term care (%)
People in Group quarters - Homes for abused, dependent, and neglected children (%)
People in Group quarters - Residential treatment centers for emotionally disturbed children (%)
People in Group quarters - Training schools for juvenile delinquents (%)
People in Group quarters - Short-term care, detention or diagnostic centers for delinquent children (%)
People in Group quarters - Type of juvenile institution unknown (%)
People in Group quarters - Noninstitutionalized population (%)
People in Group quarters - College dormitories (includes college quarters off campus) (%)
People in Group quarters - Military quarters (%)
People in Group quarters - On base (%)
People in Group quarters - Barracks, unaccompanied personnel housing (UPH), (Enlisted/Officer), ;and similar group living quarters for military personnel (%)
People in Group quarters - Transient quarters for temporary residents (%)
People in Group quarters - Military ships (%)
People in Group quarters - Group homes (%)
People in Group quarters - Homes or halfway houses for drug/alcohol abuse (%)
People in Group quarters - Homes for the mentally ill (%)
People in Group quarters - Homes for the mentally retarded (%)
People in Group quarters - Homes for the physically handicapped (%)
People in Group quarters - Other group homes (%)
People in Group quarters - Religious group quarters (%)
People in Group quarters - Dormitories (%)
People in Group quarters - Agriculture workers' dormitories on farms (%)
People in Group quarters - Job Corps and vocational training facilities (%)
People in Group quarters - Other workers' dormitories (%)
People in Group quarters - Crews of maritime vessels (%)
People in Group quarters - Other nonhousehold living situations (%)
People in Group quarters - Other noninstitutional group quarters (%)
Residents speaking English at home (%)
Residents speaking English at home - Born in the United States (%)
Residents speaking English at home - Native, born elsewhere (%)
Residents speaking English at home - Foreign born (%)
Residents speaking Spanish at home (%)
Residents speaking Spanish at home - Born in the United States (%)
Residents speaking Spanish at home - Native, born elsewhere (%)
Residents speaking Spanish at home - Foreign born (%)
Residents speaking other language at home (%)
Residents speaking other language at home - Born in the United States (%)
Residents speaking other language at home - Native, born elsewhere (%)
Residents speaking other language at home - Foreign born (%)
Class of Workers - Employee of private company (%)
Class of Workers - Self-employed in own incorporated business (%)
Class of Workers - Private not-for-profit wage and salary workers (%)
Class of Workers - Local government workers (%)
Class of Workers - State government workers (%)
Class of Workers - Federal government workers (%)
Class of Workers - Self-employed workers in own not incorporated business and Unpaid family workers (%)
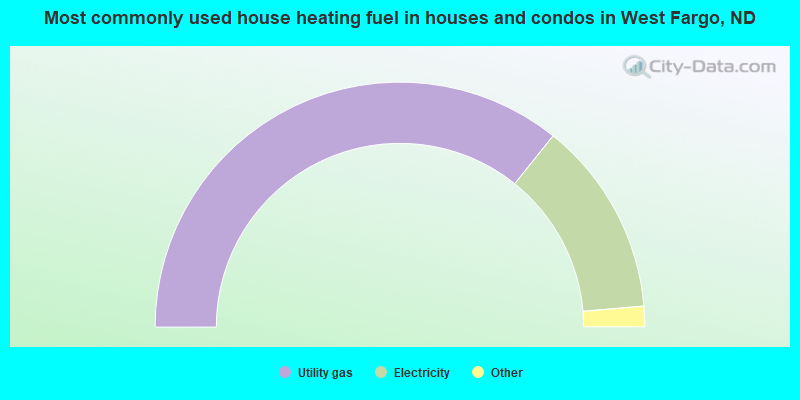
House heating fuel used in houses and condos - Utility gas (%)
House heating fuel used in houses and condos - Bottled, tank, or LP gas (%)
House heating fuel used in houses and condos - Electricity (%)
House heating fuel used in houses and condos - Fuel oil, kerosene, etc. (%)
House heating fuel used in houses and condos - Coal or coke (%)
House heating fuel used in houses and condos - Wood (%)
House heating fuel used in houses and condos - Solar energy (%)
House heating fuel used in houses and condos - Other fuel (%)
House heating fuel used in houses and condos - No fuel used (%)
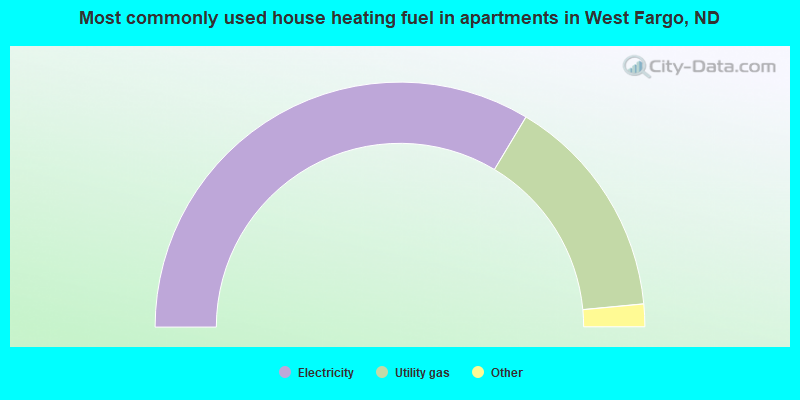
House heating fuel used in apartments - Utility gas (%)
House heating fuel used in apartments - Bottled, tank, or LP gas (%)
House heating fuel used in apartments - Electricity (%)
House heating fuel used in apartments - Fuel oil, kerosene, etc. (%)
House heating fuel used in apartments - Coal or coke (%)
House heating fuel used in apartments - Wood (%)
House heating fuel used in apartments - Solar energy (%)
House heating fuel used in apartments - Other fuel (%)
House heating fuel used in apartments - No fuel used (%)
Armed forces status - In Armed Forces (%)
Armed forces status - Civilian (%)
Armed forces status - Civilian - Veteran (%)
Armed forces status - Civilian - Nonveteran (%)
Fatal accidents locations in years 2005-2021
Fatal accidents locations in 2005
Fatal accidents locations in 2006
Fatal accidents locations in 2007
Fatal accidents locations in 2008
Fatal accidents locations in 2009
Fatal accidents locations in 2010
Fatal accidents locations in 2011
Fatal accidents locations in 2012
Fatal accidents locations in 2013
Fatal accidents locations in 2014
Fatal accidents locations in 2015
Fatal accidents locations in 2016
Fatal accidents locations in 2017
Fatal accidents locations in 2018
Fatal accidents locations in 2019
Fatal accidents locations in 2020
Fatal accidents locations in 2021
Alcohol use - People drinking some alcohol every month (%)
Alcohol use - People not drinking at all (%)
Alcohol use - Average days/month drinking alcohol
Alcohol use - Average drinks/week
Alcohol use - Average days/year people drink much
Audiometry - Average condition of hearing (%)
Audiometry - People that can hear a whisper from across a quiet room (%)
Audiometry - People that can hear normal voice from across a quiet room (%)
Audiometry - Ears ringing, roaring, buzzing (%)
Audiometry - Had a job exposure to loud noise (%)
Audiometry - Had off-work exposure to loud noise (%)
Blood Pressure & Cholesterol - Has high blood pressure (%)
Blood Pressure & Cholesterol - Checking blood pressure at home (%)
Blood Pressure & Cholesterol - Frequently checking blood cholesterol (%)
Blood Pressure & Cholesterol - Has high cholesterol level (%)
Consumer Behavior - Money monthly spent on food at supermarket/grocery store
Consumer Behavior - Money monthly spent on food at other stores
Consumer Behavior - Money monthly spent on eating out
Consumer Behavior - Money monthly spent on carryout/delivered foods
Consumer Behavior - Income spent on food at supermarket/grocery store (%)
Consumer Behavior - Income spent on food at other stores (%)
Consumer Behavior - Income spent on eating out (%)
Consumer Behavior - Income spent on carryout/delivered foods (%)
Current Health Status - General health condition (%)
Current Health Status - Blood donors (%)
Current Health Status - Has blood ever tested for HIV virus (%)
Current Health Status - Left-handed people (%)
Dermatology - People using sunscreen (%)
Diabetes - Diabetics (%)
Diabetes - Had a blood test for high blood sugar (%)
Diabetes - People taking insulin (%)
Diet Behavior & Nutrition - Diet health (%)
Diet Behavior & Nutrition - Milk product consumption (# of products/month)
Diet Behavior & Nutrition - Meals not home prepared (#/week)
Diet Behavior & Nutrition - Meals from fast food or pizza place (#/week)
Diet Behavior & Nutrition - Ready-to-eat foods (#/month)
Diet Behavior & Nutrition - Frozen meals/pizza (#/month)
Drug Use - People that ever used marijuana or hashish (%)
Drug Use - Ever used hard drugs (%)
Drug Use - Ever used any form of cocaine (%)
Drug Use - Ever used heroin (%)
Drug Use - Ever used methamphetamine (%)
Health Insurance - People covered by health insurance (%)
Kidney Conditions-Urology - Avg. # of times urinating at night
Medical Conditions - People with asthma (%)
Medical Conditions - People with anemia (%)
Medical Conditions - People with psoriasis (%)
Medical Conditions - People with overweight (%)
Medical Conditions - Elderly people having difficulties in thinking or remembering (%)
Medical Conditions - People who ever received blood transfusion (%)
Medical Conditions - People having trouble seeing even with glass/contacts (%)
Medical Conditions - People with arthritis (%)
Medical Conditions - People with gout (%)
Medical Conditions - People with congestive heart failure (%)
Medical Conditions - People with coronary heart disease (%)
Medical Conditions - People with angina pectoris (%)
Medical Conditions - People who ever had heart attack (%)
Medical Conditions - People who ever had stroke (%)
Medical Conditions - People with emphysema (%)
Medical Conditions - People with thyroid problem (%)
Medical Conditions - People with chronic bronchitis (%)
Medical Conditions - People with any liver condition (%)
Medical Conditions - People who ever had cancer or malignancy (%)
Mental Health - People who have little interest in doing things (%)
Mental Health - People feeling down, depressed, or hopeless (%)
Mental Health - People who have trouble sleeping or sleeping too much (%)
Mental Health - People feeling tired or having little energy (%)
Mental Health - People with poor appetite or overeating (%)
Mental Health - People feeling bad about themself (%)
Mental Health - People who have trouble concentrating on things (%)
Mental Health - People moving or speaking slowly or too fast (%)
Mental Health - People having thoughts they would be better off dead (%)
Oral Health - Average years since last visit a dentist
Oral Health - People embarrassed because of mouth (%)
Oral Health - People with gum disease (%)
Oral Health - General health of teeth and gums (%)
Oral Health - Average days a week using dental floss/device
Oral Health - Average days a week using mouthwash for dental problem
Oral Health - Average number of teeth
Pesticide Use - Households using pesticides to control insects (%)
Pesticide Use - Households using pesticides to kill weeds (%)
Physical Activity - People doing vigorous-intensity work activities (%)
Physical Activity - People doing moderate-intensity work activities (%)
Physical Activity - People walking or bicycling (%)
Physical Activity - People doing vigorous-intensity recreational activities (%)
Physical Activity - People doing moderate-intensity recreational activities (%)
Physical Activity - Average hours a day doing sedentary activities
Physical Activity - Average hours a day watching TV or videos
Physical Activity - Average hours a day using computer
Physical Functioning - People having limitations keeping them from working (%)
Physical Functioning - People limited in amount of work they can do (%)
Physical Functioning - People that need special equipment to walk (%)
Physical Functioning - People experiencing confusion/memory problems (%)
Physical Functioning - People requiring special healthcare equipment (%)
Prescription Medications - Average number of prescription medicines taking
Preventive Aspirin Use - Adults 40+ taking low-dose aspirin (%)
Reproductive Health - Vaginal deliveries (%)
Reproductive Health - Cesarean deliveries (%)
Reproductive Health - Deliveries resulted in a live birth (%)
Reproductive Health - Pregnancies resulted in a delivery (%)
Reproductive Health - Women breastfeeding newborns (%)
Reproductive Health - Women that had a hysterectomy (%)
Reproductive Health - Women that had both ovaries removed (%)
Reproductive Health - Women that have ever taken birth control pills (%)
Reproductive Health - Women taking birth control pills (%)
Reproductive Health - Women that have ever used Depo-Provera or injectables (%)
Reproductive Health - Women that have ever used female hormones (%)
Sexual Behavior - People 18+ that ever had sex (vaginal, anal, or oral) (%)
Sexual Behavior - Males 18+ that ever had vaginal sex with a woman (%)
Sexual Behavior - Males 18+ that ever performed oral sex on a woman (%)
Sexual Behavior - Males 18+ that ever had anal sex with a woman (%)
Sexual Behavior - Males 18+ that ever had any sex with a man (%)
Sexual Behavior - Females 18+ that ever had vaginal sex with a man (%)
Sexual Behavior - Females 18+ that ever performed oral sex on a man (%)
Sexual Behavior - Females 18+ that ever had anal sex with a man (%)
Sexual Behavior - Females 18+ that ever had any kind of sex with a woman (%)
Sexual Behavior - Average age people first had sex
Sexual Behavior - Average number of female sex partners in lifetime (males 18+)
Sexual Behavior - Average number of female vaginal sex partners in lifetime (males 18+)
Sexual Behavior - Average age people first performed oral sex on a woman (18+)
Sexual Behavior - Average number of woman performed oral sex on in lifetime (18+)
Sexual Behavior - Average number of male sex partners in lifetime (males 18+)
Sexual Behavior - Average number of male anal sex partners in lifetime (males 18+)
Sexual Behavior - Average age people first performed oral sex on a man (18+)
Sexual Behavior - Average number of male oral sex partners in lifetime (18+)
Sexual Behavior - People using protection when performing oral sex (%)
Sexual Behavior - Average number of times people have vaginal or anal sex a year
Sexual Behavior - People having sex without condom (%)
Sexual Behavior - Average number of male sex partners in lifetime (females 18+)
Sexual Behavior - Average number of male vaginal sex partners in lifetime (females 18+)
Sexual Behavior - Average number of female sex partners in lifetime (females 18+)
Sexual Behavior - Circumcised males 18+ (%)
Sleep Disorders - Average hours sleeping at night
Sleep Disorders - People that has trouble sleeping (%)
Smoking-Cigarette Use - People smoking cigarettes (%)
Taste & Smell - People 40+ having problems with smell (%)
Taste & Smell - People 40+ having problems with taste (%)
Taste & Smell - People 40+ that ever had wisdom teeth removed (%)
Taste & Smell - People 40+ that ever had tonsils teeth removed (%)
Taste & Smell - People 40+ that ever had a loss of consciousness because of a head injury (%)
Taste & Smell - People 40+ that ever had a broken nose or other serious injury to face or skull (%)
Taste & Smell - People 40+ that ever had two or more sinus infections (%)
Weight - Average height (inches)
Weight - Average weight (pounds)
Weight - Average BMI
Weight - People that are obese (%)
Weight - People that ever were obese (%)
Weight - People trying to lose weight (%)
According to our research of North Dakota and other state lists, there were 31 registered sex offenders living in West Fargo, North Dakota as of June 16, 2024 . The ratio of all residents to sex offenders in West Fargo is 1,048 to 1.The ratio of registered sex offenders to all residents in this city is much lower than the state average.
Officers per 1,000 residents here:
1.71North Dakota average:
2.46
Latest news from West Fargo, ND collected exclusively by city-data.com from local newspapers, TV, and radio stations
Ancestries: German (31.3%), Norwegian (20.5%), American (5.5%), Scandinavian (4.4%), European (3.3%), English (2.8%).
Current Local Time:
Land area: 7.29 square miles.
Population density: 5,484 people per square mile (average).
1,840 residents are foreign born (2.3% Asia , 1.3% Africa , 0.5% Europe ).
This city:
4.6%North Dakota:
4.6%
Median real estate property taxes paid for housing units with mortgages in 2022: $4,019 (1.3%)Median real estate property taxes paid for housing units with no mortgage in 2022: $3,421 (1.3%)
Nearest city with pop. 50,000+: Fargo, ND
Nearest city with pop. 200,000+: Minneapolis, MN
Nearest city with pop. 1,000,000+: Chicago, IL
Nearest cities:
Prairie Rose, ND (2.2 miles),
North River, ND (2.6 miles),
Latitude: 46.87 N, Longitude: 96.89 W
Daytime population change due to commuting: -7,165 (-17.9%)Workers who live and work in this city: 6,796 (28.6%)
Single-family new house construction building permits:
2022: 201 buildings , average cost: $397,9002021: 251 buildings , average cost: $374,5002020: 373 buildings , average cost: $281,2002019: 312 buildings , average cost: $239,5002018: 402 buildings , average cost: $235,3002017: 341 buildings , average cost: $196,7002016: 409 buildings , average cost: $226,8002015: 476 buildings , average cost: $221,9002014: 541 buildings , average cost: $207,3002013: 601 buildings , average cost: $181,3002012: 429 buildings , average cost: $205,2002011: 158 buildings , average cost: $203,6002010: 182 buildings , average cost: $153,6002009: 181 buildings , average cost: $165,1002008: 157 buildings , average cost: $188,0002007: 279 buildings , average cost: $130,6002006: 243 buildings , average cost: $132,3002005: 444 buildings , average cost: $115,7002004: 654 buildings , average cost: $113,3002003: 506 buildings , average cost: $116,2002002: 283 buildings , average cost: $114,3002001: 241 buildings , average cost: $112,6002000: 124 buildings , average cost: $104,1001999: 165 buildings , average cost: $109,1001998: 200 buildings , average cost: $95,0001997: 95 buildings , average cost: $100,900Unemployment in December 2023: Here:
1.4%North Dakota:
1.7%
Population change in the 1990s: +2,550 (+20.6%).
Most common occupations in West Fargo, ND (%)
Both Males Females
Other office and administrative support workers, including supervisors (5.3%)
Other management occupations, except farmers and farm managers (4.5%)
Driver/sales workers and truck drivers (4.1%)
Secretaries and administrative assistants (4.0%)
Other sales and related occupations, including supervisors (3.9%)
Material recording, scheduling, dispatching, and distributing workers (3.8%)
Sales representatives, services, wholesale and manufacturing (3.5%)
Driver/sales workers and truck drivers (7.5%)
Other management occupations, except farmers and farm managers (6.0%)
Material recording, scheduling, dispatching, and distributing workers (5.9%)
Electrical equipment mechanics and other installation, maintenance, and repair workers, including supervisors (4.9%)
Sales representatives, services, wholesale and manufacturing (4.9%)
Retail sales workers, except cashiers (4.3%)
Metal workers and plastic workers (4.3%)
Other office and administrative support workers, including supervisors (8.8%)
Secretaries and administrative assistants (7.2%)
Child care workers (5.9%)
Cashiers (4.9%)
Preschool, kindergarten, elementary, and middle school teachers (4.5%)
Other sales and related occupations, including supervisors (3.7%)
Information and record clerks, except customer service representatives (3.7%)
Air pollution and air quality trends(lower is better)
AQI PM10 PM2.5
Tornado activity:
West Fargo-area historical tornado activity is above North Dakota state average. It is 3% greater than the overall U.S. average.
On 6/20/1957, a category F5 (max. wind speeds 261-318 mph) tornado 21.6 miles away from the West Fargo city center killed 10 people and injured 103 people and caused between $5,000,000 and $50,000,000 in damages.
On 6/28/1975, a category F4 (max. wind speeds 207-260 mph) tornado 7.8 miles away from the city center caused between $50,000 and $500,000 in damages.
Earthquake activity:
West Fargo-area historical earthquake activity is significantly above North Dakota state average. It is 17% smaller than the overall U.S. average. On 7/9/1975 at 14:54:15, a magnitude 4.6 (4.6 MB, Class: Light, Intensity: IV - V) earthquake occurred 92.7 miles away from West Fargo center On 6/5/1993 at 01:24:53, a magnitude 4.1 (4.1 LG, Depth: 6.2 mi) earthquake occurred 87.7 miles away from West Fargo center On 8/18/1959 at 06:37:13, a magnitude 7.7 (7.7 UK, Class: Major, Intensity: VIII - XII) earthquake occurred 682.4 miles away from West Fargo center, causing $26,000,000 total damage On 3/4/1983 at 06:32:18, a magnitude 4.6 (4.4 MB, 4.6 LG, 4.4 ML) earthquake occurred 220.5 miles away from West Fargo center On 10/20/1995 at 15:57:18, a magnitude 3.7 (3.7 LG, Depth: 3.1 mi, Class: Light, Intensity: II - III) earthquake occurred 75.0 miles away from the city center On 10/25/1990 at 06:25:25, a magnitude 3.9 (3.6 MB, 3.9 LG, Depth: 3.1 mi) earthquake occurred 226.3 miles away from the city center Magnitude types: regional Lg-wave magnitude (LG), body-wave magnitude (MB), local magnitude (ML) Natural disasters: The number of natural disasters in Cass County (32) is a lot greater than the US average (15).Major Disasters (Presidential) Declared: 26Emergencies Declared: 4Floods: 27, Storms: 12, Snows: 4, Tornadoes: 2, Winter Storms: 2, Blizzard: 1, Hurricane: 1, Landslide: 1, Mudslide: 1, Other: 1 (Note: some incidents may be assigned to more than one category). Hospitals and medical centers in West Fargo: FRASER-631 (631 22ND ST E) FRASER-651 (651 12 1/2 AVE E) SHEYENNE CROSSINGS CARE CENTER/TCU (125 13TH AVENUE WEST)
Amtrak station near West Fargo: 6 miles: FARGO (420 4TH ST. N) Services: ticket office, fully wheelchair accessible, enclosed waiting area, public restrooms, public payphones, vending machines, free short-term parking, free long-term parking, call for car rental service, taxi stand.
Colleges/universities with over 2000 students nearest to West Fargo:
North Dakota State University-Main Campus (about 5 miles; Fargo, ND ; Full-time enrollment: 12,680)
Concordia College at Moorhead (about 7 miles; Moorhead, MN ; FT enrollment: 2,767)
Minnesota State University-Moorhead (about 7 miles; Moorhead, MN ; FT enrollment: 6,096)
North Dakota State College of Science (about 44 miles; Wahpeton, ND ; FT enrollment: 2,318)
Minnesota State Community and Technical College (about 56 miles; Fergus Falls, MN ; FT enrollment: 4,863)
University of North Dakota (about 74 miles; Grand Forks, ND ; FT enrollment: 12,858)
Northland Community and Technical College (about 94 miles; Thief River Falls, MN ; FT enrollment: 2,717)
Public high schools in West Fargo: WEST FARGO HIGH SCHOOL Students: 1,623, Location: 801 9TH ST E, Grades: 10-12)WEST FARGO SHEYENNE HIGH SCHOOL Location: 800 40TH AVE E, Grades: 9-11)
Public elementary/middle schools in West Fargo: CHENEY MIDDLE SCHOOL Students: 899, Location: 825 17TH AVE E, Grades: 6-8)WESTSIDE ELEMENTARY SCHOOL Students: 548, Location: 945 7TH AVE W, Grades: 1-5)SOUTH ELEMENTARY SCHOOL Students: 519, Location: 117 6TH AVE W, Grades: 1-5)EASTWOOD ELEMENTARY SCHOOL Students: 469, Location: 500 10TH AVE E, Grades: 1-5)L E BERGER ELEMENTARY SCHOOL Students: 425, Location: 631 4TH AVE E, Grades: 1-5)AURORA ELEMENTARY SCHOOL Location: 3420 9TH ST W, Grades: 1-5)
FREEDOM ELEMENTARY SCHOOL Location: 401 26TH AVE E, Grades: KG-5)
LIBERTY MIDDLE SCHOOL Location: 801 36TH AVE E, Grades: 6-8)
See full list of schools located in West Fargo Library in West Fargo: WEST FARGO PUBLIC LIBRARY Operating income: $585,410; Location: 109 THIRD STREET EAST; 49,623 books ; 3,272 audio materials ; 3,359 video materials ; 1 local licensed databases ; 7 state licensed databases ; 122 print serial subscriptions )
Notable location: (A) . Display/hide its location on the map
Park in West Fargo: (1) . Display/hide its location on the map
Tourist attractions:
Hotels:
Court:
Cass County has a predicted average indoor radon screening level greater than 4 pCi/L (pico curies per liter) - Highest Potential Drinking water stations with addresses in West Fargo and their reported violations in the past:
WEST FARGO CITY OF (Population served: 25,830, Groundwater):
Past health violations:
MCL, Monthly (TCR) - In MAY-2006, Contaminant: Coliform. Follow-up actions: St Public Notif requested (JUN-04-2006), St Violation/Reminder Notice (JUN-04-2006), St Public Notif received (JUN-20-2006)
Population served: 100, Groundwater):
Past monitoring violations:
One routine major monitoring violation
Population served: 70, Groundwater):
Past monitoring violations:
One routine major monitoring violation
Average household size: This city:
2.5 peopleNorth Dakota:
2.3 people
Percentage of family households: This city:
65.9%Whole state:
60.8%
Percentage of households with unmarried partners: This city:
7.4%Whole state:
6.4%
Likely homosexual households (counted as self-reported same-sex unmarried-partner households)
Lesbian couples: 0.2% of all households Gay men: 0.1% of all households
51 people in group homes intended for adults in 2010
Banks with branches in West Fargo (2011 data):
Alerus Financial, National Association: Eagle Run Branch, West Fargo Branch, West Fargo Branch. Info updated 2012/02/24: Bank assets: $1,154.4 mil, Deposits: $988.9 mil, headquarters in Grand Forks, ND, positive income , Commercial Lending Specialization, 16 total offices , Holding Company: Alerus Financial Corporation
Western State Bank: West Fargo Branch at 755 13th Avenue East, branch established on 1999/01/06. Info updated 2009/04/02: Bank assets: $488.8 mil, Deposits: $427.5 mil, headquarters in Devils Lake, ND, positive income , Commercial Lending Specialization, 9 total offices , Holding Company: Western State Agency, Inc., Employee Stock Ownership Plan And Trust
First International Bank & Trust: West Fargo Branch at 1350 13th Avenue East, branch established on 2000/05/10. Info updated 2008/06/03: Bank assets: $1,088.7 mil, Deposits: $962.1 mil, headquarters in Watford City, ND, positive income , Commercial Lending Specialization, 21 total offices , Holding Company: Watford City Bancshares, Inc.
Choice Financial Group: First Capital Bank Of North Dakota B at 210 Sheyenne Street, branch established on 1902/01/01. Info updated 2006/11/03: Bank assets: $593.8 mil, Deposits: $513.0 mil, headquarters in Grafton, ND, positive income , Agricultural Specialization, 9 total offices , Holding Company: Choice Financial Holdings, Inc.
Gate City Bank: West Fargo Branch at 1119 9th Street East, branch established on 2001/01/15. Info updated 2011/07/21: Bank assets: $1,403.0 mil, Deposits: $1,231.5 mil, headquarters in Fargo, ND, positive income , Consumer Lending Specialization, 32 total offices
State Bank & Trust: West Fargo Branch at 412 Sheyenne Street, branch established on 1964/03/02. Info updated 2006/11/03: Bank assets: $2,226.6 mil, Deposits: $1,916.5 mil, headquarters in Fargo, ND, positive income , Commercial Lending Specialization, 16 total offices , Holding Company: State Bankshares, Inc.
Wells Fargo Bank, National Association: West Fargo Branch at 1401 13th Ave E, branch established on 2002/12/04. Info updated 2011/04/05: Bank assets: $1,161,490.0 mil, Deposits: $905,653.0 mil, headquarters in Sioux Falls, SD, positive income , 6395 total offices , Holding Company: Wells Fargo & Company
For population 15 years and over in West Fargo:
Never married: 33.0%Now married: 54.4%Separated: 0.1%Widowed: 3.6%Divorced: 8.9% For population 25 years and over in West Fargo:
High school or higher: 97.2%Bachelor's degree or higher: 44.7%Graduate or professional degree: 14.2%Unemployed: 3.4%Mean travel time to work (commute): 15.9 minutes
Education Gini index (Inequality in education) Here:
8.8North Dakota average:
10.0
Religion statistics for West Fargo, ND (based on Cass County data)
Religion Adherents Congregations Mainline Protestant 46,444 71 Catholic 26,438 14 Evangelical Protestant 14,318 44 Other 1,805 10 Orthodox 50 1 None 60,723 -
Source: Clifford Grammich, Kirk Hadaway, Richard Houseal, Dale E.Jones, Alexei Krindatch, Richie Stanley and Richard H.Taylor. 2012. 2010 U.S.Religion Census: Religious Congregations & Membership Study. Association of Statisticians of American Religious Bodies. Jones, Dale E., et al. 2002. Congregations and Membership in the United States 2000. Nashville, TN: Glenmary Research Center. Graphs represent county-level data
Food Environment Statistics: Number of grocery stores : 19Cass County :
1.38 / 10,000 pop.State :
3.23 / 10,000 pop.
Number of supercenters and club stores : 1Cass County :
0.07 / 10,000 pop.North Dakota :
0.14 / 10,000 pop.
Number of convenience stores (with gas) : 50Cass County :
3.64 / 10,000 pop.North Dakota :
4.89 / 10,000 pop.
Number of full-service restaurants : 98Cass County :
7.14 / 10,000 pop.North Dakota :
8.90 / 10,000 pop.
Adult diabetes rate : This county :
6.3%North Dakota :
7.6%
Adult obesity rate : Cass County :
26.0%State :
27.6%
Low-income preschool obesity rate : Health and Nutrition: Healthy diet rate : West Fargo:
47.2%North Dakota:
50.7%
Average overall health of teeth and gums : Here:
43.1%North Dakota:
48.2%
Average BMI : West Fargo:
28.8North Dakota:
28.6
People feeling badly about themselves : West Fargo:
22.2%North Dakota:
21.0%
People not drinking alcohol at all : West Fargo:
10.0%State:
10.5%
Average hours sleeping at night : This city:
6.7North Dakota:
6.9
Overweight people : Here:
33.9%North Dakota:
34.2%
General health condition : West Fargo:
55.2%State:
57.5%
Average condition of hearing : West Fargo:
79.0%North Dakota:
78.3%
More about Health and Nutrition of West Fargo, ND Residents
Local government employment and payroll (March 2022)
Function
Full-time employees
Monthly full-time payroll
Average yearly full-time wage
Part-time employees
Monthly part-time payroll
Police Protection - Officers
62 $436,102 $84,407 0 $0 Other and Unallocable
25 $129,471 $62,146 0 $0 Streets and Highways
24 $137,811 $68,906 0 $0 Solid Waste Management
21 $88,377 $50,501 0 $0 Financial Administration
17 $110,112 $77,726 0 $0 Sewerage
15 $75,048 $60,038 0 $0 Firefighters
15 $92,749 $74,199 30 $7,408 Police - Other
13 $59,447 $54,874 3 $1,239 Other Government Administration
11 $80,595 $87,922 0 $0 Local Libraries
9 $47,496 $63,328 12 $10,438 Fire - Other
9 $65,049 $86,732 0 $0 Water Supply
9 $46,179 $61,572 0 $0 Judicial and Legal
3 $12,981 $51,924 0 $0 Natural Resources
3 $16,682 $66,728 0 $0
Totals for Government
236 $1,398,100 $71,090 45 $19,085
West Fargo government finances - Expenditure in 2021 (per resident):
Construction - Regular Highways: $39,681,000 ($992.40)
Air Transportation: $85,000 ($2.13)Solid Waste Management: $18,000 ($0.45)Current Operations - Police Protection: $8,363,000 ($209.15)
Water Utilities: $6,355,000 ($158.93)General - Other: $5,465,000 ($136.68)Local Fire Protection: $4,171,000 ($104.31)Solid Waste Management: $4,013,000 ($100.36)Regular Highways: $3,293,000 ($82.36)Sewerage: $2,741,000 ($68.55)Central Staff Services: $2,244,000 ($56.12)Financial Administration: $1,405,000 ($35.14)Libraries: $1,318,000 ($32.96)Protective Inspection and Regulation - Other: $1,000,000 ($25.01)Judicial and Legal Services: $605,000 ($15.13)Parks and Recreation: $467,000 ($11.68)General Public Buildings: $419,000 ($10.48)Air Transportation: $218,000 ($5.45)General - Interest on Debt: $11,530,000 ($288.36)
Other Capital Outlay - General - Other: $674,000 ($16.86)
Solid Waste Management: $559,000 ($13.98)Water Utilities: $74,000 ($1.85)Sewerage: $32,000 ($0.80)Water Utilities - Interest on Debt: $369,000 ($9.23)
West Fargo government finances - Revenue in 2021 (per resident):
Charges - Solid Waste Management: $4,880,000 ($122.05)
Sewerage: $3,047,000 ($76.20)Parks and Recreation: $102,000 ($2.55)Other: $95,000 ($2.38)Miscellaneous - Special Assessments: $40,254,000 ($1006.73)
General Revenue - Other: $2,168,000 ($54.22)Interest Earnings: $1,175,000 ($29.39)Fines and Forfeits: $400,000 ($10.00)Revenue - Water Utilities: $8,038,000 ($201.03)
State Intergovernmental - Highways: $5,483,000 ($137.13)
Health and Hospitals: $4,843,000 ($121.12)General Local Government Support: $1,681,000 ($42.04)Other: $916,000 ($22.91)Tax - Property: $15,855,000 ($396.52)
General Sales and Gross Receipts: $12,215,000 ($305.49)Other License: $3,262,000 ($81.58)Public Utilities Sales: $1,070,000 ($26.76)Occupation and Business License - Other: $277,000 ($6.93)Alcoholic Beverage License: $95,000 ($2.38)Other: $68,000 ($1.70)
West Fargo government finances - Debt in 2021 (per resident):
Long Term Debt - Beginning Outstanding - Unspecified Public Purpose: $374,710,000 ($9371.26)
Outstanding Unspecified Public Purpose: $352,485,000 ($8815.43)Retired Unspecified Public Purpose: $107,301,000 ($2683.53)Issue, Unspecified Public Purpose: $85,075,000 ($2127.67)Beginning Outstanding - Public Debt for Private Purpose: $705,000 ($17.63)Outstanding Nonguaranteed - Industrial Revenue: $660,000 ($16.51)Retired Nonguaranteed - Public Debt for Private Purpose: $45,000 ($1.13)
West Fargo government finances - Cash and Securities in 2021 (per resident):
Bond Funds - Cash and Securities: $1,755,000 ($43.89)
Other Funds - Cash and Securities: $52,388,000 ($1310.19)
Sinking Funds - Cash and Securities: $62,811,000 ($1570.86)
Businesses in West Fargo, ND
Name Count Name Count
Ace Hardware 1 MasterBrand Cabinets 1 Ashley Furniture 1 Maurices 1 Caribou Coffee 1 McDonald's 1 Catherines 1 Menards 1 Dairy Queen 1 Nike 1 Days Inn 1 Old Navy 1 Domino's Pizza 1 PetSmart 1 DressBarn 1 Ruby Tuesday 1 Dressbarn 1 Slumberland 1 Famous Footwear 1 Subway 2 FedEx 1 Super 8 1 KFC 1 U-Haul 1 La-Z-Boy 1 UPS 2 Lane Furniture 1
Strongest AM radio stations in West Fargo:
WDAY (970 AM; 5 kW; FARGO, ND; Owner: FORUM COMMUNICATIONS COMPANY)
KFNW (1200 AM; 10 kW; WEST FARGO, ND; Owner: NORTHWESTERN COLLEGE)
KVOX (1280 AM; 5 kW; MOORHEAD, MN; Owner: CAPSTAR TX LIMITED PARTNERSHIP)
KFGO (790 AM; 5 kW; FARGO, ND; Owner: CAPSTAR TX LIMITED PARTNERSHIP)
KQWB (1660 AM; 10 kW; WEST FARGO, ND; Owner: MONTEREY LICENSES, LLC)
WWNL (1080 AM; 50 kW; PITTSBURGH, PA; Owner: STEEL CITY RADIO, INC.)
KPRM (870 AM; 25 kW; PARK RAPIDS, MN; Owner: DE LA HUNT BROADCASTING CORP.)
KBRF (1250 AM; 10 kW; FERGUS FALLS, MN; Owner: RESULT RADIO, INC.)
KXMR (710 AM; 50 kW; BISMARCK, ND; Owner: RADIO BISMARCK MANDAN, LLC)
WEBC (560 AM; 50 kW; DULUTH, MN)
WCCO (830 AM; 50 kW; MINNEAPOLIS, MN; Owner: INFINITY MEDIA CORPORATION)
KSJB (600 AM; 5 kW; JAMESTOWN, ND; Owner: CHESTERMAN COMM. JAMESTOWN, INC.)
WCTS (1030 AM; 50 kW; MAPLEWOOD, MN; Owner: CNTL. BAPT. THEO/AL SEMI MINNEAPOLIS)
Strongest FM radio stations in West Fargo:
KVOX-FM (99.9 FM; MOORHEAD, MN; Owner: MONTEREY LICENSES, LLC)
WDAY-FM (93.7 FM; FARGO, ND; Owner: CAPSTAR TX LIMITED PARTNERSHIP)
KFNW-FM (97.9 FM; FARGO, ND; Owner: NORTHWESTERN COLLEGE)
KKBX (101.9 FM; FARGO, ND; Owner: CAPSTAR TX LIMITED PARTNERSHIP)
KDSU (91.9 FM; FARGO, ND; Owner: NORTH DAKOTA STATE UNIVERSITY)
KPFX (107.9 FM; FARGO, ND; Owner: MONTEREY LICENSES, LLC)
KFBN (88.7 FM; FARGO, ND; Owner: FARGO BAPTIST CHURCH)
KFAB-FM (92.7 FM; KINDRED, ND; Owner: CAPSTAR TX LIMITED PARTNERSHIP)
KCCM-FM (91.1 FM; MOORHEAD, MN; Owner: MINNESOTA PUBLIC RADIO)
KQWB-FM (98.7 FM; MOORHEAD, MN; Owner: MONTEREY LICENSES, LLC)
KCCD (90.3 FM; MOORHEAD, MN; Owner: MINNESOTA PUBLIC RADIO)
KDAM (104.7 FM; HOPE, ND; Owner: CLEAR CHANNEL BROADCASTING LICENSES, INC.)
KLTA (105.1 FM; BRECKENRIDGE, MN; Owner: MONTEREY LICENSES, LLC)
KEGK (106.9 FM; WAHPETON, ND; Owner: GUDERIAN BROADCASTING, INC.)
KDJZ (100.7 FM; HARWOOD, ND; Owner: TOM INGSTAD NORTH DAKOTA BROADCASTING LLC)
KVMI (103.9 FM; ARTHUR, ND; Owner: VISION MEDIA INCORPORATED)
TV broadcast stations around West Fargo:
KVRR (Channel 15; FARGO, ND; Owner: RED RIVER BROADCAST CO., LLC)
KVNJ-LP (Channel 2; FARGO, ND; Owner: G.I.G., INC.)
WDAY-TV (Channel 6; FARGO, ND; Owner: FORUM COMMUNICATIONS COMPANY)
KFME (Channel 13; FARGO, ND; Owner: PRAIRIE PUBLIC BROADCASTING, INC.)
KXJB-TV (Channel 4; VALLEY CITY, ND; Owner: CATAMOUNT BROADCASTING OF FARGO LLC)
K56ET (Channel 56; FARGO, ND; Owner: TRINITY BROADCASTING NETWORK)
KVLY-TV (Channel 11; FARGO, ND; Owner: NORTH DAKOTA TELEVISION LICENSE SUB, L.L.C.)
National Bridge Inventory (NBI) Statistics 41 Number of bridges410ft / 125m Total length $919,000 Total costs257,180 Total average daily traffic23,594 Total average daily truck traffic
New bridges - historical statistics
2 1930-1939 3 1940-1949 2 1950-1959 3 1960-1969 1 1970-1979 1 1980-1989 11 1990-1999 11 2000-2009 7 2010-2019
See full National Bridge Inventory statistics for West Fargo, ND
Home Mortgage Disclosure Act Aggregated Statistics For Year 2009(Based on 1 full and 4 partial tracts) A) FHA, FSA/RHS & VA B) Conventional C) Refinancings D) Home Improvement Loans E) Loans on Dwellings For 5+ Families F) Non-occupant Loans on G) Loans On Manufactured Number Average Value Number Average Value Number Average Value Number Average Value Number Average Value Number Average Value Number Average Value
LOANS ORIGINATED 156 $137,541 165 $157,796 484 $136,506 58 $41,123 9 $2,061,922 24 $217,820 6 $29,572 APPLICATIONS APPROVED, NOT ACCEPTED 2 $93,955 4 $84,442 31 $144,838 2 $38,490 0 $0 1 $76,260 2 $39,115 APPLICATIONS DENIED 8 $113,112 9 $96,396 86 $162,724 11 $14,820 0 $0 2 $235,795 7 $24,673 APPLICATIONS WITHDRAWN 7 $126,246 14 $162,076 101 $155,347 5 $93,408 1 $262,250 2 $264,535 0 $0 FILES CLOSED FOR INCOMPLETENESS 0 $0 1 $226,310 18 $155,024 2 $27,825 0 $0 0 $0 0 $0
Aggregated Statistics For Year 2008(Based on 1 full and 4 partial tracts) A) FHA, FSA/RHS & VA B) Conventional C) Refinancings D) Home Improvement Loans E) Loans on Dwellings For 5+ Families F) Non-occupant Loans on G) Loans On Manufactured Number Average Value Number Average Value Number Average Value Number Average Value Number Average Value Number Average Value Number Average Value
LOANS ORIGINATED 118 $140,500 180 $137,515 270 $118,249 81 $32,474 7 $1,629,727 23 $100,079 6 $50,518 APPLICATIONS APPROVED, NOT ACCEPTED 3 $118,677 13 $98,876 48 $125,834 6 $31,753 0 $0 1 $50,580 3 $49,260 APPLICATIONS DENIED 4 $141,595 18 $64,508 82 $119,359 15 $37,635 0 $0 1 $243,980 14 $49,394 APPLICATIONS WITHDRAWN 5 $152,718 11 $160,355 47 $166,239 6 $27,190 0 $0 1 $139,000 1 $49,420 FILES CLOSED FOR INCOMPLETENESS 1 $113,950 2 $133,595 14 $165,841 4 $35,245 0 $0 0 $0 1 $87,420
Aggregated Statistics For Year 2007(Based on 1 full and 4 partial tracts) A) FHA, FSA/RHS & VA B) Conventional C) Refinancings D) Home Improvement Loans E) Loans on Dwellings For 5+ Families F) Non-occupant Loans on G) Loans On Manufactured Number Average Value Number Average Value Number Average Value Number Average Value Number Average Value Number Average Value Number Average Value
LOANS ORIGINATED 95 $128,918 325 $120,345 219 $101,960 97 $30,919 5 $1,549,346 34 $111,156 8 $34,494 APPLICATIONS APPROVED, NOT ACCEPTED 0 $0 17 $109,762 56 $83,322 8 $26,420 0 $0 4 $69,322 3 $48,607 APPLICATIONS DENIED 0 $0 26 $101,784 104 $114,085 29 $38,229 0 $0 9 $79,494 7 $33,420 APPLICATIONS WITHDRAWN 4 $113,930 21 $134,587 57 $165,092 5 $26,460 0 $0 8 $171,614 0 $0 FILES CLOSED FOR INCOMPLETENESS 0 $0 3 $96,913 28 $159,360 1 $90,540 0 $0 0 $0 0 $0
Aggregated Statistics For Year 2006(Based on 1 full and 4 partial tracts) A) FHA, FSA/RHS & VA B) Conventional C) Refinancings D) Home Improvement Loans E) Loans on Dwellings For 5+ Families F) Non-occupant Loans on G) Loans On Manufactured Number Average Value Number Average Value Number Average Value Number Average Value Number Average Value Number Average Value Number Average Value
LOANS ORIGINATED 105 $128,977 401 $123,546 258 $94,283 106 $26,960 5 $597,652 42 $87,684 3 $27,213 APPLICATIONS APPROVED, NOT ACCEPTED 1 $125,500 27 $98,600 47 $81,945 10 $41,109 0 $0 2 $75,210 0 $0 APPLICATIONS DENIED 2 $138,175 43 $90,027 120 $124,877 40 $28,529 0 $0 3 $91,800 6 $21,873 APPLICATIONS WITHDRAWN 3 $110,820 34 $132,941 81 $137,251 18 $43,444 0 $0 3 $72,807 0 $0 FILES CLOSED FOR INCOMPLETENESS 1 $150,000 8 $82,388 33 $122,106 6 $41,633 0 $0 2 $70,095 0 $0
Aggregated Statistics For Year 2005(Based on 1 full and 4 partial tracts) A) FHA, FSA/RHS & VA B) Conventional C) Refinancings D) Home Improvement Loans E) Loans on Dwellings For 5+ Families F) Non-occupant Loans on G) Loans On Manufactured Number Average Value Number Average Value Number Average Value Number Average Value Number Average Value Number Average Value Number Average Value
LOANS ORIGINATED 126 $125,992 545 $122,053 357 $102,336 96 $33,667 5 $991,274 51 $127,266 5 $29,484 APPLICATIONS APPROVED, NOT ACCEPTED 3 $123,977 44 $99,788 57 $89,929 5 $30,256 0 $0 4 $117,415 4 $46,500 APPLICATIONS DENIED 3 $124,797 41 $104,533 125 $116,961 35 $28,961 0 $0 6 $113,288 11 $30,000 APPLICATIONS WITHDRAWN 7 $129,271 54 $138,189 89 $110,401 14 $26,707 0 $0 9 $152,670 0 $0 FILES CLOSED FOR INCOMPLETENESS 0 $0 7 $75,974 32 $120,846 1 $216,990 0 $0 0 $0 0 $0
Aggregated Statistics For Year 2004(Based on 1 full and 4 partial tracts) A) FHA, FSA/RHS & VA B) Conventional C) Refinancings D) Home Improvement Loans E) Loans on Dwellings For 5+ Families F) Non-occupant Loans on G) Loans On Manufactured Number Average Value Number Average Value Number Average Value Number Average Value Number Average Value Number Average Value Number Average Value
LOANS ORIGINATED 126 $115,273 486 $111,996 389 $105,645 88 $26,337 7 $376,129 43 $83,044 6 $31,650 APPLICATIONS APPROVED, NOT ACCEPTED 2 $129,135 26 $105,267 59 $91,772 16 $36,561 0 $0 2 $118,485 2 $50,975 APPLICATIONS DENIED 9 $111,648 27 $102,968 112 $82,594 33 $42,460 0 $0 6 $79,877 10 $30,180 APPLICATIONS WITHDRAWN 11 $113,119 36 $131,292 60 $99,625 7 $31,876 0 $0 8 $84,725 0 $0 FILES CLOSED FOR INCOMPLETENESS 1 $136,010 6 $109,733 44 $116,422 3 $19,870 0 $0 0 $0 1 $24,150
Aggregated Statistics For Year 2003(Based on 1 full and 4 partial tracts) A) FHA, FSA/RHS & VA B) Conventional C) Refinancings D) Home Improvement Loans E) Loans on Dwellings For 5+ Families F) Non-occupant Loans on Number Average Value Number Average Value Number Average Value Number Average Value Number Average Value Number Average Value
LOANS ORIGINATED 129 $110,880 474 $113,412 861 $95,968 41 $25,364 9 $420,718 43 $87,378 APPLICATIONS APPROVED, NOT ACCEPTED 1 $76,180 9 $79,496 52 $92,850 5 $16,804 0 $0 1 $70,940 APPLICATIONS DENIED 14 $107,014 23 $68,538 135 $87,664 17 $21,675 0 $0 4 $86,825 APPLICATIONS WITHDRAWN 5 $117,418 30 $113,949 86 $102,017 3 $26,847 0 $0 4 $75,080 FILES CLOSED FOR INCOMPLETENESS 1 $88,650 2 $143,925 14 $99,934 1 $107,790 0 $0 0 $0
Aggregated Statistics For Year 2002(Based on 1 partial tract) A) FHA, FSA/RHS & VA B) Conventional C) Refinancings D) Home Improvement Loans F) Non-occupant Loans on Number Average Value Number Average Value Number Average Value Number Average Value Number Average Value
LOANS ORIGINATED 19 $96,311 33 $71,132 77 $83,002 8 $11,251 4 $59,970 APPLICATIONS APPROVED, NOT ACCEPTED 0 $0 1 $105,090 4 $75,490 1 $58,970 0 $0 APPLICATIONS DENIED 2 $69,615 2 $72,720 17 $77,282 4 $18,180 1 $35,030 APPLICATIONS WITHDRAWN 1 $89,570 2 $106,195 6 $88,607 0 $0 0 $0 FILES CLOSED FOR INCOMPLETENESS 0 $0 1 $89,120 3 $95,627 0 $0 0 $0
Aggregated Statistics For Year 2001(Based on 1 partial tract) A) FHA, FSA/RHS & VA B) Conventional C) Refinancings D) Home Improvement Loans F) Non-occupant Loans on Number Average Value Number Average Value Number Average Value Number Average Value Number Average Value
LOANS ORIGINATED 28 $92,053 31 $84,303 55 $75,999 9 $14,288 3 $67,693 APPLICATIONS APPROVED, NOT ACCEPTED 0 $0 0 $0 2 $50,990 1 $7,540 0 $0 APPLICATIONS DENIED 1 $81,590 2 $76,265 15 $51,346 4 $10,198 0 $0 APPLICATIONS WITHDRAWN 0 $0 4 $78,815 11 $68,807 1 $28,820 0 $0 FILES CLOSED FOR INCOMPLETENESS 0 $0 0 $0 1 $44,780 0 $0 0 $0
Aggregated Statistics For Year 2000(Based on 1 partial tract) A) FHA, FSA/RHS & VA B) Conventional C) Refinancings D) Home Improvement Loans F) Non-occupant Loans on Number Average Value Number Average Value Number Average Value Number Average Value Number Average Value
LOANS ORIGINATED 26 $88,561 28 $79,907 15 $65,771 10 $21,549 2 $31,260 APPLICATIONS APPROVED, NOT ACCEPTED 0 $0 3 $51,433 1 $73,160 1 $17,740 0 $0 APPLICATIONS DENIED 0 $0 8 $47,056 10 $45,404 4 $16,073 0 $0 APPLICATIONS WITHDRAWN 2 $84,025 2 $90,010 2 $64,960 0 $0 0 $0 FILES CLOSED FOR INCOMPLETENESS 0 $0 0 $0 0 $0 0 $0 0 $0
Aggregated Statistics For Year 1999(Based on 1 full and 2 partial tracts) A) FHA, FSA/RHS & VA B) Conventional C) Refinancings D) Home Improvement Loans E) Loans on Dwellings For 5+ Families F) Non-occupant Loans on Number Average Value Number Average Value Number Average Value Number Average Value Number Average Value Number Average Value
LOANS ORIGINATED 91 $84,359 152 $89,276 112 $64,858 34 $14,657 4 $678,840 11 $71,032 APPLICATIONS APPROVED, NOT ACCEPTED 1 $52,810 9 $42,966 9 $39,532 0 $0 0 $0 1 $38,110 APPLICATIONS DENIED 4 $103,260 40 $33,951 34 $57,520 16 $19,459 0 $0 3 $34,190 APPLICATIONS WITHDRAWN 6 $81,347 10 $109,838 19 $72,495 3 $39,273 0 $0 2 $62,205 FILES CLOSED FOR INCOMPLETENESS 0 $0 0 $0 5 $73,362 0 $0 0 $0 0 $0
Detailed HMDA statistics for the following Tracts:
0101.04
, 0101.05 , 0102.01 , 0102.03 , 0102.04
Private Mortgage Insurance Companies Aggregated Statistics For Year 2009(Based on 1 full and 3 partial tracts) A) Conventional B) Refinancings Number Average Value Number Average Value
LOANS ORIGINATED 24 $186,608 28 $151,038 APPLICATIONS APPROVED, NOT ACCEPTED 2 $110,900 2 $99,240 APPLICATIONS DENIED 1 $122,680 0 $0 APPLICATIONS WITHDRAWN 0 $0 0 $0 FILES CLOSED FOR INCOMPLETENESS 0 $0 0 $0
Aggregated Statistics For Year 2008(Based on 1 full and 3 partial tracts) A) Conventional B) Refinancings C) Non-occupant Loans on Number Average Value Number Average Value Number Average Value
LOANS ORIGINATED 50 $139,908 26 $152,787 2 $86,925 APPLICATIONS APPROVED, NOT ACCEPTED 9 $107,456 11 $176,399 4 $156,490 APPLICATIONS DENIED 2 $101,500 2 $72,790 1 $50,580 APPLICATIONS WITHDRAWN 4 $110,362 0 $0 0 $0 FILES CLOSED FOR INCOMPLETENESS 0 $0 0 $0 0 $0
Aggregated Statistics For Year 2007(Based on 1 full and 4 partial tracts) A) Conventional B) Refinancings C) Non-occupant Loans on Number Average Value Number Average Value Number Average Value
LOANS ORIGINATED 75 $137,040 23 $138,348 7 $135,227 APPLICATIONS APPROVED, NOT ACCEPTED 6 $177,032 4 $182,505 0 $0 APPLICATIONS DENIED 4 $123,732 0 $0 4 $101,098 APPLICATIONS WITHDRAWN 2 $157,730 3 $157,743 0 $0 FILES CLOSED FOR INCOMPLETENESS 0 $0 0 $0 0 $0
Aggregated Statistics For Year 2006(Based on 1 full and 3 partial tracts) A) Conventional B) Refinancings C) Non-occupant Loans on Number Average Value Number Average Value Number Average Value
LOANS ORIGINATED 54 $143,857 10 $135,326 1 $51,200 APPLICATIONS APPROVED, NOT ACCEPTED 9 $120,326 7 $279,254 1 $77,000 APPLICATIONS DENIED 0 $0 0 $0 0 $0 APPLICATIONS WITHDRAWN 3 $122,503 0 $0 0 $0 FILES CLOSED FOR INCOMPLETENESS 0 $0 0 $0 0 $0
Aggregated Statistics For Year 2005(Based on 1 full and 4 partial tracts) A) Conventional B) Refinancings C) Non-occupant Loans on Number Average Value Number Average Value Number Average Value
LOANS ORIGINATED 103 $140,387 31 $139,667 4 $111,865 APPLICATIONS APPROVED, NOT ACCEPTED 16 $138,866 8 $119,881 0 $0 APPLICATIONS DENIED 0 $0 0 $0 0 $0 APPLICATIONS WITHDRAWN 3 $135,673 5 $134,600 0 $0 FILES CLOSED FOR INCOMPLETENESS 2 $105,135 0 $0 0 $0
Aggregated Statistics For Year 2004(Based on 1 full and 4 partial tracts) A) Conventional B) Refinancings C) Non-occupant Loans on Number Average Value Number Average Value Number Average Value
LOANS ORIGINATED 103 $134,582 33 $126,415 5 $87,554 APPLICATIONS APPROVED, NOT ACCEPTED 16 $138,137 16 $107,977 1 $141,110 APPLICATIONS DENIED 0 $0 0 $0 0 $0 APPLICATIONS WITHDRAWN 2 $208,760 2 $106,160 0 $0 FILES CLOSED FOR INCOMPLETENESS 0 $0 4 $95,262 0 $0
Aggregated Statistics For Year 2003(Based on 1 full and 4 partial tracts) A) Conventional B) Refinancings C) Non-occupant Loans on Number Average Value Number Average Value Number Average Value
LOANS ORIGINATED 81 $129,120 84 $115,893 3 $76,027 APPLICATIONS APPROVED, NOT ACCEPTED 13 $134,372 23 $117,827 2 $65,355 APPLICATIONS DENIED 1 $55,650 0 $0 0 $0 APPLICATIONS WITHDRAWN 2 $137,545 6 $87,335 2 $48,500 FILES CLOSED FOR INCOMPLETENESS 0 $0 2 $115,305 0 $0
Aggregated Statistics For Year 2002(Based on 1 partial tract) A) Conventional B) Refinancings Number Average Value Number Average Value
LOANS ORIGINATED 10 $103,224 7 $113,827 APPLICATIONS APPROVED, NOT ACCEPTED 1 $148,540 1 $151,200 APPLICATIONS DENIED 0 $0 0 $0 APPLICATIONS WITHDRAWN 0 $0 0 $0 FILES CLOSED FOR INCOMPLETENESS 0 $0 0 $0
Aggregated Statistics For Year 2001(Based on 1 partial tract) A) Conventional B) Refinancings Number Average Value Number Average Value
LOANS ORIGINATED 10 $98,878 8 $102,425 APPLICATIONS APPROVED, NOT ACCEPTED 1 $100,210 0 $0 APPLICATIONS DENIED 0 $0 0 $0 APPLICATIONS WITHDRAWN 0 $0 0 $0 FILES CLOSED FOR INCOMPLETENESS 0 $0 0 $0
Aggregated Statistics For Year 2000(Based on 1 partial tract) A) Conventional Number Average Value
LOANS ORIGINATED 12 $103,349 APPLICATIONS APPROVED, NOT ACCEPTED 1 $151,200 APPLICATIONS DENIED 0 $0 APPLICATIONS WITHDRAWN 0 $0 FILES CLOSED FOR INCOMPLETENESS 0 $0
Aggregated Statistics For Year 1999(Based on 1 full and 2 partial tracts) A) Conventional B) Refinancings C) Non-occupant Loans on Number Average Value Number Average Value Number Average Value
LOANS ORIGINATED 47 $104,762 10 $93,038 0 $0 APPLICATIONS APPROVED, NOT ACCEPTED 1 $139,460 1 $94,840 0 $0 APPLICATIONS DENIED 2 $75,975 0 $0 0 $0 APPLICATIONS WITHDRAWN 1 $112,380 0 $0 0 $0 FILES CLOSED FOR INCOMPLETENESS 1 $67,250 0 $0 1 $67,250
Detailed PMIC statistics for the following Tracts:
0101.04
, 0101.05 , 0102.01 , 0102.03 , 0102.04 Fire-safe hotels and motels in West Fargo, North Dakota:
Super 8 West Fargo, ND, 825 E Main Ave W Fargo, ND, West Fargo, North Dakota 58078 Phone: (701) 282-7121, Fax: (701) 277-9237
DoubleTree by Hilton West Fargo, 825 E Beaton Dr, West Fargo, North Dakota 58078 Phone: (701) 551-0120
Element Hotel, 925 19th Avenue E, West Fargo, North Dakota 58078 Phone: (701) 478-5333
Microtel Inn & Suites, 705 23rd Avenue E, West fargo, North Dakota 58078 Phone: (701) 282-2100
Homewood Suites by Hilton West Fargo Sanford Medical Center Area, 805 E Beaton Dr, West Fargo, North Dakota 58078 Phone: (701) 551-5800
All 5 fire-safe hotels and motels in West Fargo, North Dakota
Most common first names in West Fargo, ND among deceased individuals Name Count Lived (average)
John 36 73.2 years Mary 24 80.6 years James 24 66.4 years Robert 21 66.9 years Arthur 20 77.1 years Kenneth 19 71.2 years Richard 19 65.0 years Donald 17 67.4 years Evelyn 16 78.6 years Clarence 16 79.3 years
Most common last names in West Fargo, ND among deceased individuals Last name Count Lived (average)
Johnson 37 76.6 years Anderson 29 74.7 years Olson 18 73.2 years Nelson 15 72.5 years Miller 13 75.4 years Erickson 11 71.5 years Berg 10 76.2 years Larson 9 72.9 years Smith 9 85.2 years Hanson 8 78.4 years
West Fargo compared to North Dakota state average:
Unemployed percentage significantly below state average. Black race population percentage above state average. Median age below state average. Foreign-born population percentage significantly above state average. House age significantly below state average. Number of college students above state average. Percentage of population with a bachelor's degree or higher above state average. West Fargo on our top lists :
#56 on the list of "Top 101 cities with the most residents born in Other Eastern Africa (population 500+)"
#74 on the list of "Top 101 cities with most building permits per 10,000 residents (population 5,000+)"
#10 (58078) on the list of "Top 101 zip codes with the largest percentage of Norwegian first ancestries (pop 5,000+)"
#5 on the list of "Top 101 counties with the lowest Nitrogen Dioxide air pollution readings in 2012 (ppm)"
#10 on the list of "Top 101 counties with the largest increase in the number of births per 1000 residents 2000-2006 to 2007-2013 (pop 50,000+)"
#12 on the list of "Top 101 counties with the lowest Sulfur Oxides Annual air pollution readings in 2012 (µg/m3 )"
#43 on the list of "Top 101 counties with the highest percentage of residents that keep firearms around their homes"
#45 on the list of "Top 101 counties with the highest percentage of residents that visited a dentist within the past year"
Top Patent Applicants
Brij N. Singh (17)
Bret Ja Chisholm (16)
Barry D. Batcheller (14)
Jeffrey L. Johnson (9)
Nicholas L. Butts (8)
John Michael Eidenshink (6)
Chris J. Tremel (5)
Jason Keith Novacek (5)
Michael A. Hajicek (5)
Travis Jenson (5)
Total of 247 patent applications in 2008-2024.


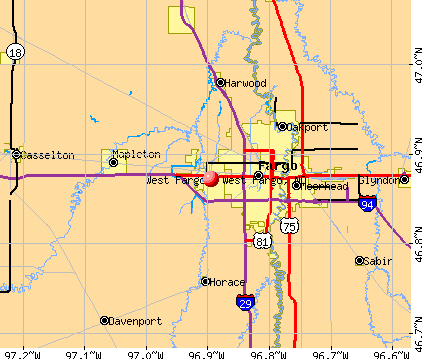


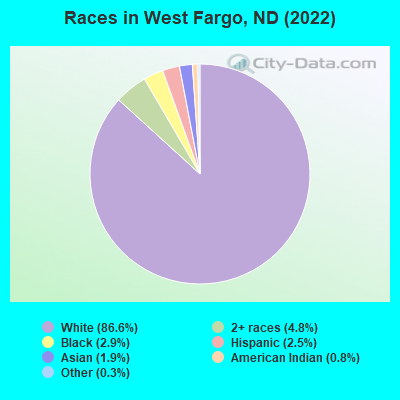
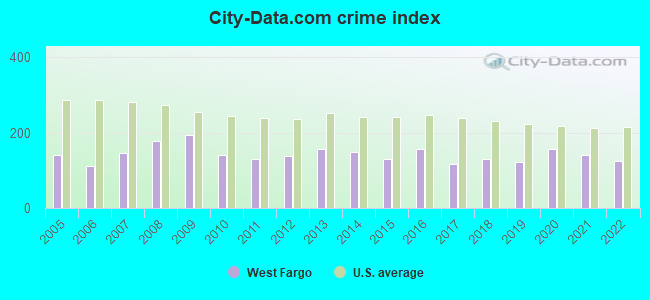
 Recent articles from our blog. Our writers, many of them Ph.D. graduates or candidates, create easy-to-read articles on a wide variety of topics.

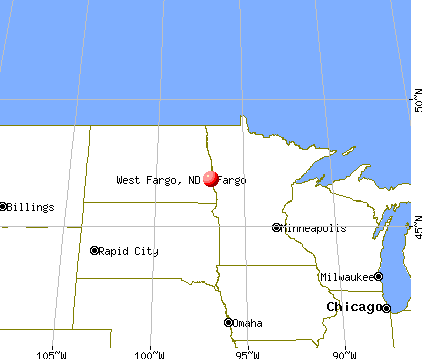
 (4.1 miles
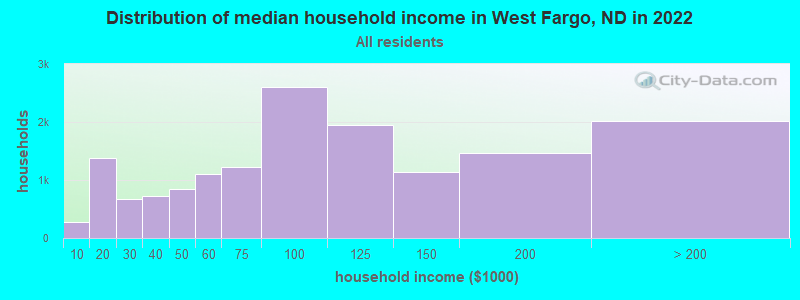
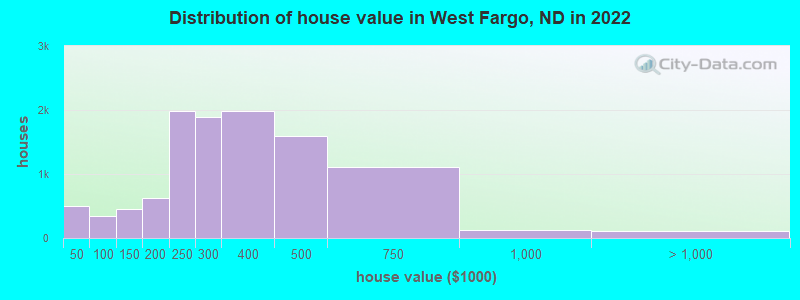
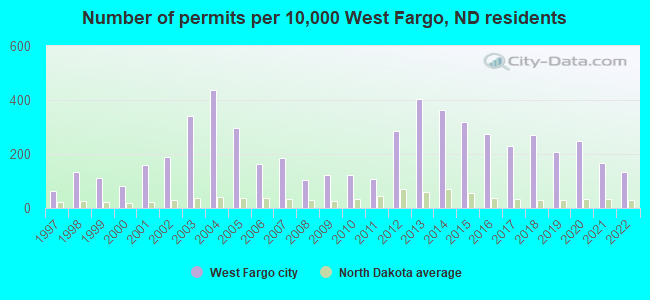
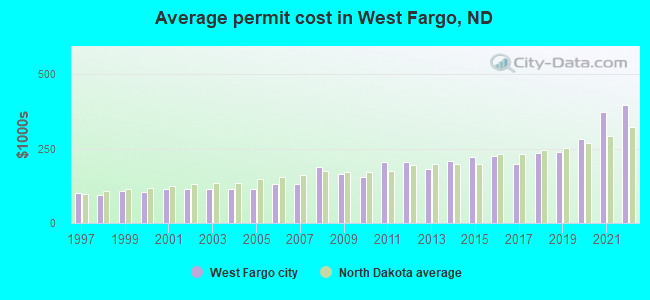
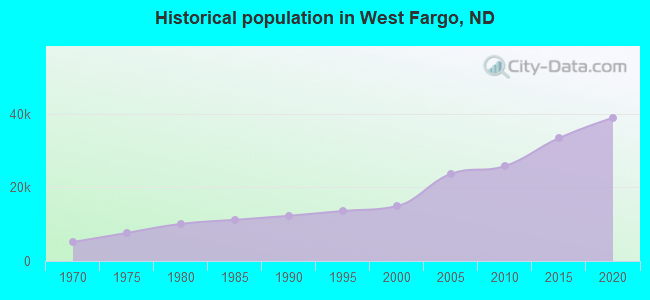
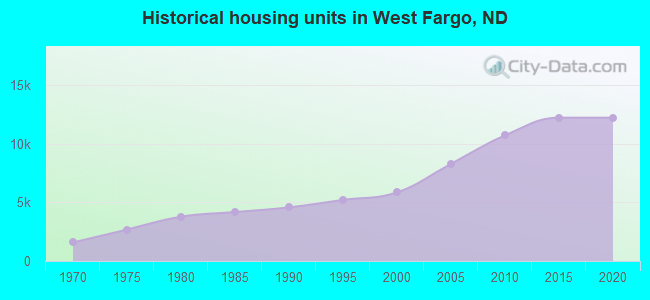
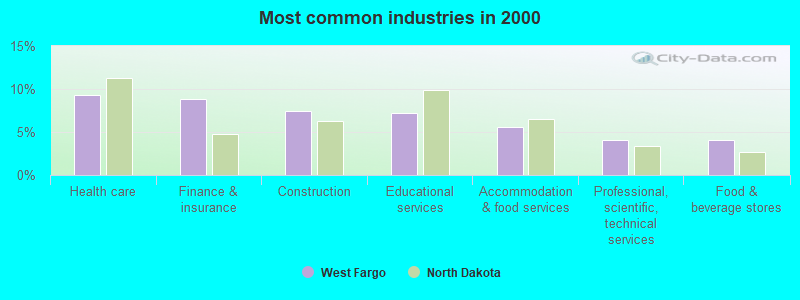
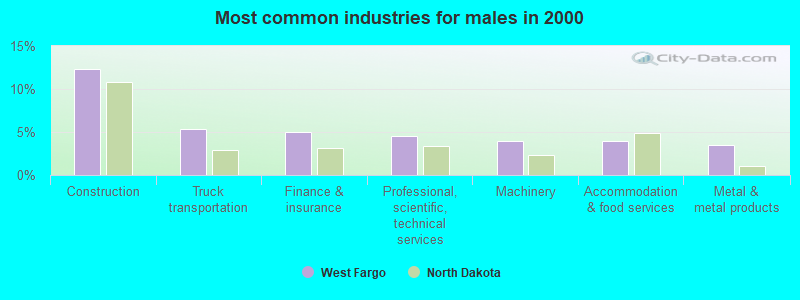
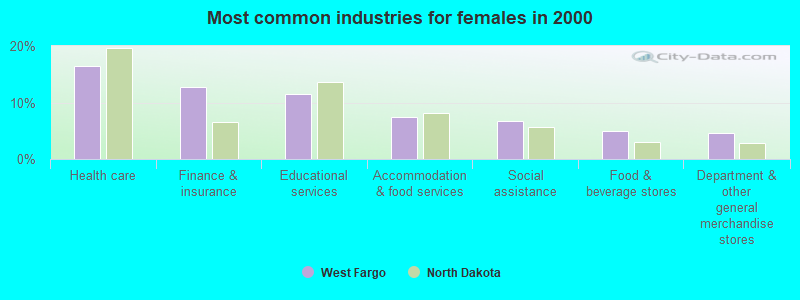
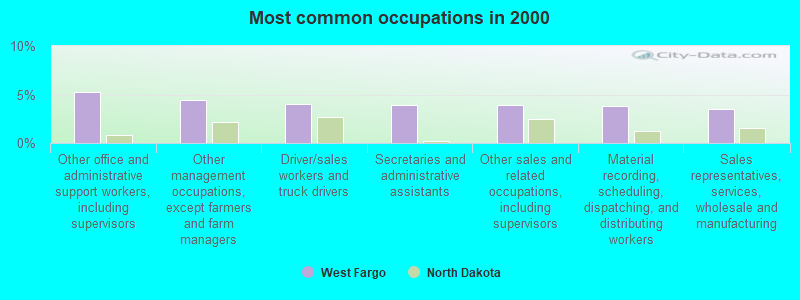
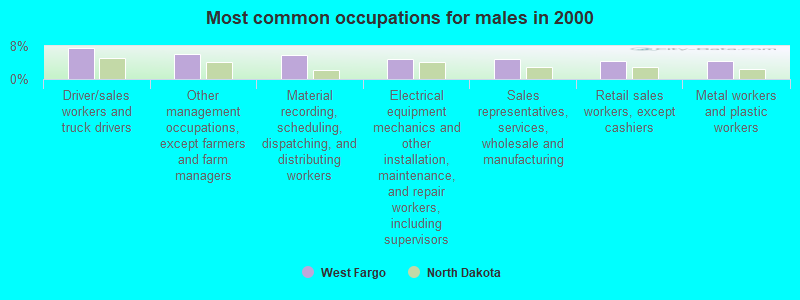
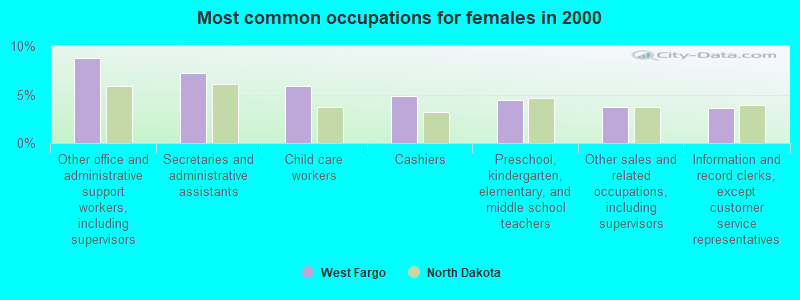


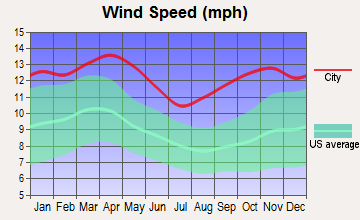


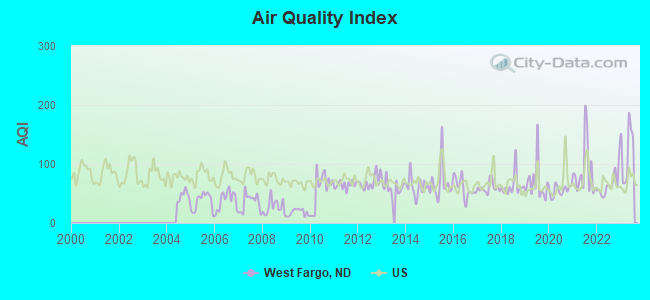
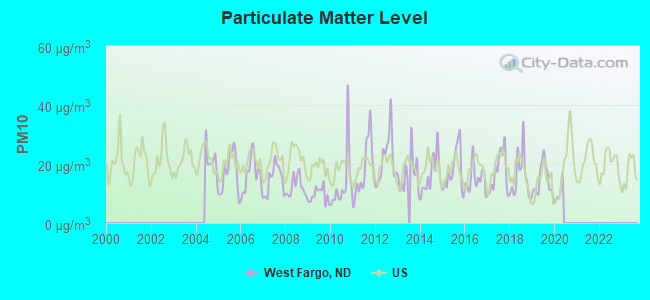
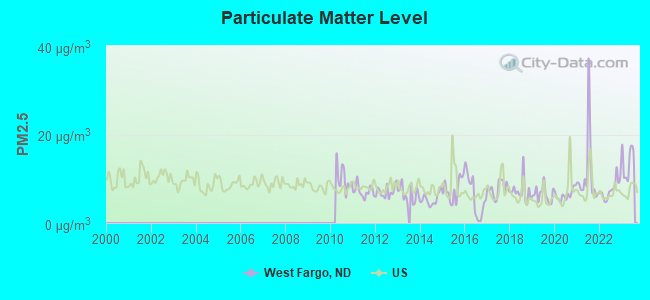

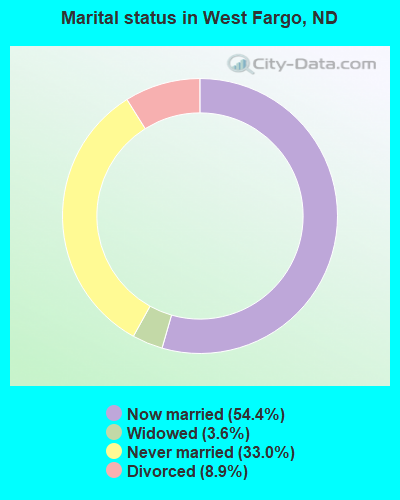
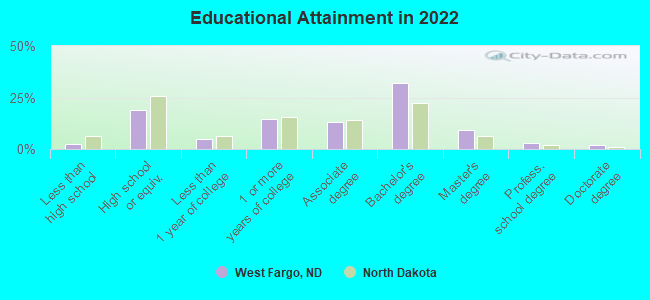
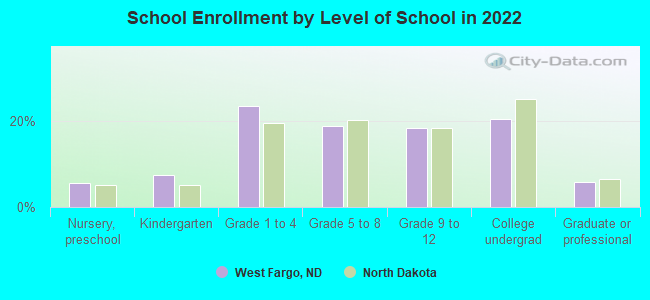
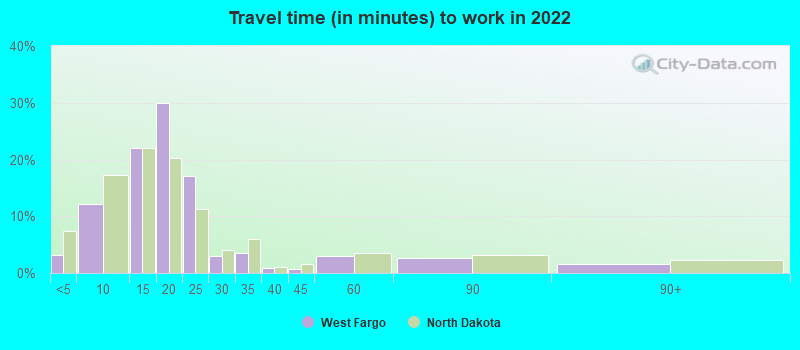
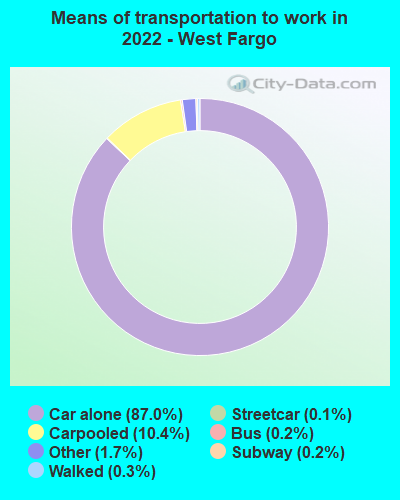
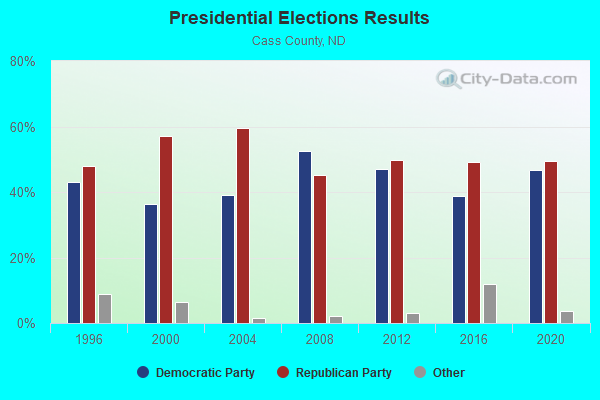
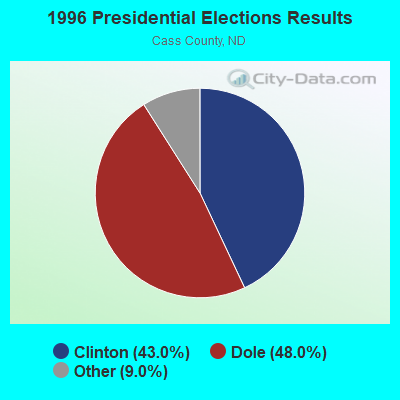
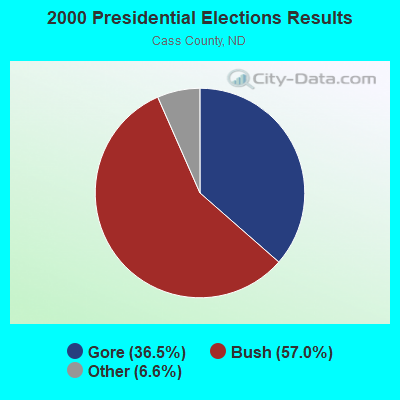
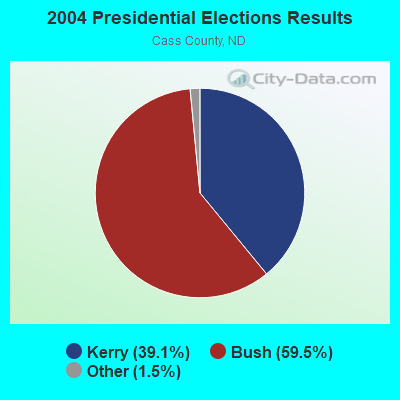
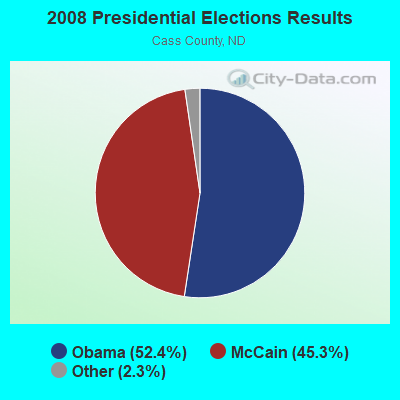
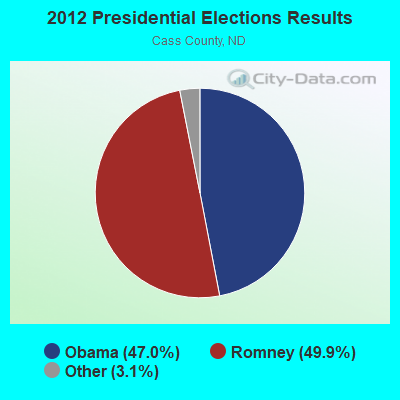
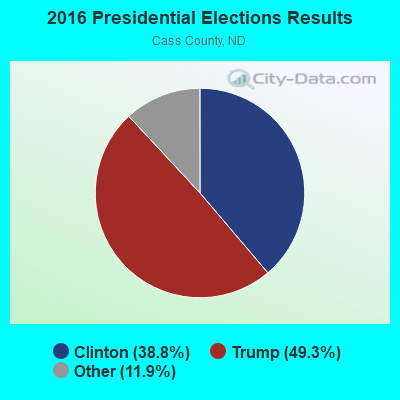
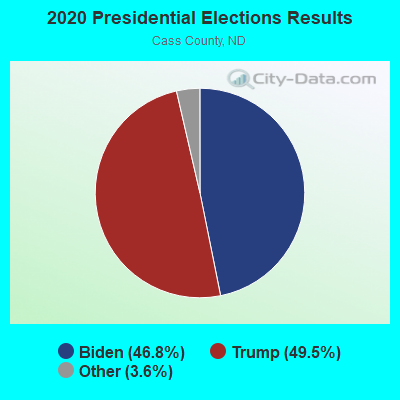
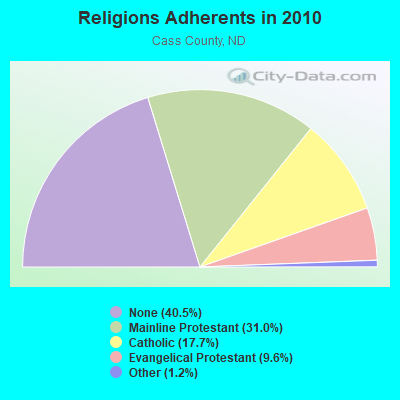
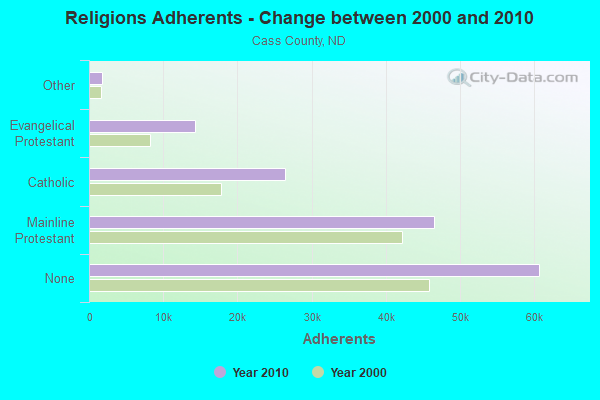
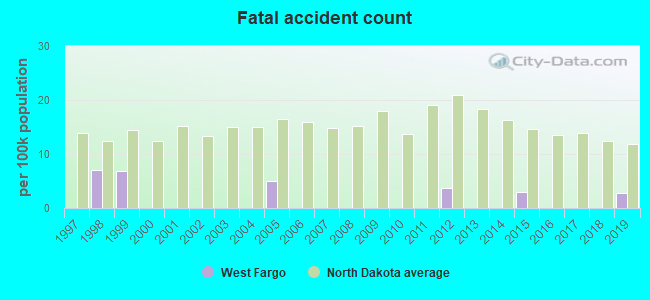
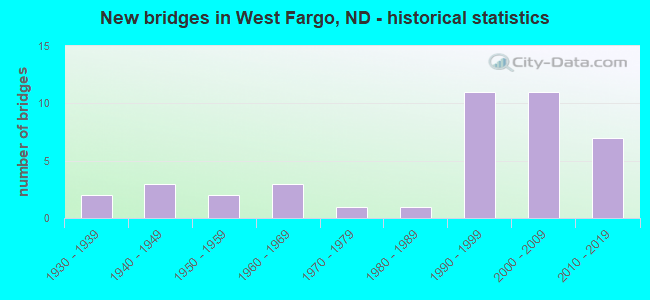
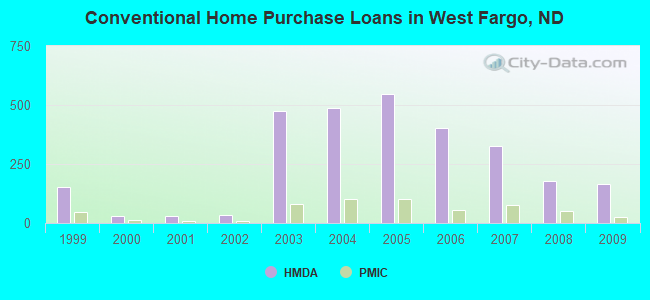
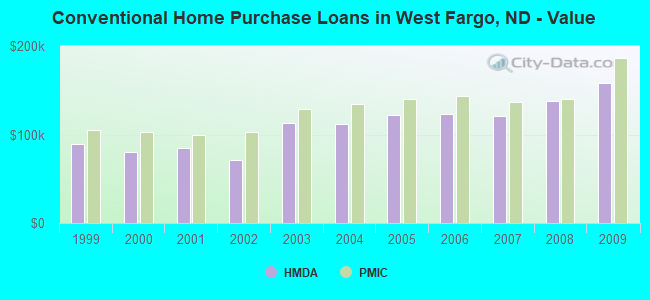
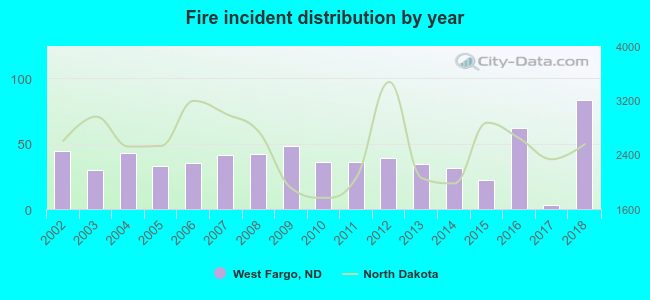 Based on the data from the years 2002 - 2018 the average number of fires per year is 39. The highest number of reported fires - 83 took place in 2018, and the least - 3 in 2017. The data has an increasing trend.
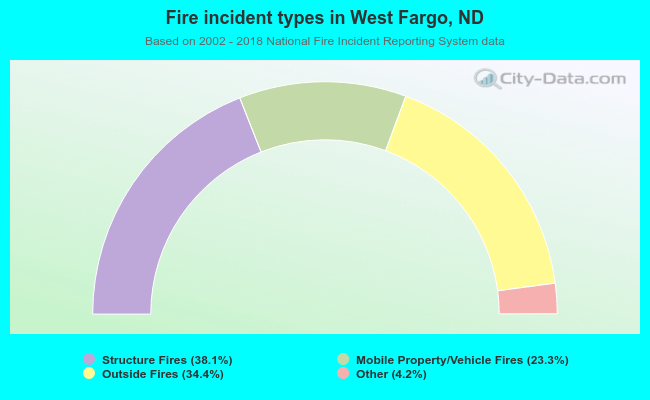 When looking into fire subcategories, the most reports belonged to: Structure Fires (38.1%), and Outside Fires (34.4%).