Ellis County, Texas (TX)
County owner-occupied free and clear houses and condos in 2010: 10,333
County owner-occupied houses and condos in 2000: 28,226
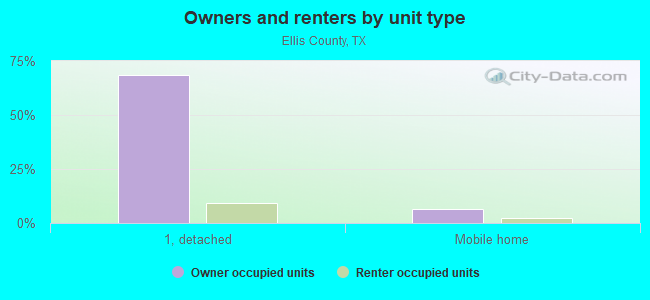
Renter-occupied apartments: 12,921 (it was 8,794 in 2000)
| % of renters here: | 24% |
| State: | 36% |
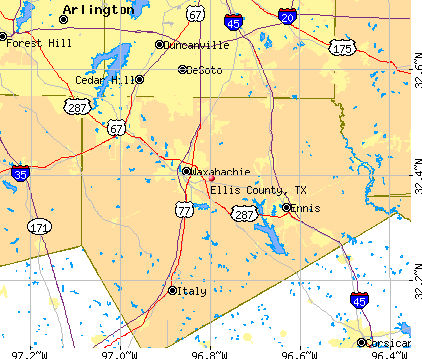
Land area: 940 sq. mi.
Water area: 11.8 sq. mi.
Population density: 226 people per square mile (high).
Industries providing employment: Educational, health and social services (20.5%), Retail trade (13.1%), Manufacturing (12.2%).
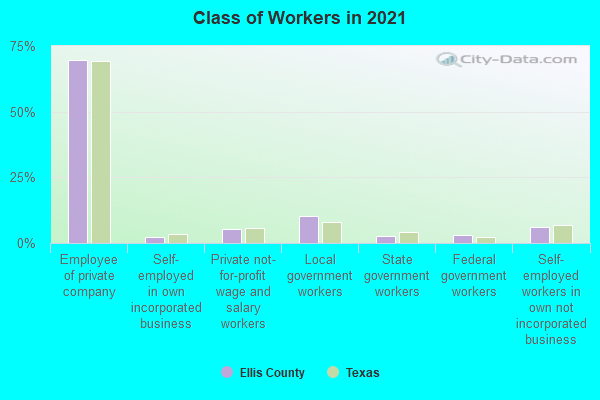
Type of workers:
- Private wage or salary: 78%
- Government: 15%
- Self-employed, not incorporated: 6%
- Unpaid family work: 0%
- OSM Map
- General Map
- Google Map
- MSN Map

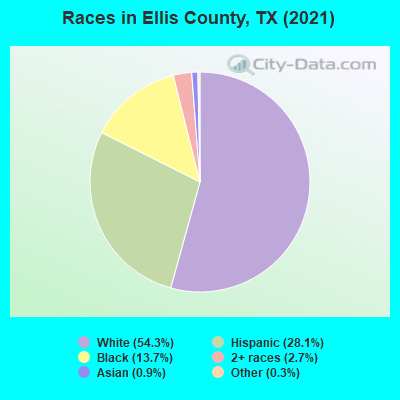
- 110,73052.2%White Non-Hispanic Alone
- 60,11228.3%Hispanic or Latino
- 30,33214.3%Black Non-Hispanic Alone
- 7,2223.4%Two or more races
- 1,6810.8%Some other race alone
- 1,6580.8%Asian alone
- 2780.1%American Indian and Alaska Native alone
- 1690.08%Native Hawaiian and Other
Pacific Islander alone
| Median resident age: | 36.2 years |
| Texas median age: | 35.6 years |
| Males: 105,284 | |
| Females: 106,898 |

 | When will Sherman/Denison Be In DFW Metro? (68 replies) |
| 2023 DFW County Appraisals & Assessments Thread (75 replies) |
| Future of Southern and Eastern Suburbs? (43 replies) |
| FACT: Texas is 30 years behind California (71 replies) |
| 2022 DFW County Appraisals & Assessments Thread (55 replies) |
| 2024 DFW Appraisals & Assessments Thread (16 replies) |
| Ellis County: | 2.0 people |
| Texas: | 3 people |
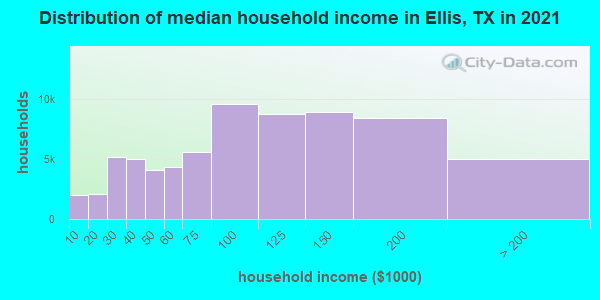
Estimated median household income in 2022: $89,856 ($50,350 in 1999)
| This county: | $89,856 |
| Texas: | $72,284 |
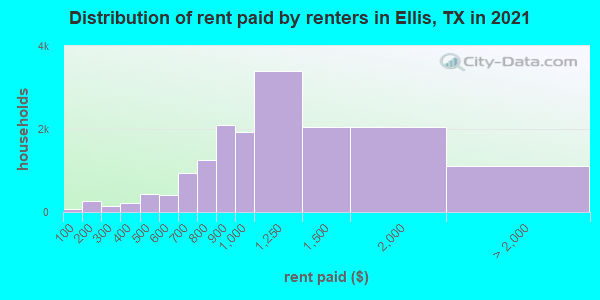
Median contract rent in 2022 for apartments: $1,203 (lower quartile is $918, upper quartile is $1,704)
| This county: | $1203 |
| State: | $1117 |
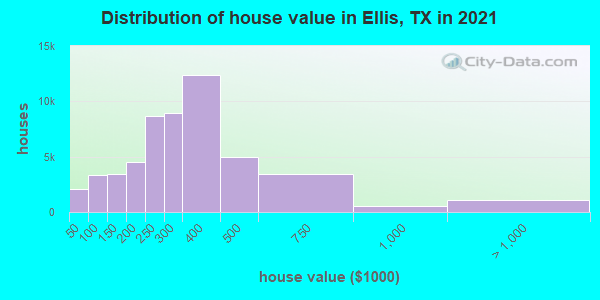
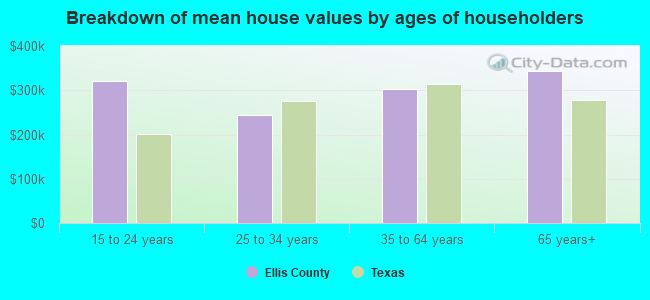
Estimated median house or condo value in 2022: $315,100 (it was $88,000 in 2000)
| Ellis: | $315,100 |
| Texas: | $275,400 |
Median monthly housing costs for homes and condos with a mortgage: $1,959
Median monthly housing costs for units without a mortgage: $741
Institutionalized population: 1,098
Crime in 2021 (reported by the sheriff's office or county police, not the county total):
- Murders: 1
- Rapes: 27
- Robberies: 3
- Assaults: 58
- Burglaries: 96
- Thefts: 264
- Auto thefts: 50
Crime in 2020 (reported by the sheriff's office or county police, not the county total):
- Murders: 0
- Rapes: 21
- Robberies: 9
- Assaults: 64
- Burglaries: 114
- Thefts: 235
- Auto thefts: 47
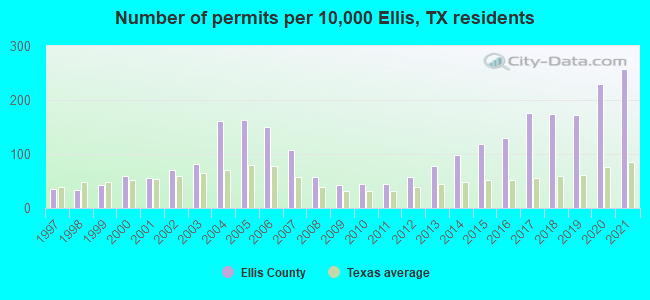
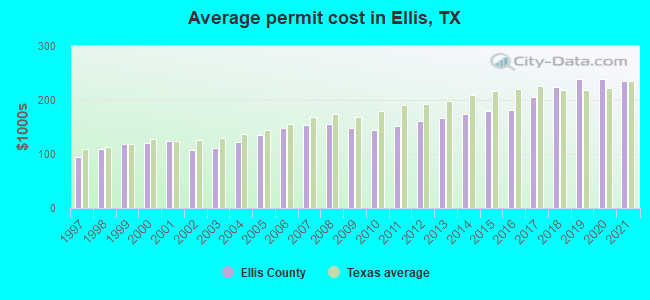
Single-family new house construction building permits:
- 2022: 2330 buildings, average cost: $268,400
- 2021: 2871 buildings, average cost: $235,100
- 2020: 2548 buildings, average cost: $237,700
- 2019: 1913 buildings, average cost: $237,900
- 2018: 1952 buildings, average cost: $224,100
- 2017: 1959 buildings, average cost: $206,000
- 2016: 1446 buildings, average cost: $182,400
- 2015: 1327 buildings, average cost: $178,900
- 2014: 1096 buildings, average cost: $174,000
- 2013: 868 buildings, average cost: $165,800
- 2012: 643 buildings, average cost: $160,700
- 2011: 503 buildings, average cost: $150,900
- 2010: 487 buildings, average cost: $145,100
- 2009: 475 buildings, average cost: $147,700
- 2008: 643 buildings, average cost: $156,400
- 2007: 1205 buildings, average cost: $153,200
- 2006: 1666 buildings, average cost: $148,000
- 2005: 1810 buildings, average cost: $135,600
- 2004: 1798 buildings, average cost: $122,600
- 2003: 903 buildings, average cost: $111,200
- 2002: 786 buildings, average cost: $106,500
- 2001: 628 buildings, average cost: $125,400
- 2000: 669 buildings, average cost: $121,400
- 1999: 481 buildings, average cost: $117,900
- 1998: 366 buildings, average cost: $109,900
- 1997: 388 buildings, average cost: $93,900
Median real estate property taxes paid for housing units with mortgages in 2022: $4,984 (1.5%)
Median real estate property taxes paid for housing units with no mortgage in 2022: $3,167 (1.2%)
| Ellis County: | 9.2% |
| Texas: | 14.0% |
Median age of residents in 2022: 36.2 years old
(Males: 35.8 years old, Females: 36.5 years old)
(Median age for: White residents: 41.8 years old, Black residents: 36.3 years old, American Indian residents: 36.1 years old, Asian residents: 46.8 years old, Hispanic or Latino residents: 28.5 years old, Other race residents: 34.4 years old)
Area name: Dallas, TX HUD Metro FMR Area
Fair market rent in 2006 for a 1-bedroom apartment in Ellis County is $607 a month.
Fair market rent for a 2-bedroom apartment is $733 a month.
Fair market rent for a 3-bedroom apartment is $954 a month.
Cities in this county include: Waxahachie, Ennis, Midlothian, Red Oak, Ovilla, Ferris, Italy, Palmer, Oak Leaf, Maypearl.
2023 air pollution in Ellis County:
Nitrogen Dioxide: 0.00 ppm (standard limit: 0.053 ppm). Below U.S. average.
Ozone (1-hour): 0.030 ppm (standard limit: 0.12 ppm). Near U.S. average.
Neighboring counties: Allendale County, South Carolina  , Caldwell Parish, Louisiana , Lee County, Alabama , Quitman County, Georgia , Upson County, Georgia , Marion County , Palo Pinto County
  , Somervell County
  .
.
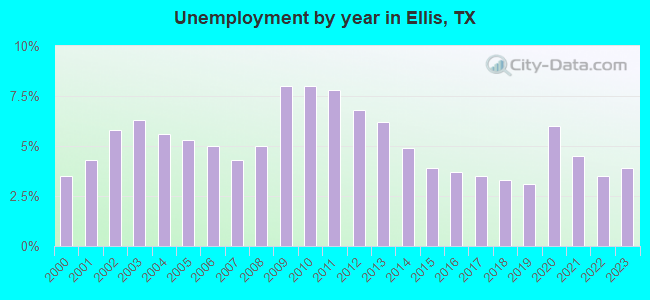
| Here: | 3.3% |
| Texas: | 3.5% |
Current college students: 4,799
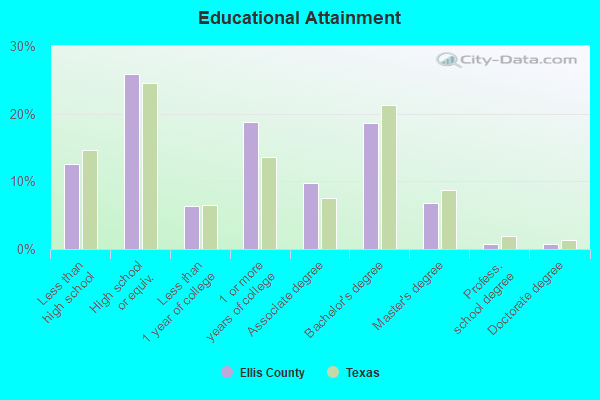
People 25 years of age or older with a high school degree or higher: 89.0%
People 25 years of age or older with a bachelor's degree or higher: 31.7%
Number of foreign born residents: 19,405 (41.7% naturalized citizens)
| Ellis County: | 9.1% |
| Whole state: | 17.2% |
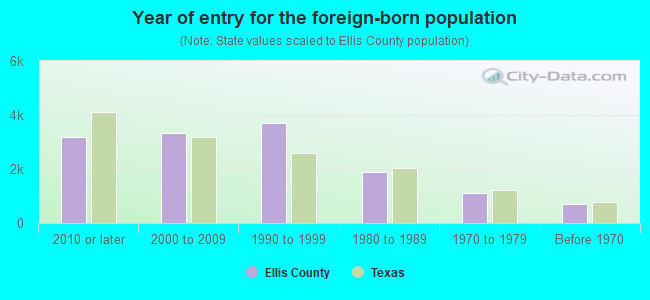
- Year of entry for the foreign-born population
- 3,3252010 or later
- 3,4752000 to 2009
- 4,0021990 to 1999
- 1,9061980 to 1989
- 1,0931970 to 1979
- 715Before 1970
Mean travel time to work (commute): minutes
Percentage of county residents living and working in this county: 99.3%
Housing units in structures:
- One, detached: 61,493
- One, attached: 1,383
- Two: 707
- 3 or 4: 906
- 5 to 9: 699
- 10 to 19: 1,022
- 20 to 49: 1,884
- 50 or more: 1,815
- Mobile homes: 6,045
- Boats, RVs, vans, etc.: 62
Housing units in Ellis County with a mortgage: 36,013 (901 second mortgage, 0 home equity loan, 538 both second mortgage and home equity loan)
Houses without a mortgage: 282
| Here: | 11.3% with mortgage |
| State: | 98.4% with mortgage |
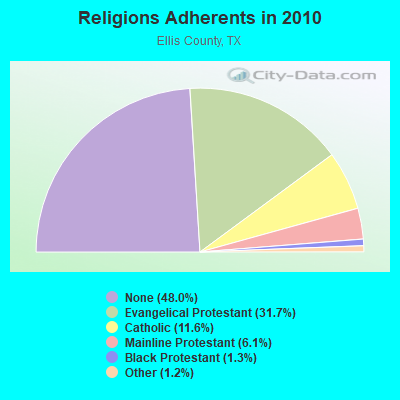
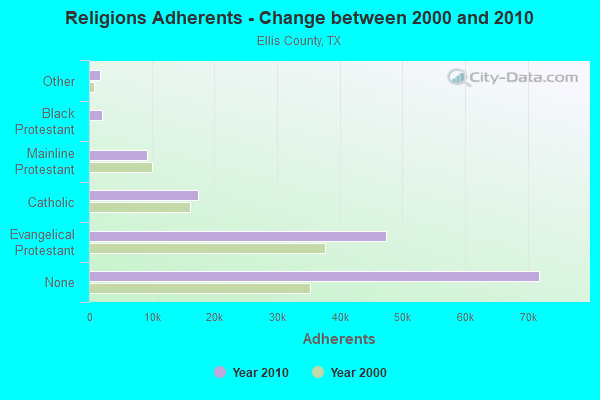
Religion statistics for Ellis County
| Religion | Adherents | Congregations |
|---|---|---|
| Evangelical Protestant | 47,380 | 167 |
| Catholic | 17,381 | 4 |
| Mainline Protestant | 9,201 | 34 |
| Black Protestant | 2,015 | 13 |
| Other | 1,769 | 7 |
| None | 71,864 | - |
Source: Clifford Grammich, Kirk Hadaway, Richard Houseal, Dale E.Jones, Alexei Krindatch, Richie Stanley and Richard H.Taylor. 2012. 2010 U.S.Religion Census: Religious Congregations & Membership Study. Association of Statisticians of American Religious Bodies. Jones, Dale E., et al. 2002. Congregations and Membership in the United States 2000. Nashville, TN: Glenmary Research Center.
Food Environment Statistics:
| Ellis County: | 1.19 / 10,000 pop. |
| State: | 1.47 / 10,000 pop. |
| Here: | 0.07 / 10,000 pop. |
| Texas: | 0.14 / 10,000 pop. |
| This county: | 0.98 / 10,000 pop. |
| Texas: | 1.11 / 10,000 pop. |
| Ellis County: | 3.92 / 10,000 pop. |
| Texas: | 3.95 / 10,000 pop. |
| This county: | 4.55 / 10,000 pop. |
| State: | 6.13 / 10,000 pop. |
| Ellis County: | 8.3% |
| Texas: | 8.9% |
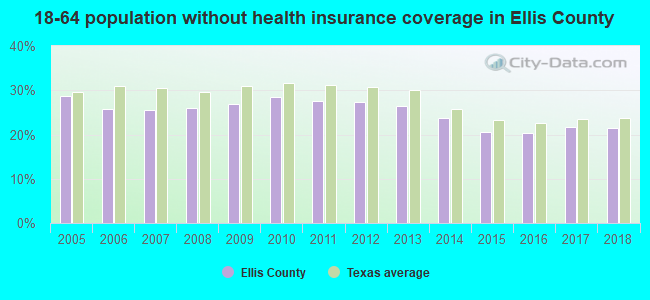
| Ellis County: | 29.1% |
| State: | 26.6% |
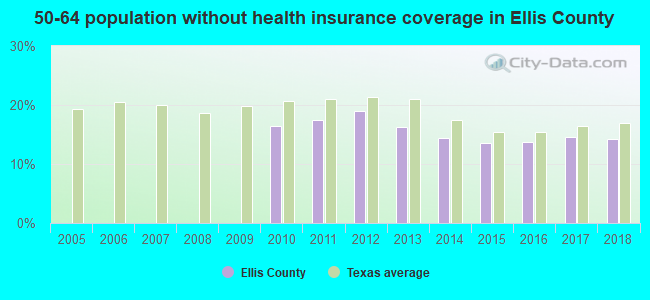
| Here: | 16.4% |
| State: | 15.7% |
Agriculture in Ellis County:
Average size of farms: 222 acresAverage value of agricultural products sold per farm: $20,793
Average value of crops sold per acre for harvested cropland: $156.62
The value of nursery, greenhouse, floriculture, and sod as a percentage of the total market value of agricultural products sold: 12.22%
The value of livestock, poultry, and their products as a percentage of the total market value of agricultural products sold: 37.95%
Average total farm production expenses per farm: $23,257
Harvested cropland as a percentage of land in farms: 37.08%
Irrigated harvested cropland as a percentage of land in farms: 0.49%
Average market value of all machinery and equipment per farm: $37,287
The percentage of farms operated by a family or individual: 93.87%
Average age of principal farm operators: 56 years
Average number of cattle and calves per 100 acres of all land in farms: 11.52
Corn for grain: 36399 harvested acres
All wheat for grain: 29916 harvested acres
Upland cotton: 26066 harvested acres
Soybeans for beans: 3706 harvested acres
Vegetables: 63 harvested acres
Land in orchards: 1,062 acres
Earthquake activity:
Ellis County-area historical earthquake activity is significantly above Texas state average. It is 419% greater than the overall U.S. average.On 11/6/2011 at 03:53:10, a magnitude 5.7 (5.7 MW, Depth: 3.2 mi, Class: Moderate, Intensity: VI - VII) earthquake occurred 217.2 miles away from Ellis County center
On 9/3/2016 at 12:02:44, a magnitude 5.8 (5.8 MW, Depth: 3.5 mi) earthquake occurred 279.1 miles away from the county center
On 6/16/1978 at 11:46:54, a magnitude 5.3 (4.4 MB, 4.6 UK, 5.3 ML) earthquake occurred 235.1 miles away from the county center
On 5/17/2012 at 08:12:00, a magnitude 4.8 (4.8 MW, Depth: 3.1 mi, Class: Light, Intensity: IV - V) earthquake occurred 145.9 miles away from the county center
On 5/7/2015 at 22:58:05, a magnitude 4.0 (4.0 MW, Depth: 1.6 mi) earthquake occurred 18.7 miles away from Ellis County center
On 11/7/2016 at 01:44:24, a magnitude 5.0 (5.0 MW, Depth: 2.8 mi) earthquake occurred 249.0 miles away from the county center
Magnitude types: body-wave magnitude (MB), local magnitude (ML), moment magnitude (MW)
Most recent natural disasters:
- Texas Covid-19 Pandemic, Incident Period: January 20, 2020, FEMA Id: 4485, Natural disaster type: Other
- Texas Severe Winter Storms, Tornadoes, Straight-line Winds, and Flooding, Incident Period: December 26, 2016 to January 21, 2016, Major Disaster (Presidential) Declared DR-4255: February 09, 2016, FEMA Id: 4255, Natural disaster type: Winter Storm, Tornado, Flood, Wind
- Texas Severe Storms, Tornadoes, Straight-line Winds, and Flooding, Incident Period: May 04, 2015 to June 23, 2015, Major Disaster (Presidential) Declared DR-4223: May 29, 2015, FEMA Id: 4223, Natural disaster type: Storm, Tornado, Flood, Wind
- Texas County Line Fire, Incident Period: June 18, 2011 to June 20, 2011, Fire Management Assistance Declared: June 18, 2011, FEMA Id: 2925, Natural disaster type: Fire
- Texas Hurricane Ike, Incident Period: September 07, 2008 to September 26, 2008, Emergency Declared EM-3294: September 10, 2008, FEMA Id: 3294, Natural disaster type: Hurricane
- Texas Wildfires, Incident Period: March 14, 2008 to September 01, 2008, Emergency Declared EM-3284: March 14, 2008, FEMA Id: 3284, Natural disaster type: Fire
- Texas Severe Storms, Tornadoes, and Flooding, Incident Period: June 16, 2007 to August 03, 2007, Major Disaster (Presidential) Declared DR-1709: June 29, 2007, FEMA Id: 1709, Natural disaster type: Storm, Tornado, Flood
- Texas Venus Fire Complex, Incident Period: February 05, 2006, Fire Management Assistance Declared: February 05, 2006, FEMA Id: 2629, Natural disaster type: Fire
- Texas Hurricane Rita, Incident Period: September 23, 2005 to October 14, 2005, Major Disaster (Presidential) Declared DR-1606: September 24, 2005, FEMA Id: 1606, Natural disaster type: Hurricane
- Texas Hurricane Rita, Incident Period: September 20, 2005 to October 14, 2005, Emergency Declared EM-3261: September 21, 2005, FEMA Id: 3261, Natural disaster type: Hurricane
- 7 other natural disasters have been reported since 1953.
The number of natural disasters in Ellis County (17) is near the US average (15).
Major Disasters (Presidential) Declared: 6
Emergencies Declared: 7
Causes of natural disasters: Fires: 6, Floods: 5, Tornadoes: 5, Hurricanes: 4, Storms: 4, Winds: 2, Winter Storm: 1, Other: 2 (Note: some incidents may be assigned to more than one category).
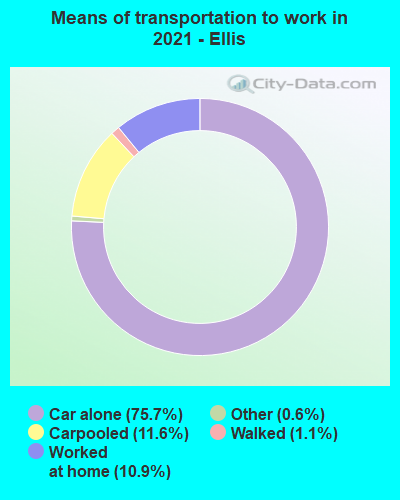
Means of transportation to work:
- Drove a car alone: 52,089 (70.4%)
- Carpooled: 8,414 (11.4%)
- Ferryboat: 3 (0.0%)
- Taxicab, motorcycle, or other means: 807 (1.1%)
- Bicycle: 21 (0.0%)
- Walked: 700 (0.9%)
- Worked at home: 12,496 (16.9%)
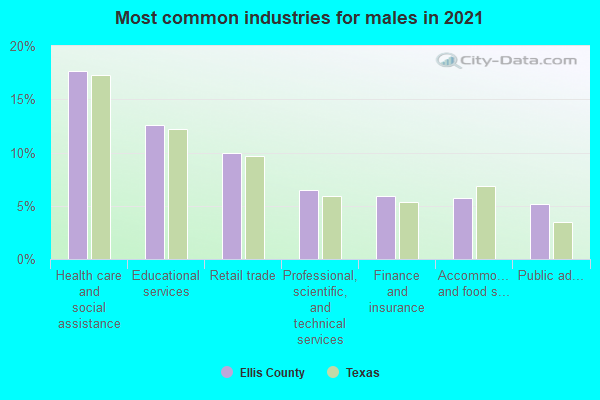
- Health care and social assistance (18%)
- Educational services (15%)
- Retail trade (12%)
- Finance and insurance (8%)
- Manufacturing (6%)
- Professional, scientific, and technical services (5%)
- Accommodation and food services (5%)
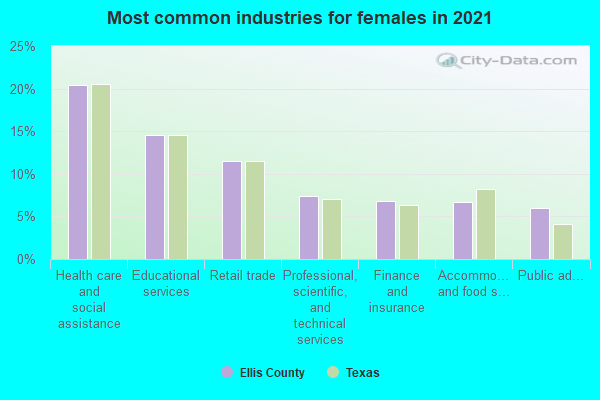
- Health care and social assistance (20%)
- Educational services (17%)
- Retail trade (13%)
- Finance and insurance (9%)
- Manufacturing (6%)
- Professional, scientific, and technical services (5%)
- Accommodation and food services (5%)
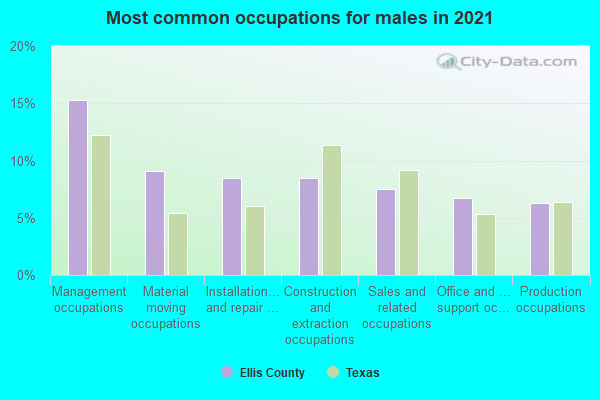
- Management occupations (16%)
- Production occupations (11%)
- Construction and extraction occupations (11%)
- Sales and related occupations (10%)
- Transportation occupations (7%)
- Business and financial operations occupations (7%)
- Installation, maintenance, and repair occupations (6%)
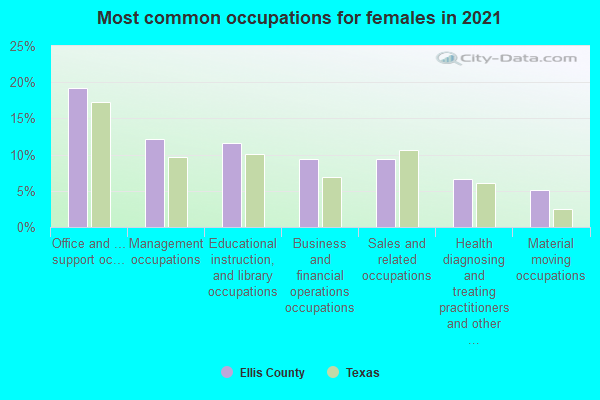
- Office and administrative support occupations (18%)
- Educational instruction, and library occupations (13%)
- Management occupations (11%)
- Sales and related occupations (10%)
- Health diagnosing and treating practitioners and other technical occupations (8%)
- Business and financial operations occupations (6%)
- Food preparation and serving related occupations (4%)
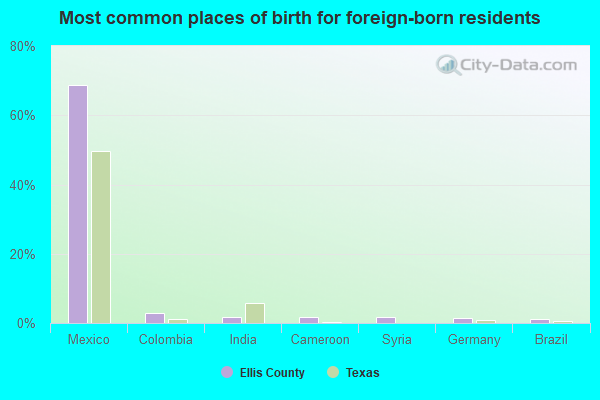
- Mexico (68%)
- India (2%)
- Colombia (2%)
- Philippines (2%)
- Germany (1%)
- El Salvador (1%)
- Cameroon (1%)
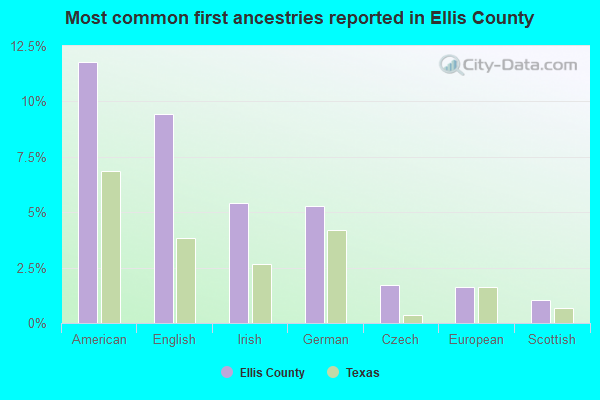
- American (12%)
- English (10%)
- German (6%)
- Irish (4%)
- European (1%)
- Czech (1%)
- Italian (1%)
People in group quarters in Ellis County, Texas in 2010:
- 615 people in nursing facilities/skilled-nursing facilities
- 413 people in college/university student housing
- 306 people in local jails and other municipal confinement facilities
- 177 people in group homes for juveniles (non-correctional)
- 39 people in group homes intended for adults
- 32 people in workers' group living quarters and job corps centers
- 20 people in emergency and transitional shelters (with sleeping facilities) for people experiencing homelessness
- 8 people in residential treatment centers for adults
People in group quarters in Ellis County, Texas in 2000:
- 763 people in college dormitories (includes college quarters off campus)
- 657 people in nursing homes
- 260 people in local jails and other confinement facilities (including police lockups)
- 93 people in other noninstitutional group quarters
- 78 people in other group homes
- 69 people in homes or halfway houses for drug/alcohol abuse
- 13 people in homes for the mentally retarded
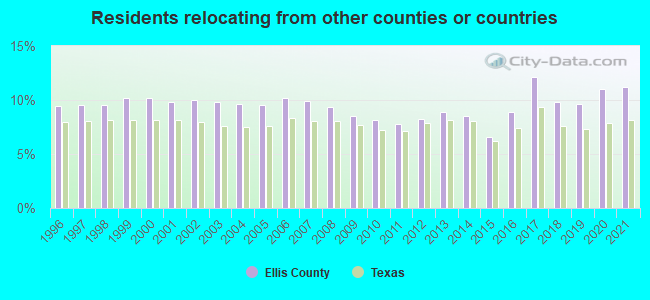
11.20% of this county's 2021 resident taxpayers lived in other counties in 2020 ($67,631 average adjusted gross income)
| Here: | 11.20% |
| Texas average: | 8.12% |
0.03% of residents moved from foreign countries ($137 average AGI)
Ellis County: 0.03% Texas average: 0.04%
9.09% relocated from other counties in Texas ($52,890 average AGI)
2.08% relocated from other states ($14,604 average AGI)
Ellis County: 2.08% Texas average: 2.83%
Top counties from which taxpayers relocated into this county between 2020 and 2021:
| from Dallas County, TX | |
| from Tarrant County, TX | |
| from Denton County, TX | |
| from Johnson County, TX | |
| from Navarro County, TX | |
| from Collin County, TX | |
| from Kaufman County, TX |
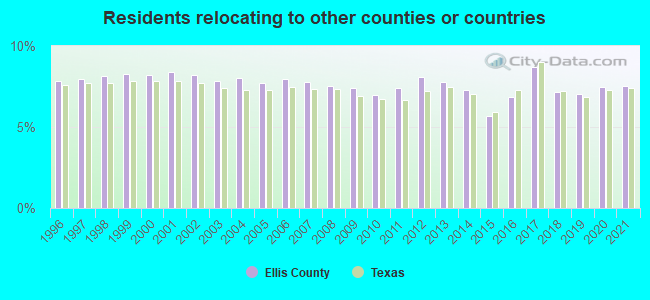
7.52% of this county's 2020 resident taxpayers moved to other counties in 2021 ($59,075 average adjusted gross income)
| Here: | 7.52% |
| Texas average: | 7.40% |
10 or fewer of this county's residents moved to foreign countries.
6.21% relocated to other counties in Texas ($47,095 average AGI)
1.30% relocated to other states ($11,980 average AGI)
Ellis County: 1.30% Texas average: 2.08%
Top counties to which taxpayers relocated from this county between 2020 and 2021:
| to Dallas County, TX | |
| to Tarrant County, TX | |
| to Johnson County, TX | |
| to Navarro County, TX | |
| to Denton County, TX | |
| to Collin County, TX | |
| to Kaufman County, TX |
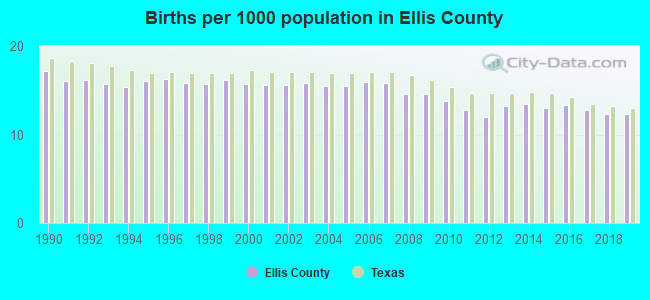
Births per 1000 population from 1990 to 1999: 16.1
Births per 1000 population from 2000 to 2009: 15.5
Births per 1000 population from 2010 to 2022: 10.9
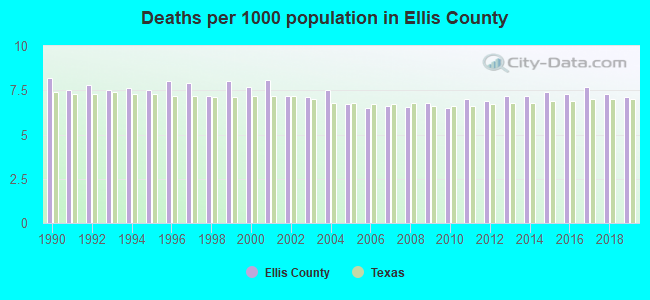
Deaths per 1000 population from 1990 to 1999: 7.7
Deaths per 1000 population from 2000 to 2009: 7.1
Deaths per 1000 population from 2010 to 2020: 7.3
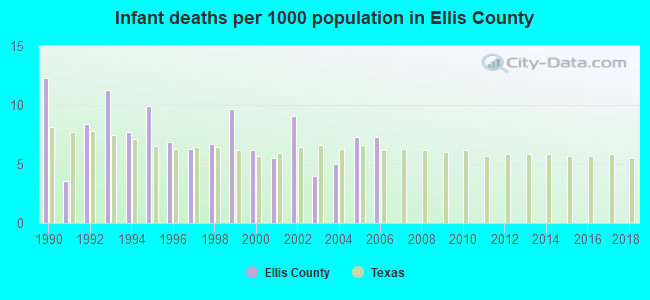
Infant deaths per 1000 live births from 1990 to 1999: 8.3
Infant deaths per 1000 live births from 2000 to 2006: 6.3
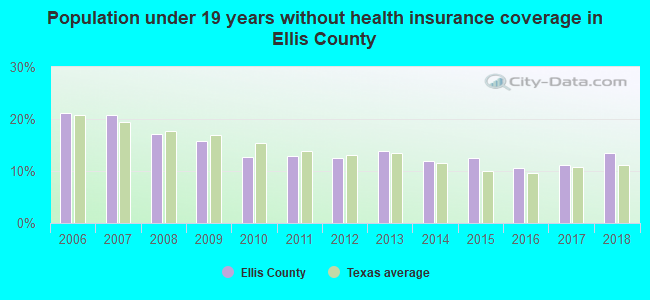
Persons under 19 years old without health insurance coverage in 2018: 13.5%
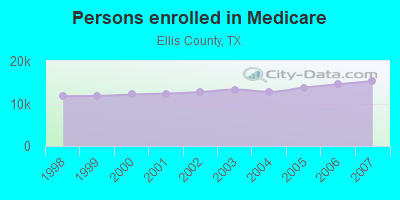
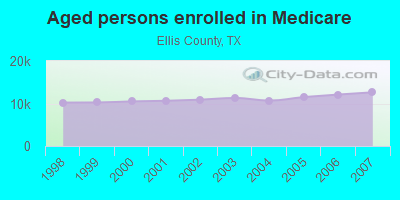
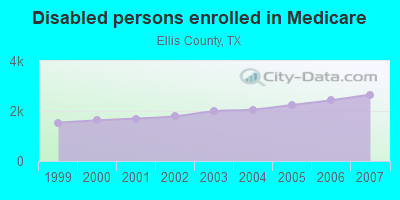
Persons enrolled in hospital insurance and/or supplemental medical insurance (Medicare) in July 1, 2007: 15,288 (12,631 aged, 2,657 disabled)
Children under 18 without health insurance coverage in 2007: 8,448 (20%)
Most common underlying causes of death in Ellis County, Texas in 1999 - 2019:
- Bronchus or lung, unspecified - Malignant neoplasms (1,341)
- Acute myocardial infarction, unspecified (1,093)
- Alzheimer disease, unspecified (1,065)
- Atherosclerotic heart disease (1,020)
- Chronic obstructive pulmonary disease, unspecified (914)
- Atherosclerotic cardiovascular disease, so described (749)
- Unspecified dementia (702)
- Stroke, not specified as haemorrhage or infarction (590)
- Congestive heart failure (469)
- Colon, unspecified - Malignant neoplasms (361)
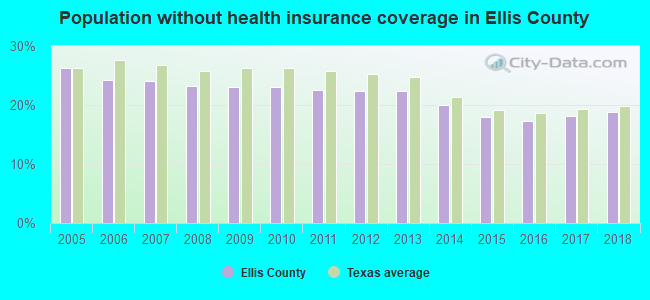
Population without health insurance coverage in 2000: 15%
Children under 18 without health insurance coverage in 2000: 15%
Short term general hospital admissions per 100,000 population in 2004: 4,461
Short term general hospital beds per 100,000 population in 2004: 74
Emergency room visits per 100,000 population in 2004: 35,217
General practice office based MDs per 100,000 population in 2005: 1,515
Medical specialist MDs per 100,000 population in 2005: 744
Dentists per 100,000 population in 1998: 2
Total births per 100,000 population, July 2005 - July 2006 : 25
Total deaths per 100,000 population, July 2005 - July 2006: 67
Limited-service eating places per 100,000 population in 2005 : 6
Beer, wine & liquor stores per 100,000 population in 2005: 1
Homicides per 1,000,000 population from 2000 to 2006: 49.6. This is less than state average.
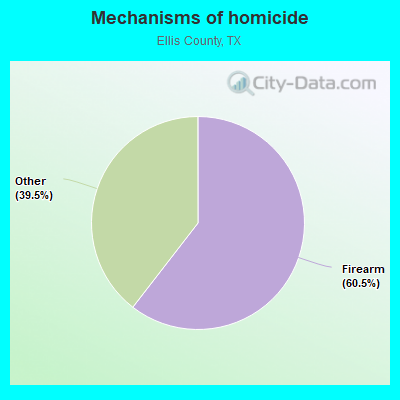
- Firearm - 30.0
- Other - 19.6
Suicides per 1,000,000 population from 2000 to 2006: 101.5. This is less than state average.
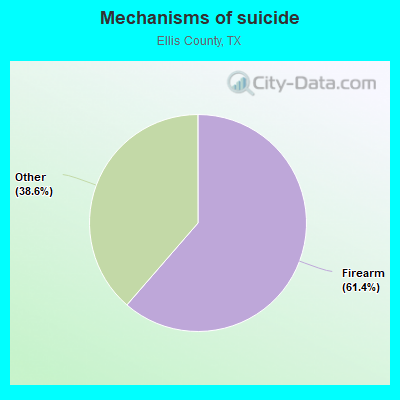
- Firearm - 62.3
- Other - 39.2
Household type by relationship:
Households: 212,182- Male householders: 35,096 (4,860 living alone), Female householders: 38,131 (6,872 living alone)
44,315 spouses (43,812 opposite-sex spouses), 5,040 unmarried partners, (4,994 opposite-sex unmarried partners), 68,721 children (63,649 natural, 2,110 adopted, 2,962 stepchildren), 6,734 grandchildren, 2,668 brothers or sisters, 1,714 parents, 0 foster children, 4,183 other relatives, 3,347 non-relatives
- In group quarters: 2,233
Size of family households: 23,614 2-persons, 11,304 3-persons, 13,999 4-persons, 6,138 5-persons, 2,155 6-persons, 1,064 7-or-more-persons.
Size of nonfamily households: 11,732 1-person, 2,823 2-persons, 105 3-persons, 230 4-persons, 63 7-or-more-persons.
34,523 married couples with children.
12,623 single-parent households (2,934 men, 9,689 women).
81.1% of residents of Ellis speak English at home.
17.2% of residents speak Spanish at home (65% speak English very well, 18% speak English well, 14% speak English not well, 3% don't speak English at all).
0.7% of residents speak other Indo-European language at home (89% speak English very well, 8% speak English well, 3% speak English not well).
0.4% of residents speak Asian or Pacific Island language at home (64% speak English very well, 27% speak English well, 8% speak English not well, 1% don't speak English at all).
0.5% of residents speak other language at home (78% speak English very well, 12% speak English well, 10% speak English not well).
In fiscal year 2004:
Federal Government expenditure: $468,376,000 ($3,639 per capita)
Department of Defense expenditure: $15,558,000
Federal direct payments to individuals for retirement and disability: $223,411,000
Federal other direct payments to individuals: $107,400,000
Federal direct payments not to individuals: $6,191,000
Federal grants: $109,951,000
Federal procurement contracts: $6,319,000 ($2,720,000 Department of Defense)
Federal salaries and wages: $15,103,000 ($741,000 Department of Defense)
Federal Government direct loans: $2,279,000
Federal guaranteed/insured loans: $141,812,000
Federal Government insurance: $49,155,000
Population change from April 1, 2000 to July 1, 2005:
Births: 9,870| Here: | 74 per 1000 residents |
| State: | 85 per 1000 residents |
Deaths: 4,740
| Here: | 36 per 1000 residents |
| State: | 35 per 1000 residents |
Net international migration: +2,054
| Here: | +15 per 1000 residents |
| State: | +29 per 1000 residents |
Net internal migration: +15,176
| Here: | +114 per 1000 residents |
| State: | +10 per 1000 residents |

Total withdrawal of fresh water for public supply: 18.24 millions of gallons per day (24% from ground, 76% from surface)
| Here: | 6.5 |
| State: | 6.3 |
| Here: | 4.7 |
| State: | 4.0 |
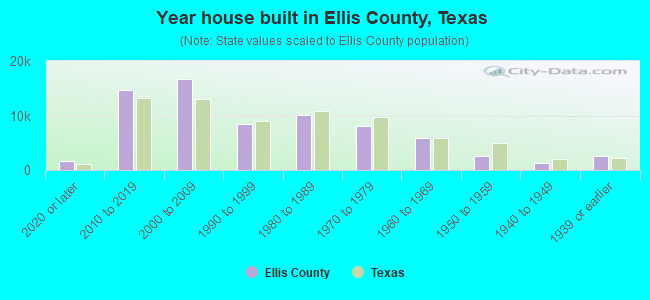
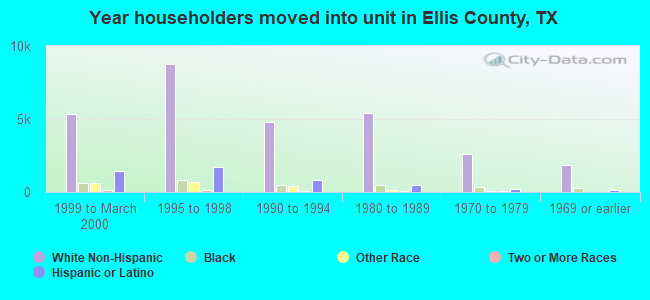
- Year house built in Ellis County, Texas
- 4,6252020 or later
- 17,2292010 to 2019
- 20,0432000 to 2009
- 9,1381990 to 1999
- 8,8061980 to 1989
- 6,5951970 to 1979
- 3,4821960 to 1969
- 2,8081950 to 1959
- 9051940 to 1949
- 2,3851939 or earlier
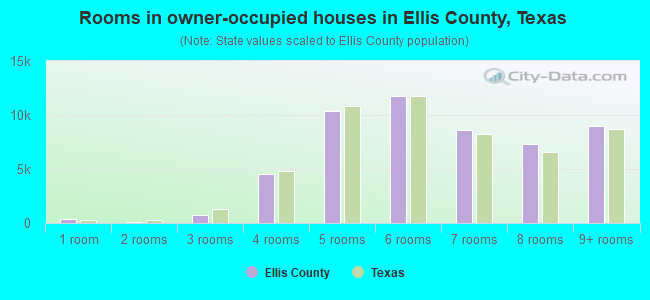
- Rooms in owner-occupied houses in Ellis County, Texas
- 651 room
- 722 rooms
- 7883 rooms
- 3,8384 rooms
- 10,6305 rooms
- 13,1216 rooms
- 11,0637 rooms
- 7,6938 rooms
- 9,8339+ rooms
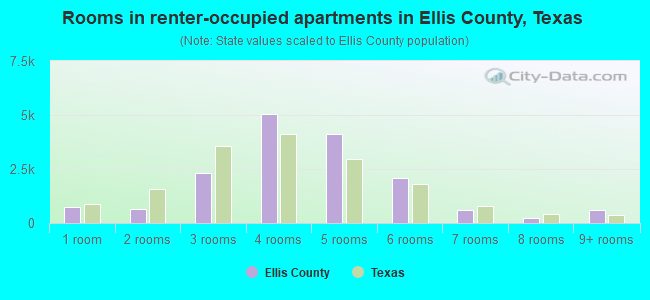
- Rooms in renter-occupied apartments in Ellis County, Texas
- 3961 room
- 1,6982 rooms
- 2,2783 rooms
- 3,0694 rooms
- 3,3615 rooms
- 3,6626 rooms
- 9087 rooms
- 4748 rooms
- 2789+ rooms
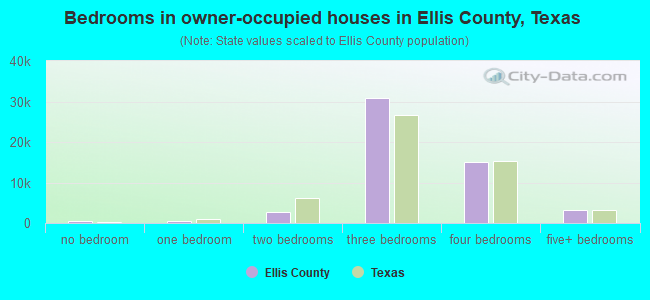
- Bedrooms in owner-occupied houses in Ellis County, Texas
- 191no bedroom
- 3101 bedroom
- 3,5332 bedrooms
- 29,4033 bedrooms
- 21,5024 bedrooms
- 2,1645+ bedrooms
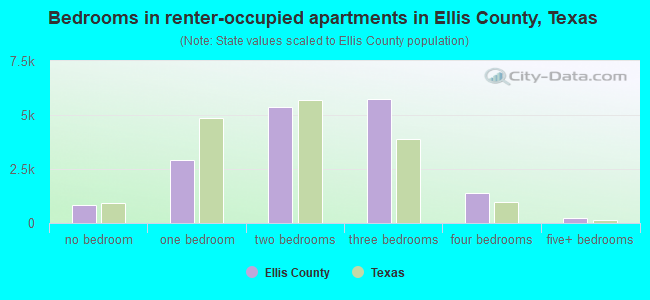
- Bedrooms in renter-occupied apartments in Ellis County, Texas
- 474no bedroom
- 3,2361 bedroom
- 4,9742 bedrooms
- 5,3473 bedrooms
- 2,0934 bedrooms
- 05+ bedrooms
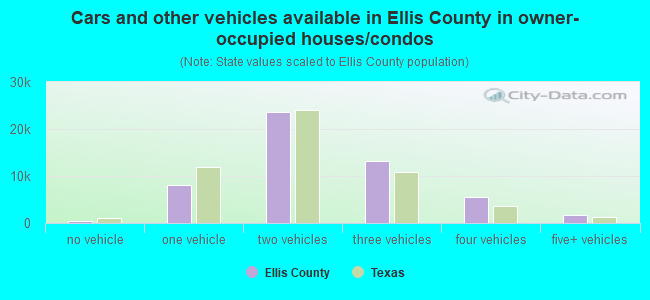
- Cars and other vehicles available in Ellis County in owner-occupied houses/condos
- 1,547no vehicle
- 9,7401 vehicle
- 23,5942 vehicles
- 13,6583 vehicles
- 4,4494 vehicles
- 4,1155+ vehicles
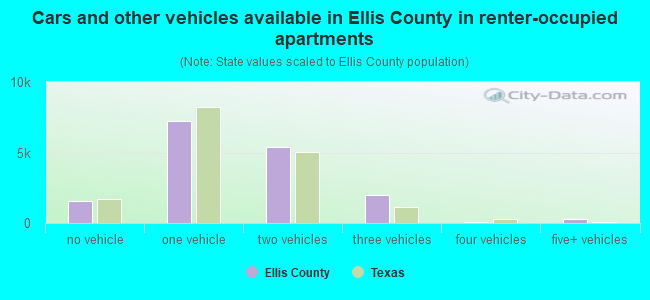
- Cars and other vehicles available in Ellis County in renter-occupied apartments
- 918no vehicle
- 6,4011 vehicle
- 6,1252 vehicles
- 1,5143 vehicles
- 6324 vehicles
- 5345+ vehicles
89.0% of Ellis County residents lived in the same house 1 years ago.
Out of people who lived in different houses, 30% lived in this county.
Out of people who lived in different counties, 81% lived in Texas.
| Ellis County: | 89.0% |
| State average: | 85.7% |
Place of birth for U.S.-born residents:
- This state: 143,487
- Other state: 47,760
- Northeast: 5,332
- Midwest: 12,024
- South: 17,111
- West: 13,293

- 73.1%Electricity
- 20.1%Utility gas
- 5.7%Bottled, tank, or LP gas
- 0.5%No fuel used
- 0.3%Wood
- 0.2%Solar energy
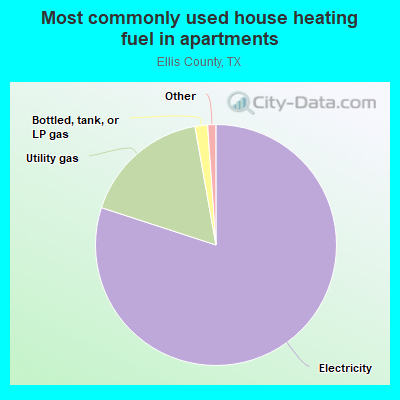
- 81.8%Electricity
- 15.4%Utility gas
- 1.5%Bottled, tank, or LP gas
- 1.1%No fuel used
- 0.2%Fuel oil, kerosene, etc.
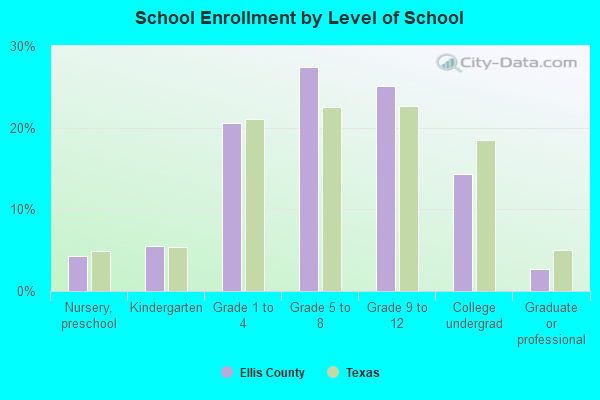
Private vs. public school enrollment:
| Here: | 5.1% |
| Texas: | 8.8% |
| Here: | 5.5% |
| Texas: | 8.0% |
| Here: | 27.0% |
| Texas: | 16.2% |
Ellis County government finances - Expenditure in 2017:
- Charges - Other: $4,282,000
- Current Operations - Correctional Institutions: $10,627,000
Police Protection: $8,693,000
Judicial and Legal Services: $6,214,000
Financial Administration: $6,199,000
Central Staff Services: $2,376,000
Health - Other: $1,952,000
Protective Inspection and Regulation - Other: $1,118,000
General Public Buildings: $510,000
General - Other: $489,000
Natural Resources - Other: $202,000
Local Fire Protection: $153,000
- General - Interest on Debt: $1,972,000
- Local Intergovernmental - Other: $418,000
- Long Term Debt - Beginning Outstanding - Unspecified Public Purpose: $49,299,000
Outstanding Unspecified Public Purpose: $45,782,000
Retired Unspecified Public Purpose: $3,918,000
Issue, Unspecified Public Purpose: $401,000
- Miscellaneous - Fines and Forfeits: $1,223,000
General Revenue - Other: $1,150,000
Interest Earnings: $105,000
- Other Capital Outlay - Police Protection: $314,000
- Other Funds - Cash and Securities: $14,932,000
- State Intergovernmental - General Local Government Support: $200,000
Highways: $43,000
- Tax - Property: $35,068,000
- Total Salaries and Wages: $19,432,000
Ellis County government finances - Revenue in 2017:
- Charges - Other: $4,282,000
- Current Operations - Correctional Institutions: $10,627,000
Police Protection: $8,693,000
Judicial and Legal Services: $6,214,000
Financial Administration: $6,199,000
Central Staff Services: $2,376,000
Health - Other: $1,952,000
Protective Inspection and Regulation - Other: $1,118,000
General Public Buildings: $510,000
General - Other: $489,000
Natural Resources - Other: $202,000
Local Fire Protection: $153,000
- General - Interest on Debt: $1,972,000
- Local Intergovernmental - Other: $418,000
- Long Term Debt - Beginning Outstanding - Unspecified Public Purpose: $49,299,000
Outstanding Unspecified Public Purpose: $45,782,000
Retired Unspecified Public Purpose: $3,918,000
Issue, Unspecified Public Purpose: $401,000
- Miscellaneous - Fines and Forfeits: $1,223,000
General Revenue - Other: $1,150,000
Interest Earnings: $105,000
- Other Capital Outlay - Police Protection: $314,000
- Other Funds - Cash and Securities: $14,932,000
- State Intergovernmental - General Local Government Support: $200,000
Highways: $43,000
- Tax - Property: $35,068,000
- Total Salaries and Wages: $19,432,000
Ellis County government finances - Debt in 2017:
- Charges - Other: $4,282,000
- Current Operations - Correctional Institutions: $10,627,000
Police Protection: $8,693,000
Judicial and Legal Services: $6,214,000
Financial Administration: $6,199,000
Central Staff Services: $2,376,000
Health - Other: $1,952,000
Protective Inspection and Regulation - Other: $1,118,000
General Public Buildings: $510,000
General - Other: $489,000
Natural Resources - Other: $202,000
Local Fire Protection: $153,000
- General - Interest on Debt: $1,972,000
- Local Intergovernmental - Other: $418,000
- Long Term Debt - Beginning Outstanding - Unspecified Public Purpose: $49,299,000
Outstanding Unspecified Public Purpose: $45,782,000
Retired Unspecified Public Purpose: $3,918,000
Issue, Unspecified Public Purpose: $401,000
- Miscellaneous - Fines and Forfeits: $1,223,000
General Revenue - Other: $1,150,000
Interest Earnings: $105,000
- Other Capital Outlay - Police Protection: $314,000
- Other Funds - Cash and Securities: $14,932,000
- State Intergovernmental - General Local Government Support: $200,000
Highways: $43,000
- Tax - Property: $35,068,000
- Total Salaries and Wages: $19,432,000
Ellis County government finances - Cash and Securities in 2017:
- Charges - Other: $4,282,000
- Current Operations - Correctional Institutions: $10,627,000
Police Protection: $8,693,000
Judicial and Legal Services: $6,214,000
Financial Administration: $6,199,000
Central Staff Services: $2,376,000
Health - Other: $1,952,000
Protective Inspection and Regulation - Other: $1,118,000
General Public Buildings: $510,000
General - Other: $489,000
Natural Resources - Other: $202,000
Local Fire Protection: $153,000
- General - Interest on Debt: $1,972,000
- Local Intergovernmental - Other: $418,000
- Long Term Debt - Beginning Outstanding - Unspecified Public Purpose: $49,299,000
Outstanding Unspecified Public Purpose: $45,782,000
Retired Unspecified Public Purpose: $3,918,000
Issue, Unspecified Public Purpose: $401,000
- Miscellaneous - Fines and Forfeits: $1,223,000
General Revenue - Other: $1,150,000
Interest Earnings: $105,000
- Other Capital Outlay - Police Protection: $314,000
- Other Funds - Cash and Securities: $14,932,000
- State Intergovernmental - General Local Government Support: $200,000
Highways: $43,000
- Tax - Property: $35,068,000
- Total Salaries and Wages: $19,432,000
Supplemental Security Income (SSI) in 2006:
- Total number of recipients: 1,928
- Number of aged recipients: 277
- Number of blind and disabled recipients: 1,651
- Number of recipients under 18: 438
- Number of recipients between 18 and 64: 1,078
- Number of recipients older than 64: 412
- Number of recipients also receiving OASDI: 680
- Amount of payments (thousands of dollars): 827
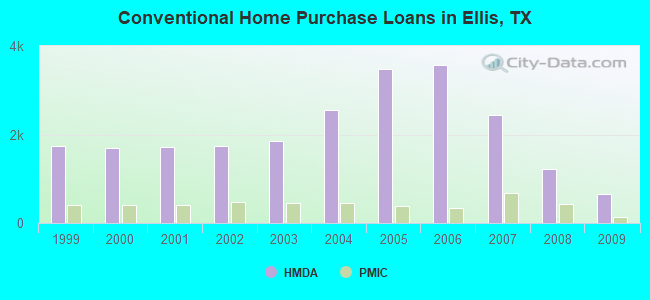
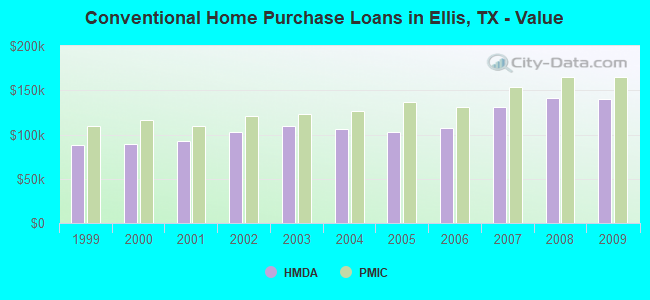
| Home Mortgage Disclosure Act Aggregated Statistics For Year 2009 (Based on 22 full tracts) | ||||||||||||||
| A) FHA, FSA/RHS & VA Home Purchase Loans | B) Conventional Home Purchase Loans | C) Refinancings | D) Home Improvement Loans | E) Loans on Dwellings For 5+ Families | F) Non-occupant Loans on < 5 Family Dwellings (A B C & D) | G) Loans On Manufactured Home Dwelling (A B C & D) | ||||||||
|---|---|---|---|---|---|---|---|---|---|---|---|---|---|---|
| Number | Average Value | Number | Average Value | Number | Average Value | Number | Average Value | Number | Average Value | Number | Average Value | Number | Average Value | |
| LOANS ORIGINATED | 876 | $144,864 | 665 | $139,591 | 1,808 | $156,884 | 216 | $44,667 | 6 | $1,357,500 | 209 | $91,182 | 73 | $66,959 |
| APPLICATIONS APPROVED, NOT ACCEPTED | 55 | $140,491 | 68 | $135,103 | 218 | $146,601 | 30 | $28,567 | 0 | $0 | 14 | $101,071 | 21 | $67,190 |
| APPLICATIONS DENIED | 171 | $135,269 | 182 | $120,000 | 900 | $148,522 | 196 | $47,112 | 2 | $1,652,500 | 61 | $89,869 | 80 | $58,025 |
| APPLICATIONS WITHDRAWN | 92 | $152,815 | 113 | $157,628 | 468 | $158,190 | 39 | $63,872 | 1 | $3,080,000 | 29 | $101,276 | 12 | $66,833 |
| FILES CLOSED FOR INCOMPLETENESS | 23 | $128,174 | 26 | $121,385 | 116 | $159,888 | 16 | $93,312 | 0 | $0 | 9 | $88,000 | 7 | $53,857 |
| Private Mortgage Insurance Companies Aggregated Statistics For Year 2009 (Based on 21 full tracts) | ||||||
| A) Conventional Home Purchase Loans | B) Refinancings | C) Non-occupant Loans on < 5 Family Dwellings (A & B) | ||||
|---|---|---|---|---|---|---|
| Number | Average Value | Number | Average Value | Number | Average Value | |
| LOANS ORIGINATED | 137 | $164,489 | 103 | $178,214 | 1 | $178,000 |
| APPLICATIONS APPROVED, NOT ACCEPTED | 49 | $176,286 | 35 | $199,229 | 4 | $186,500 |
| APPLICATIONS DENIED | 38 | $219,211 | 36 | $213,167 | 2 | $150,000 |
| APPLICATIONS WITHDRAWN | 13 | $229,154 | 9 | $156,556 | 0 | $0 |
| FILES CLOSED FOR INCOMPLETENESS | 3 | $233,667 | 3 | $141,000 | 0 | $0 |
| Most common first names in Ellis County, TX among deceased individuals | ||
| Name | Count | Lived (average) |
|---|---|---|
| Mary | 583 | 80.0 years |
| James | 557 | 72.8 years |
| John | 485 | 76.2 years |
| William | 463 | 74.9 years |
| Robert | 319 | 72.1 years |
| Willie | 252 | 77.5 years |
| Joe | 231 | 73.8 years |
| Charles | 212 | 73.1 years |
| George | 205 | 76.5 years |
| Annie | 178 | 83.7 years |
| Most common last names in Ellis County, TX among deceased individuals | ||
| Last name | Count | Lived (average) |
|---|---|---|
| Smith | 255 | 75.3 years |
| Williams | 209 | 74.4 years |
| Jones | 187 | 73.8 years |
| Davis | 178 | 76.0 years |
| Brown | 176 | 77.3 years |
| Johnson | 176 | 72.9 years |
| Moore | 126 | 75.6 years |
| Wilson | 111 | 77.6 years |
| Jackson | 110 | 76.3 years |
| Taylor | 110 | 75.2 years |
| Businesses in Ellis County, TX | ||||
| Name | Count | Name | Count | |
|---|---|---|---|---|
| 7-Eleven | 1 | Lane Furniture | 3 | |
| AT&T | 3 | Little Caesars Pizza | 1 | |
| Applebee's | 1 | Long John Silver's | 1 | |
| Arby's | 1 | Lowe's | 1 | |
| AutoZone | 3 | MasterBrand Cabinets | 4 | |
| Baymont Inn | 1 | Maurices | 1 | |
| Blockbuster | 1 | McDonald's | 6 | |
| Burger King | 2 | Nike | 4 | |
| CVS | 3 | Office Depot | 1 | |
| Chevrolet | 2 | Olive Garden | 1 | |
| Chick-Fil-A | 1 | Panda Express | 1 | |
| Church's Chicken | 2 | Papa John's Pizza | 1 | |
| Circle K | 3 | Payless | 1 | |
| ColorTyme | 2 | Penske | 1 | |
| Curves | 1 | PetSmart | 1 | |
| Dairy Queen | 1 | Pizza Hut | 3 | |
| Days Inn | 1 | Quality | 1 | |
| Dennys | 1 | Quiznos | 1 | |
| Discount Tire | 1 | RadioShack | 3 | |
| Domino's Pizza | 1 | Rue21 | 1 | |
| Famous Footwear | 1 | Ryan's Grill | 1 | |
| FedEx | 12 | SONIC Drive-In | 5 | |
| Firestone Complete Auto Care | 1 | Sears | 1 | |
| Ford | 2 | Sprint Nextel | 2 | |
| GNC | 1 | Starbucks | 3 | |
| GameStop | 3 | Subway | 7 | |
| H&R Block | 3 | Super 8 | 2 | |
| Holiday Inn | 2 | T-Mobile | 7 | |
| Home Depot | 2 | Taco Bell | 3 | |
| IHOP | 3 | Target | 1 | |
| JCPenney | 1 | U-Haul | 8 | |
| Jack In The Box | 4 | UPS | 9 | |
| Jones New York | 1 | Waffle House | 3 | |
| KFC | 2 | Walgreens | 3 | |
| Knights Inn | 1 | Walmart | 3 | |
| La Quinta | 2 | Wendy's | 2 | |
Ellis County on our top lists:
- #38 on the list of "Top 101 counties with the lowest Nitrogen Dioxide air pollution readings in 2012 (ppm)"
- #57 on the list of "Top 101 counties with highest percentage of residents voting for Romney (Republican) in the 2012 Presidential Election (pop. 50,000+)"
- #87 on the list of "Top 101 counties with the largest decrease in the number of births per 1000 residents 2000-2006 to 2007-2013 (pop 50,000+)"