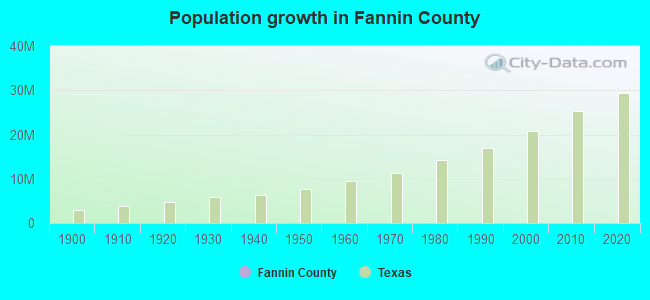
Fannin County, Texas (TX)
County owner-occupied free and clear houses and condos in 2010: 4,326
County owner-occupied houses and condos in 2000: 8,291
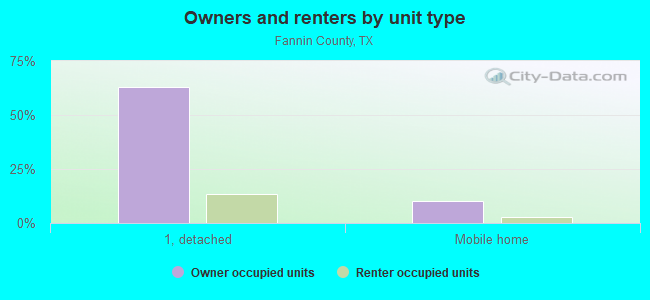
Renter-occupied apartments: 3,159 (it was 2,814 in 2000)
| % of renters here: | 25% |
| State: | 36% |
Land area: 891 sq. mi.
Water area: 7.7 sq. mi.
Population density: 42 people per square mile (average).
Industries providing employment: Educational, health and social services (20.0%), Manufacturing (15.8%).
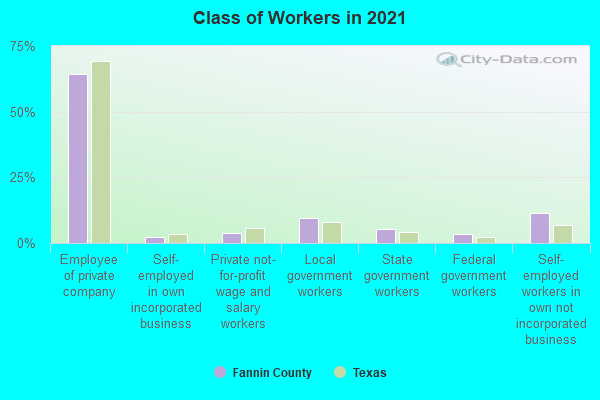
Type of workers:
- Private wage or salary: 69%
- Government: 19%
- Self-employed, not incorporated: 12%
- Unpaid family work: 0%
- OSM Map
- General Map
- Google Map
- MSN Map

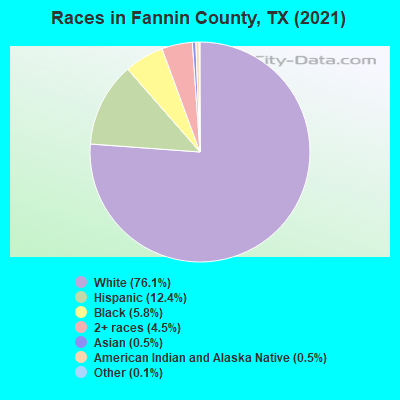
- 27,62975.7%White Non-Hispanic Alone
- 4,71512.9%Hispanic or Latino
- 2,1996.0%Black Non-Hispanic Alone
- 1,5744.3%Two or more races
- 1710.5%Asian alone
- 1390.4%American Indian and Alaska Native alone
- 370.1%Some other race alone
- 290.08%Native Hawaiian and Other
Pacific Islander alone
| Median resident age: | 40.9 years |
| Texas median age: | 35.6 years |
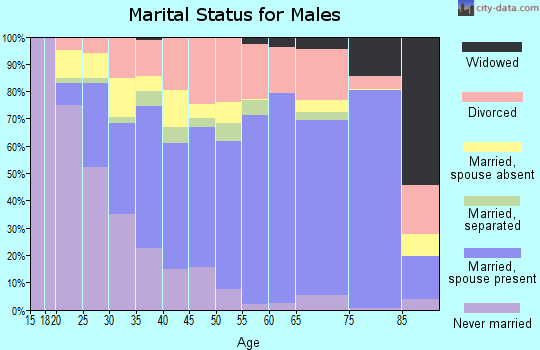
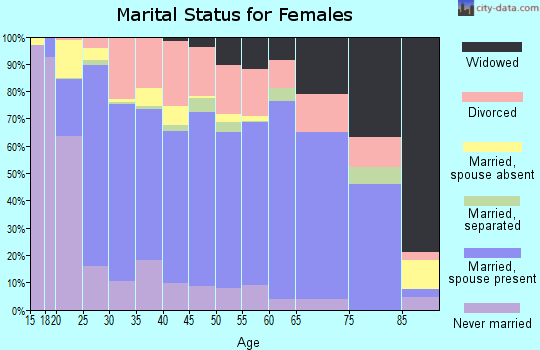
| Males: 19,751 | |
| Females: 17,270 |

 | So, is the Texas power grid 'fixed'? (763 replies) |
| When will Sherman/Denison Be In DFW Metro? (68 replies) |
| Texas now has 4 cities over 1 million (81 replies) |
| Looks like the Metroplex is about to officially reach Oklahoma... (31 replies) |
| Texas County Courthouses (13 replies) |
| A place to retire and Bass Fish (50 replies) |
| Fannin County: | 2.0 people |
| Texas: | 3 people |
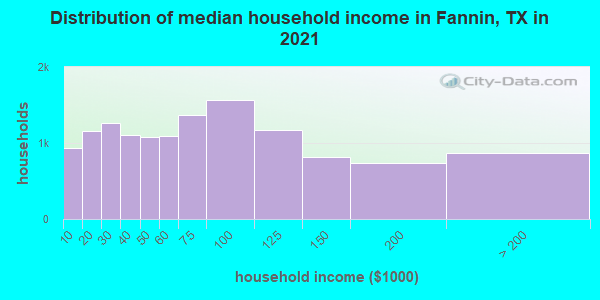
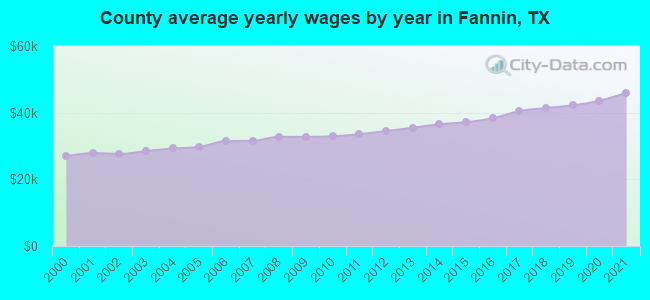
Estimated median household income in 2022: $65,158 ($34,501 in 1999)
| This county: | $65,158 |
| Texas: | $72,284 |
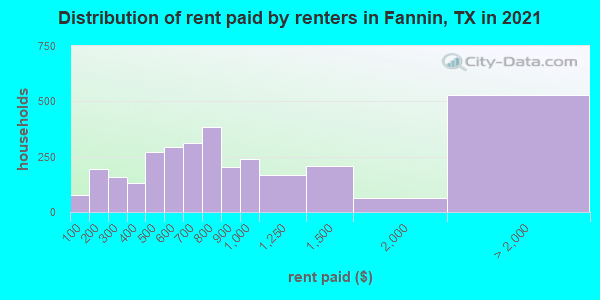
Median contract rent in 2022 for apartments: $765 (lower quartile is $476, upper quartile is $1,002)
| This county: | $765 |
| State: | $1117 |
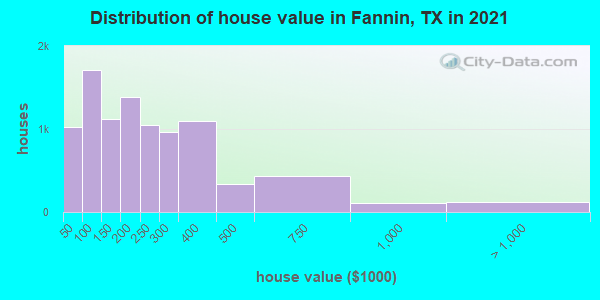
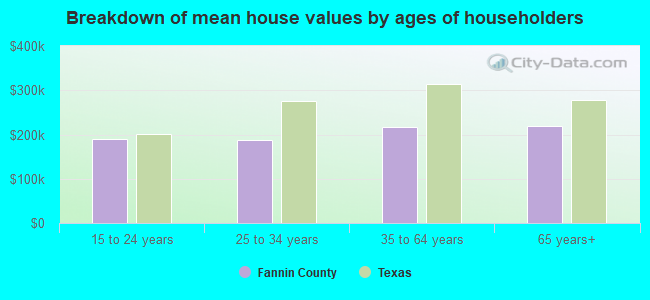
Estimated median house or condo value in 2022: $223,560 (it was $58,200 in 2000)
| Fannin: | $223,560 |
| Texas: | $275,400 |
Mean price in 2022:
Median monthly housing costs for homes and condos with a mortgage: $1,548Detached houses: $293,173
Here: $293,173 State: $369,058 Townhouses or other attached units: $156,551
Here: $156,551 State: $327,631 In 2-unit structures: $327,459
Here: $327,459 State: $374,947 Mobile homes: $219,383
Here: $219,383 State: $124,413 Occupied boats, RVs, vans, etc.: $100,685
Here: $100,685 State: $73,921
Median monthly housing costs for units without a mortgage: $576
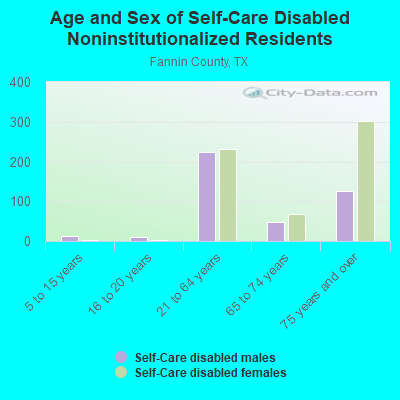
Institutionalized population: 2,952
Crime in 2021 (reported by the sheriff's office or county police, not the county total):
- Murders: 1
- Rapes: 13
- Robberies: 2
- Assaults: 35
- Burglaries: 25
- Thefts: 89
- Auto thefts: 15
Crime in 2020 (reported by the sheriff's office or county police, not the county total):
- Murders: 0
- Rapes: 8
- Robberies: 2
- Assaults: 38
- Burglaries: 36
- Thefts: 104
- Auto thefts: 14
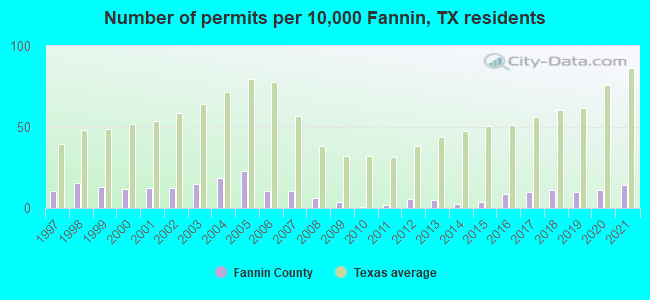
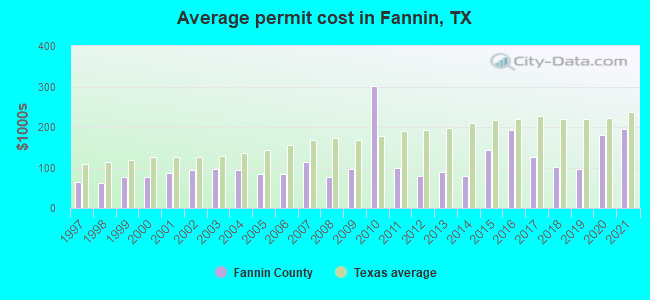
Single-family new house construction building permits:
- 2022: 63 buildings, average cost: $229,600
- 2021: 45 buildings, average cost: $195,800
- 2020: 34 buildings, average cost: $180,600
- 2019: 30 buildings, average cost: $97,300
- 2018: 34 buildings, average cost: $101,400
- 2017: 31 buildings, average cost: $126,800
- 2016: 27 buildings, average cost: $193,400
- 2015: 11 buildings, average cost: $144,000
- 2014: 7 buildings, average cost: $80,000
- 2013: 15 buildings, average cost: $88,700
- 2012: 17 buildings, average cost: $77,800
- 2011: 6 buildings, average cost: $97,900
- 2010: 1 building, cost: $300,000
- 2009: 11 buildings, average cost: $96,100
- 2008: 19 buildings, average cost: $76,200
- 2007: 33 buildings, average cost: $112,600
- 2006: 33 buildings, average cost: $83,500
- 2005: 71 buildings, average cost: $83,500
- 2004: 58 buildings, average cost: $92,500
- 2003: 46 buildings, average cost: $97,400
- 2002: 38 buildings, average cost: $93,700
- 2001: 38 buildings, average cost: $87,100
- 2000: 36 buildings, average cost: $77,100
- 1999: 40 buildings, average cost: $76,500
- 1998: 49 buildings, average cost: $60,900
- 1997: 32 buildings, average cost: $65,300
Median real estate property taxes paid for housing units with mortgages in 2022: $2,713 (1.1%)
Median real estate property taxes paid for housing units with no mortgage in 2022: $1,860 (1.0%)
| Fannin County: | 12.9% |
| Texas: | 14.0% |
Median age of residents in 2022: 40.9 years old
(Males: 40.0 years old, Females: 42.8 years old)
(Median age for: White residents: 44.2 years old, Black residents: 37.2 years old, American Indian residents: 65.2 years old, Asian residents: 30.2 years old, Hispanic or Latino residents: 28.4 years old, Other race residents: 37.6 years old)
Fair market rent in 2006 for a 1-bedroom apartment in Fannin County is $423 a month.
Fair market rent for a 2-bedroom apartment is $504 a month.
Fair market rent for a 3-bedroom apartment is $628 a month.
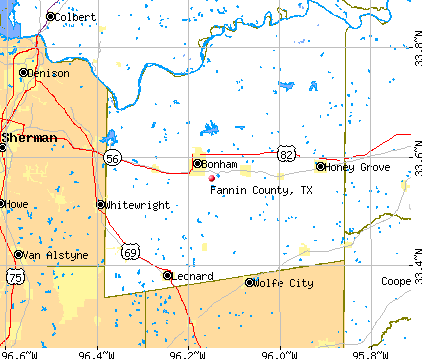
Cities in this county include: Bonham, Ravenna-Telephone, Leonard, Honey Grove, Ivanhoe, Savoy, Ladonia, Trenton, Ector, Dodd City.
Neighboring counties: Bradley County, Arkansas  , Etowah County, Alabama , Orange County, California
  , Marshall County, Oklahoma
  , Madison County, Georgia .
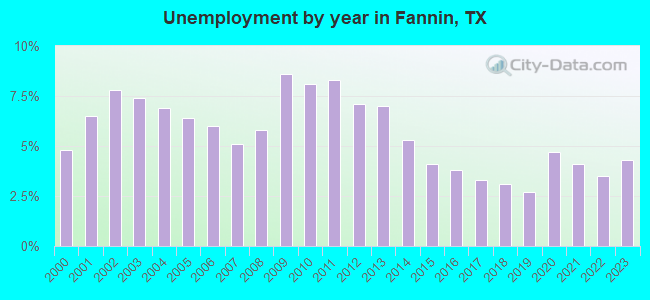
| Here: | 2.8% |
| Texas: | 3.5% |
Current college students: 945
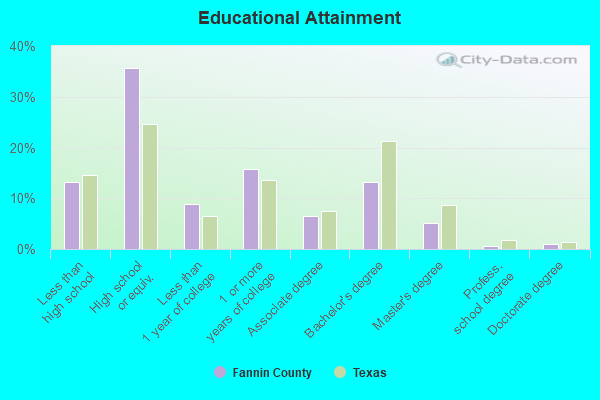
People 25 years of age or older with a high school degree or higher: 85.7%
People 25 years of age or older with a bachelor's degree or higher: 20.6%
Number of foreign born residents: 1,696 (34.0% naturalized citizens)
| Fannin County: | 4.6% |
| Whole state: | 17.2% |
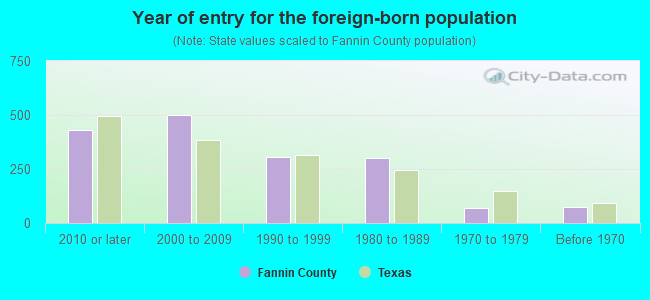
- Year of entry for the foreign-born population
- 2482010 or later
- 7032000 to 2009
- 2691990 to 1999
- 3031980 to 1989
- 701970 to 1979
- 75Before 1970
Mean travel time to work (commute): minutes
Percentage of county residents living and working in this county: 98.9%
Housing units in structures:
- One, detached: 11,618
- One, attached: 181
- Two: 341
- 3 or 4: 369
- 5 to 9: 248
- 10 to 19: 124
- 20 to 49: 81
- 50 or more: 77
- Mobile homes: 2,026
- Boats, RVs, vans, etc.: 73
Housing units in Fannin County with a mortgage: 4,593 (61 second mortgage, 12 home equity loan, 22 both second mortgage and home equity loan)
Houses without a mortgage: 6
| Here: | 40.0% with mortgage |
| State: | 98.4% with mortgage |
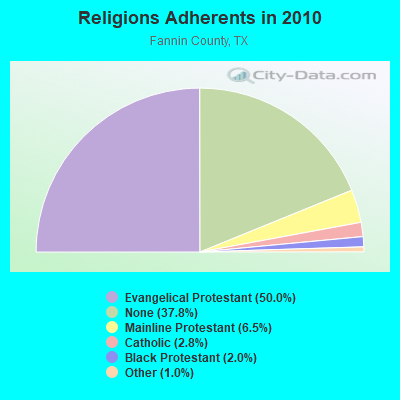
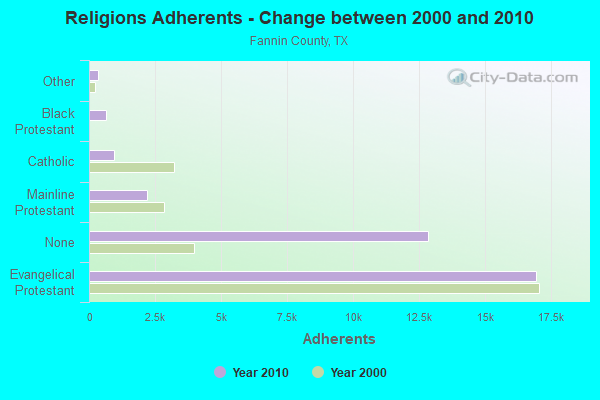
Religion statistics for Fannin County
| Religion | Adherents | Congregations |
|---|---|---|
| Evangelical Protestant | 16,946 | 83 |
| Mainline Protestant | 2,189 | 23 |
| Catholic | 943 | 1 |
| Black Protestant | 663 | 4 |
| Other | 343 | 3 |
| None | 12,831 | - |
Source: Clifford Grammich, Kirk Hadaway, Richard Houseal, Dale E.Jones, Alexei Krindatch, Richie Stanley and Richard H.Taylor. 2012. 2010 U.S.Religion Census: Religious Congregations & Membership Study. Association of Statisticians of American Religious Bodies. Jones, Dale E., et al. 2002. Congregations and Membership in the United States 2000. Nashville, TN: Glenmary Research Center.
Food Environment Statistics:
| Fannin County: | 1.21 / 10,000 pop. |
| State: | 1.47 / 10,000 pop. |
| Here: | 0.30 / 10,000 pop. |
| Texas: | 0.14 / 10,000 pop. |
| This county: | 0.61 / 10,000 pop. |
| Texas: | 1.11 / 10,000 pop. |
| Fannin County: | 4.56 / 10,000 pop. |
| Texas: | 3.95 / 10,000 pop. |
| This county: | 3.64 / 10,000 pop. |
| State: | 6.13 / 10,000 pop. |
| Fannin County: | 9.9% |
| Texas: | 8.9% |
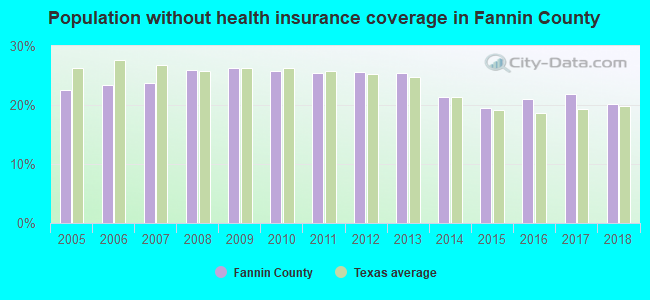
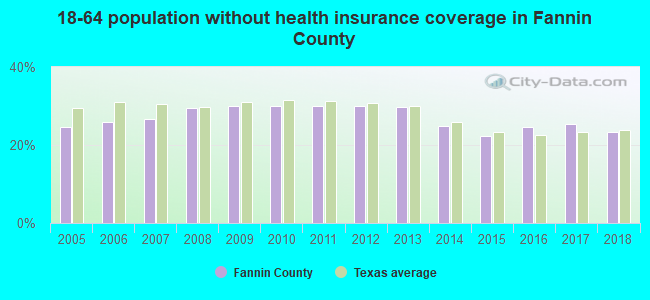
| Fannin County: | 25.3% |
| State: | 26.6% |
| Here: | 12.2% |
| State: | 15.7% |
Agriculture in Fannin County:
Average size of farms: 245 acresAverage value of agricultural products sold per farm: $29,030
Average value of crops sold per acre for harvested cropland: $122.53
The value of nursery, greenhouse, floriculture, and sod as a percentage of the total market value of agricultural products sold: 9.22%
The value of livestock, poultry, and their products as a percentage of the total market value of agricultural products sold: 65.69%
Average total farm production expenses per farm: $28,807
Harvested cropland as a percentage of land in farms: 33.23%
Irrigated harvested cropland as a percentage of land in farms: 3.78%
Average market value of all machinery and equipment per farm: $30,266
The percentage of farms operated by a family or individual: 95.04%
Average age of principal farm operators: 56 years
Average number of cattle and calves per 100 acres of all land in farms: 18.41
Milk cows as a percentage of all cattle and calves: 0.26%
Corn for grain: 16773 harvested acres
All wheat for grain: 40805 harvested acres
Upland cotton: 144 harvested acres
Soybeans for beans: 11775 harvested acres
Vegetables: 12 harvested acres
Land in orchards: 1,240 acres
Earthquake activity:
Fannin County-area historical earthquake activity is significantly above Texas state average. It is 547% greater than the overall U.S. average.On 11/6/2011 at 03:53:10, a magnitude 5.7 (5.7 MW, Depth: 3.2 mi, Class: Moderate, Intensity: VI - VII) earthquake occurred 140.9 miles away from Fannin County center
On 9/3/2016 at 12:02:44, a magnitude 5.8 (5.8 MW, Depth: 3.5 mi) earthquake occurred 203.1 miles away from the county center
On 11/7/2016 at 01:44:24, a magnitude 5.0 (5.0 MW, Depth: 2.8 mi) earthquake occurred 172.3 miles away from the county center
On 9/6/1997 at 23:38:00, a magnitude 4.5 (4.5 LG, 4.2 LG, Depth: 3.1 mi, Class: Light, Intensity: IV - V) earthquake occurred 77.9 miles away from the county center
On 11/8/2011 at 02:46:57, a magnitude 4.8 (4.8 MW, Depth: 3.1 mi) earthquake occurred 141.2 miles away from Fannin County center
On 11/5/2011 at 07:12:45, a magnitude 4.8 (4.8 MW, Depth: 1.9 mi) earthquake occurred 142.1 miles away from the county center
Magnitude types: regional Lg-wave magnitude (LG), moment magnitude (MW)
Most recent natural disasters:
- Texas Covid-19 Pandemic, Incident Period: January 20, 2020, FEMA Id: 4485, Natural disaster type: Other
- Texas Severe Storms And Flooding, Incident Period: September 10, 2018 - November 2, 2018, FEMA Id: 4416, Natural disaster type: Storm, Flood
- Texas Severe Storms, Tornadoes, Straight-line Winds, and Flooding, Incident Period: May 04, 2015 to June 23, 2015, Major Disaster (Presidential) Declared DR-4223: May 29, 2015, FEMA Id: 4223, Natural disaster type: Storm, Tornado, Flood, Wind
- Texas Wildfires, Incident Period: March 14, 2008 to September 01, 2008, Emergency Declared EM-3284: March 14, 2008, FEMA Id: 3284, Natural disaster type: Fire
- Texas Severe Storms, Tornadoes, and Flooding, Incident Period: June 16, 2007 to August 03, 2007, Major Disaster (Presidential) Declared DR-1709: June 29, 2007, FEMA Id: 1709, Natural disaster type: Storm, Tornado, Flood
- Texas Hurricane Rita, Incident Period: September 23, 2005 to October 14, 2005, Major Disaster (Presidential) Declared DR-1606: September 24, 2005, FEMA Id: 1606, Natural disaster type: Hurricane
- Texas Hurricane Rita, Incident Period: September 20, 2005 to October 14, 2005, Emergency Declared EM-3261: September 21, 2005, FEMA Id: 3261, Natural disaster type: Hurricane
- Texas Hurricane Katrina, Incident Period: August 29, 2005 to October 01, 2005, Emergency Declared EM-3216: September 02, 2005, FEMA Id: 3216, Natural disaster type: Hurricane
- Texas Severe Winter Storm, Incident Period: December 12, 2000 to January 15, 2001, Major Disaster (Presidential) Declared DR-1356: January 08, 2001, FEMA Id: 1356, Natural disaster type: Winter Storm
- Texas Extreme Fire Hazards, Incident Period: August 01, 1999 to December 10, 1999, Emergency Declared EM-3142: September 01, 1999, FEMA Id: 3142, Natural disaster type: Fire
- 4 other natural disasters have been reported since 1953.
The number of natural disasters in Fannin County (14) is near the US average (15).
Major Disasters (Presidential) Declared: 8
Emergencies Declared: 4
Causes of natural disasters: Floods: 7, Storms: 6, Tornadoes: 4, Hurricanes: 3, Fires: 2, Heavy Rain: 1, Wind: 1, Winter Storm: 1, Other: 1 (Note: some incidents may be assigned to more than one category).
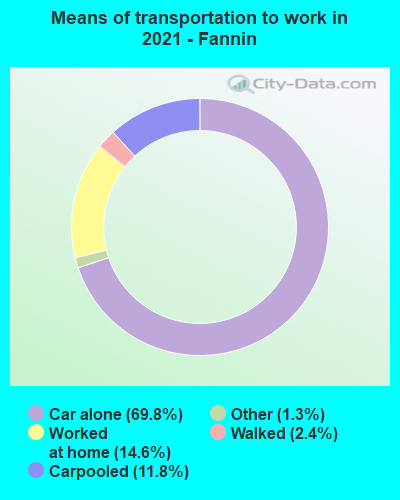
Means of transportation to work:
- Drove a car alone: 7,419 (66.1%)
- Carpooled: 1,343 (12.0%)
- Bus: 2 (0.0%)
- Taxicab, motorcycle, or other means: 172 (1.5%)
- Walked: 232 (2.1%)
- Worked at home: 2,257 (20.1%)
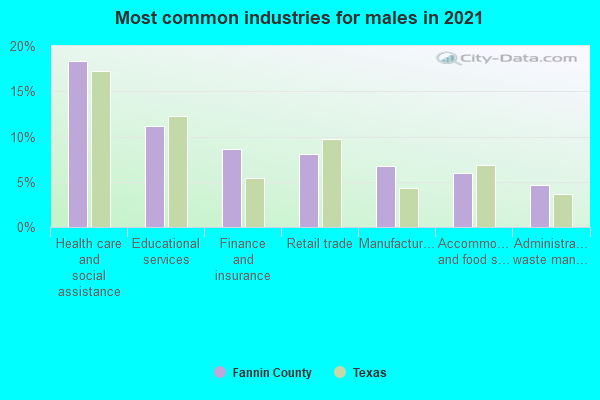
- Health care and social assistance (16%)
- Educational services (12%)
- Finance and insurance (8%)
- Retail trade (8%)
- Manufacturing (7%)
- Accommodation and food services (6%)
- Other services, except public administration (5%)
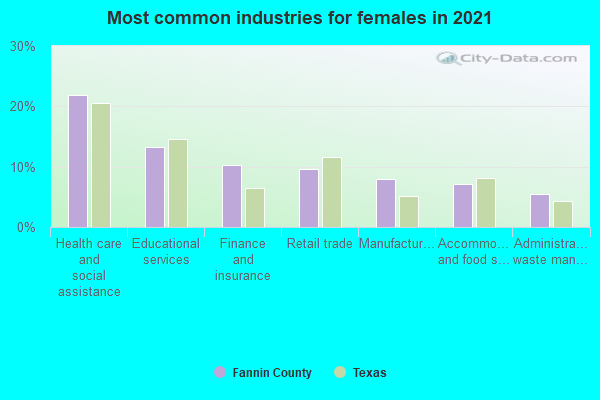
- Health care and social assistance (19%)
- Educational services (14%)
- Finance and insurance (10%)
- Retail trade (10%)
- Manufacturing (9%)
- Accommodation and food services (7%)
- Other services, except public administration (6%)
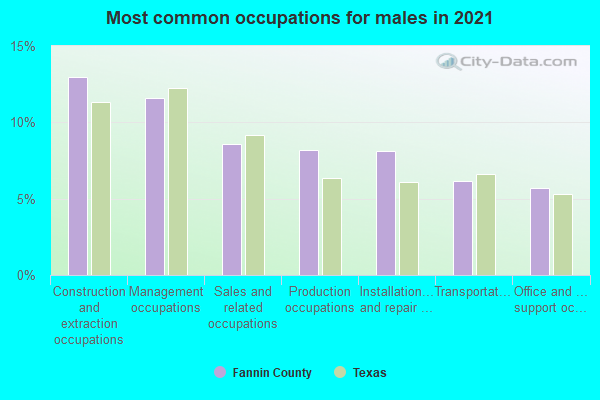
- Construction and extraction occupations (13%)
- Management occupations (12%)
- Production occupations (9%)
- Sales and related occupations (8%)
- Installation, maintenance, and repair occupations (8%)
- Office and administrative support occupations (6%)
- Transportation occupations (6%)
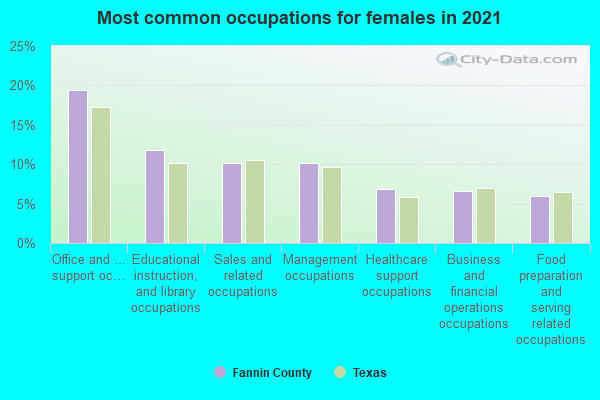
- Office and administrative support occupations (19%)
- Educational instruction, and library occupations (13%)
- Management occupations (11%)
- Sales and related occupations (10%)
- Food preparation and serving related occupations (6%)
- Business and financial operations occupations (6%)
- Health diagnosing and treating practitioners and other technical occupations (5%)
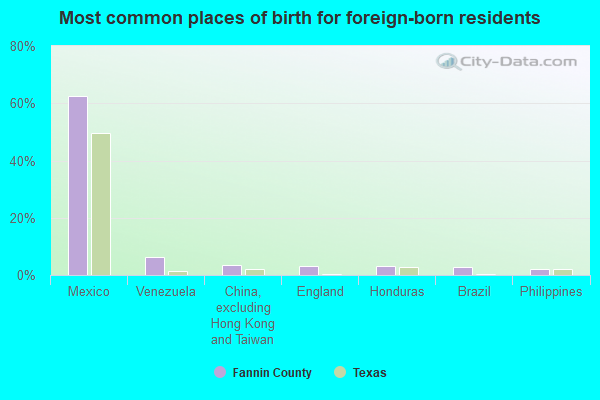
- Mexico (70%)
- China, excluding Hong Kong and Taiwan (3%)
- Brazil (2%)
- England (2%)
- Honduras (2%)
- Burma (Myanmar) (2%)
- Romania (2%)
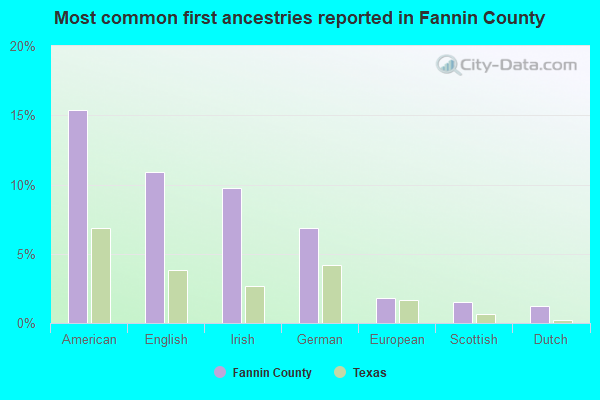
- English (12%)
- American (11%)
- Irish (9%)
- German (8%)
- Scottish (1%)
- European (1%)
- Italian (1%)
People in group quarters in Fannin County, Texas in 2010:
- 2,030 people in state prisons
- 576 people in nursing facilities/skilled-nursing facilities
- 346 people in local jails and other municipal confinement facilities
- 179 people in residential treatment centers for adults
- 14 people in group homes intended for adults
People in group quarters in Fannin County, Texas in 2000:
- 2,627 people in state prisons
- 516 people in nursing homes
- 198 people in hospitals or wards for drug/alcohol abuse
- 22 people in local jails and other confinement facilities (including police lockups)
- 11 people in other group homes
- 3 people in homes for the mentally retarded
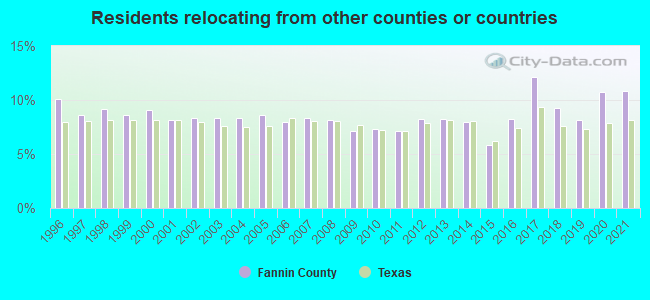
10.86% of this county's 2021 resident taxpayers lived in other counties in 2020 ($56,812 average adjusted gross income)
| Here: | 10.86% |
| Texas average: | 8.12% |
10 or fewer of this county's residents moved from foreign countries.
9.08% relocated from other counties in Texas ($49,020 average AGI)
1.77% relocated from other states ($7,792 average AGI)
Fannin County: 1.77% Texas average: 2.83%
Top counties from which taxpayers relocated into this county between 2020 and 2021:
| from Collin County, TX | |
| from Grayson County, TX | |
| from Dallas County, TX | |
| from Denton County, TX | |
| from Hunt County, TX | |
| from Tarrant County, TX | |
| from Lamar County, TX |
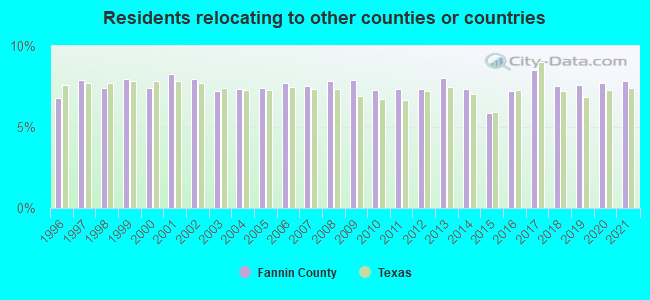
7.83% of this county's 2020 resident taxpayers moved to other counties in 2021 ($48,631 average adjusted gross income)
| Here: | 7.83% |
| Texas average: | 7.40% |
10 or fewer of this county's residents moved to foreign countries.
6.13% relocated to other counties in Texas ($38,906 average AGI)
1.70% relocated to other states ($9,725 average AGI)
Fannin County: 1.70% Texas average: 2.08%
Top counties to which taxpayers relocated from this county between 2020 and 2021:
| to Grayson County, TX | |
| to Collin County, TX | |
| to Dallas County, TX | |
| to Hunt County, TX | |
| to Lamar County, TX | |
| to Tarrant County, TX |
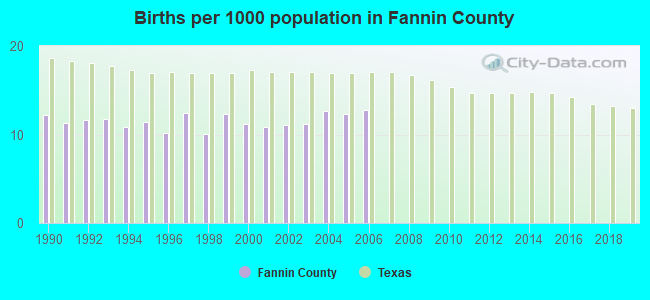
Births per 1000 population from 1990 to 1999: 11.4
Births per 1000 population from 2000 to 2006: 11.7
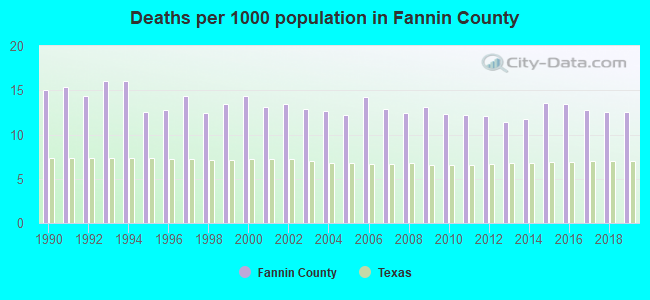
Deaths per 1000 population from 1990 to 1999: 14.2
Deaths per 1000 population from 2000 to 2009: 13.1
Deaths per 1000 population from 2010 to 2020: 12.6
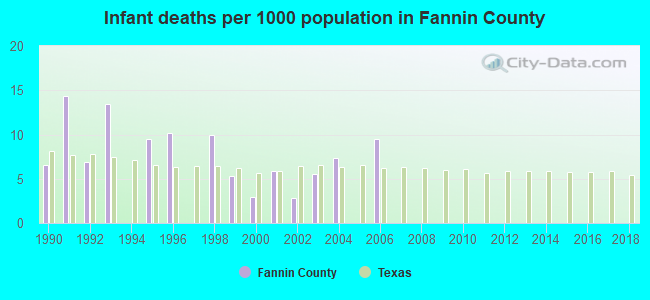
Infant deaths per 1000 live births from 1990 to 1999: 7.6
Infant deaths per 1000 live births from 2000 to 2006: 4.8
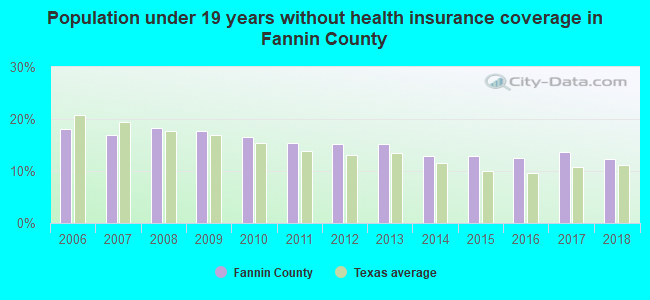
Persons under 19 years old without health insurance coverage in 2018: 12.3%
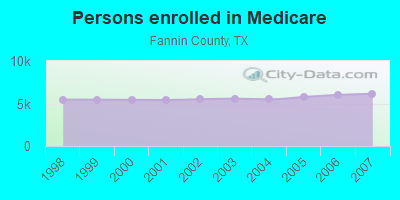
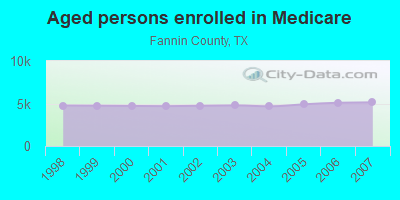
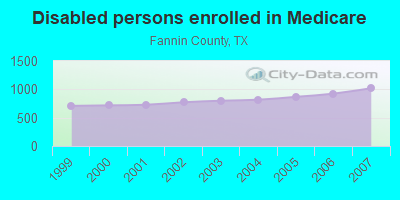
Persons enrolled in hospital insurance and/or supplemental medical insurance (Medicare) in July 1, 2007: 6,157 (5,137 aged, 1,020 disabled)
Children under 18 without health insurance coverage in 2007: 1,181 (16%)
Most common underlying causes of death in Fannin County, Texas in 1999 - 2019:
- Acute myocardial infarction, unspecified (1,434)
- Bronchus or lung, unspecified - Malignant neoplasms (539)
- Atherosclerotic heart disease (460)
- Chronic obstructive pulmonary disease, unspecified (452)
- Alzheimer disease, unspecified (442)
- Congestive heart failure (372)
- Stroke, not specified as haemorrhage or infarction (234)
- Unspecified dementia (215)
- Pneumonia, unspecified (110)
- Colon, unspecified - Malignant neoplasms (11)
Population without health insurance coverage in 2000: 16%
Children under 18 without health insurance coverage in 2000: 15%
Short term general hospital admissions per 100,000 population in 2004: 3,624
Short term general hospital beds per 100,000 population in 2004: 120
Emergency room visits per 100,000 population in 2004: 22,370
General practice office based MDs per 100,000 population in 2005: 1,316
Medical specialist MDs per 100,000 population in 2005: 1,367
Dentists per 100,000 population in 1998: 3
Total births per 100,000 population, July 2005 - July 2006 : 11
Total deaths per 100,000 population, July 2005 - July 2006: 42
Limited-service eating places per 100,000 population in 2005 : 3
Suicides per 1,000,000 population from 2000 to 2006: 156.3. This is more than state average.
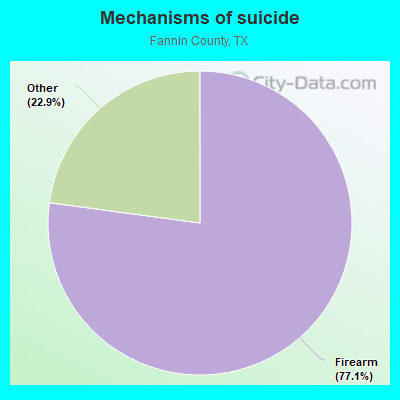
- Firearm - 120.5
- Other - 35.7
Household type by relationship:
Households: 37,021- Male householders: 6,725 (1,769 living alone), Female householders: 6,696 (2,027 living alone)
6,888 spouses (6,823 opposite-sex spouses), 948 unmarried partners, (926 opposite-sex unmarried partners), 9,414 children (8,307 natural, 262 adopted, 849 stepchildren), 1,199 grandchildren, 455 brothers or sisters, 394 parents, 28 foster children, 502 other relatives, 692 non-relatives
- In group quarters: 3,105
Size of family households: 4,004 2-persons, 1,587 3-persons, 2,084 4-persons, 823 5-persons, 451 6-persons, 197 7-or-more-persons.
Size of nonfamily households: 3,796 1-person, 420 2-persons, 18 3-persons, 14 4-persons, 11 7-or-more-persons.
4,945 married couples with children.
1,406 single-parent households (379 men, 1,027 women).
89.6% of residents of Fannin speak English at home.
9.4% of residents speak Spanish at home (65% speak English very well, 20% speak English well, 10% speak English not well, 5% don't speak English at all).
0.5% of residents speak other Indo-European language at home (72% speak English very well, 16% speak English well, 11% speak English not well).
0.3% of residents speak Asian or Pacific Island language at home (52% speak English very well, 3% speak English well, 45% speak English not well).
0.1% of residents speak other language at home (100% speak English very well).
In fiscal year 2004:
Federal Government expenditure: $474,737,000 ($14,554 per capita)
Department of Defense expenditure: $261,258,000
Federal direct payments to individuals for retirement and disability: $90,509,000
Federal other direct payments to individuals: $45,628,000
Federal direct payments not to individuals: $5,400,000
Federal grants: $47,507,000
Federal procurement contracts: $3,772,000 ($847,000 Department of Defense)
Federal salaries and wages: $281,922,000 ($256,548,000 Department of Defense)
Federal Government direct loans: $641,000
Federal guaranteed/insured loans: $9,416,000
Federal Government insurance: $14,490,000
Population change from April 1, 2000 to July 1, 2005:
Births: 1,844| Here: | 56 per 1000 residents |
| State: | 85 per 1000 residents |
Deaths: 2,251
| Here: | 68 per 1000 residents |
| State: | 35 per 1000 residents |
Net international migration: +168
| Here: | +5 per 1000 residents |
| State: | +29 per 1000 residents |
Net internal migration: +2,222
| Here: | +67 per 1000 residents |
| State: | +10 per 1000 residents |
Total withdrawal of fresh water for public supply: 4.30 millions of gallons per day (52% from ground, 48% from surface)
| Here: | 6.0 |
| State: | 6.3 |
| Here: | 4.5 |
| State: | 4.0 |
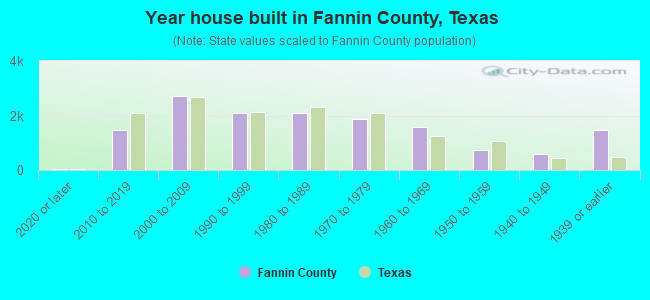
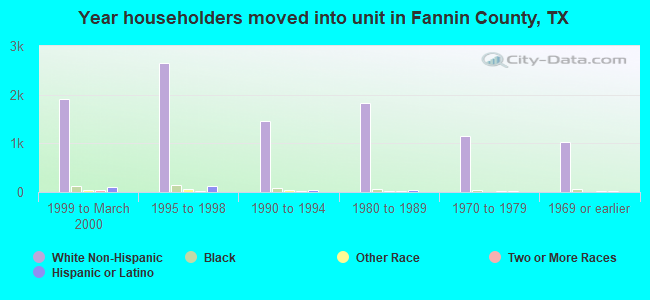
- Year house built in Fannin County, Texas
- 1742020 or later
- 1,5302010 to 2019
- 2,8792000 to 2009
- 2,1121990 to 1999
- 2,1411980 to 1989
- 1,8171970 to 1979
- 1,3311960 to 1969
- 7441950 to 1959
- 6681940 to 1949
- 1,2201939 or earlier
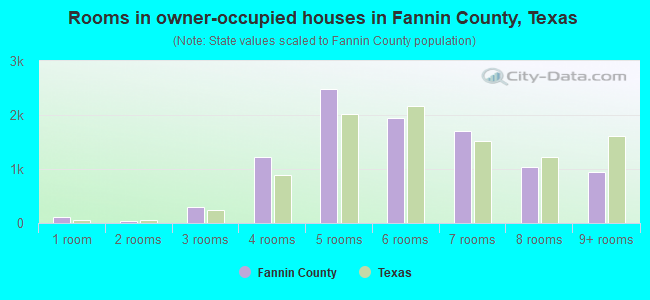
- Rooms in owner-occupied houses in Fannin County, Texas
- 991 room
- 562 rooms
- 3043 rooms
- 1,2104 rooms
- 2,2465 rooms
- 2,1836 rooms
- 1,8797 rooms
- 1,0798 rooms
- 1,0309+ rooms
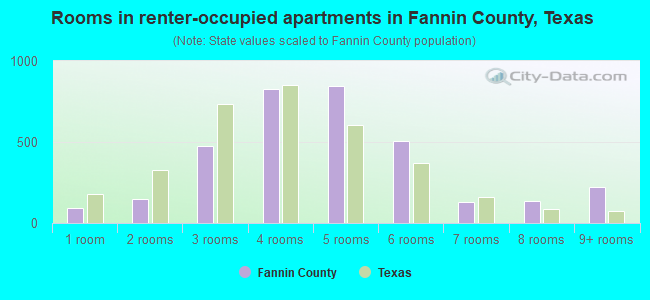
- Rooms in renter-occupied apartments in Fannin County, Texas
- 1321 room
- 1412 rooms
- 4233 rooms
- 8844 rooms
- 6745 rooms
- 4606 rooms
- 2317 rooms
- 1558 rooms
- 2109+ rooms
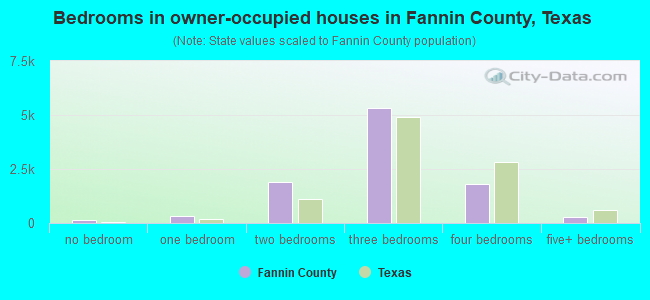
- Bedrooms in owner-occupied houses in Fannin County, Texas
- 122no bedroom
- 3011 bedroom
- 1,7942 bedrooms
- 5,5863 bedrooms
- 1,8814 bedrooms
- 3705+ bedrooms
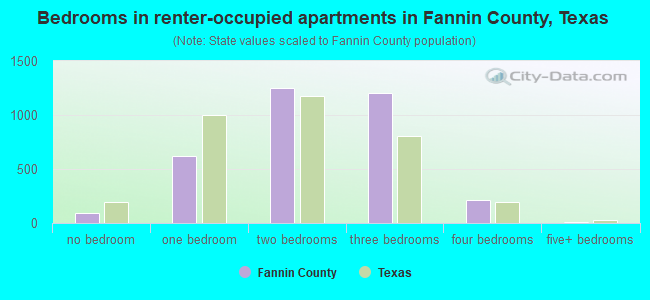
- Bedrooms in renter-occupied apartments in Fannin County, Texas
- 132no bedroom
- 5381 bedroom
- 1,2342 bedrooms
- 1,1273 bedrooms
- 2774 bedrooms
- 95+ bedrooms
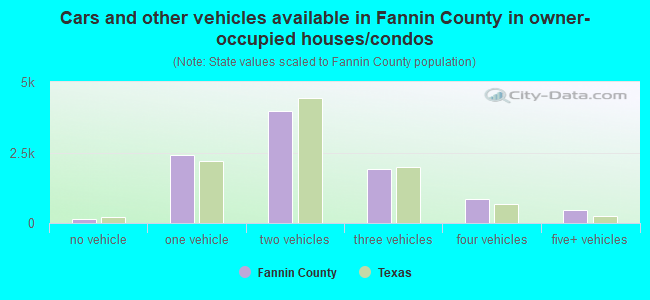
- Cars and other vehicles available in Fannin County in owner-occupied houses/condos
- 128no vehicle
- 2,3331 vehicle
- 4,1842 vehicles
- 1,9013 vehicles
- 9554 vehicles
- 5765+ vehicles
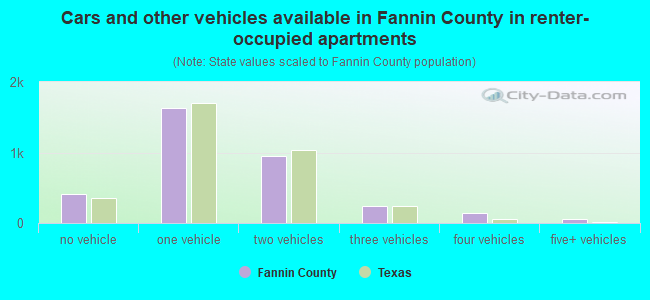
- Cars and other vehicles available in Fannin County in renter-occupied apartments
- 312no vehicle
- 1,5051 vehicle
- 1,0242 vehicles
- 2833 vehicles
- 1804 vehicles
- 365+ vehicles
85.3% of Fannin County residents lived in the same house 1 years ago.
Out of people who lived in different houses, 20% lived in this county.
Out of people who lived in different counties, 83% lived in Texas.
| Fannin County: | 85.3% |
| State average: | 85.7% |
Place of birth for U.S.-born residents:
- This state: 26,128
- Other state: 8,902
- Northeast: 894
- Midwest: 2,086
- South: 3,428
- West: 2,496
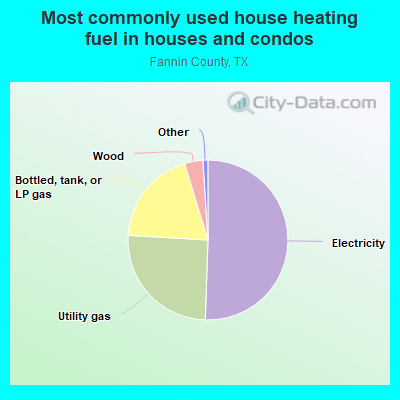
- 56.0%Electricity
- 21.9%Utility gas
- 18.0%Bottled, tank, or LP gas
- 3.4%Wood
- 0.5%Other fuel
- 0.2%No fuel used
- 0.1%Solar energy
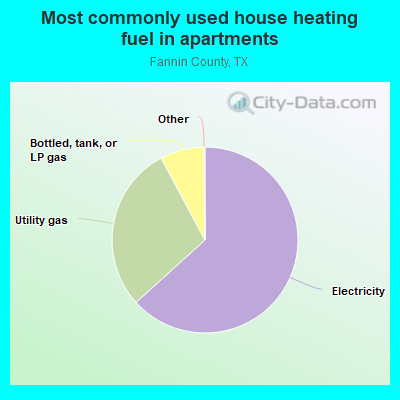
- 64.0%Electricity
- 27.5%Utility gas
- 8.1%Bottled, tank, or LP gas
- 0.3%No fuel used
- 0.1%Wood
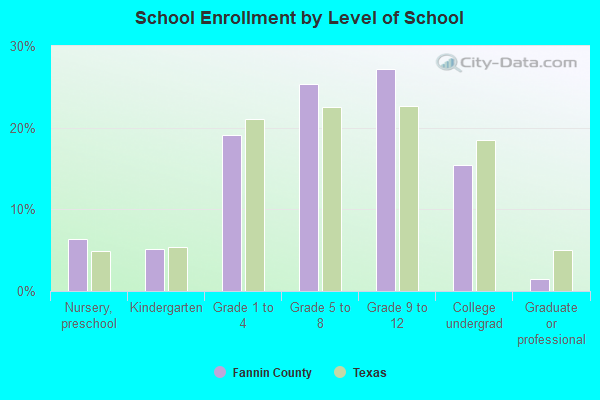
Private vs. public school enrollment:
| Here: | 7.5% |
| Texas: | 8.8% |
| Here: | 7.6% |
| Texas: | 8.0% |
| Here: | 17.0% |
| Texas: | 16.2% |
Fannin County government finances - Expenditure in 2017:
- Charges - Other: $1,083,000
- Current Operations - Regular Highways: $3,223,000
Judicial and Legal Services: $2,604,000
Correctional Institutions: $2,020,000
Central Staff Services: $1,988,000
Police Protection: $1,626,000
General - Other: $955,000
General Public Buildings: $578,000
Local Fire Protection: $540,000
Financial Administration: $432,000
Public Welfare, Vendor Payments for Medical Care: $253,000
Corrections - Other: $249,000
Natural Resources - Other: $62,000
- Federal Intergovernmental - Highways: $426,000
General Local Government Support: $46,000
- Intergovernmental to Local - Other - Correctional Institutions: $121,000
Other - Local Fire Protection: $74,000
- Miscellaneous - General Revenue - Other: $247,000
Fines and Forfeits: $197,000
Interest Earnings: $16,000
- Other Capital Outlay - Regular Highways: $223,000
- Other Funds - Cash and Securities: $7,578,000
- State Intergovernmental - Other: $95,000
Highways: $43,000
Public Welfare: $28,000
Health and Hospitals: $13,000
- Tax - Property: $9,409,000
General Sales and Gross Receipts: $963,000
Motor Vehicle License: $836,000
Other License: $100,000
Alcoholic Beverage License: $1,000
- Total Salaries and Wages: $1,193,000
Fannin County government finances - Revenue in 2017:
- Charges - Other: $1,083,000
- Current Operations - Regular Highways: $3,223,000
Judicial and Legal Services: $2,604,000
Correctional Institutions: $2,020,000
Central Staff Services: $1,988,000
Police Protection: $1,626,000
General - Other: $955,000
General Public Buildings: $578,000
Local Fire Protection: $540,000
Financial Administration: $432,000
Public Welfare, Vendor Payments for Medical Care: $253,000
Corrections - Other: $249,000
Natural Resources - Other: $62,000
- Federal Intergovernmental - Highways: $426,000
General Local Government Support: $46,000
- Intergovernmental to Local - Other - Correctional Institutions: $121,000
Other - Local Fire Protection: $74,000
- Miscellaneous - General Revenue - Other: $247,000
Fines and Forfeits: $197,000
Interest Earnings: $16,000
- Other Capital Outlay - Regular Highways: $223,000
- Other Funds - Cash and Securities: $7,578,000
- State Intergovernmental - Other: $95,000
Highways: $43,000
Public Welfare: $28,000
Health and Hospitals: $13,000
- Tax - Property: $9,409,000
General Sales and Gross Receipts: $963,000
Motor Vehicle License: $836,000
Other License: $100,000
Alcoholic Beverage License: $1,000
- Total Salaries and Wages: $1,193,000
Fannin County government finances - Debt in 2017:
- Charges - Other: $1,083,000
- Current Operations - Regular Highways: $3,223,000
Judicial and Legal Services: $2,604,000
Correctional Institutions: $2,020,000
Central Staff Services: $1,988,000
Police Protection: $1,626,000
General - Other: $955,000
General Public Buildings: $578,000
Local Fire Protection: $540,000
Financial Administration: $432,000
Public Welfare, Vendor Payments for Medical Care: $253,000
Corrections - Other: $249,000
Natural Resources - Other: $62,000
- Federal Intergovernmental - Highways: $426,000
General Local Government Support: $46,000
- Intergovernmental to Local - Other - Correctional Institutions: $121,000
Other - Local Fire Protection: $74,000
- Miscellaneous - General Revenue - Other: $247,000
Fines and Forfeits: $197,000
Interest Earnings: $16,000
- Other Capital Outlay - Regular Highways: $223,000
- Other Funds - Cash and Securities: $7,578,000
- State Intergovernmental - Other: $95,000
Highways: $43,000
Public Welfare: $28,000
Health and Hospitals: $13,000
- Tax - Property: $9,409,000
General Sales and Gross Receipts: $963,000
Motor Vehicle License: $836,000
Other License: $100,000
Alcoholic Beverage License: $1,000
- Total Salaries and Wages: $1,193,000
Fannin County government finances - Cash and Securities in 2017:
- Charges - Other: $1,083,000
- Current Operations - Regular Highways: $3,223,000
Judicial and Legal Services: $2,604,000
Correctional Institutions: $2,020,000
Central Staff Services: $1,988,000
Police Protection: $1,626,000
General - Other: $955,000
General Public Buildings: $578,000
Local Fire Protection: $540,000
Financial Administration: $432,000
Public Welfare, Vendor Payments for Medical Care: $253,000
Corrections - Other: $249,000
Natural Resources - Other: $62,000
- Federal Intergovernmental - Highways: $426,000
General Local Government Support: $46,000
- Intergovernmental to Local - Other - Correctional Institutions: $121,000
Other - Local Fire Protection: $74,000
- Miscellaneous - General Revenue - Other: $247,000
Fines and Forfeits: $197,000
Interest Earnings: $16,000
- Other Capital Outlay - Regular Highways: $223,000
- Other Funds - Cash and Securities: $7,578,000
- State Intergovernmental - Other: $95,000
Highways: $43,000
Public Welfare: $28,000
Health and Hospitals: $13,000
- Tax - Property: $9,409,000
General Sales and Gross Receipts: $963,000
Motor Vehicle License: $836,000
Other License: $100,000
Alcoholic Beverage License: $1,000
- Total Salaries and Wages: $1,193,000
Supplemental Security Income (SSI) in 2006:
- Total number of recipients: 783
- Number of aged recipients: 104
- Number of blind and disabled recipients: 679
- Number of recipients under 18: 121
- Number of recipients between 18 and 64: 464
- Number of recipients older than 64: 198
- Number of recipients also receiving OASDI: 316
- Amount of payments (thousands of dollars): 339
| Most common first names in Fannin County, TX among deceased individuals | ||
| Name | Count | Lived (average) |
|---|---|---|
| James | 339 | 73.9 years |
| John | 296 | 76.3 years |
| William | 282 | 76.9 years |
| Mary | 280 | 79.7 years |
| Robert | 180 | 75.0 years |
| Charles | 151 | 71.5 years |
| Willie | 143 | 79.0 years |
| George | 114 | 77.9 years |
| Joe | 113 | 74.5 years |
| Thomas | 108 | 75.4 years |
| Most common last names in Fannin County, TX among deceased individuals | ||
| Last name | Count | Lived (average) |
|---|---|---|
| Smith | 195 | 77.2 years |
| Jones | 131 | 76.3 years |
| Johnson | 114 | 79.1 years |
| Williams | 108 | 74.7 years |
| Brown | 95 | 78.1 years |
| Taylor | 88 | 77.0 years |
| Moore | 72 | 78.6 years |
| Wilson | 72 | 73.8 years |
| Davis | 66 | 77.4 years |
| Clark | 65 | 76.5 years |
| Businesses in Fannin County, TX | ||||
| Name | Count | Name | Count | |
|---|---|---|---|---|
| AT&T | 1 | Lane Furniture | 1 | |
| Ace Hardware | 1 | Little Caesars Pizza | 1 | |
| AutoZone | 1 | McDonald's | 2 | |
| Burger King | 1 | Nike | 2 | |
| Dairy Queen | 2 | Pizza Hut | 2 | |
| FedEx | 3 | SONIC Drive-In | 3 | |
| Goodwill | 1 | Subway | 2 | |
| H&R Block | 2 | Taco Bell | 1 | |
| Jack In The Box | 1 | True Value | 1 | |
| Jones New York | 1 | U-Haul | 3 | |
| KFC | 1 | UPS | 3 | |
| La-Z-Boy | 1 | Walmart | 2 | |