Morrow County, Ohio (OH)
County owner-occupied free and clear houses and condos in 2010: 3,221
County owner-occupied houses and condos in 2000: 9,451
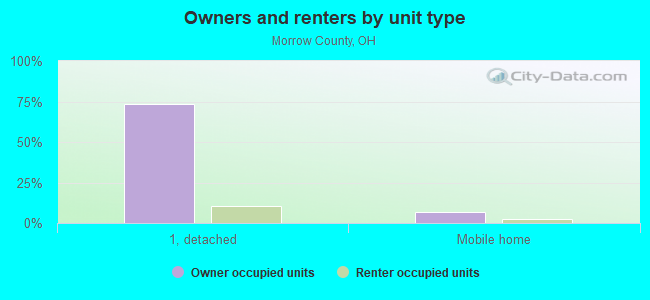
Renter-occupied apartments: 2,624 (it was 2,048 in 2000)
| % of renters here: | 18% |
| State: | 32% |
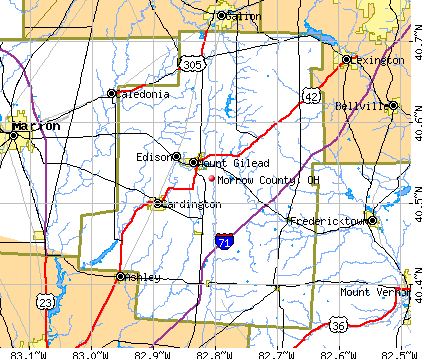
Land area: 406 sq. mi.
Water area: 1.1 sq. mi.
Population density: 86 people per square mile (average).
Industries providing employment: Educational, health and social services (21.7%), Manufacturing (16.3%), Retail trade (12.0%), Construction (10.7%).
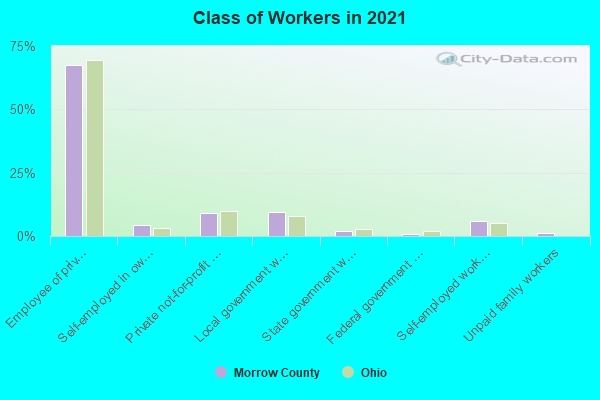
Type of workers:
- Private wage or salary: 79%
- Government: 13%
- Self-employed, not incorporated: 7%
- Unpaid family work: 1%
- OSM Map
- General Map
- Google Map
- MSN Map

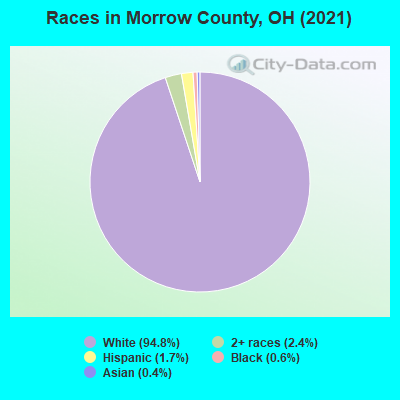
- 32,79194.4%White Non-Hispanic Alone
- 7352.1%Two or more races
- 6321.8%Hispanic or Latino
- 2340.7%Black Non-Hispanic Alone
- 1600.5%Asian alone
- 1330.4%Some other race alone
- 440.1%American Indian and Alaska Native alone
| Median resident age: | 43.0 years |
| Ohio median age: | 39.9 years |
| Males: 17,806 | |
| Females: 17,187 |

 | Is Columbus the best city in the Midwest? (709 replies) |
| Will Columbus become largest Ohio metro? (887 replies) |
| Streetcar skeptic to believer (885 replies) |
| Country Living around Columbus.. Please help! (53 replies) |
| July 1, 2014 County and Metro Population Estimates (6 replies) |
| Mayor Coleman wants an NBA team in Cbus (95 replies) |
| Morrow County: | 2.0 people |
| Ohio: | 2 people |
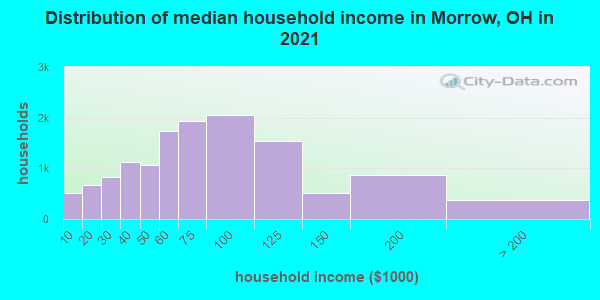
Estimated median household income in 2022: $69,077 ($40,882 in 1999)
| This county: | $69,077 |
| Ohio: | $65,720 |
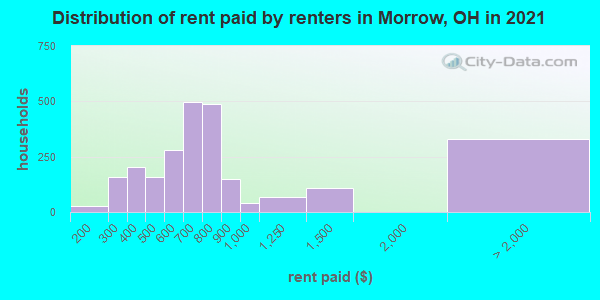
Median contract rent in 2022 for apartments: $667 (lower quartile is $523, upper quartile is $863)
| This county: | $667 |
| State: | $765 |
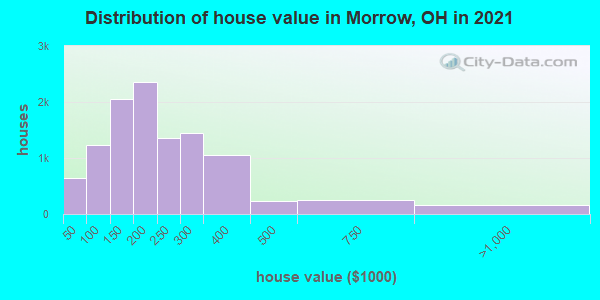
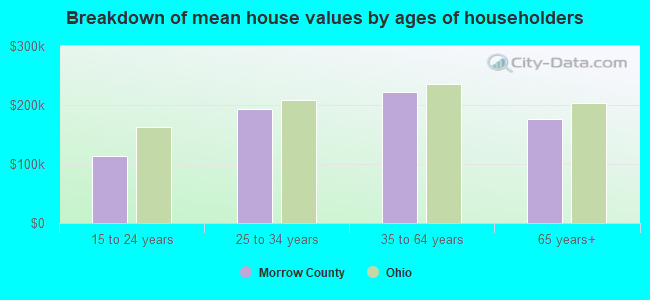
Estimated median house or condo value in 2022: $206,884 (it was $97,100 in 2000)
| Morrow: | $206,884 |
| Ohio: | $204,100 |
Median monthly housing costs for homes and condos with a mortgage: $1,356
Median monthly housing costs for units without a mortgage: $492
Institutionalized population: 317
Crime in 2021 (reported by the sheriff's office or county police, not the county total):
- Murders: 0
- Rapes: 0
- Robberies: 0
- Assaults: 2
- Burglaries: 0
- Thefts: 4
- Auto thefts: 0
Crime in 2020 (reported by the sheriff's office or county police, not the county total):
- Murders: 0
- Rapes: 6
- Robberies: 1
- Assaults: 18
- Burglaries: 24
- Thefts: 35
- Auto thefts: 8
Health of residents in Morrow County based on CDC Behavioral Risk Factor Surveillance System Survey Questionnaires from 2013 to 2021:
General health status score of residents in this county from 1 (poor) to 5 (excellent) is 3.5. This is about average.71.6% of residents exercised in the past month. This is about average.
41.6% of residents smoked 100+ cigarettes in their lives. This is about average.
52.4% of adult residents drank alcohol in the past 30 days. This is less than average.
72.1% of residents visited a dentist within the past year. This is about average.
Average weight of males is 202 pounds. This is more than average.
Average weight of females is 167 pounds. This is more than average.
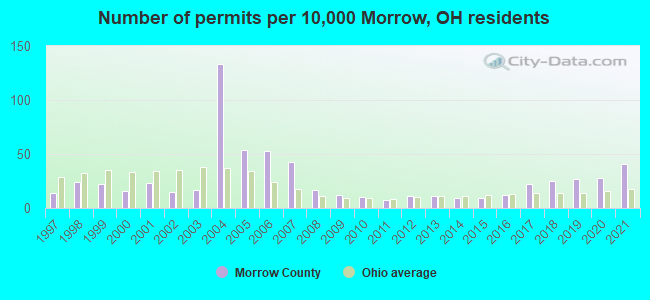
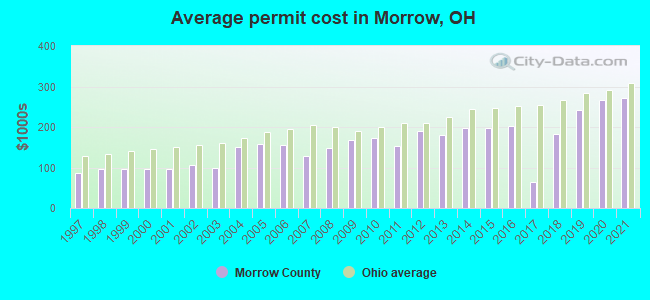
Single-family new house construction building permits:
- 2022: 122 buildings, average cost: $298,200
- 2021: 130 buildings, average cost: $271,900
- 2020: 89 buildings, average cost: $266,000
- 2019: 84 buildings, average cost: $241,100
- 2018: 78 buildings, average cost: $182,700
- 2017: 69 buildings, average cost: $64,200
- 2016: 38 buildings, average cost: $202,200
- 2015: 27 buildings, average cost: $197,900
- 2014: 27 buildings, average cost: $197,500
- 2013: 34 buildings, average cost: $180,200
- 2012: 35 buildings, average cost: $188,800
- 2011: 23 buildings, average cost: $152,700
- 2010: 33 buildings, average cost: $171,900
- 2009: 38 buildings, average cost: $169,400
- 2008: 55 buildings, average cost: $148,600
- 2007: 136 buildings, average cost: $129,200
- 2006: 169 buildings, average cost: $156,100
- 2005: 171 buildings, average cost: $156,900
- 2004: 421 buildings, average cost: $151,300
- 2003: 53 buildings, average cost: $98,000
- 2002: 49 buildings, average cost: $105,700
- 2001: 74 buildings, average cost: $95,900
- 2000: 51 buildings, average cost: $97,200
- 1999: 69 buildings, average cost: $97,200
- 1998: 77 buildings, average cost: $96,500
- 1997: 44 buildings, average cost: $86,100
Median real estate property taxes paid for housing units with mortgages in 2022: $2,265 (1.0%)
Median real estate property taxes paid for housing units with no mortgage in 2022: $2,100 (1.1%)
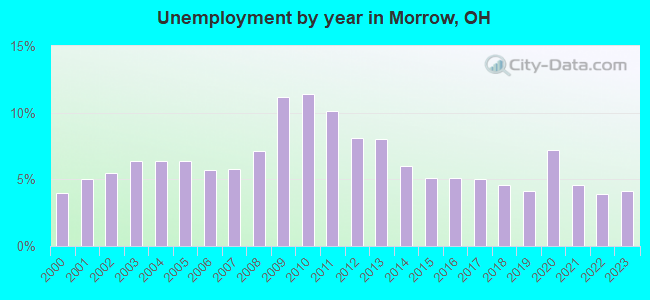
| Morrow County: | 10.7% |
| Ohio: | 13.4% |
Median age of residents in 2022: 43.0 years old
(Males: 41.9 years old, Females: 44.4 years old)
(Median age for: White residents: 43.3 years old, Black residents: 25.2 years old, American Indian residents: 47.6 years old, Asian residents: 68.0 years old, Hispanic or Latino residents: 20.4 years old, Other race residents: 32.2 years old)
Area name: Columbus, OH HUD Metro FMR Area
Fair market rent in 2006 for a 1-bedroom apartment in Morrow County is $517 a month.
Fair market rent for a 2-bedroom apartment is $655 a month.
Fair market rent for a 3-bedroom apartment is $823 a month.
Cities in this county include: Mount Gilead, Cardington, Candlewood Lake, Iberia, Edison, Marengo, Fulton, Chesterville, Sparta.
| Zip Code | City | Tests | Max concentration | Min concentration | Arithmetic mean | Geometric mean | Standard deviation | Coefficient of variation | Mean concentration | First quartile | Third quartile |
|---|---|---|---|---|---|---|---|---|---|---|---|
| 43315 | Cardington | 105 | 77.2 | 0.1 | 6.92 | 3.63 | 12.11 | 174.81 | 4.00 | 1.73 | 6.85 |
| 43317 | Chesterville | 8 | 14.8 | 1.4 | 9.4 | 7.35 | 5.29 | 56.32 | 11.25 | 2.80 | 12.60 |
| 43320 | Edison | 32 | 32.4 | 0.7 | 6.47 | 3.81 | 7.65 | 118.39 | 3.50 | 1.40 | 6.20 |
| 43321 | Fulton | 6 | 14.6 | 0.2 | 5.95 | 2.34 | 5.63 | 94.61 | 5.40 | 0.20 | 8.05 |
| 43325 | Iberia | 3 | 6.4 | 4.9 | 5.4 | 5.36 | 0.87 | 16.04 | 4.90 | 4.13 | 5.28 |
| 43334 | Marengo | 93 | 62.2 | 0.1 | 7.78 | 3.77 | 12.62 | 162.29 | 3.40 | 2.00 | 6.33 |
| 43338 | Mount Gilead | 174 | 53.1 | 0 | 5.74 | 3.24 | 7.36 | 128.25 | 3.85 | 1.75 | 6.45 |
| 43349 | Shauck | 6 | 12.9 | 0.7 | 4.93 | 3.11 | 4.93 | 99.95 | 2.50 | 1.25 | 6.05 |
| 43350 | Sparta | 4 | 10.7 | 5.1 | 6.58 | 6.23 | 2.75 | 41.88 | 5.25 | 5.10 | 5.40 |
All concentrations are in units of pico-Curies of radiation per liter of air ( pCi/l ).
Notable locations in this county outside city limits:
Notable locations in Morrow County: Gooding Corners (A), Bell Corners (B), Mar-O-Dell Golf Course (C), Kings Mill Golf Course (D), Lawrence Orchards (E), Marion Country Club (F), Camp Owens (G), Devries Dairy (H), Sims Farms (I), Ralph Brothers Farms (J), Loudenslager Acres (K), Ackley Farms (L), Marion Township Fire Department Station 2 (M), New Vision Fire and Rescue (N), Marion County Childrens Home (O), Pleasant Township Fire Department (P), Richland Township Hall (Q). Display/hide their locations on the map
Shopping Centers: Southland Mall Shopping Center (1), Marion Plaza Shopping Center (2), Forum Shopping Center (3). Display/hide their locations on the map
Churches in Morrow County include: Clyde Church (A), Evangelical Church (B), Mount Olive Church (C), Saint Johns Church (D), Trinity Evangelical Lutheran Church (E), Salem Church of God (F), Salem Evangelical Church (G), Likens Church (H), Shiloh Church (I). Display/hide their locations on the map
Cemeteries: Saint Pauls Cemetery (1), Agosta Cemetery (2), Augenstein Cemetery (3), Sayler Cemetery (4), Berringer Cemetery (5), Bonner Cemetery (6), Bretz Cemetery (7). Display/hide their locations on the map
Reservoirs: Big Island Wildlife Area Reservoir (A), Fremont Reservoir (B). Display/hide their locations on the map
Streams, rivers, and creeks: Maple Run (A), Little Scioto River (B), Norton Run (C), Grave Creek (D), Glade Run (E), Enoch Creek (F), Dudley Run (G), Davids Run (H), Brown Run (I). Display/hide their locations on the map
Parks in Morrow County include: Big Island Wildlife Area (1), Garfield Park (2). Display/hide their locations on the map
Neighboring counties: Hudson County, New Jersey  , Ford County, Illinois
  , Fulton County, Illinois , Montgomery County, Pennsylvania , Johnson County, Nebraska , Richland County
  .
.
| Here: | 3.2% |
| Ohio: | 3.1% |
Current college students: 871
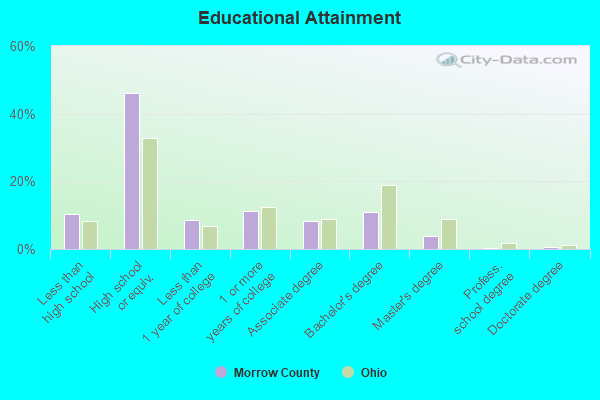
People 25 years of age or older with a high school degree or higher: 89.7%
People 25 years of age or older with a bachelor's degree or higher: 16.9%
Number of foreign born residents: 337 (77.6% naturalized citizens)
| Morrow County: | 1.0% |
| Whole state: | 5.0% |
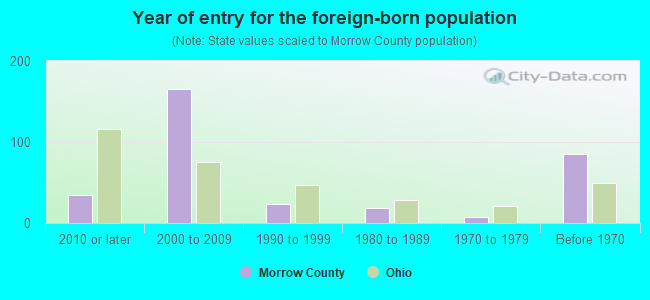
- Year of entry for the foreign-born population
- 112010 or later
- 1522000 to 2009
- 171990 to 1999
- 191980 to 1989
- 71970 to 1979
- 85Before 1970
Mean travel time to work (commute): minutes
Percentage of county residents living and working in this county: 98.9%
Housing units in structures:
- One, detached: 11,990
- One, attached: 56
- Two: 254
- 3 or 4: 310
- 5 to 9: 185
- 10 to 19: 118
- 20 or more: 40
- Mobile homes: 1,571
Housing units in Morrow County with a mortgage: 6,772 (654 second mortgage, 10 home equity loan, 573 both second mortgage and home equity loan)
Houses without a mortgage: 319
| Here: | 1.8% with mortgage |
| State: | 95.2% with mortgage |
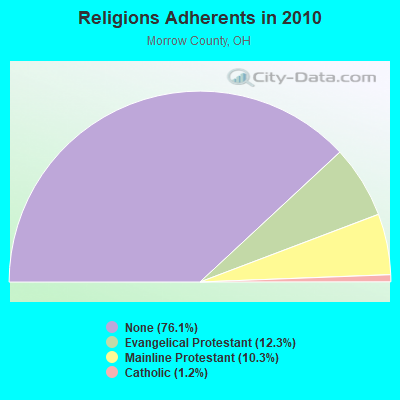
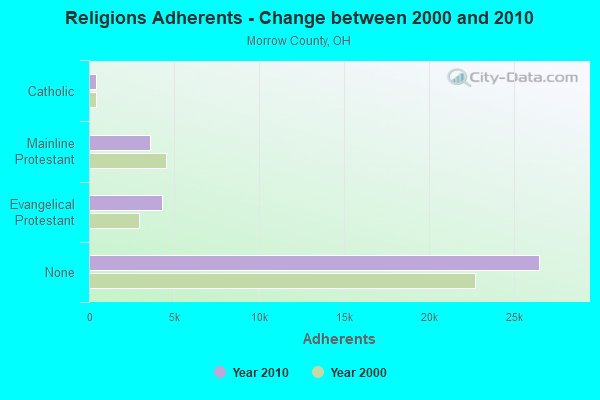
Religion statistics for Morrow County
| Religion | Adherents | Congregations |
|---|---|---|
| Evangelical Protestant | 4,301 | 35 |
| Mainline Protestant | 3,598 | 26 |
| Catholic | 425 | 1 |
| Other | 7 | - |
| None | 26,496 | - |
Source: Clifford Grammich, Kirk Hadaway, Richard Houseal, Dale E.Jones, Alexei Krindatch, Richie Stanley and Richard H.Taylor. 2012. 2010 U.S.Religion Census: Religious Congregations & Membership Study. Association of Statisticians of American Religious Bodies. Jones, Dale E., et al. 2002. Congregations and Membership in the United States 2000. Nashville, TN: Glenmary Research Center.
Food Environment Statistics:
| Morrow County: | 1.74 / 10,000 pop. |
| State: | 1.89 / 10,000 pop. |
| This county: | 0.58 / 10,000 pop. |
| Ohio: | 1.25 / 10,000 pop. |
| Morrow County: | 2.61 / 10,000 pop. |
| Ohio: | 2.93 / 10,000 pop. |
| This county: | 2.90 / 10,000 pop. |
| State: | 6.25 / 10,000 pop. |
| Morrow County: | 9.3% |
| Ohio: | 10.3% |
| Morrow County: | 29.8% |
| State: | 29.1% |
| Here: | 19.2% |
| State: | 11.9% |
Agriculture in Morrow County:
Average size of farms: 207 acresAverage value of agricultural products sold per farm: $41,421
Average value of crops sold per acre for harvested cropland: $175.87
The value of nursery, greenhouse, floriculture, and sod as a percentage of the total market value of agricultural products sold: 1.69%
The value of livestock, poultry, and their products as a percentage of the total market value of agricultural products sold: 34.61%
Average total farm production expenses per farm: $44,283
Harvested cropland as a percentage of land in farms: 74.23%
Irrigated harvested cropland as a percentage of land in farms: 0.03%
Average market value of all machinery and equipment per farm: $59,184
The percentage of farms operated by a family or individual: 92.24%
Average age of principal farm operators: 53 years
Average number of cattle and calves per 100 acres of all land in farms: 6.12
Milk cows as a percentage of all cattle and calves: 21.26%
Corn for grain: 39154 harvested acres
All wheat for grain: 12033 harvested acres
Soybeans for beans: 69424 harvested acres
Vegetables: 180 harvested acres
Land in orchards: 38 acres
Tornado activity:
Morrow County historical area-adjusted tornado activity is significantly below Ohio state average. It is 3667579.6 times below overall U.S. average.Tornadoes in this county have caused 3 injuries recorded between 1950 and 2004.
On 5/6/1971, a category 2 (max. wind speeds 113-157 mph) tornado injured 3 people and caused between $50,000 and $500,000 in damages.
Earthquake activity:
Morrow County-area historical earthquake activity is significantly above Ohio state average. It is 28% smaller than the overall U.S. average.On 9/25/1998 at 19:52:52, a magnitude 5.2 (4.8 MB, 4.3 MS, 5.2 LG, 4.5 MW, Depth: 3.1 mi, Class: Moderate, Intensity: VI - VII) earthquake occurred 142.3 miles away from Morrow County center
On 1/31/1986 at 16:46:43, a magnitude 5.0 (5.0 MB) earthquake occurred 113.5 miles away from the county center
On 7/27/1980 at 18:52:21, a magnitude 5.2 (5.1 MB, 4.7 MS, 5.0 UK, 5.2 UK) earthquake occurred 171.9 miles away from the county center
On 8/23/2011 at 17:51:04, a magnitude 5.8 (5.8 MW, Depth: 3.7 mi) earthquake occurred 317.7 miles away from the county center
On 7/12/1986 at 08:19:37, a magnitude 4.5 (4.5 MB, Class: Light, Intensity: IV - V) earthquake occurred 82.2 miles away from Morrow County center
On 4/18/2008 at 09:36:59, a magnitude 5.4 (5.1 MB, 4.8 MS, 5.4 MW, 5.2 MW) earthquake occurred 306.8 miles away from the county center
Magnitude types: regional Lg-wave magnitude (LG), body-wave magnitude (MB), surface-wave magnitude (MS), moment magnitude (MW)
Most recent natural disasters:
- Ohio Covid-19 Pandemic, Incident Period: January 20, 2020, FEMA Id: 4507, Natural disaster type: Other
- Ohio Severe Storms and Straight-line Winds, Incident Period: June 29, 2012 to July 02, 2012, Major Disaster (Presidential) Declared DR-4077: August 20, 2012, FEMA Id: 4077, Natural disaster type: Storm, Wind
- Ohio Severe Wind Storm associated with Tropical Depression Ike, Incident Period: September 14, 2008, Major Disaster (Presidential) Declared DR-1805: October 24, 2008, FEMA Id: 1805, Natural disaster type: Storm, Tropical Depression, Wind
- Ohio Snow, Incident Period: March 07, 2008 to March 09, 2008, Emergency Declared EM-3286: April 24, 2008, FEMA Id: 3286, Natural disaster type: Snow
- Ohio Hurricane Katrina Evacuation, Incident Period: August 29, 2005 to October 01, 2005, Emergency Declared EM-3250: September 13, 2005, FEMA Id: 3250, Natural disaster type: Hurricane
- Ohio Severe Winter Storms, Flooding and Mudslides, Incident Period: December 22, 2004 to February 01, 2005, Major Disaster (Presidential) Declared DR-1580: February 15, 2005, FEMA Id: 1580, Natural disaster type: Winter Storm, Mudslide, Flood
- Ohio Snow, Incident Period: December 22, 2004 to December 24, 2004, Emergency Declared EM-3198: January 11, 2005, FEMA Id: 3198, Natural disaster type: Snow
- Ohio Severe Storms, Flooding and Tornadoes, Incident Period: June 24, 1998 to July 05, 1998, Major Disaster (Presidential) Declared DR-1227: June 30, 1998, FEMA Id: 1227, Natural disaster type: Storm, Tornado, Flood
- Ohio Flooding, Severe Storm, Tornado, Incident Period: May 28, 1990 to July 15, 1990, Major Disaster (Presidential) Declared DR-870: June 06, 1990, FEMA Id: 870, Natural disaster type: Storm, Tornado, Flood
- Ohio SEVERE STORMS, FLOODING, Incident Period: July 01, 1987 to July 10, 1987, Major Disaster (Presidential) Declared DR-796: July 17, 1987, FEMA Id: 796, Natural disaster type: Storm, Flood
- 3 other natural disasters have been reported since 1953.
The number of natural disasters in Morrow County (13) is near the US average (15).
Major Disasters (Presidential) Declared: 8
Emergencies Declared: 4
Causes of natural disasters: Storms: 7, Floods: 5, Tornadoes: 4, Snows: 2, Winds: 2, Blizzard: 1, Hurricane: 1, Mudslide: 1, Snowstorm: 1, Tropical Depression: 1, Winter Storm: 1, Other: 1 (Note: some incidents may be assigned to more than one category).
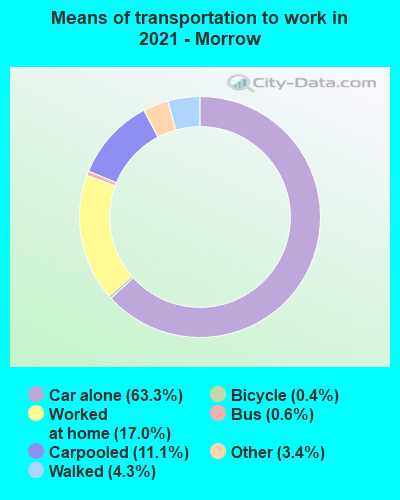
Means of transportation to work:
- Drove a car alone: 5,352 (59.3%)
- Carpooled: 970 (10.7%)
- Bus: 74 (0.8%)
- Taxicab, motorcycle, or other means: 354 (3.9%)
- Bicycle: 6 (0.1%)
- Walked: 307 (3.4%)
- Worked at home: 2,351 (26.1%)
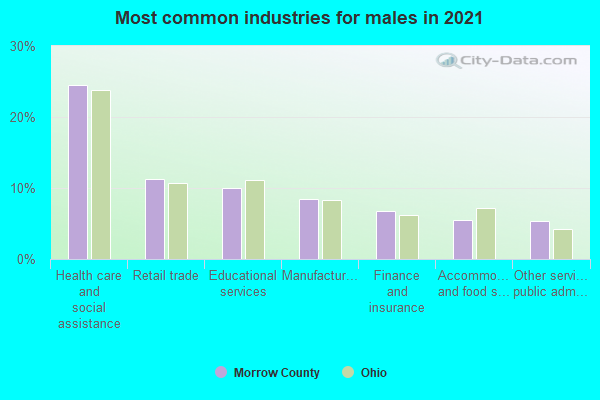
- Health care and social assistance (24%)
- Educational services (10%)
- Retail trade (9%)
- Manufacturing (7%)
- Accommodation and food services (6%)
- Finance and insurance (5%)
- Other services, except public administration (5%)
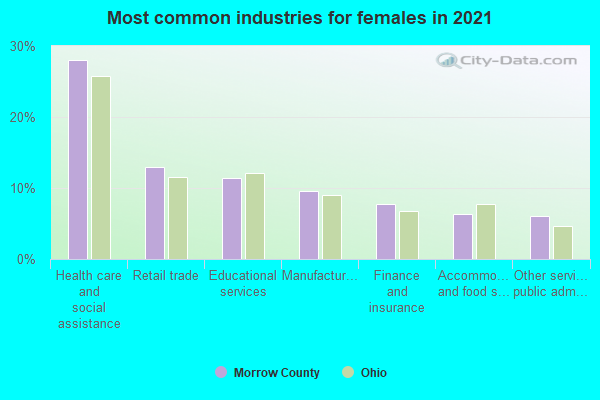
- Health care and social assistance (29%)
- Educational services (13%)
- Retail trade (11%)
- Manufacturing (9%)
- Accommodation and food services (8%)
- Finance and insurance (6%)
- Other services, except public administration (6%)
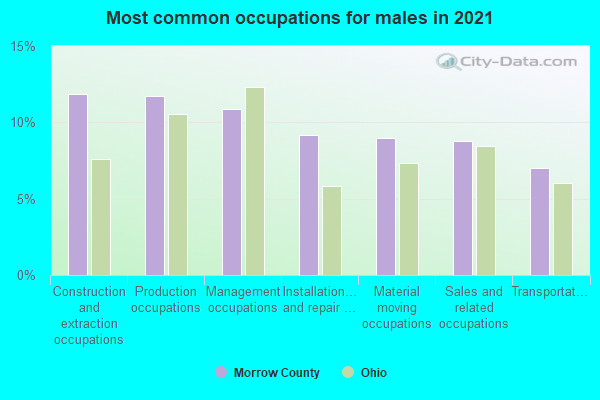
- Construction and extraction occupations (14%)
- Production occupations (13%)
- Management occupations (10%)
- Material moving occupations (8%)
- Installation, maintenance, and repair occupations (8%)
- Sales and related occupations (8%)
- Transportation occupations (6%)
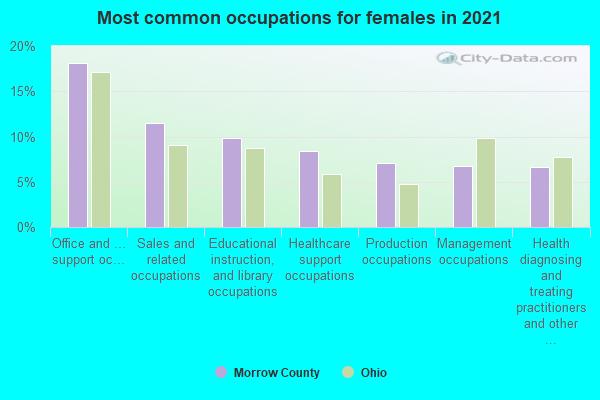
- Office and administrative support occupations (16%)
- Educational instruction, and library occupations (11%)
- Sales and related occupations (11%)
- Management occupations (9%)
- Healthcare support occupations (8%)
- Production occupations (7%)
- Health diagnosing and treating practitioners and other technical occupations (7%)
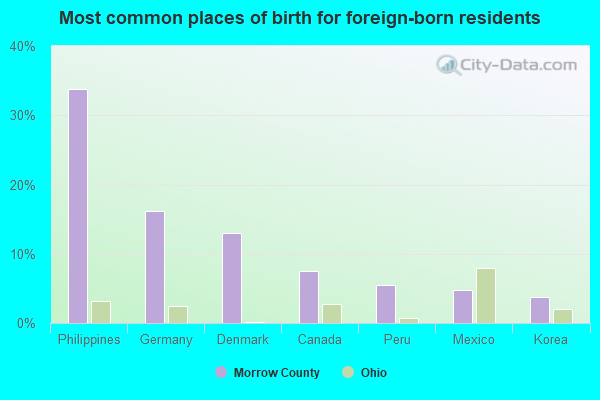
- Philippines (33%)
- Germany (21%)
- Denmark (11%)
- Korea (9%)
- Mexico (6%)
- Canada (6%)
- Morocco (3%)
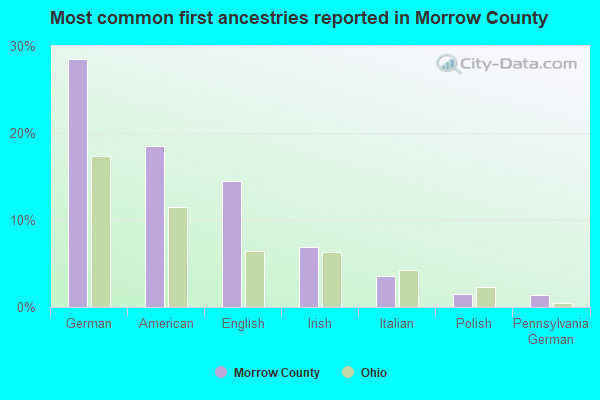
- German (29%)
- American (22%)
- English (14%)
- Irish (8%)
- Italian (3%)
- Polish (2%)
- European (1%)
People in group quarters in Morrow County, Ohio in 2010:
- 215 people in nursing facilities/skilled-nursing facilities
- 77 people in local jails and other municipal confinement facilities
- 39 people in group homes intended for adults
- 25 people in residential treatment centers for juveniles (non-correctional)
- 10 people in workers' group living quarters and job corps centers
People in group quarters in Morrow County, Ohio in 2000:
- 192 people in nursing homes
- 136 people in local jails and other confinement facilities (including police lockups)
- 26 people in other nonhousehold living situations
- 9 people in homes for the mentally retarded
- 8 people in other group homes
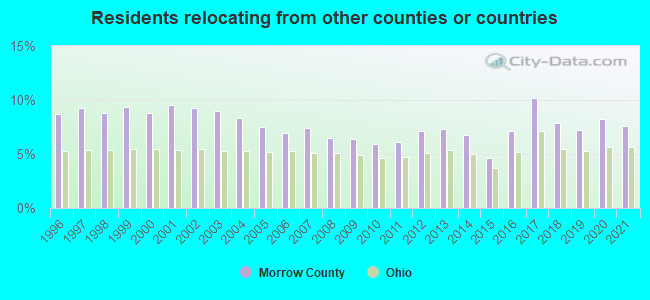
7.56% of this county's 2021 resident taxpayers lived in other counties in 2020 ($56,592 average adjusted gross income)
| Here: | 7.56% |
| Ohio average: | 5.68% |
10 or fewer of this county's residents moved from foreign countries.
6.74% relocated from other counties in Ohio ($49,566 average AGI)
0.82% relocated from other states ($7,027 average AGI)
Morrow County: 0.82% Ohio average: 1.92%
Top counties from which taxpayers relocated into this county between 2020 and 2021:
| from Franklin County, OH | |
| from Delaware County, OH | |
| from Richland County, OH | |
| from Marion County, OH | |
| from Knox County, OH | |
| from Crawford County, OH | |
| from Licking County, OH |
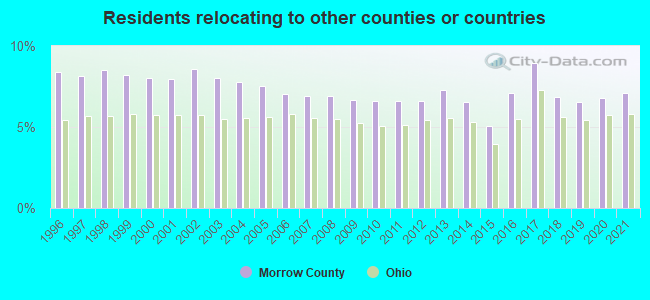
7.08% of this county's 2020 resident taxpayers moved to other counties in 2021 ($47,955 average adjusted gross income)
| Here: | 7.08% |
| Ohio average: | 5.79% |
10 or fewer of this county's residents moved to foreign countries.
5.91% relocated to other counties in Ohio ($37,979 average AGI)
1.17% relocated to other states ($9,976 average AGI)
Morrow County: 1.17% Ohio average: 2.05%
Top counties to which taxpayers relocated from this county between 2020 and 2021:
| to Delaware County, OH | |
| to Franklin County, OH | |
| to Richland County, OH | |
| to Marion County, OH | |
| to Crawford County, OH | |
| to Knox County, OH | |
| to Licking County, OH |
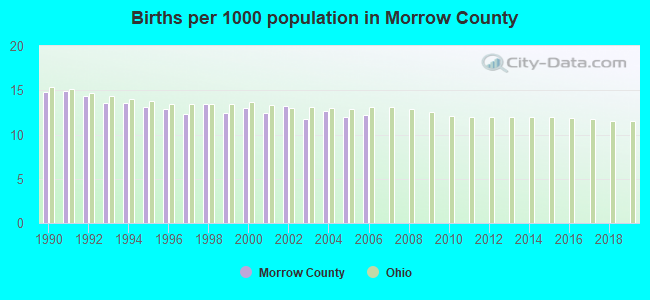
Births per 1000 population from 1990 to 1999: 13.5
Births per 1000 population from 2000 to 2006: 12.5
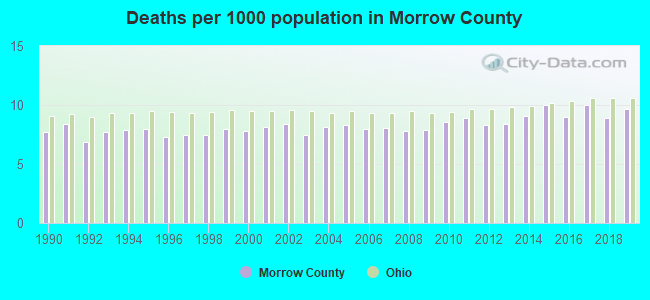
Deaths per 1000 population from 1990 to 1999: 7.7
Deaths per 1000 population from 2000 to 2009: 8.0
Deaths per 1000 population from 2010 to 2020: 9.2
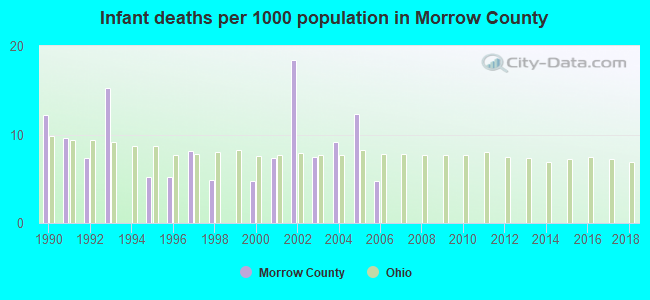
Infant deaths per 1000 live births from 1990 to 1999: 6.8
Infant deaths per 1000 live births from 2000 to 2006: 9.2
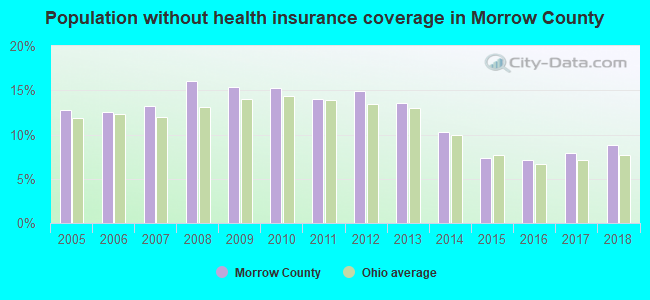
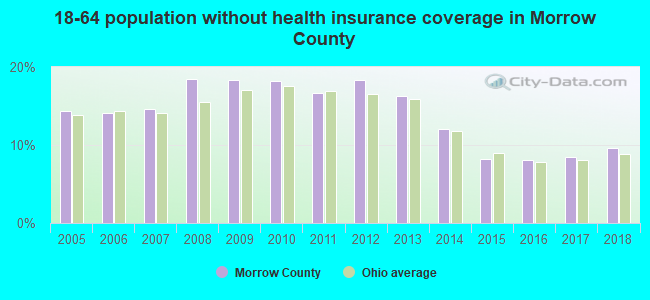
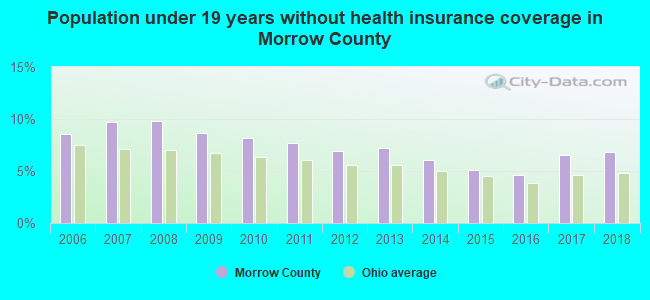
Persons under 19 years old without health insurance coverage in 2018: 6.8%
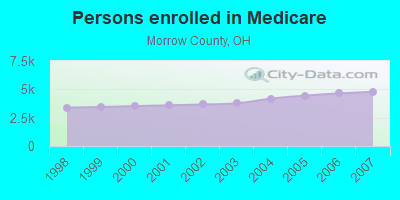
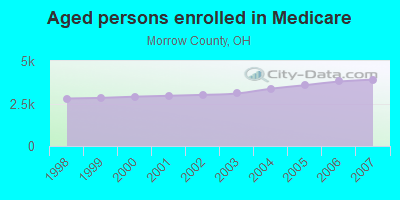
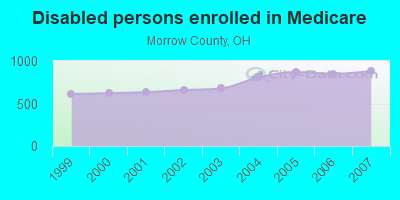
Persons enrolled in hospital insurance and/or supplemental medical insurance (Medicare) in July 1, 2007: 4,784 (3,901 aged, 883 disabled)
Children under 18 without health insurance coverage in 2007: 790 (9%)
Most common underlying causes of death in Morrow County, Ohio in 1999 - 2019:
- Atherosclerotic heart disease (497)
- Acute myocardial infarction, unspecified (456)
- Bronchus or lung, unspecified - Malignant neoplasms (451)
- Chronic obstructive pulmonary disease, unspecified (238)
- Unspecified dementia (132)
- Alzheimer disease, unspecified (90)
- Atherosclerotic cardiovascular disease, so described (67)
- Stroke, not specified as haemorrhage or infarction (53)
- Colon, unspecified - Malignant neoplasms (23)
- Breast, unspecified - Malignant neoplasms (22)
Population without health insurance coverage in 2000: 9%
Children under 18 without health insurance coverage in 2000: 8%
Short term general hospital admissions per 100,000 population in 2004: 3,621
Short term general hospital beds per 100,000 population in 2004: 155
Emergency room visits per 100,000 population in 2004: 22,948
General practice office based MDs per 100,000 population in 2005: 1,288
Medical specialist MDs per 100,000 population in 2005: 880
Dentists per 100,000 population in 1998: 9
Total births per 100,000 population, July 2005 - July 2006 : 16
Total deaths per 100,000 population, July 2005 - July 2006: 47
Limited-service eating places per 100,000 population in 2005 : 6
Household type by relationship:
Households: 34,993- Male householders: 7,157 (1,444 living alone), Female householders: 6,297 (1,534 living alone)
7,449 spouses (7,239 opposite-sex spouses), 1,106 unmarried partners, (1,047 opposite-sex unmarried partners), 9,427 children (8,642 natural, 369 adopted, 422 stepchildren), 799 grandchildren, 255 brothers or sisters, 441 parents, 5 foster children, 644 other relatives, 1,080 non-relatives
- In group quarters: 296
Size of family households: 4,450 2-persons, 1,939 3-persons, 1,878 4-persons, 678 5-persons, 410 6-persons, 240 7-or-more-persons.
Size of nonfamily households: 2,978 1-person, 567 2-persons, 240 3-persons, 11 4-persons, 33 7-or-more-persons.
4,850 married couples with children.
1,792 single-parent households (399 men, 1,393 women).
93.8% of residents of Morrow speak English at home.
0.3% of residents speak Spanish at home (88% speak English very well, 6% speak English well, 3% speak English not well, 3% don't speak English at all).
5.6% of residents speak other Indo-European language at home (75% speak English very well, 20% speak English well, 2% speak English not well, 3% don't speak English at all).
0.4% of residents speak Asian or Pacific Island language at home (98% speak English very well, 2% speak English well).
In fiscal year 2004:
Federal Government expenditure: $100,572,000 ($2,937 per capita)
Department of Defense expenditure: $1,637,000
Federal direct payments to individuals for retirement and disability: $54,056,000
Federal other direct payments to individuals: $19,013,000
Federal direct payments not to individuals: $4,837,000
Federal grants: $18,597,000
Federal procurement contracts: $874,000 ($46,000 Department of Defense)
Federal salaries and wages: $3,195,000 ($0,000 Department of Defense)
Federal Government direct loans: $1,368,000
Federal guaranteed/insured loans: $20,527,000
Federal Government insurance: $17,731,000
Population change from April 1, 2000 to July 1, 2005:
Births: 2,183| Here: | 64 per 1000 residents |
| State: | 69 per 1000 residents |
Deaths: 1,353
| Here: | 39 per 1000 residents |
| State: | 50 per 1000 residents |
Net international migration: +20
| Here: | +1 per 1000 residents |
| State: | +7 per 1000 residents |
Net internal migration: +1,890
| Here: | |
| State: |
Total withdrawal of fresh water for public supply: 0.69 millions of gallons per day (all from ground)
| Here: | 6.5 |
| State: | 6.7 |
| Here: | 5.5 |
| State: | 4.4 |
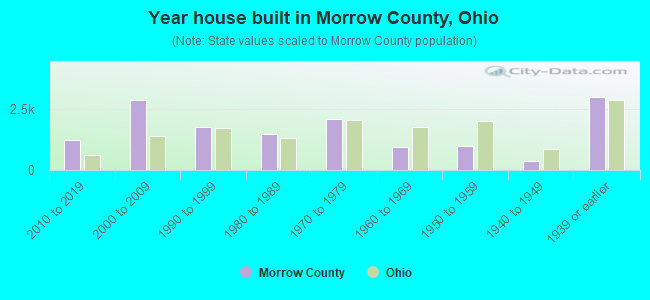
- Year house built in Morrow County, Ohio
- 572020 or later
- 1,0842010 to 2019
- 3,0542000 to 2009
- 1,8331990 to 1999
- 1,4051980 to 1989
- 1,9931970 to 1979
- 1,0041960 to 1969
- 8491950 to 1959
- 3831940 to 1949
- 2,9691939 or earlier
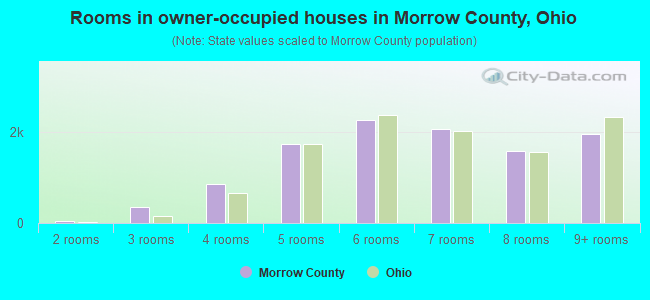
- Rooms in owner-occupied houses in Morrow County, Ohio
- 01 room
- 572 rooms
- 3203 rooms
- 6994 rooms
- 1,9595 rooms
- 2,5096 rooms
- 2,0207 rooms
- 1,5678 rooms
- 1,9719+ rooms
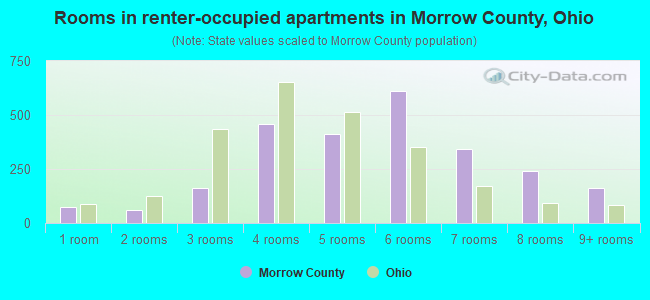
- Rooms in renter-occupied apartments in Morrow County, Ohio
- 711 room
- 662 rooms
- 1663 rooms
- 4534 rooms
- 4755 rooms
- 5546 rooms
- 2377 rooms
- 2068 rooms
- 1699+ rooms
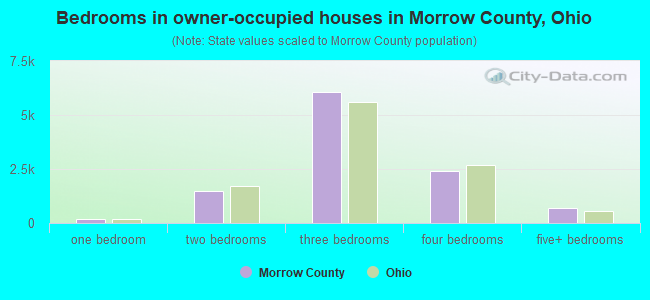
- Bedrooms in owner-occupied houses in Morrow County, Ohio
- 0no bedroom
- 1451 bedroom
- 1,5522 bedrooms
- 6,3683 bedrooms
- 2,3424 bedrooms
- 6595+ bedrooms
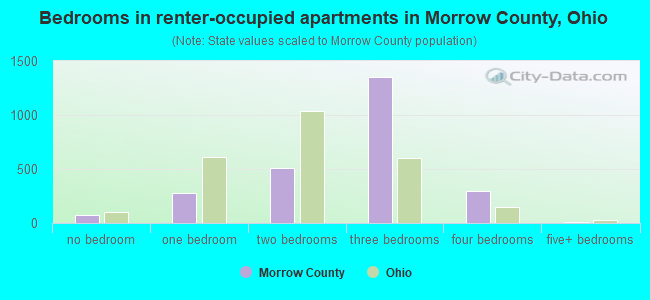
- Bedrooms in renter-occupied apartments in Morrow County, Ohio
- 75no bedroom
- 3381 bedroom
- 5262 bedrooms
- 1,1753 bedrooms
- 2784 bedrooms
- 65+ bedrooms
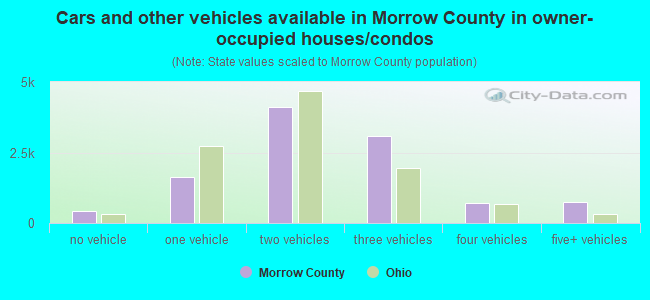
- Cars and other vehicles available in Morrow County in owner-occupied houses/condos
- 369no vehicle
- 1,7341 vehicle
- 4,1632 vehicles
- 3,2683 vehicles
- 7564 vehicles
- 7045+ vehicles
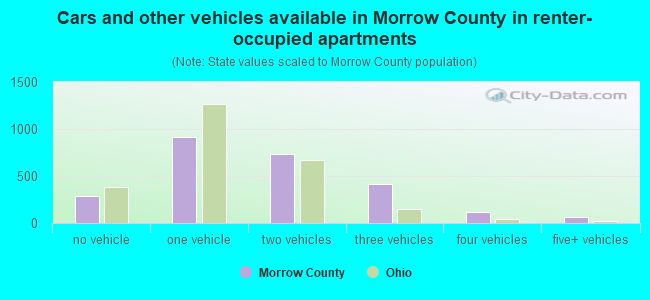
- Cars and other vehicles available in Morrow County in renter-occupied apartments
- 223no vehicle
- 1,0571 vehicle
- 7832 vehicles
- 2713 vehicles
- 374 vehicles
- 435+ vehicles
93.9% of Morrow County residents lived in the same house 1 years ago.
Out of people who lived in different houses, 26% lived in this county.
Out of people who lived in different counties, 84% lived in Ohio.
| Morrow County: | 93.9% |
| State average: | 87.8% |
Place of birth for U.S.-born residents:
- This state: 28,471
- Other state: 5,903
- Northeast: 1,092
- Midwest: 1,424
- South: 2,794
- West: 576
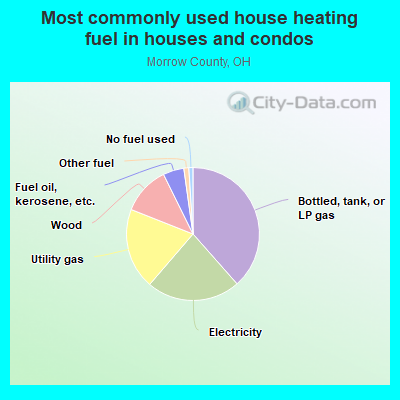
- 37.0%Bottled, tank, or LP gas
- 22.5%Electricity
- 21.0%Utility gas
- 11.4%Wood
- 4.9%Fuel oil, kerosene, etc.
- 2.1%Other fuel
- 1.1%No fuel used
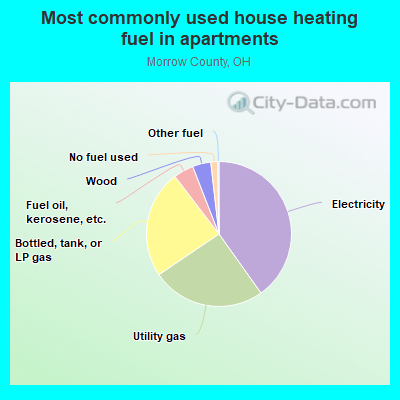
- 39.8%Electricity
- 26.1%Bottled, tank, or LP gas
- 22.7%Utility gas
- 5.5%Wood
- 3.6%Fuel oil, kerosene, etc.
- 2.0%No fuel used
- 0.2%Other fuel
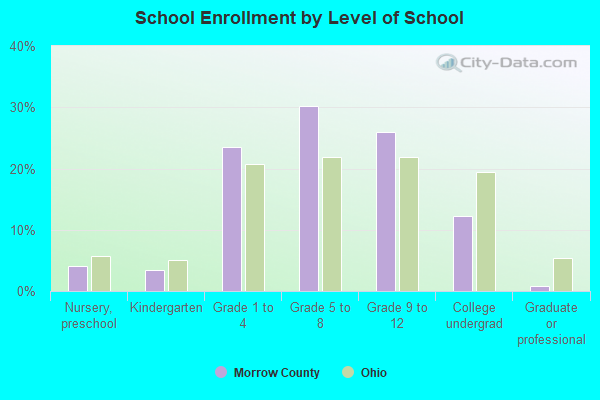
Private vs. public school enrollment:
| Here: | 8.1% |
| Ohio: | 16.0% |
| Here: | 2.7% |
| Ohio: | 13.1% |
| Here: | 21.8% |
| Ohio: | 22.3% |
Morrow County government finances - Expenditure in 2017:
- Assistance and Subsidies - Public Welfare, Federal Categorical Assistance Programs: $8,895,000
- Bond Funds - Cash and Securities: $5,459,000
Cash and Securities: $4,692,000
- Charges - Hospital Public: $3,184,000
Hospital Public: $2,884,000
Sewerage: $76,000
Sewerage: $69,000
Parks and Recreation: $11,000
Parks and Recreation: $10,000
- Current Operations - Hospitals: $71,166,000
Hospitals: $62,092,000
Public Welfare - Other: $10,195,000
Central Staff Services: $5,770,000
Regular Highways: $5,160,000
Central Staff Services: $5,034,000
Regular Highways: $4,502,000
General - Other: $4,208,000
Health - Other: $3,986,000
Police Protection: $3,948,000
General - Other: $3,672,000
Health - Other: $3,477,000
Police Protection: $3,445,000
Judicial and Legal Services: $1,924,000
Judicial and Legal Services: $1,678,000
General Public Buildings: $791,000
General Public Buildings: $691,000
Housing and Community Development: $527,000
Housing and Community Development: $460,000
Sewerage: $64,000
Sewerage: $55,000
Parks and Recreation: $9,000
Parks and Recreation: $8,000
- Federal Intergovernmental - Sewerage: $1,594,000
Sewerage: $1,594,000
Air Transportation: $42,000
Air Transportation: $42,000
- General - Interest on Debt: $670,000
Interest on Debt: $26,000
- Local Intergovernmental - Health and Hospitals: $185,000
Health and Hospitals: $185,000
- Long Term Debt - Outstanding Unspecified Public Purpose: $15,923,000
Beginning Outstanding - Unspecified Public Purpose: $13,902,000
Outstanding Unspecified Public Purpose: $11,881,000
Beginning Outstanding - Unspecified Public Purpose: $11,232,000
Issue, Unspecified Public Purpose: $6,713,000
Retired Unspecified Public Purpose: $2,021,000
Retired Unspecified Public Purpose: $2,021,000
Beginning Outstanding - Public Debt for Private Purpose: $193,000
Outstanding Nonguaranteed - Industrial Revenue: $177,000
Beginning Outstanding - Public Debt for Private Purpose: $161,000
Outstanding Nonguaranteed - Industrial Revenue: $145,000
Retired Nonguaranteed - Public Debt for Private Purpose: $16,000
Retired Nonguaranteed - Public Debt for Private Purpose: $16,000
- Miscellaneous - General Revenue - Other: $10,009,000
Fines and Forfeits: $9,798,000
General Revenue - Other: $5,079,000
Fines and Forfeits: $4,972,000
Rents: $728,000
Rents: $369,000
Interest Earnings: $277,000
Interest Earnings: $140,000
Sale of Property: $88,000
Sale of Property: $45,000
Donations From Private Sources: $8,000
Donations From Private Sources: $4,000
- Other Funds - Cash and Securities: $27,097,000
Cash and Securities: $23,290,000
- Sinking Funds - Cash and Securities: $206,000
Cash and Securities: $177,000
- State Intergovernmental - Public Welfare: $9,062,000
Public Welfare: $7,127,000
Highways: $3,340,000
Highways: $2,627,000
Housing and Community Development: $408,000
Housing and Community Development: $321,000
Health and Hospitals: $313,000
Health and Hospitals: $246,000
Other: $236,000
Other: $186,000
- Tax - Property: $8,862,000
Property: $7,821,000
General Sales and Gross Receipts: $4,467,000
General Sales and Gross Receipts: $3,942,000
Motor Vehicle License: $2,263,000
Motor Vehicle License: $1,997,000
Public Utilities Sales: $430,000
Public Utilities Sales: $380,000
Occupation and Business License - Other: $2,000
Occupation and Business License - Other: $2,000
- Total Salaries and Wages: $1,202,045,000
: $107,736,000
Morrow County government finances - Revenue in 2017:
- Assistance and Subsidies - Public Welfare, Federal Categorical Assistance Programs: $8,895,000
- Bond Funds - Cash and Securities: $5,459,000
Cash and Securities: $4,692,000
- Charges - Hospital Public: $3,184,000
Hospital Public: $2,884,000
Sewerage: $76,000
Sewerage: $69,000
Parks and Recreation: $11,000
Parks and Recreation: $10,000
- Current Operations - Hospitals: $71,166,000
Hospitals: $62,092,000
Public Welfare - Other: $10,195,000
Central Staff Services: $5,770,000
Regular Highways: $5,160,000
Central Staff Services: $5,034,000
Regular Highways: $4,502,000
General - Other: $4,208,000
Health - Other: $3,986,000
Police Protection: $3,948,000
General - Other: $3,672,000
Health - Other: $3,477,000
Police Protection: $3,445,000
Judicial and Legal Services: $1,924,000
Judicial and Legal Services: $1,678,000
General Public Buildings: $791,000
General Public Buildings: $691,000
Housing and Community Development: $527,000
Housing and Community Development: $460,000
Sewerage: $64,000
Sewerage: $55,000
Parks and Recreation: $9,000
Parks and Recreation: $8,000
- Federal Intergovernmental - Sewerage: $1,594,000
Sewerage: $1,594,000
Air Transportation: $42,000
Air Transportation: $42,000
- General - Interest on Debt: $670,000
Interest on Debt: $26,000
- Local Intergovernmental - Health and Hospitals: $185,000
Health and Hospitals: $185,000
- Long Term Debt - Outstanding Unspecified Public Purpose: $15,923,000
Beginning Outstanding - Unspecified Public Purpose: $13,902,000
Outstanding Unspecified Public Purpose: $11,881,000
Beginning Outstanding - Unspecified Public Purpose: $11,232,000
Issue, Unspecified Public Purpose: $6,713,000
Retired Unspecified Public Purpose: $2,021,000
Retired Unspecified Public Purpose: $2,021,000
Beginning Outstanding - Public Debt for Private Purpose: $193,000
Outstanding Nonguaranteed - Industrial Revenue: $177,000
Beginning Outstanding - Public Debt for Private Purpose: $161,000
Outstanding Nonguaranteed - Industrial Revenue: $145,000
Retired Nonguaranteed - Public Debt for Private Purpose: $16,000
Retired Nonguaranteed - Public Debt for Private Purpose: $16,000
- Miscellaneous - General Revenue - Other: $10,009,000
Fines and Forfeits: $9,798,000
General Revenue - Other: $5,079,000
Fines and Forfeits: $4,972,000
Rents: $728,000
Rents: $369,000
Interest Earnings: $277,000
Interest Earnings: $140,000
Sale of Property: $88,000
Sale of Property: $45,000
Donations From Private Sources: $8,000
Donations From Private Sources: $4,000
- Other Funds - Cash and Securities: $27,097,000
Cash and Securities: $23,290,000
- Sinking Funds - Cash and Securities: $206,000
Cash and Securities: $177,000
- State Intergovernmental - Public Welfare: $9,062,000
Public Welfare: $7,127,000
Highways: $3,340,000
Highways: $2,627,000
Housing and Community Development: $408,000
Housing and Community Development: $321,000
Health and Hospitals: $313,000
Health and Hospitals: $246,000
Other: $236,000
Other: $186,000
- Tax - Property: $8,862,000
Property: $7,821,000
General Sales and Gross Receipts: $4,467,000
General Sales and Gross Receipts: $3,942,000
Motor Vehicle License: $2,263,000
Motor Vehicle License: $1,997,000
Public Utilities Sales: $430,000
Public Utilities Sales: $380,000
Occupation and Business License - Other: $2,000
Occupation and Business License - Other: $2,000
- Total Salaries and Wages: $1,202,045,000
: $107,736,000
Morrow County government finances - Debt in 2017:
- Assistance and Subsidies - Public Welfare, Federal Categorical Assistance Programs: $8,895,000
- Bond Funds - Cash and Securities: $5,459,000
Cash and Securities: $4,692,000
- Charges - Hospital Public: $3,184,000
Hospital Public: $2,884,000
Sewerage: $76,000
Sewerage: $69,000
Parks and Recreation: $11,000
Parks and Recreation: $10,000
- Current Operations - Hospitals: $71,166,000
Hospitals: $62,092,000
Public Welfare - Other: $10,195,000
Central Staff Services: $5,770,000
Regular Highways: $5,160,000
Central Staff Services: $5,034,000
Regular Highways: $4,502,000
General - Other: $4,208,000
Health - Other: $3,986,000
Police Protection: $3,948,000
General - Other: $3,672,000
Health - Other: $3,477,000
Police Protection: $3,445,000
Judicial and Legal Services: $1,924,000
Judicial and Legal Services: $1,678,000
General Public Buildings: $791,000
General Public Buildings: $691,000
Housing and Community Development: $527,000
Housing and Community Development: $460,000
Sewerage: $64,000
Sewerage: $55,000
Parks and Recreation: $9,000
Parks and Recreation: $8,000
- Federal Intergovernmental - Sewerage: $1,594,000
Sewerage: $1,594,000
Air Transportation: $42,000
Air Transportation: $42,000
- General - Interest on Debt: $670,000
Interest on Debt: $26,000
- Local Intergovernmental - Health and Hospitals: $185,000
Health and Hospitals: $185,000
- Long Term Debt - Outstanding Unspecified Public Purpose: $15,923,000
Beginning Outstanding - Unspecified Public Purpose: $13,902,000
Outstanding Unspecified Public Purpose: $11,881,000
Beginning Outstanding - Unspecified Public Purpose: $11,232,000
Issue, Unspecified Public Purpose: $6,713,000
Retired Unspecified Public Purpose: $2,021,000
Retired Unspecified Public Purpose: $2,021,000
Beginning Outstanding - Public Debt for Private Purpose: $193,000
Outstanding Nonguaranteed - Industrial Revenue: $177,000
Beginning Outstanding - Public Debt for Private Purpose: $161,000
Outstanding Nonguaranteed - Industrial Revenue: $145,000
Retired Nonguaranteed - Public Debt for Private Purpose: $16,000
Retired Nonguaranteed - Public Debt for Private Purpose: $16,000
- Miscellaneous - General Revenue - Other: $10,009,000
Fines and Forfeits: $9,798,000
General Revenue - Other: $5,079,000
Fines and Forfeits: $4,972,000
Rents: $728,000
Rents: $369,000
Interest Earnings: $277,000
Interest Earnings: $140,000
Sale of Property: $88,000
Sale of Property: $45,000
Donations From Private Sources: $8,000
Donations From Private Sources: $4,000
- Other Funds - Cash and Securities: $27,097,000
Cash and Securities: $23,290,000
- Sinking Funds - Cash and Securities: $206,000
Cash and Securities: $177,000
- State Intergovernmental - Public Welfare: $9,062,000
Public Welfare: $7,127,000
Highways: $3,340,000
Highways: $2,627,000
Housing and Community Development: $408,000
Housing and Community Development: $321,000
Health and Hospitals: $313,000
Health and Hospitals: $246,000
Other: $236,000
Other: $186,000
- Tax - Property: $8,862,000
Property: $7,821,000
General Sales and Gross Receipts: $4,467,000
General Sales and Gross Receipts: $3,942,000
Motor Vehicle License: $2,263,000
Motor Vehicle License: $1,997,000
Public Utilities Sales: $430,000
Public Utilities Sales: $380,000
Occupation and Business License - Other: $2,000
Occupation and Business License - Other: $2,000
- Total Salaries and Wages: $1,202,045,000
: $107,736,000
Morrow County government finances - Cash and Securities in 2017:
- Assistance and Subsidies - Public Welfare, Federal Categorical Assistance Programs: $8,895,000
- Bond Funds - Cash and Securities: $5,459,000
Cash and Securities: $4,692,000
- Charges - Hospital Public: $3,184,000
Hospital Public: $2,884,000
Sewerage: $76,000
Sewerage: $69,000
Parks and Recreation: $11,000
Parks and Recreation: $10,000
- Current Operations - Hospitals: $71,166,000
Hospitals: $62,092,000
Public Welfare - Other: $10,195,000
Central Staff Services: $5,770,000
Regular Highways: $5,160,000
Central Staff Services: $5,034,000
Regular Highways: $4,502,000
General - Other: $4,208,000
Health - Other: $3,986,000
Police Protection: $3,948,000
General - Other: $3,672,000
Health - Other: $3,477,000
Police Protection: $3,445,000
Judicial and Legal Services: $1,924,000
Judicial and Legal Services: $1,678,000
General Public Buildings: $791,000
General Public Buildings: $691,000
Housing and Community Development: $527,000
Housing and Community Development: $460,000
Sewerage: $64,000
Sewerage: $55,000
Parks and Recreation: $9,000
Parks and Recreation: $8,000
- Federal Intergovernmental - Sewerage: $1,594,000
Sewerage: $1,594,000
Air Transportation: $42,000
Air Transportation: $42,000
- General - Interest on Debt: $670,000
Interest on Debt: $26,000
- Local Intergovernmental - Health and Hospitals: $185,000
Health and Hospitals: $185,000
- Long Term Debt - Outstanding Unspecified Public Purpose: $15,923,000
Beginning Outstanding - Unspecified Public Purpose: $13,902,000
Outstanding Unspecified Public Purpose: $11,881,000
Beginning Outstanding - Unspecified Public Purpose: $11,232,000
Issue, Unspecified Public Purpose: $6,713,000
Retired Unspecified Public Purpose: $2,021,000
Retired Unspecified Public Purpose: $2,021,000
Beginning Outstanding - Public Debt for Private Purpose: $193,000
Outstanding Nonguaranteed - Industrial Revenue: $177,000
Beginning Outstanding - Public Debt for Private Purpose: $161,000
Outstanding Nonguaranteed - Industrial Revenue: $145,000
Retired Nonguaranteed - Public Debt for Private Purpose: $16,000
Retired Nonguaranteed - Public Debt for Private Purpose: $16,000
- Miscellaneous - General Revenue - Other: $10,009,000
Fines and Forfeits: $9,798,000
General Revenue - Other: $5,079,000
Fines and Forfeits: $4,972,000
Rents: $728,000
Rents: $369,000
Interest Earnings: $277,000
Interest Earnings: $140,000
Sale of Property: $88,000
Sale of Property: $45,000
Donations From Private Sources: $8,000
Donations From Private Sources: $4,000
- Other Funds - Cash and Securities: $27,097,000
Cash and Securities: $23,290,000
- Sinking Funds - Cash and Securities: $206,000
Cash and Securities: $177,000
- State Intergovernmental - Public Welfare: $9,062,000
Public Welfare: $7,127,000
Highways: $3,340,000
Highways: $2,627,000
Housing and Community Development: $408,000
Housing and Community Development: $321,000
Health and Hospitals: $313,000
Health and Hospitals: $246,000
Other: $236,000
Other: $186,000
- Tax - Property: $8,862,000
Property: $7,821,000
General Sales and Gross Receipts: $4,467,000
General Sales and Gross Receipts: $3,942,000
Motor Vehicle License: $2,263,000
Motor Vehicle License: $1,997,000
Public Utilities Sales: $430,000
Public Utilities Sales: $380,000
Occupation and Business License - Other: $2,000
Occupation and Business License - Other: $2,000
- Total Salaries and Wages: $1,202,045,000
: $107,736,000
Supplemental Security Income (SSI) in 2006:
- Total number of recipients: 491
- Number of aged recipients: 19
- Number of blind and disabled recipients: 472
- Number of recipients under 18: 77
- Number of recipients between 18 and 64: 355
- Number of recipients older than 64: 59
- Number of recipients also receiving OASDI: 156
- Amount of payments (thousands of dollars): 214
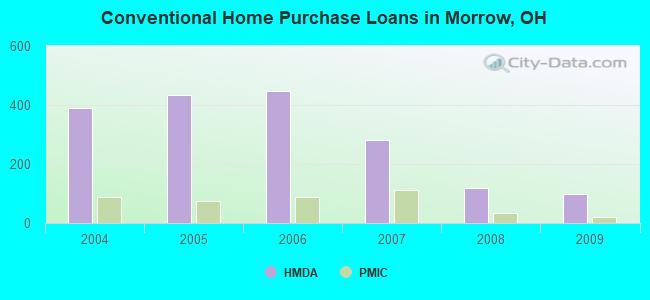
| Home Mortgage Disclosure Act Aggregated Statistics For Year 2009 (Based on 6 full tracts) | ||||||||||||||
| A) FHA, FSA/RHS & VA Home Purchase Loans | B) Conventional Home Purchase Loans | C) Refinancings | D) Home Improvement Loans | E) Loans on Dwellings For 5+ Families | F) Non-occupant Loans on < 5 Family Dwellings (A B C & D) | G) Loans On Manufactured Home Dwelling (A B C & D) | ||||||||
|---|---|---|---|---|---|---|---|---|---|---|---|---|---|---|
| Number | Average Value | Number | Average Value | Number | Average Value | Number | Average Value | Number | Average Value | Number | Average Value | Number | Average Value | |
| LOANS ORIGINATED | 129 | $111,682 | 99 | $127,798 | 568 | $135,271 | 39 | $41,974 | 1 | $94,000 | 41 | $129,366 | 67 | $86,925 |
| APPLICATIONS APPROVED, NOT ACCEPTED | 8 | $137,000 | 12 | $99,083 | 62 | $123,210 | 8 | $39,250 | 0 | $0 | 5 | $89,800 | 7 | $81,000 |
| APPLICATIONS DENIED | 24 | $104,208 | 46 | $79,413 | 284 | $135,465 | 28 | $30,071 | 0 | $0 | 13 | $77,846 | 44 | $77,205 |
| APPLICATIONS WITHDRAWN | 20 | $109,400 | 9 | $98,111 | 104 | $141,971 | 7 | $91,286 | 0 | $0 | 6 | $139,500 | 6 | $87,833 |
| FILES CLOSED FOR INCOMPLETENESS | 1 | $97,000 | 1 | $185,000 | 27 | $122,963 | 1 | $165,000 | 0 | $0 | 2 | $224,000 | 3 | $124,333 |
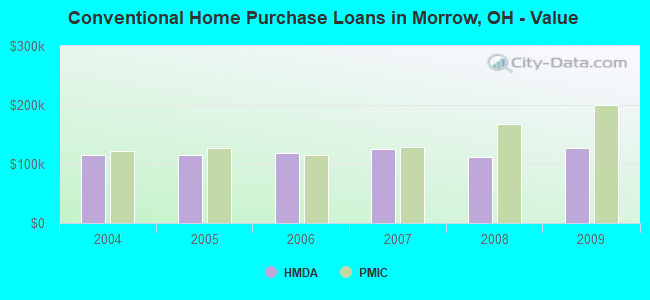
| Private Mortgage Insurance Companies Aggregated Statistics For Year 2009 (Based on 6 full tracts) | ||||||
| A) Conventional Home Purchase Loans | B) Refinancings | D) Loans On Manufactured Home Dwelling (A & B) | ||||
|---|---|---|---|---|---|---|
| Number | Average Value | Number | Average Value | Number | Average Value | |
| LOANS ORIGINATED | 19 | $199,632 | 13 | $167,692 | 0 | $0 |
| APPLICATIONS APPROVED, NOT ACCEPTED | 12 | $154,583 | 8 | $156,375 | 1 | $104,000 |
| APPLICATIONS DENIED | 7 | $134,571 | 2 | $229,000 | 0 | $0 |
| APPLICATIONS WITHDRAWN | 2 | $131,500 | 2 | $180,000 | 0 | $0 |
| FILES CLOSED FOR INCOMPLETENESS | 2 | $119,000 | 2 | $201,500 | 0 | $0 |
| Most common first names in Morrow County, OH among deceased individuals | ||
| Name | Count | Lived (average) |
|---|---|---|
| Mary | 150 | 78.9 years |
| Charles | 120 | 74.1 years |
| John | 118 | 73.3 years |
| William | 116 | 74.1 years |
| Robert | 113 | 69.7 years |
| James | 99 | 70.7 years |
| George | 66 | 78.0 years |
| Paul | 62 | 72.7 years |
| Helen | 55 | 81.0 years |
| Harold | 54 | 73.5 years |
| Most common last names in Morrow County, OH among deceased individuals | ||
| Last name | Count | Lived (average) |
|---|---|---|
| Smith | 82 | 75.0 years |
| Miller | 59 | 80.1 years |
| Davis | 47 | 78.0 years |
| Jones | 39 | 71.4 years |
| Williams | 35 | 75.0 years |
| Brown | 33 | 75.4 years |
| Baker | 33 | 80.8 years |
| Long | 28 | 76.6 years |
| Campbell | 25 | 77.6 years |
| Sherman | 24 | 76.4 years |
| Businesses in Morrow County, OH | ||||
| Name | Count | Name | Count | |
|---|---|---|---|---|
| ALDO | 1 | Kroger | 1 | |
| Arby's | 1 | McDonald's | 2 | |
| AutoZone | 1 | Pizza Hut | 1 | |
| Best Western | 1 | RadioShack | 1 | |
| Curves | 1 | Rite Aid | 1 | |
| Domino's Pizza | 1 | Subway | 3 | |
| FedEx | 2 | Taco Bell | 1 | |
| GNC | 1 | True Value | 2 | |
| H&R Block | 1 | U-Haul | 1 | |
| Jones New York | 1 | UPS | 1 | |
| Knights Inn | 1 | Wendy's | 1 | |