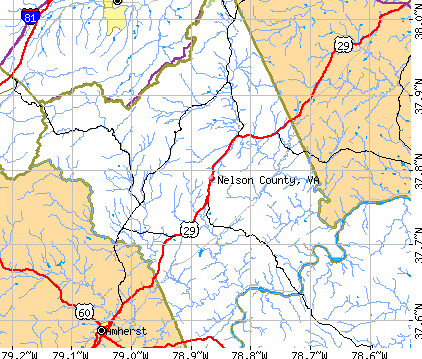
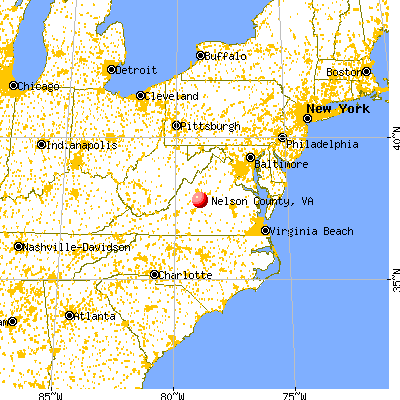
Nelson County, Virginia (VA)
County owner-occupied free and clear houses and condos in 2010: 2,104
County owner-occupied houses and condos in 2000: 4,758
Renter-occupied apartments: 1,345 (it was 1,129 in 2000)
| % of renters here: | 19% |
| State: | 33% |
Land area: 472 sq. mi.
Water area: 2.0 sq. mi.
Population density: 31 people per square mile (low).
Industries providing employment: Educational, health and social services (26.4%), Professional, scientific, management, administrative, and waste management services (11.7%), Arts, entertainment, recreation, accommodation and food services (11.0%), Construction (10.2%).
Type of workers:
- Private wage or salary: 73%
- Government: 15%
- Self-employed, not incorporated: 12%
- Unpaid family work: 1%
- OSM Map
- General Map
- Google Map
- MSN Map

- 11,73379.9%White Non-Hispanic Alone
- 1,82212.4%Black Non-Hispanic Alone
- 7084.8%Hispanic or Latino
- 3182.2%Two or more races
- 710.5%Some other race alone
- 290.2%Asian alone
- 100.07%American Indian and Alaska Native alone

| Median resident age: | 51.1 years |
| Virginia median age: | 39.0 years |
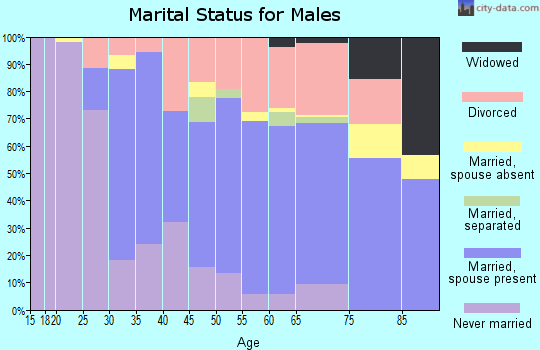
| Males: 7,516 | |
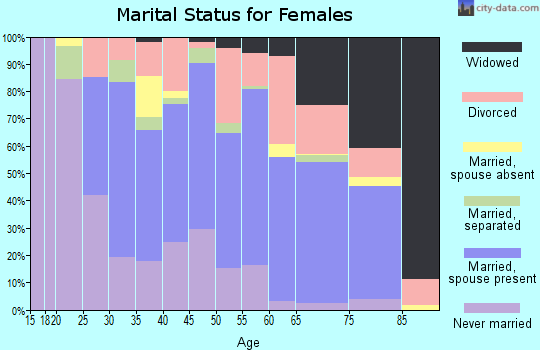
| Females: 7,358 |

 | To what extent is the affluence along Constitution Highway a product of DC Metro/NOVA money? (4 replies) |
| Radon in Nelson County? (2 replies) |
| Nelson County - Neighborhoods to avoid? (4 replies) |
| Where to live? What about those great school scores? (18 replies) |
| Staunton (4 replies) |
| Hippies and earth people in Charlottesville? (11 replies) |
| Nelson County: | 2.0 people |
| Virginia: | 3 people |
Estimated median household income in 2022: $63,018 ($36,769 in 1999)
| This county: | $63,018 |
| Virginia: | $85,873 |
Median contract rent in 2022 for apartments: $696 (lower quartile is $478, upper quartile is $887)
| This county: | $696 |
| State: | $1270 |
Estimated median house or condo value in 2022: $296,068 (it was $94,000 in 2000)
| Nelson: | $296,068 |
| Virginia: | $365,700 |
Mean price in 2022:
Median monthly housing costs for homes and condos with a mortgage: $1,356Detached houses: $375,131
Here: $375,131 State: $472,865 Townhouses or other attached units: $296,643
Here: $296,643 State: $457,437 Mobile homes: $83,150
Here: $83,150 State: $100,736
Median monthly housing costs for units without a mortgage: $470
Institutionalized population: 60
Crime in 2021 (reported by the sheriff's office or county police, not the county total):
- Murders: 0
- Rapes: 8
- Robberies: 2
- Assaults: 26
- Burglaries: 48
- Thefts: 147
- Auto thefts: 17
Crime in 2020 (reported by the sheriff's office or county police, not the county total):
- Murders: 0
- Rapes: 13
- Robberies: 0
- Assaults: 23
- Burglaries: 41
- Thefts: 142
- Auto thefts: 22
Single-family new house construction building permits:
- 2022: 70 buildings, average cost: $283,800
- 2021: 82 buildings, average cost: $283,800
- 2020: 71 buildings, average cost: $283,800
- 2019: 46 buildings, average cost: $317,800
- 2018: 45 buildings, average cost: $317,800
- 2017: 51 buildings, average cost: $254,600
- 2016: 51 buildings, average cost: $263,000
- 2015: 57 buildings, average cost: $238,700
- 2014: 50 buildings, average cost: $285,800
- 2013: 52 buildings, average cost: $273,000
- 2012: 43 buildings, average cost: $247,900
- 2011: 45 buildings, average cost: $255,800
- 2010: 51 buildings, average cost: $233,700
- 2009: 51 buildings, average cost: $230,000
- 2008: 77 buildings, average cost: $232,000
- 2007: 123 buildings, average cost: $273,200
- 2006: 156 buildings, average cost: $305,000
- 2005: 216 buildings, average cost: $130,600
- 2004: 201 buildings, average cost: $176,300
- 2003: 157 buildings, average cost: $182,800
- 2002: 120 buildings, average cost: $162,700
- 2001: 116 buildings, average cost: $161,700
- 2000: 112 buildings, average cost: $157,400
- 1999: 140 buildings, average cost: $150,400
- 1998: 126 buildings, average cost: $145,500
- 1997: 127 buildings, average cost: $134,700


Median real estate property taxes paid for housing units with mortgages in 2022: $1,580 (0.6%)
Median real estate property taxes paid for housing units with no mortgage in 2022: $1,545 (0.5%)


| Nelson County: | 14.0% |
| Virginia: | 10.6% |
Median age of residents in 2022: 51.1 years old
(Males: 48.7 years old, Females: 53.4 years old)
(Median age for: White residents: 53.6 years old, Black residents: 50.4 years old, Asian residents: 50.0 years old, Hispanic or Latino residents: 24.6 years old, Other race residents: 27.3 years old)
Area name: Charlottesville, VA MSA
Fair market rent in 2006 for a 1-bedroom apartment in Nelson County is $643 a month.
Fair market rent for a 2-bedroom apartment is $761 a month.
Fair market rent for a 3-bedroom apartment is $986 a month.
Cities in this county include: Nellysford, Arrington, Lovingston, Shipman, Schuyler, Wintergreen.
Neighboring counties: Elliott County, Kentucky  , Hanover County
  , Johnson County, Kentucky , New Kent County , Vanderburgh County, Indiana , Stanton County, Kansas .
| Here: | 2.5% |
| Virginia: | 2.7% |


Current college students: 393
People 25 years of age or older with a high school degree or higher: 86.6%
People 25 years of age or older with a bachelor's degree or higher: 30.4%
Number of foreign born residents: 638 (58.0% naturalized citizens)
| Nelson County: | 4.3% |
| Whole state: | 12.7% |

- Year of entry for the foreign-born population
- 1382010 or later
- 2582000 to 2009
- 671990 to 1999
- 511980 to 1989
- 491970 to 1979
- 91Before 1970
Mean travel time to work (commute): minutes
Percentage of county residents living and working in this county: 98.5%
Housing units in structures:
- One, detached: 7,616
- One, attached: 157
- Two: 16
- 3 or 4: 141
- 5 to 9: 734
- 10 to 19: 343
- 20 to 49: 50
- 50 or more: 6
- Mobile homes: 943
- Boats, RVs, vans, etc.: 9
Housing units in Nelson County with a mortgage: 2,952 (288 second mortgage, 20 home equity loan, 256 both second mortgage and home equity loan)
Houses without a mortgage: 85
| Here: | 2.3% with mortgage |
| State: | 97.2% with mortgage |
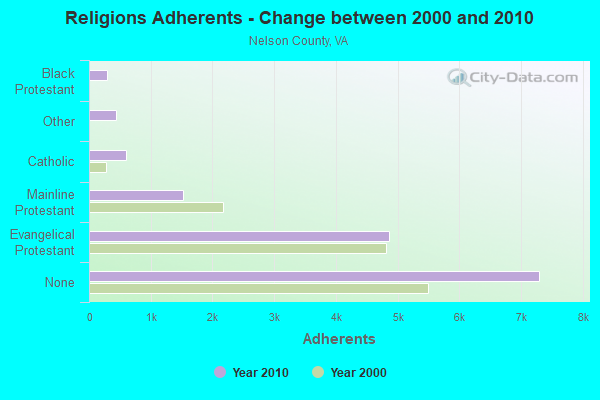
Religion statistics for Nelson County
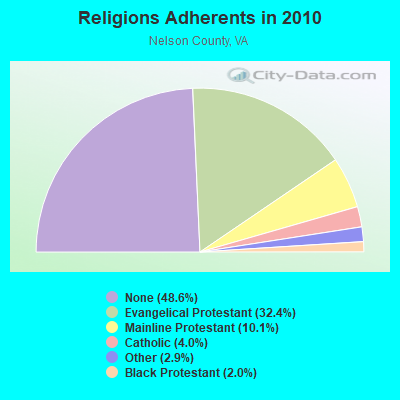
| Religion | Adherents | Congregations |
|---|---|---|
| Evangelical Protestant | 4,867 | 26 |
| Mainline Protestant | 1,522 | 15 |
| Catholic | 607 | 1 |
| Other | 431 | 1 |
| Black Protestant | 294 | 2 |
| None | 7,299 | - |
Source: Clifford Grammich, Kirk Hadaway, Richard Houseal, Dale E.Jones, Alexei Krindatch, Richie Stanley and Richard H.Taylor. 2012. 2010 U.S.Religion Census: Religious Congregations & Membership Study. Association of Statisticians of American Religious Bodies. Jones, Dale E., et al. 2002. Congregations and Membership in the United States 2000. Nashville, TN: Glenmary Research Center.
Food Environment Statistics:
| Nelson County: | 2.63 / 10,000 pop. |
| State: | 2.03 / 10,000 pop. |
| This county: | 1.97 / 10,000 pop. |
| Virginia: | 1.43 / 10,000 pop. |
| Nelson County: | 8.54 / 10,000 pop. |
| Virginia: | 4.03 / 10,000 pop. |
| This county: | 3.94 / 10,000 pop. |
| State: | 7.65 / 10,000 pop. |
| Nelson County: | 10.2% |
| Virginia: | 9.3% |
| Nelson County: | 26.2% |
| State: | 26.7% |
| Here: | 18.6% |
| State: | 18.6% |
Agriculture in Nelson County:
Average size of farms: 186 acresAverage value of agricultural products sold per farm: $16,590
Average value of crops sold per acre for harvested cropland: $281.86
The value of nursery, greenhouse, floriculture, and sod as a percentage of the total market value of agricultural products sold: 11.50%
The value of livestock, poultry, and their products as a percentage of the total market value of agricultural products sold: 35.73%
Average total farm production expenses per farm: $17,458
Harvested cropland as a percentage of land in farms: 20.37%
Average market value of all machinery and equipment per farm: $27,229
The percentage of farms operated by a family or individual: 88.16%
Average age of principal farm operators: 56 years
Average number of cattle and calves per 100 acres of all land in farms: 14.89
Milk cows as a percentage of all cattle and calves: 0.07%
Corn for grain: 173 harvested acres
All wheat for grain: 208 harvested acres
Vegetables: 281 harvested acres
Land in orchards: 1,237 acres
Earthquake activity:
Nelson County-area historical earthquake activity is significantly above Virginia state average. It is 43% smaller than the overall U.S. average.On 8/23/2011 at 17:51:04, a magnitude 5.8 (5.8 MW, Depth: 3.7 mi, Class: Moderate, Intensity: VI - VII) earthquake occurred 51.5 miles away from Nelson County center
On 8/9/2020 at 12:07:37, a magnitude 5.1 (5.1 MW, Depth: 4.7 mi) earthquake occurred 152.7 miles away from the county center
On 12/9/2003 at 20:59:18, a magnitude 4.5 (4.5 ML, Depth: 6.2 mi, Class: Light, Intensity: IV - V) earthquake occurred 41.9 miles away from the county center
On 8/25/2011 at 05:07:52, a magnitude 4.5 (4.5 ML, Depth: 4.2 mi) earthquake occurred 50.3 miles away from the county center
On 12/9/2003 at 20:59:14, a magnitude 4.5 (4.5 MB, 4.5 LG) earthquake occurred 54.5 miles away from Nelson County center
On 8/24/2011 at 00:04:36, a magnitude 4.2 (4.2 ML) earthquake occurred 50.6 miles away from the county center
Magnitude types: regional Lg-wave magnitude (LG), body-wave magnitude (MB), local magnitude (ML), moment magnitude (MW)
Most recent natural disasters:
- Virginia Covid-19 Pandemic, Incident Period: January 20, 2020, Major Disaster (Presidential) Declared DR-4512-VA: April 2, 2020, FEMA Id: 4512, Natural disaster type: Other
- Virginia Hurricane Florence, Incident Period: September 8, 2018 - September 21, 2018, FEMA Id: 4401, Natural disaster type: Hurricane
- Virginia Hurricane Sandy, Incident Period: October 26, 2012 to November 01, 2012, Emergency Declared EM-3359: October 29, 2012, FEMA Id: 3359, Natural disaster type: Hurricane
- Virginia Severe Storms and Straight-line Winds, Incident Period: June 29, 2012 to July 01, 2012, Major Disaster (Presidential) Declared DR-4072: July 27, 2012, FEMA Id: 4072, Natural disaster type: Storm, Wind
- Virginia Severe Winter Storms and Snowstorms, Incident Period: February 05, 2010 to February 11, 2010, Major Disaster (Presidential) Declared DR-1905: April 27, 2010, FEMA Id: 1905, Natural disaster type: Snowstorm, Winter Storm
- Virginia Severe Winter Storm and Snowstorm, Incident Period: December 18, 2009 to December 20, 2009, Major Disaster (Presidential) Declared DR-1874: February 16, 2010, FEMA Id: 1874, Natural disaster type: Snowstorm, Winter Storm
- Virginia Hurricane Katrina Evacuation, Incident Period: August 29, 2005 to October 01, 2005, Emergency Declared EM-3240: September 12, 2005, FEMA Id: 3240, Natural disaster type: Hurricane
- Virginia Hurricane Isabel, Incident Period: September 18, 2003 to October 01, 2003, Major Disaster (Presidential) Declared DR-1491: September 18, 2003, FEMA Id: 1491, Natural disaster type: Hurricane
- Virginia Heard Mountain Fire Complex, Incident Period: November 19, 2001 to December 09, 2001, Fire Management Assistance Declared: November 20, 2001, FEMA Id: 2394, Natural disaster type: Fire
- Virginia Winter Storm, Incident Period: January 25, 2000 to January 30, 2000, Major Disaster (Presidential) Declared DR-1318: February 28, 2000, FEMA Id: 1318, Natural disaster type: Winter Storm
- 12 other natural disasters have been reported since 1953.
The number of natural disasters in Nelson County (22) is greater than the US average (15).
Major Disasters (Presidential) Declared: 15
Emergencies Declared: 5
Causes of natural disasters: Storms: 7, Floods: 5, Hurricanes: 5, Winter Storms: 5, Droughts: 2, Ice Storms: 2, Snowstorms: 2, Blizzard: 1, Fire: 1, Tropical Storm: 1, Wind: 1, Other: 1 (Note: some incidents may be assigned to more than one category).

Means of transportation to work:
- Drove a car alone: 3,015 (54.6%)
- Carpooled: 583 (10.6%)
- Subway or elevated rail: 12 (0.2%)
- Taxicab, motorcycle, or other means: 105 (1.9%)
- Walked: 139 (2.5%)
- Worked at home: 1,954 (35.4%)


- Health care and social assistance (23%)
- Educational services (18%)
- Accommodation and food services (7%)
- Professional, scientific, and technical services (7%)
- Retail trade (6%)
- Other services, except public administration (5%)
- Administrative and support and waste management services (4%)

- Health care and social assistance (26%)
- Educational services (20%)
- Accommodation and food services (8%)
- Professional, scientific, and technical services (8%)
- Retail trade (7%)
- Other services, except public administration (5%)
- Administrative and support and waste management services (4%)

- Management occupations (17%)
- Construction and extraction occupations (16%)
- Production occupations (9%)
- Building and grounds cleaning and maintenance occupations (8%)
- Installation, maintenance, and repair occupations (7%)
- Sales and related occupations (6%)
- Farming, fishing, and forestry occupations (6%)

- Office and administrative support occupations (17%)
- Educational instruction, and library occupations (14%)
- Management occupations (11%)
- Healthcare support occupations (8%)
- Personal care and service occupations (7%)
- Health diagnosing and treating practitioners and other technical occupations (7%)
- Food preparation and serving related occupations (6%)

- Mexico (22%)
- Kenya (20%)
- Jamaica (16%)
- Armenia (11%)
- Nigeria (5%)
- Norway (4%)
- Philippines (4%)

- English (12%)
- American (11%)
- Irish (8%)
- German (6%)
- European (3%)
- Scotch-Irish (2%)
- Ukrainian (2%)


People in group quarters in Nelson County, Virginia in 2010:
- 60 people in nursing facilities/skilled-nursing facilities
- 32 people in workers' group living quarters and job corps centers
- 10 people in other noninstitutional facilities
People in group quarters in Nelson County, Virginia in 2000:
- 80 people in other noninstitutional group quarters
- 59 people in nursing homes
- 46 people in agriculture workers' dormitories on farms
- 15 people in religious group quarters
- 6 people in unknown juvenile institutions
7.90% of this county's 2021 resident taxpayers lived in other counties in 2020 ($86,836 average adjusted gross income)
| Here: | 7.90% |
| Virginia average: | 10.16% |
10 or fewer of this county's residents moved from foreign countries.
5.67% relocated from other counties in Virginia ($52,908 average AGI)
2.23% relocated from other states ($33,928 average AGI)
Nelson County: 2.23% Virginia average: 3.91%

Top counties from which taxpayers relocated into this county between 2020 and 2021:
| from Albemarle County, VA | |
| from Augusta County, VA | |
| from Charlottesville city, VA | |
| from Amherst County, VA |
6.74% of this county's 2020 resident taxpayers moved to other counties in 2021 ($58,269 average adjusted gross income)
| Here: | 6.74% |
| Virginia average: | 10.20% |
10 or fewer of this county's residents moved to foreign countries.
4.97% relocated to other counties in Virginia ($40,669 average AGI)
1.76% relocated to other states ($17,600 average AGI)
Nelson County: 1.76% Virginia average: 3.98%

Top counties to which taxpayers relocated from this county between 2020 and 2021:
| to Albemarle County, VA | |
| to Amherst County, VA | |
| to Waynesboro city, VA | |
| to Augusta County, VA |
Births per 1000 population from 1990 to 1999: 11.3
Births per 1000 population from 2000 to 2006: 10.3

Deaths per 1000 population from 1990 to 1999: 11.5
Deaths per 1000 population from 2000 to 2009: 10.9
Deaths per 1000 population from 2010 to 2020: 12.6

Infant deaths per 1000 live births from 1990 to 1999: 4.6
Infant deaths per 1000 live births from 2000 to 2006: 9.4

Persons under 19 years old without health insurance coverage in 2018: 8.0%


Persons enrolled in hospital insurance and/or supplemental medical insurance (Medicare) in July 1, 2007: 3,136 (2,675 aged, 461 disabled)
Children under 18 without health insurance coverage in 2007: 382 (12%)


Most common underlying causes of death in Nelson County, Virginia in 1999 - 2019:
- Bronchus or lung, unspecified - Malignant neoplasms (243)
- Atherosclerotic heart disease (215)
- Acute myocardial infarction, unspecified (103)
- Stroke, not specified as haemorrhage or infarction (24)
- Unspecified dementia (22)
- Alzheimer disease, unspecified (11)
- Chronic obstructive pulmonary disease, unspecified (10)
Population without health insurance coverage in 2000: 11%
Children under 18 without health insurance coverage in 2000: 8%
Medical specialist MDs per 100,000 population in 2005: 993
Dentists per 100,000 population in 1998: 13
Total births per 100,000 population, July 2005 - July 2006 : 22
Total deaths per 100,000 population, July 2005 - July 2006: 79
Limited-service eating places per 100,000 population in 2005 : 13
Crimes per 100,000 population in 1996: 1
Household type by relationship:
Households: 14,874- Male householders: 3,001 (792 living alone), Female householders: 3,301 (1,147 living alone)
3,388 spouses (3,311 opposite-sex spouses), 363 unmarried partners, (344 opposite-sex unmarried partners), 3,663 children (3,371 natural, 48 adopted, 245 stepchildren), 339 grandchildren, 201 brothers or sisters, 112 parents, 0 foster children, 153 other relatives, 275 non-relatives
- In group quarters: 115
Size of family households: 2,350 2-persons, 662 3-persons, 510 4-persons, 203 5-persons, 158 6-persons, 138 7-or-more-persons.
Size of nonfamily households: 1,940 1-person, 361 2-persons, 8 3-persons.
1,982 married couples with children.
210 single-parent households (11 men, 199 women).
94.8% of residents of Nelson speak English at home.
3.1% of residents speak Spanish at home (66% speak English very well, 12% speak English well, 22% speak English not well).
1.1% of residents speak other Indo-European language at home (28% speak English very well, 72% speak English well).
0.3% of residents speak Asian or Pacific Island language at home (74% speak English very well, 26% speak English well).
1.3% of residents speak other language at home (100% speak English very well).
In fiscal year 2004:
Federal Government expenditure: $109,364,000 ($7,339 per capita)
Department of Defense expenditure: $16,596,000
Federal direct payments to individuals for retirement and disability: $53,936,000
Federal other direct payments to individuals: $19,551,000
Federal direct payments not to individuals: $444,000
Federal grants: $16,529,000
Federal procurement contracts: $15,408,000 ($10,728,000 Department of Defense)
Federal salaries and wages: $3,495,000 ($39,000 Department of Defense)
Federal Government direct loans: $1,503,000
Federal guaranteed/insured loans: $3,956,000
Federal Government insurance: $15,748,000
Population change from April 1, 2000 to July 1, 2005:
Births: 843| Here: | 56 per 1000 residents |
| State: | 70 per 1000 residents |
Deaths: 879
| Here: | 58 per 1000 residents |
| State: | 40 per 1000 residents |
Net international migration: +12
| Here: | +1 per 1000 residents |
| State: | +18 per 1000 residents |
Net internal migration: +698
| Here: | +46 per 1000 residents |
| State: | +14 per 1000 residents |

Total withdrawal of fresh water for public supply: 0.20 millions of gallons per day (all from ground)
| Here: | 6.5 |
| State: | 7.0 |
| Here: | 5.5 |
| State: | 4.3 |

- Year house built in Nelson County, Virginia
- 522020 or later
- 3712010 to 2019
- 2,1682000 to 2009
- 1,4531990 to 1999
- 1,9041980 to 1989
- 1,3391970 to 1979
- 5871960 to 1969
- 5191950 to 1959
- 2161940 to 1949
- 1,3371939 or earlier

- Rooms in owner-occupied houses in Nelson County, Virginia
- 101 room
- 72 rooms
- 1433 rooms
- 3644 rooms
- 9065 rooms
- 1,0506 rooms
- 7587 rooms
- 6838 rooms
- 1,0919+ rooms

- Rooms in renter-occupied apartments in Nelson County, Virginia
- 121 room
- 522 rooms
- 1993 rooms
- 2024 rooms
- 1715 rooms
- 2456 rooms
- 1757 rooms
- 708 rooms
- 1719+ rooms

- Bedrooms in owner-occupied houses in Nelson County, Virginia
- 11no bedroom
- 1791 bedroom
- 6542 bedrooms
- 2,6573 bedrooms
- 1,2464 bedrooms
- 2645+ bedrooms

- Bedrooms in renter-occupied apartments in Nelson County, Virginia
- 13no bedroom
- 2561 bedroom
- 3522 bedrooms
- 4283 bedrooms
- 1474 bedrooms
- 1015+ bedrooms

- Cars and other vehicles available in Nelson County in owner-occupied houses/condos
- 183no vehicle
- 8401 vehicle
- 1,8842 vehicles
- 1,1673 vehicles
- 4724 vehicles
- 4625+ vehicles

- Cars and other vehicles available in Nelson County in renter-occupied apartments
- 188no vehicle
- 6311 vehicle
- 2022 vehicles
- 2473 vehicles
- 314 vehicles
- 05+ vehicles
90.9% of Nelson County residents lived in the same house 1 years ago.
Out of people who lived in different houses, 29% lived in this county.
Out of people who lived in different counties, 81% lived in Virginia.
| Nelson County: | 90.9% |
| State average: | 86.6% |
Place of birth for U.S.-born residents:
- This state: 9,604
- Other state: 4,533
- Northeast: 1,750
- Midwest: 844
- South: 1,661
- West: 261


- 61.3%Electricity
- 18.2%Bottled, tank, or LP gas
- 10.6%Wood
- 6.0%Fuel oil, kerosene, etc.
- 3.0%Utility gas
- 0.9%Other fuel

- 66.2%Electricity
- 12.5%Fuel oil, kerosene, etc.
- 11.3%Bottled, tank, or LP gas
- 7.6%Wood
- 2.4%Utility gas
Private vs. public school enrollment:
| Here: | 10.8% |
| Virginia: | 13.2% |
| Here: | 19.2% |
| Virginia: | 10.2% |
| Here: | 20.2% |
| Virginia: | 18.7% |


Nelson County government finances - Expenditure in 2017:
- Assistance and Subsidies - Public Welfare, Federal Categorical Assistance Programs: $275,000
- Bond Funds - Cash and Securities: $2,636,000
- Charges - Other: $567,000
Elementary and Secondary Education School Lunch: $538,000
Sewerage: $147,000
Solid Waste Management: $147,000
Parks and Recreation: $48,000
Elementary and Secondary Education School Tuition and Transportation: $4,000
- Construction - Police Protection: $1,346,000
Judicial and Legal Services: $1,283,000
Elementary and Secondary Education: $835,000
- Current Operations - Elementary and Secondary Education: $27,402,000
General - Other: $2,314,000
Police Protection: $1,563,000
Central Staff Services: $1,087,000
Public Welfare - Other: $1,049,000
Solid Waste Management: $1,009,000
Financial Administration: $947,000
Housing and Community Development: $938,000
Judicial and Legal Services: $801,000
Public Welfare, Vendor Payments for Other Purposes: $729,000
Local Fire Protection: $653,000
General Public Buildings: $612,000
Regular Highways: $344,000
Water Utilities: $299,000
Libraries: $296,000
Health - Other: $258,000
Protective Inspection and Regulation - Other: $232,000
Parks and Recreation: $223,000
Sewerage: $187,000
Correctional Institutions: $99,000
Natural Resources - Other: $30,000
- Federal Intergovernmental - Other: $1,760,000
Public Welfare: $447,000
Housing and Community Development: $289,000
Education: $114,000
Highways: $55,000
General Local Government Support: $50,000
Natural Resources: $29,000
- General - Interest on Debt: $1,536,000
- Intergovernmental to Local - Other - Correctional Institutions: $574,000
Other - Elementary and Secondary Education: $565,000
- Local Intergovernmental - Education: $923,000
- Long Term Debt - Beginning Outstanding - Unspecified Public Purpose: $33,653,000
Outstanding Unspecified Public Purpose: $22,668,000
Retired Unspecified Public Purpose: $10,985,000
- Miscellaneous - Rents: $838,000
Interest Earnings: $838,000
General Revenue - Other: $722,000
Fines and Forfeits: $251,000
Sale of Property: $2,000
Donations From Private Sources: $1,000
- Other Capital Outlay - Elementary and Secondary Education: $502,000
- Other Funds - Cash and Securities: $17,956,000
- Revenue - Water Utilities: $109,000
- Sinking Funds - Cash and Securities: $191,000
- State Intergovernmental - Education: $11,225,000
General Local Government Support: $2,548,000
Other: $1,988,000
Public Welfare: $335,000
- Tax - Property: $24,289,000
Other Selective Sales: $1,600,000
General Sales and Gross Receipts: $1,203,000
Motor Vehicle License: $803,000
Public Utilities Sales: $544,000
Other License: $206,000
Occupation and Business License - Other: $38,000
- Total Salaries and Wages: $15,296,000
- Water Utilities - Interest on Debt: $50,000
Nelson County government finances - Revenue in 2017:
- Assistance and Subsidies - Public Welfare, Federal Categorical Assistance Programs: $275,000
- Bond Funds - Cash and Securities: $2,636,000
- Charges - Other: $567,000
Elementary and Secondary Education School Lunch: $538,000
Sewerage: $147,000
Solid Waste Management: $147,000
Parks and Recreation: $48,000
Elementary and Secondary Education School Tuition and Transportation: $4,000
- Construction - Police Protection: $1,346,000
Judicial and Legal Services: $1,283,000
Elementary and Secondary Education: $835,000
- Current Operations - Elementary and Secondary Education: $27,402,000
General - Other: $2,314,000
Police Protection: $1,563,000
Central Staff Services: $1,087,000
Public Welfare - Other: $1,049,000
Solid Waste Management: $1,009,000
Financial Administration: $947,000
Housing and Community Development: $938,000
Judicial and Legal Services: $801,000
Public Welfare, Vendor Payments for Other Purposes: $729,000
Local Fire Protection: $653,000
General Public Buildings: $612,000
Regular Highways: $344,000
Water Utilities: $299,000
Libraries: $296,000
Health - Other: $258,000
Protective Inspection and Regulation - Other: $232,000
Parks and Recreation: $223,000
Sewerage: $187,000
Correctional Institutions: $99,000
Natural Resources - Other: $30,000
- Federal Intergovernmental - Other: $1,760,000
Public Welfare: $447,000
Housing and Community Development: $289,000
Education: $114,000
Highways: $55,000
General Local Government Support: $50,000
Natural Resources: $29,000
- General - Interest on Debt: $1,536,000
- Intergovernmental to Local - Other - Correctional Institutions: $574,000
Other - Elementary and Secondary Education: $565,000
- Local Intergovernmental - Education: $923,000
- Long Term Debt - Beginning Outstanding - Unspecified Public Purpose: $33,653,000
Outstanding Unspecified Public Purpose: $22,668,000
Retired Unspecified Public Purpose: $10,985,000
- Miscellaneous - Rents: $838,000
Interest Earnings: $838,000
General Revenue - Other: $722,000
Fines and Forfeits: $251,000
Sale of Property: $2,000
Donations From Private Sources: $1,000
- Other Capital Outlay - Elementary and Secondary Education: $502,000
- Other Funds - Cash and Securities: $17,956,000
- Revenue - Water Utilities: $109,000
- Sinking Funds - Cash and Securities: $191,000
- State Intergovernmental - Education: $11,225,000
General Local Government Support: $2,548,000
Other: $1,988,000
Public Welfare: $335,000
- Tax - Property: $24,289,000
Other Selective Sales: $1,600,000
General Sales and Gross Receipts: $1,203,000
Motor Vehicle License: $803,000
Public Utilities Sales: $544,000
Other License: $206,000
Occupation and Business License - Other: $38,000
- Total Salaries and Wages: $15,296,000
- Water Utilities - Interest on Debt: $50,000
Nelson County government finances - Debt in 2017:
- Assistance and Subsidies - Public Welfare, Federal Categorical Assistance Programs: $275,000
- Bond Funds - Cash and Securities: $2,636,000
- Charges - Other: $567,000
Elementary and Secondary Education School Lunch: $538,000
Sewerage: $147,000
Solid Waste Management: $147,000
Parks and Recreation: $48,000
Elementary and Secondary Education School Tuition and Transportation: $4,000
- Construction - Police Protection: $1,346,000
Judicial and Legal Services: $1,283,000
Elementary and Secondary Education: $835,000
- Current Operations - Elementary and Secondary Education: $27,402,000
General - Other: $2,314,000
Police Protection: $1,563,000
Central Staff Services: $1,087,000
Public Welfare - Other: $1,049,000
Solid Waste Management: $1,009,000
Financial Administration: $947,000
Housing and Community Development: $938,000
Judicial and Legal Services: $801,000
Public Welfare, Vendor Payments for Other Purposes: $729,000
Local Fire Protection: $653,000
General Public Buildings: $612,000
Regular Highways: $344,000
Water Utilities: $299,000
Libraries: $296,000
Health - Other: $258,000
Protective Inspection and Regulation - Other: $232,000
Parks and Recreation: $223,000
Sewerage: $187,000
Correctional Institutions: $99,000
Natural Resources - Other: $30,000
- Federal Intergovernmental - Other: $1,760,000
Public Welfare: $447,000
Housing and Community Development: $289,000
Education: $114,000
Highways: $55,000
General Local Government Support: $50,000
Natural Resources: $29,000
- General - Interest on Debt: $1,536,000
- Intergovernmental to Local - Other - Correctional Institutions: $574,000
Other - Elementary and Secondary Education: $565,000
- Local Intergovernmental - Education: $923,000
- Long Term Debt - Beginning Outstanding - Unspecified Public Purpose: $33,653,000
Outstanding Unspecified Public Purpose: $22,668,000
Retired Unspecified Public Purpose: $10,985,000
- Miscellaneous - Rents: $838,000
Interest Earnings: $838,000
General Revenue - Other: $722,000
Fines and Forfeits: $251,000
Sale of Property: $2,000
Donations From Private Sources: $1,000
- Other Capital Outlay - Elementary and Secondary Education: $502,000
- Other Funds - Cash and Securities: $17,956,000
- Revenue - Water Utilities: $109,000
- Sinking Funds - Cash and Securities: $191,000
- State Intergovernmental - Education: $11,225,000
General Local Government Support: $2,548,000
Other: $1,988,000
Public Welfare: $335,000
- Tax - Property: $24,289,000
Other Selective Sales: $1,600,000
General Sales and Gross Receipts: $1,203,000
Motor Vehicle License: $803,000
Public Utilities Sales: $544,000
Other License: $206,000
Occupation and Business License - Other: $38,000
- Total Salaries and Wages: $15,296,000
- Water Utilities - Interest on Debt: $50,000
Nelson County government finances - Cash and Securities in 2017:
- Assistance and Subsidies - Public Welfare, Federal Categorical Assistance Programs: $275,000
- Bond Funds - Cash and Securities: $2,636,000
- Charges - Other: $567,000
Elementary and Secondary Education School Lunch: $538,000
Sewerage: $147,000
Solid Waste Management: $147,000
Parks and Recreation: $48,000
Elementary and Secondary Education School Tuition and Transportation: $4,000
- Construction - Police Protection: $1,346,000
Judicial and Legal Services: $1,283,000
Elementary and Secondary Education: $835,000
- Current Operations - Elementary and Secondary Education: $27,402,000
General - Other: $2,314,000
Police Protection: $1,563,000
Central Staff Services: $1,087,000
Public Welfare - Other: $1,049,000
Solid Waste Management: $1,009,000
Financial Administration: $947,000
Housing and Community Development: $938,000
Judicial and Legal Services: $801,000
Public Welfare, Vendor Payments for Other Purposes: $729,000
Local Fire Protection: $653,000
General Public Buildings: $612,000
Regular Highways: $344,000
Water Utilities: $299,000
Libraries: $296,000
Health - Other: $258,000
Protective Inspection and Regulation - Other: $232,000
Parks and Recreation: $223,000
Sewerage: $187,000
Correctional Institutions: $99,000
Natural Resources - Other: $30,000
- Federal Intergovernmental - Other: $1,760,000
Public Welfare: $447,000
Housing and Community Development: $289,000
Education: $114,000
Highways: $55,000
General Local Government Support: $50,000
Natural Resources: $29,000
- General - Interest on Debt: $1,536,000
- Intergovernmental to Local - Other - Correctional Institutions: $574,000
Other - Elementary and Secondary Education: $565,000
- Local Intergovernmental - Education: $923,000
- Long Term Debt - Beginning Outstanding - Unspecified Public Purpose: $33,653,000
Outstanding Unspecified Public Purpose: $22,668,000
Retired Unspecified Public Purpose: $10,985,000
- Miscellaneous - Rents: $838,000
Interest Earnings: $838,000
General Revenue - Other: $722,000
Fines and Forfeits: $251,000
Sale of Property: $2,000
Donations From Private Sources: $1,000
- Other Capital Outlay - Elementary and Secondary Education: $502,000
- Other Funds - Cash and Securities: $17,956,000
- Revenue - Water Utilities: $109,000
- Sinking Funds - Cash and Securities: $191,000
- State Intergovernmental - Education: $11,225,000
General Local Government Support: $2,548,000
Other: $1,988,000
Public Welfare: $335,000
- Tax - Property: $24,289,000
Other Selective Sales: $1,600,000
General Sales and Gross Receipts: $1,203,000
Motor Vehicle License: $803,000
Public Utilities Sales: $544,000
Other License: $206,000
Occupation and Business License - Other: $38,000
- Total Salaries and Wages: $15,296,000
- Water Utilities - Interest on Debt: $50,000
Supplemental Security Income (SSI) in 2006:
- Total number of recipients: 339
- Number of aged recipients: 67
- Number of blind and disabled recipients: 272
- Number of recipients under 18: 18
- Number of recipients between 18 and 64: 183
- Number of recipients older than 64: 138
- Number of recipients also receiving OASDI: 180
- Amount of payments (thousands of dollars): 157
| Businesses in Nelson County, VA | ||||
| Name | Count | Name | Count | |
|---|---|---|---|---|
| FedEx | 2 | Rite Aid | 1 | |
| MasterBrand Cabinets | 1 | Subway | 1 | |
| McDonald's | 1 | True Value | 1 | |
| Nike | 1 | U-Haul | 1 | |