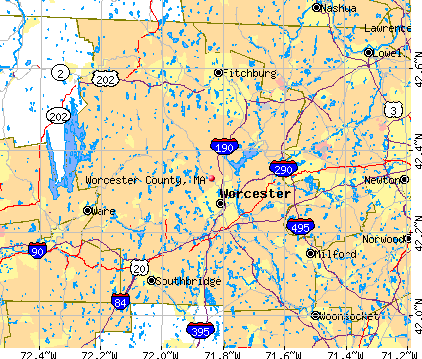
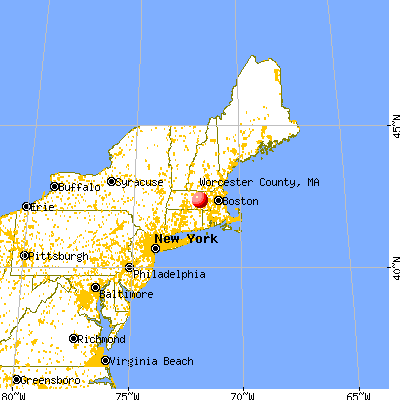
Worcester County, Massachusetts (MA)
County owner-occupied free and clear houses and condos in 2010: 47,218
County owner-occupied houses and condos in 2000: 182,097
Renter-occupied apartments: 102,758 (it was 101,830 in 2000)
| % of renters here: | 36% |
| State: | 38% |
Land area: 1513 sq. mi.
Water area: 66.0 sq. mi.
Population density: 570 people per square mile (high).
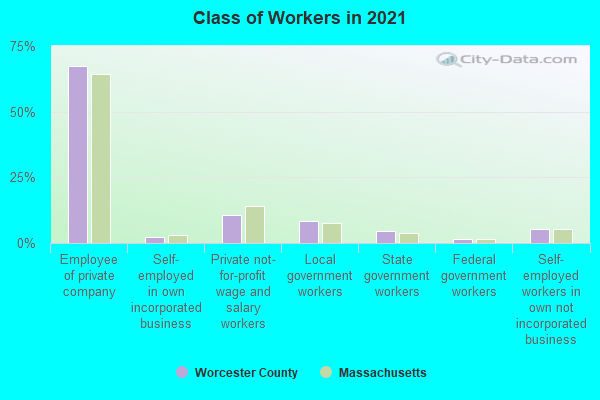
Industries providing employment: Educational, health and social services (27.5%), Professional, scientific, management, administrative, and waste management services (12.7%), Manufacturing (11.7%).
Type of workers:
- Private wage or salary: 82%
- Government: 14%
- Self-employed, not incorporated: 5%
- Unpaid family work: 0%
- OSM Map
- General Map
- Google Map
- MSN Map

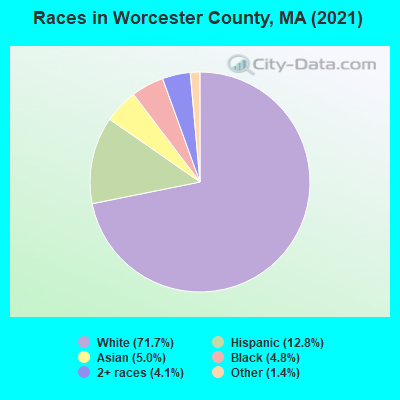
- 615,38371.3%White Non-Hispanic Alone
- 112,85613.1%Hispanic or Latino
- 46,0295.3%Asian alone
- 41,3734.8%Black Non-Hispanic Alone
- 39,1554.5%Two or more races
- 7,3020.8%Some other race alone
- 7430.09%American Indian and Alaska Native alone
- 860.01%Native Hawaiian and Other
Pacific Islander alone
| Median resident age: | 40.6 years |
| Massachusetts median age: | 40.3 years |
| Males: 429,381 | |
| Females: 433,546 |

 | Home Prices By Town for 2022 (190 replies) |
| Is 700k the new 300k? (236 replies) |
| Boston area population lost 2020-2021 (122 replies) |
| Seeking nature-oriented town with urban edge (99 replies) |
| Taxes driving wealth out of Massachusetts and into Florida, New Hampshire (127 replies) |
| How on earth can we get into Boston? (107 replies) |
| Worcester County: | 2.0 people |
| Massachusetts: | 2 people |
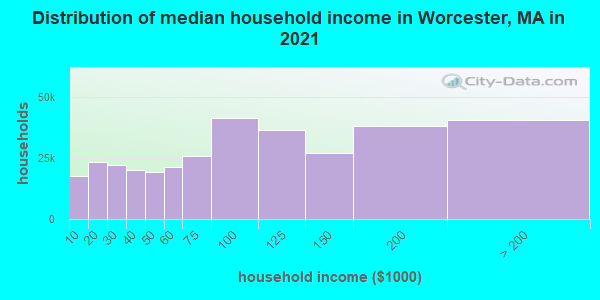
Estimated median household income in 2022: $86,258 ($47,874 in 1999)
| This county: | $86,258 |
| Massachusetts: | $94,488 |
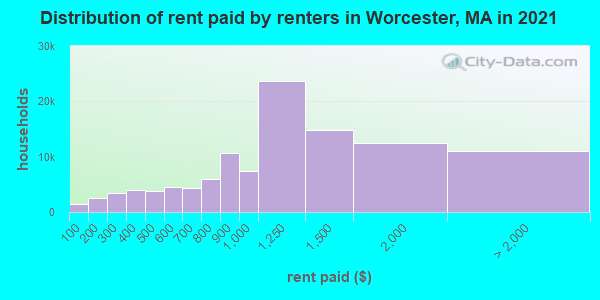
Median contract rent in 2022 for apartments: $1,118 (lower quartile is $825, upper quartile is $1,525)
| This county: | $1118 |
| State: | $1446 |
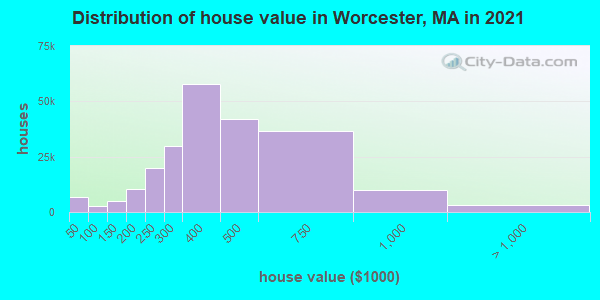
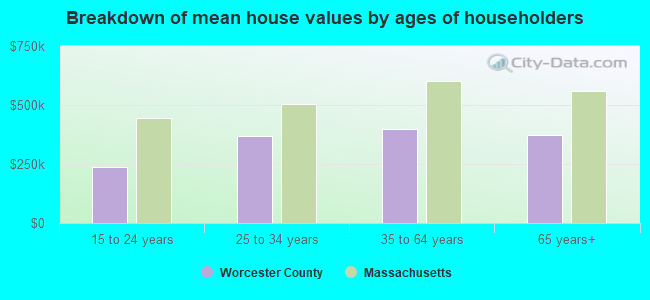
Estimated median house or condo value in 2022: $393,800 (it was $142,600 in 2000)
| Worcester: | $393,800 |
| Massachusetts: | $534,700 |
Mean price in 2022:
Median monthly housing costs for homes and condos with a mortgage: $2,158Detached houses: $447,621
Here: $447,621 State: $651,570 Townhouses or other attached units: $343,592
Here: $343,592 State: $617,749 In 2-unit structures: $323,295
Here: $323,295 State: $594,808 In 3-to-4-unit structures: $332,295
Here: $332,295 State: $601,912 In 5-or-more-unit structures: $232,758
Here: $232,758 State: $555,768 Mobile homes: $113,885
Here: $113,885 State: $170,209
Median monthly housing costs for units without a mortgage: $862
Institutionalized population: 11,315
Health of residents in Worcester County based on CDC Behavioral Risk Factor Surveillance System Survey Questionnaires from 2013 to 2021:
General health status score of residents in this county from 1 (poor) to 5 (excellent) is 3.6. This is about average.72.8% of residents exercised in the past month. This is about average.
45.7% of residents smoked 100+ cigarettes in their lives. This is about average.
59.5% of adult residents drank alcohol in the past 30 days. This is less than average.
74.9% of residents visited a dentist within the past year. This is about average.
Average weight of males is 197 pounds. This is about average.
Average weight of females is 159 pounds. This is about average.
Health of residents in Worcester County based on CDC Behavioral Risk Factor Surveillance System Survey Questionnaires from 2003 to 2012:
General health status score of residents in this county from 1 (poor) to 5 (excellent) is 3.6. This is about average.73.3% of residents exercised in the past month. This is about average.
49.5% of residents smoked 100+ cigarettes in their lives. This is about average.
76.3% of adult residents drank alcohol in the past 30 days. This is about average.
75.0% of residents visited a dentist within the past year. This is about average.
Average weight of males is 194 pounds. This is about average.
Average weight of females is 160 pounds. This is about average.
11.5% of residents keep firearms around their homes. This is less than average.
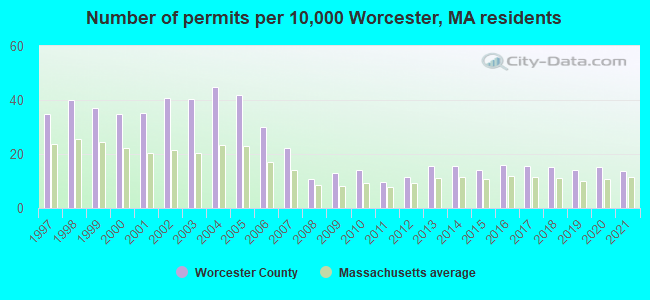
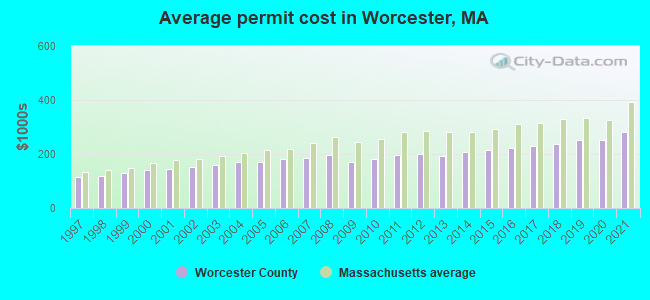
Single-family new house construction building permits:
- 2022: 1046 buildings, average cost: $293,200
- 2021: 1021 buildings, average cost: $283,300
- 2020: 1137 buildings, average cost: $251,400
- 2019: 1047 buildings, average cost: $253,200
- 2018: 1127 buildings, average cost: $236,500
- 2017: 1163 buildings, average cost: $229,700
- 2016: 1194 buildings, average cost: $224,400
- 2015: 1065 buildings, average cost: $214,300
- 2014: 1168 buildings, average cost: $205,600
- 2013: 1164 buildings, average cost: $192,700
- 2012: 867 buildings, average cost: $198,600
- 2011: 726 buildings, average cost: $194,900
- 2010: 1067 buildings, average cost: $182,100
- 2009: 973 buildings, average cost: $170,800
- 2008: 803 buildings, average cost: $197,500
- 2007: 1660 buildings, average cost: $185,000
- 2006: 2265 buildings, average cost: $180,200
- 2005: 3154 buildings, average cost: $172,000
- 2004: 3356 buildings, average cost: $169,300
- 2003: 3023 buildings, average cost: $158,800
- 2002: 3050 buildings, average cost: $153,400
- 2001: 2644 buildings, average cost: $144,200
- 2000: 2624 buildings, average cost: $139,700
- 1999: 2783 buildings, average cost: $128,900
- 1998: 2991 buildings, average cost: $117,100
- 1997: 2610 buildings, average cost: $116,000
Median real estate property taxes paid for housing units with mortgages in 2022: $4,985 (1.3%)
Median real estate property taxes paid for housing units with no mortgage in 2022: $4,730 (1.2%)
| Worcester County: | 10.6% |
| Massachusetts: | 10.4% |
Median age of residents in 2022: 40.6 years old
(Males: 39.5 years old, Females: 41.7 years old)
(Median age for: White residents: 45.7 years old, Black residents: 32.4 years old, American Indian residents: 31.5 years old, Asian residents: 36.8 years old, Hispanic or Latino residents: 28.5 years old, Other race residents: 31.5 years old)
Area name: Fitchburg-Leominster, MA HUD Metro FMR Area
Fair market rent in 2006 for a 1-bedroom apartment in Worcester County is $646 a month.
Fair market rent for a 2-bedroom apartment is $811 a month.
Fair market rent for a 3-bedroom apartment is $993 a month.
Cities in this county include: Worcester, Leominster, Fitchburg, Shrewsbury, Milford, Gardner, Southbridge Town, Auburn, Holden, Grafton.
2023 air pollution in Worcester County:
Carbon Monoxide: 0.277 ppm (standard limit: 9 ppm). Near U.S. average.
Nitrogen Dioxide: 0.01 ppm (standard limit: 0.053 ppm). Above U.S. average.
Ozone (1-hour): 0.032 ppm (standard limit: 0.12 ppm). Near U.S. average.
Particulate Matter (PM10) Annual: 18.3 µg/m3. Near U.S. average.
Particulate Matter (PM2.5) Annual: 7.8 µg/m3(standard limit: 15.0 µg/m3). Near U.S. average.
Sulfur Oxides Annual: 0.000 ppm (standard limit: 0.03 ppm). Near U.S. average.
Neighboring counties: Curry County, Oregon  , Rich County, Utah , Clinton County, Michigan , Green County, Wisconsin , Lincoln County, Idaho , Jackson County, South Dakota , Scotts Bluff County, Nebraska , Stephenson County, Illinois .
| Here: | 3.6% |
| Massachusetts: | 3.5% |
Current college students: 46,184
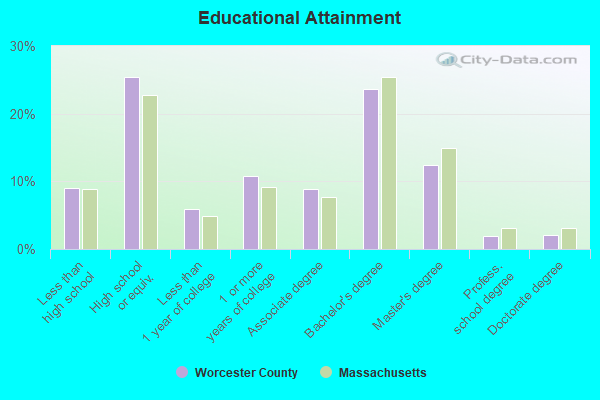
People 25 years of age or older with a high school degree or higher: 91.0%
People 25 years of age or older with a bachelor's degree or higher: 37.7%
Number of foreign born residents: 120,257 (55.2% naturalized citizens)
| Worcester County: | 13.9% |
| Whole state: | 18.0% |
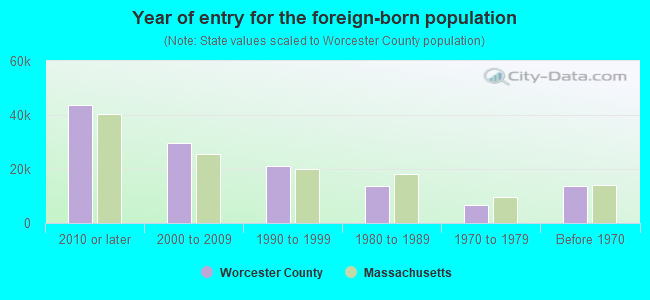
- Year of entry for the foreign-born population
- 48,7372010 or later
- 30,7122000 to 2009
- 17,5461990 to 1999
- 13,6521980 to 1989
- 6,5131970 to 1979
- 13,833Before 1970
Mean travel time to work (commute): minutes
Percentage of county residents living and working in this county: 97.0%
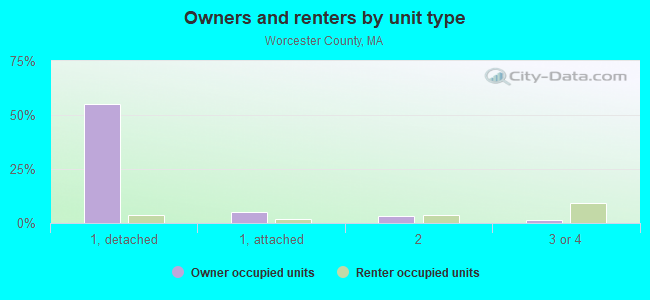
Housing units in structures:
- One, detached: 192,289
- One, attached: 23,417
- Two: 30,202
- 3 or 4: 43,275
- 5 to 9: 20,025
- 10 to 19: 15,986
- 20 to 49: 13,007
- 50 or more: 13,827
- Mobile homes: 3,659
Housing units in Worcester County with a mortgage: 145,188 (21,329 second mortgage, 607 home equity loan, 17,754 both second mortgage and home equity loan)
Houses without a mortgage: 6,283
| Here: | 96.0% with mortgage |
| State: | 96.2% with mortgage |
Religion statistics for Worcester County
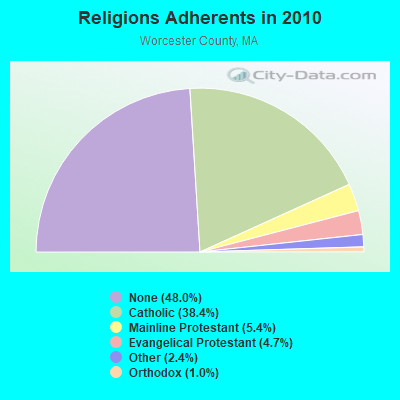
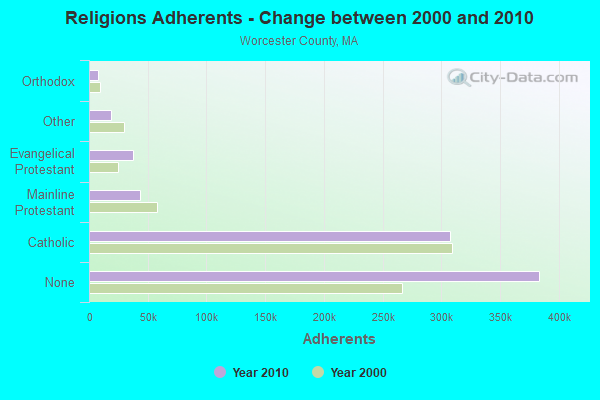
| Religion | Adherents | Congregations |
|---|---|---|
| Catholic | 306,925 | 118 |
| Mainline Protestant | 43,326 | 171 |
| Evangelical Protestant | 37,511 | 203 |
| Other | 18,931 | 69 |
| Orthodox | 7,935 | 15 |
| Black Protestant | 497 | 6 |
| None | 383,427 | - |
Source: Clifford Grammich, Kirk Hadaway, Richard Houseal, Dale E.Jones, Alexei Krindatch, Richie Stanley and Richard H.Taylor. 2012. 2010 U.S.Religion Census: Religious Congregations & Membership Study. Association of Statisticians of American Religious Bodies. Jones, Dale E., et al. 2002. Congregations and Membership in the United States 2000. Nashville, TN: Glenmary Research Center.
Food Environment Statistics:
| Worcester County: | 1.73 / 10,000 pop. |
| State: | 1.98 / 10,000 pop. |
| Here: | 0.05 / 10,000 pop. |
| Massachusetts: | 0.05 / 10,000 pop. |
| This county: | 1.79 / 10,000 pop. |
| Massachusetts: | 2.22 / 10,000 pop. |
| Worcester County: | 2.22 / 10,000 pop. |
| Massachusetts: | 1.77 / 10,000 pop. |
| This county: | 7.27 / 10,000 pop. |
| State: | 8.76 / 10,000 pop. |
| Worcester County: | 8.0% |
| Massachusetts: | 8.1% |
| Worcester County: | 24.0% |
| State: | 22.5% |
| Here: | 16.6% |
| State: | 16.5% |
Agriculture in Worcester County:
Average size of farms: 95 acresAverage value of agricultural products sold per farm: $62,682
Average value of crops sold per acre for harvested cropland: $1023.57
The value of nursery, greenhouse, floriculture, and sod as a percentage of the total market value of agricultural products sold: 30.33%
The value of livestock, poultry, and their products as a percentage of the total market value of agricultural products sold: 49.20%
Average total farm production expenses per farm: $53,600
Harvested cropland as a percentage of land in farms: 32.87%
Irrigated harvested cropland as a percentage of land in farms: 3.12%
Average market value of all machinery and equipment per farm: $46,309
The percentage of farms operated by a family or individual: 89.40%
Average age of principal farm operators: 56 years
Average number of cattle and calves per 100 acres of all land in farms: 10.89
Milk cows as a percentage of all cattle and calves: 39.30%
Vegetables: 1,662 harvested acres
Land in orchards: 2,172 acres
Earthquake activity:
Worcester County-area historical earthquake activity is significantly above Massachusetts state average. It is 71% smaller than the overall U.S. average.On 10/7/1983 at 10:18:46, a magnitude 5.3 (5.1 MB, 5.3 LG, 5.1 ML, Class: Moderate, Intensity: VI - VII) earthquake occurred 169.0 miles away from Worcester County center
On 4/20/2002 at 10:50:47, a magnitude 5.3 (5.3 ML, Depth: 3.0 mi) earthquake occurred 177.5 miles away from the county center
On 4/20/2002 at 10:50:47, a magnitude 5.2 (5.2 MB, 4.2 MS, 5.2 MW, 5.0 MW) earthquake occurred 176.5 miles away from the county center
On 1/19/1982 at 00:14:42, a magnitude 4.7 (4.5 MB, 4.7 MD, 4.5 LG, Class: Light, Intensity: IV - V) earthquake occurred 81.9 miles away from the county center
On 10/16/2012 at 23:12:25, a magnitude 4.7 (4.7 ML, Depth: 10.0 mi) earthquake occurred 106.2 miles away from Worcester County center
On 8/22/1992 at 12:20:32, a magnitude 4.8 (4.8 MB, 3.8 MS, 4.7 LG, Depth: 6.2 mi) earthquake occurred 236.8 miles away from the county center
Magnitude types: regional Lg-wave magnitude (LG), body-wave magnitude (MB), duration magnitude (MD), local magnitude (ML), surface-wave magnitude (MS), moment magnitude (MW)
Most recent natural disasters:
- Massachusetts Severe Winter Storm, Snowstorm, and Flooding, Incident Period: January 26, 2015 to January 29, 2015, Major Disaster (Presidential) Declared DR-4214: April 13, 2015, FEMA Id: 4214, Natural disaster type: Snowstorm, Winter Storm, Flood
- Massachusetts Severe Winter Storm, Snowstorm, and Flooding, Incident Period: February 08, 2013 to February 10, 2013, Major Disaster (Presidential) Declared DR-4110: April 19, 2013, FEMA Id: 4110, Natural disaster type: Snowstorm, Winter Storm, Flood
- Massachusetts Hurricane Sandy, Incident Period: October 27, 2012 to November 08, 2012, Emergency Declared EM-3350: October 28, 2012, FEMA Id: 3350, Natural disaster type: Hurricane
- Massachusetts Severe Storm, Incident Period: October 29, 2011 to October 30, 2011, Emergency Declared EM-3343: November 01, 2011, FEMA Id: 3343, Natural disaster type: Storm
- Massachusetts Severe Storm and Snowstorm, Incident Period: October 29, 2011 to October 30, 2011, Major Disaster (Presidential) Declared DR-4051: January 06, 2012, FEMA Id: 4051, Natural disaster type: Snowstorm, Storm
- Massachusetts Hurricane Irene, Incident Period: August 26, 2011 to September 05, 2011, Emergency Declared EM-3330: August 26, 2011, FEMA Id: 3330, Natural disaster type: Hurricane
- Massachusetts Severe Storms and Tornadoes, Incident Period: June 01, 2011, Major Disaster (Presidential) Declared DR-1994: June 15, 2011, FEMA Id: 1994, Natural disaster type: Storm, Tornado
- Massachusetts Hurricane Earl, Incident Period: September 01, 2010 to September 04, 2010, Emergency Declared EM-3315: September 02, 2010, FEMA Id: 3315, Natural disaster type: Hurricane
- Massachusetts Severe Storm and Flooding, Incident Period: March 12, 2010 to April 26, 2010, Major Disaster (Presidential) Declared DR-1895: March 29, 2010, FEMA Id: 1895, Natural disaster type: Storm, Flood
- Massachusetts Severe Winter Storm and Flooding, Incident Period: December 11, 2008 to December 18, 2008, Major Disaster (Presidential) Declared DR-1813: January 05, 2009, FEMA Id: 1813, Natural disaster type: Winter Storm, Flood
- 17 other natural disasters have been reported since 1953.
The number of natural disasters in Worcester County (27) is a lot greater than the US average (15).
Major Disasters (Presidential) Declared: 15
Emergencies Declared: 12
Causes of natural disasters: Floods: 9, Storms: 8, Hurricanes: 6, Snowstorms: 5, Winter Storms: 4, Blizzards: 2, Snows: 2, Fire: 1, Heavy Rain: 1, Snowfall: 1, Tornado: 1, Wind: 1 (Note: some incidents may be assigned to more than one category).
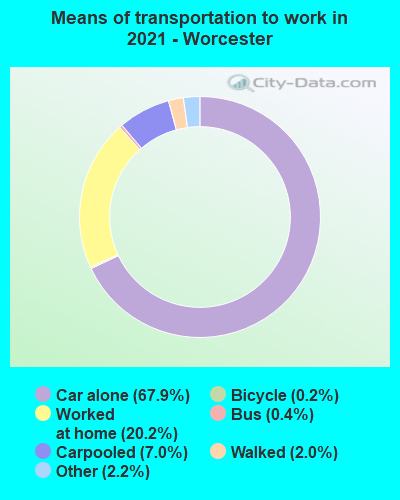
Means of transportation to work:
- Drove a car alone: 273,611 (69.3%)
- Carpooled: 30,185 (7.6%)
- Bus: 2,988 (0.8%)
- Long-distance train or commuter rail: 255 (0.1%)
- Taxicab, motorcycle, or other means: 9,028 (2.3%)
- Bicycle: 506 (0.1%)
- Walked: 8,027 (2.0%)
- Worked at home: 69,994 (17.7%)

- Health care and social assistance (24%)
- Educational services (15%)
- Retail trade (9%)
- Professional, scientific, and technical services (8%)
- Manufacturing (6%)
- Finance and insurance (6%)
- Other services, except public administration (5%)
- Health care and social assistance (26%)
- Educational services (17%)
- Retail trade (9%)
- Professional, scientific, and technical services (9%)
- Manufacturing (7%)
- Finance and insurance (6%)
- Other services, except public administration (5%)
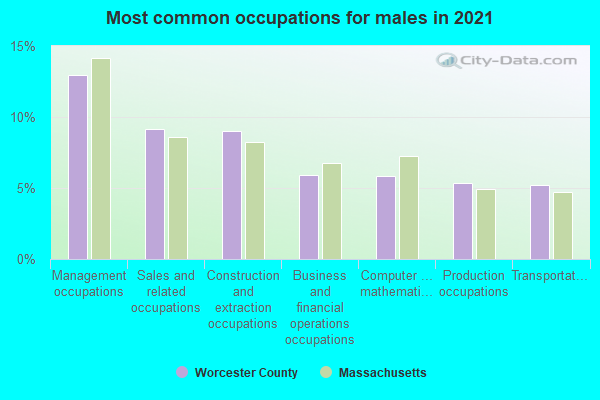
- Management occupations (14%)
- Construction and extraction occupations (10%)
- Sales and related occupations (7%)
- Production occupations (7%)
- Installation, maintenance, and repair occupations (6%)
- Computer and mathematical occupations (6%)
- Transportation occupations (6%)
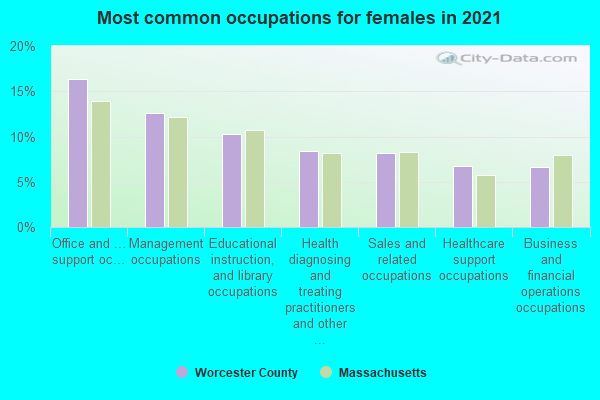
- Office and administrative support occupations (16%)
- Management occupations (12%)
- Educational instruction, and library occupations (11%)
- Health diagnosing and treating practitioners and other technical occupations (8%)
- Sales and related occupations (7%)
- Business and financial operations occupations (6%)
- Healthcare support occupations (6%)
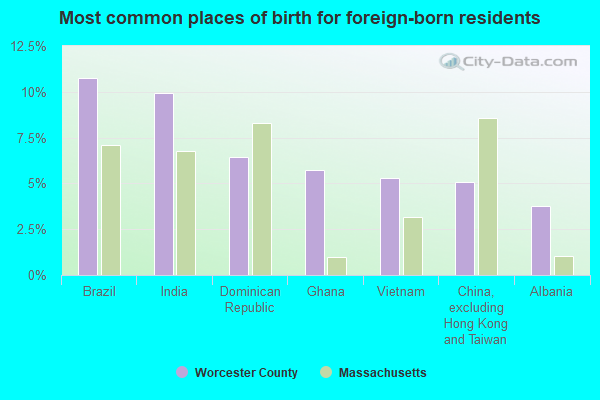
- Brazil (13%)
- India (10%)
- Ghana (7%)
- Dominican Republic (6%)
- Vietnam (5%)
- China, excluding Hong Kong and Taiwan (4%)
- Albania (3%)
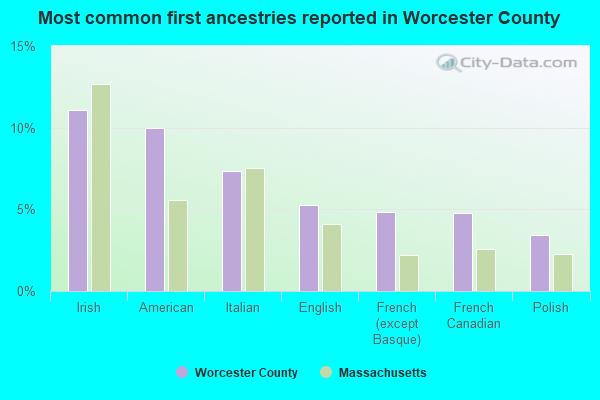
- Irish (11%)
- American (9%)
- Italian (7%)
- English (5%)
- French Canadian (5%)
- French (except Basque) (4%)
- Polish (3%)
People in group quarters in Worcester County, Massachusetts in 2010:
- 12,002 people in college/university student housing
- 5,489 people in nursing facilities/skilled-nursing facilities
- 2,280 people in state prisons
- 1,418 people in local jails and other municipal confinement facilities
- 1,194 people in federal prisons
- 927 people in other noninstitutional facilities
- 820 people in group homes intended for adults
- 775 people in workers' group living quarters and job corps centers
- 736 people in residential treatment centers for adults
- 470 people in emergency and transitional shelters (with sleeping facilities) for people experiencing homelessness
- 411 people in residential treatment centers for juveniles (non-correctional)
- 160 people in residential schools for people with disabilities
- 148 people in group homes for juveniles (non-correctional)
- 92 people in mental (psychiatric) hospitals and psychiatric units in other hospitals
- 66 people in correctional facilities intended for juveniles
- 41 people in hospitals with patients who have no usual home elsewhere
- 13 people in correctional residential facilities
- 3 people in in-patient hospice facilities
People in group quarters in Worcester County, Massachusetts in 2000:
- 9,232 people in college dormitories (includes college quarters off campus)
- 7,407 people in nursing homes
- 2,151 people in state prisons
- 1,220 people in local jails and other confinement facilities (including police lockups)
- 747 people in federal prisons and detention centers
- 573 people in other noninstitutional group quarters
- 516 people in religious group quarters
- 502 people in other nonhousehold living situations
- 478 people in homes or halfway houses for drug/alcohol abuse
- 382 people in mental (psychiatric) hospitals or wards
- 320 people in job corps and vocational training facilities
- 302 people in homes for the mentally ill
- 300 people in homes for the mentally retarded
- 203 people in schools, hospitals, or wards for the intellectually disabled
- 166 people in short-term care, detention or diagnostic centers for delinquent children
- 101 people in residential treatment centers for emotionally disturbed children
- 96 people in homes for abused, dependent, and neglected children
- 95 people in other group homes
- 82 people in unknown juvenile institutions
- 76 people in wards in general hospitals for patients who have no usual home elsewhere
- 63 people in hospitals or wards for drug/alcohol abuse
- 58 people in homes for the physically handicapped
- 28 people in orthopedic wards and institutions for the physically handicapped
- 26 people in other workers' dormitories
- 20 people in training schools for juvenile delinquents
- 18 people in agriculture workers' dormitories on farms
- 10 people in hospitals/wards and hospices for chronically ill
- 10 people in hospices or homes for chronically ill
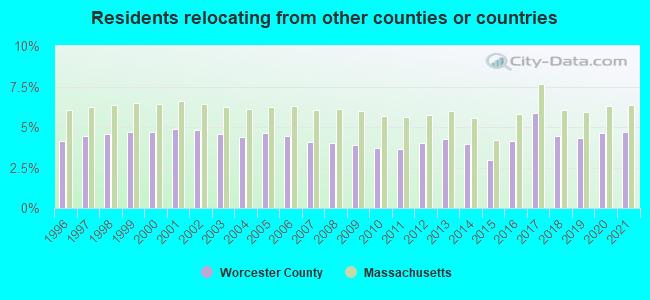
4.71% of this county's 2021 resident taxpayers lived in other counties in 2020 ($76,229 average adjusted gross income)
| Here: | 4.71% |
| Massachusetts average: | 6.35% |
0.02% of residents moved from foreign countries ($100 average AGI)
Worcester County: 0.02% Massachusetts average: 0.01%
2.76% relocated from other counties in Massachusetts ($48,274 average AGI)
1.94% relocated from other states ($27,855 average AGI)
Worcester County: 1.94% Massachusetts average: 2.58%
Top counties from which taxpayers relocated into this county between 2020 and 2021:
| from Middlesex County, MA | |
| from Norfolk County, MA | |
| from Suffolk County, MA | |
| from Essex County, MA | |
| from Providence County, RI | |
| from Hampden County, MA | |
| from Bristol County, MA |
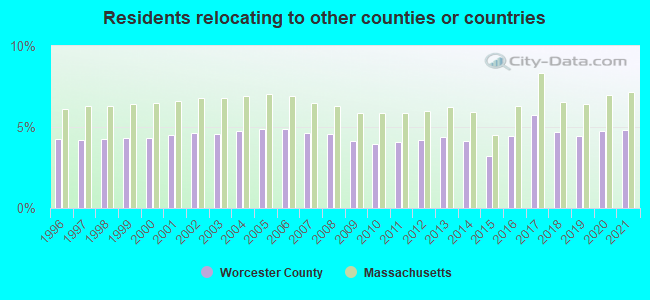
4.84% of this county's 2020 resident taxpayers moved to other counties in 2021 ($87,252 average adjusted gross income)
| Here: | 4.84% |
| Massachusetts average: | 7.18% |
0.03% of residents moved to foreign countries ($199 average AGI)
Worcester County: 0.03% Massachusetts average: 0.02%
2.06% relocated to other counties in Massachusetts ($36,024 average AGI)
2.75% relocated to other states ($51,029 average AGI)
Worcester County: 2.75% Massachusetts average: 3.43%
Top counties to which taxpayers relocated from this county between 2020 and 2021:
| to Middlesex County, MA | |
| to Norfolk County, MA | |
| to Suffolk County, MA | |
| to Hampden County, MA | |
| to Providence County, RI | |
| to Windham County, CT | |
| to Barnstable County, MA |
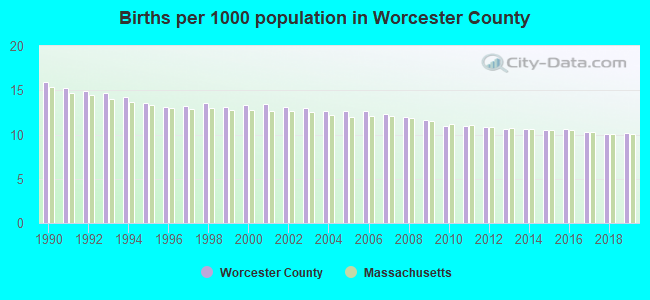
Births per 1000 population from 1990 to 1999: 14.2
Births per 1000 population from 2000 to 2009: 12.7
Births per 1000 population from 2010 to 2022: 8.9
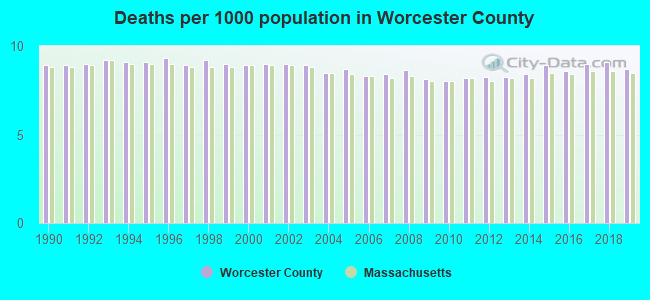
Deaths per 1000 population from 1990 to 1999: 9.1
Deaths per 1000 population from 2000 to 2009: 8.7
Deaths per 1000 population from 2010 to 2020: 8.7
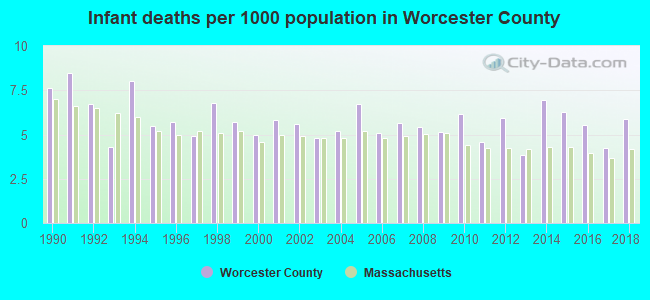
Infant deaths per 1000 live births from 1990 to 1999: 6.4
Infant deaths per 1000 live births from 2000 to 2009: 5.4
Infant deaths per 1000 live births from 2010 to 2021: 5.0
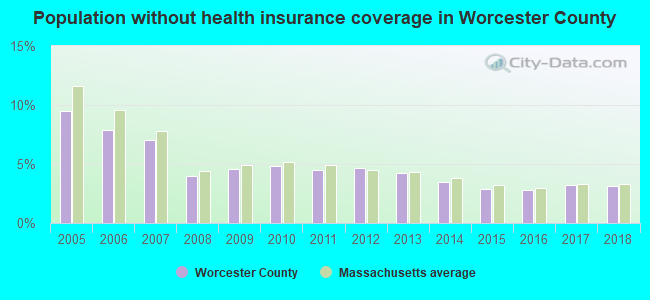
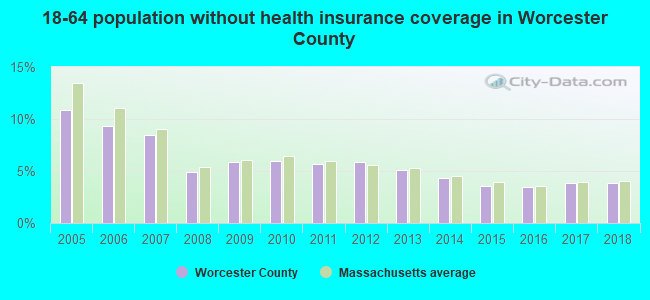
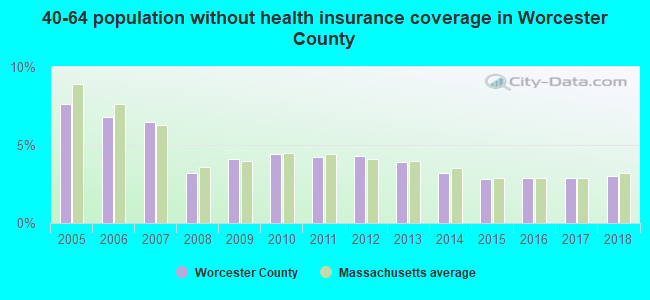
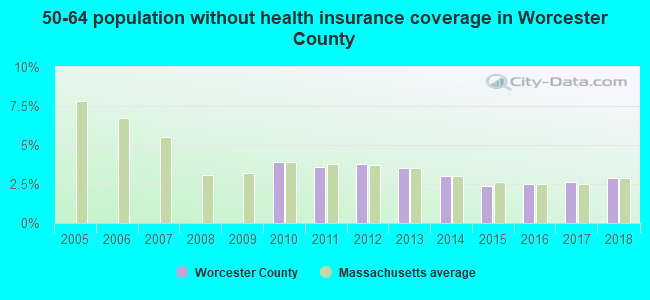
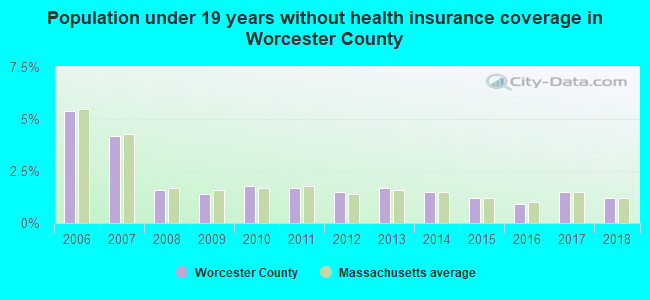
Persons under 19 years old without health insurance coverage in 2018: 1.2%
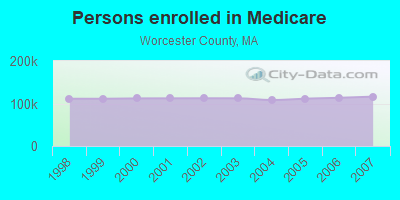
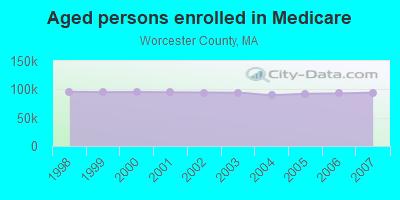
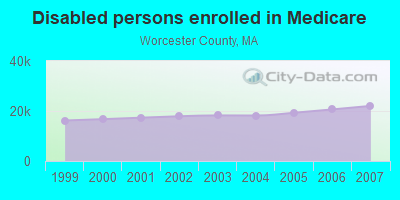
Persons enrolled in hospital insurance and/or supplemental medical insurance (Medicare) in July 1, 2007: 116,170 (94,130 aged, 22,040 disabled)
Children under 18 without health insurance coverage in 2007: 5,630 (3%)
Most common underlying causes of death in Worcester County, Massachusetts in 1999 - 2019:
- Atherosclerotic heart disease (9,551)
- Bronchus or lung, unspecified - Malignant neoplasms (8,864)
- Unspecified dementia (8,179)
- Acute myocardial infarction, unspecified (7,161)
- Chronic obstructive pulmonary disease, unspecified (5,592)
- Alzheimer disease, unspecified (4,503)
- Congestive heart failure (4,166)
- Pneumonia, unspecified (3,873)
- Stroke, not specified as haemorrhage or infarction (3,722)
- Atherosclerotic cardiovascular disease, so described (2,259)
Population without health insurance coverage in 2000: 10%
Children under 18 without health insurance coverage in 2000: 6%
Short term general hospital admissions per 100,000 population in 2004: 11,313
Short term general hospital beds per 100,000 population in 2004: 212
Emergency room visits per 100,000 population in 2004: 45,141
General practice office based MDs per 100,000 population in 2005: 1,239
Medical specialist MDs per 100,000 population in 2005: 889
Dentists per 100,000 population in 1998: 20
Total births per 100,000 population, July 2005 - July 2006 : 47
Total deaths per 100,000 population, July 2005 - July 2006: 91
Limited-service eating places per 100,000 population in 2005 : 15
Beer, wine & liquor stores per 100,000 population in 2005: 1
Fitness & recreation sports centers per 100,000 population in 2005: 3,356
Homicides per 1,000,000 population from 2000 to 2006: 17.7. This is less than state average.
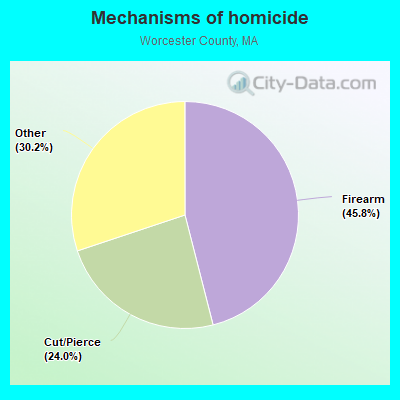
- Firearm - 8.1
- Cut/Pierce - 4.2
- Other - 5.3
Suicides per 1,000,000 population from 2000 to 2006: 71.5. This is more than state average.
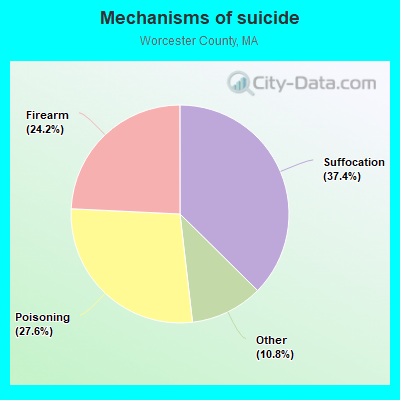
- Suffocation - 26.7
- Poisoning - 19.7
- Firearm - 17.3
- Other - 7.7
Household type by relationship:
Households: 862,927- Male householders: 163,831 (43,574 living alone), Female householders: 174,256 (49,126 living alone)
156,710 spouses (153,868 opposite-sex spouses), 28,470 unmarried partners, (27,146 opposite-sex unmarried partners), 232,484 children (219,651 natural, 5,667 adopted, 7,166 stepchildren), 11,946 grandchildren, 10,484 brothers or sisters, 14,832 parents, 529 foster children, 13,510 other relatives, 28,655 non-relatives
- In group quarters: 27,220
Size of family households: 93,366 2-persons, 53,687 3-persons, 46,380 4-persons, 14,998 5-persons, 5,588 6-persons, 3,069 7-or-more-persons.
Size of nonfamily households: 92,700 1-person, 22,415 2-persons, 3,819 3-persons, 1,640 4-persons, 172 6-persons, 253 7-or-more-persons.
108,573 married couples with children.
49,551 single-parent households (15,652 men, 33,899 women).
78.1% of residents of Worcester speak English at home.
9.4% of residents speak Spanish at home (55% speak English very well, 18% speak English well, 18% speak English not well, 9% don't speak English at all).
7.0% of residents speak other Indo-European language at home (61% speak English very well, 20% speak English well, 10% speak English not well, 9% don't speak English at all).
3.1% of residents speak Asian or Pacific Island language at home (60% speak English very well, 22% speak English well, 15% speak English not well, 3% don't speak English at all).
2.4% of residents speak other language at home (74% speak English very well, 20% speak English well, 6% speak English not well, 1% don't speak English at all).
In fiscal year 2004:
Federal Government expenditure: $4,251,858,000 ($5,455 per capita)
Department of Defense expenditure: $219,003,000
Federal direct payments to individuals for retirement and disability: $1,608,532,000
Federal other direct payments to individuals: $1,092,100,000
Federal direct payments not to individuals: $9,660,000
Federal grants: $1,078,794,000
Federal procurement contracts: $225,628,000 ($132,534,000 Department of Defense)
Federal salaries and wages: $237,144,000 ($31,498,000 Department of Defense)
Federal Government direct loans: $18,089,000
Federal guaranteed/insured loans: $351,932,000
Federal Government insurance: $213,109,000
Population change from April 1, 2000 to July 1, 2005:
Births: 52,874| Here: | 68 per 1000 residents |
| State: | 67 per 1000 residents |
Deaths: 35,694
| Here: | 46 per 1000 residents |
| State: | 46 per 1000 residents |
Net international migration: +14,029
| Here: | +18 per 1000 residents |
| State: | +25 per 1000 residents |
Net internal migration: +2,850
| Here: | |
| State: |
Total withdrawal of fresh water for public supply: 336.69 millions of gallons per day (8% from ground, 92% from surface)
| Here: | 6.4 |
| State: | 6.5 |
| Here: | 4.3 |
| State: | 4.0 |
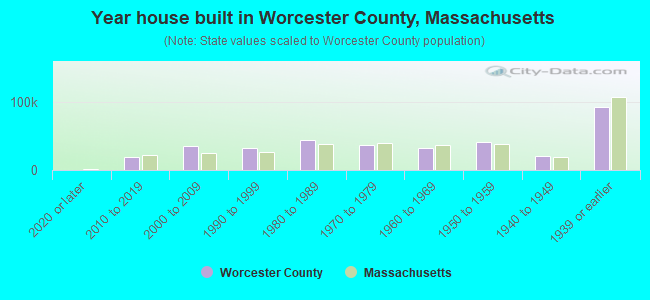
- Year house built in Worcester County, Massachusetts
- 2,8082020 or later
- 18,5072010 to 2019
- 30,6222000 to 2009
- 29,8421990 to 1999
- 43,7081980 to 1989
- 41,0021970 to 1979
- 33,3031960 to 1969
- 36,5001950 to 1959
- 19,5161940 to 1949
- 99,8791939 or earlier
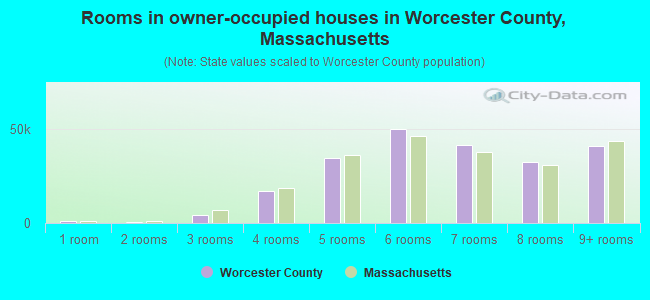
- Rooms in owner-occupied houses in Worcester County, Massachusetts
- 8191 room
- 1,2452 rooms
- 5,0113 rooms
- 18,9504 rooms
- 36,6465 rooms
- 47,6306 rooms
- 36,8107 rooms
- 28,5668 rooms
- 39,3469+ rooms
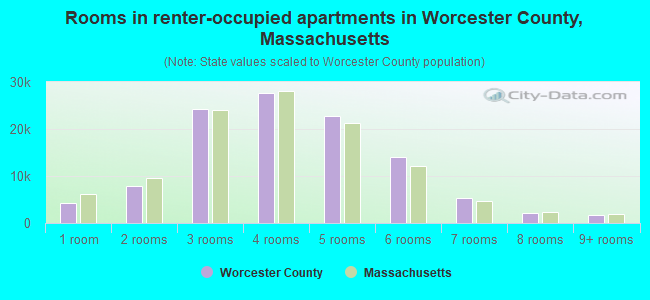
- Rooms in renter-occupied apartments in Worcester County, Massachusetts
- 4,4591 room
- 10,4862 rooms
- 24,8133 rooms
- 28,9124 rooms
- 25,7525 rooms
- 14,7926 rooms
- 7,6897 rooms
- 3,1808 rooms
- 2,9819+ rooms
- Bedrooms in owner-occupied houses in Worcester County, Massachusetts
- 1,078no bedroom
- 6,6381 bedroom
- 46,8282 bedrooms
- 97,9873 bedrooms
- 50,1634 bedrooms
- 12,3295+ bedrooms
- Bedrooms in renter-occupied apartments in Worcester County, Massachusetts
- 4,951no bedroom
- 35,7071 bedroom
- 45,1282 bedrooms
- 29,8953 bedrooms
- 5,9374 bedrooms
- 1,4465+ bedrooms
- Cars and other vehicles available in Worcester County in owner-occupied houses/condos
- 5,749no vehicle
- 54,1051 vehicle
- 95,3462 vehicles
- 39,0413 vehicles
- 16,0174 vehicles
- 4,7655+ vehicles
- Cars and other vehicles available in Worcester County in renter-occupied apartments
- 23,147no vehicle
- 64,0341 vehicle
- 28,3482 vehicles
- 5,4633 vehicles
- 1,4424 vehicles
- 6305+ vehicles
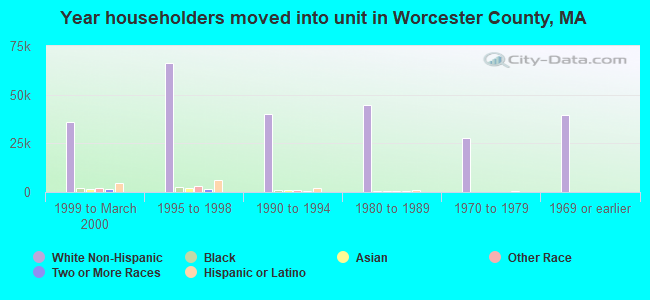
89.0% of Worcester County residents lived in the same house 1 years ago.
Out of people who lived in different houses, 36% lived in this county.
Out of people who lived in different counties, 57% lived in Massachusetts.
| Worcester County: | 89.0% |
| State average: | 87.7% |
Place of birth for U.S.-born residents:
- This state: 559,447
- Other state: 151,390
- Northeast: 89,004
- Midwest: 18,610
- South: 28,389
- West: 15,387
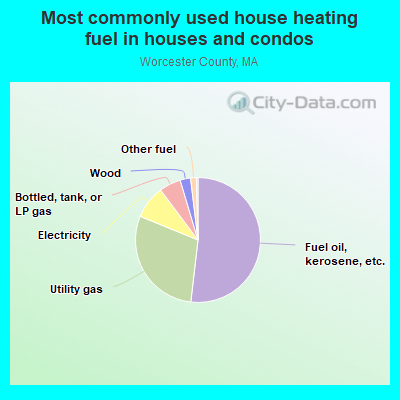
- 48.3%Fuel oil, kerosene, etc.
- 27.9%Utility gas
- 10.7%Electricity
- 6.6%Bottled, tank, or LP gas
- 3.9%Wood
- 1.9%Other fuel
- 0.5%No fuel used
- 0.3%Solar energy
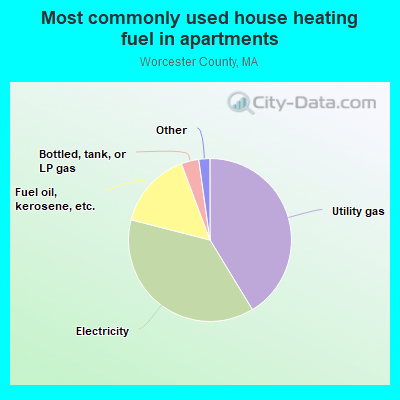
- 42.7%Utility gas
- 34.7%Electricity
- 15.7%Fuel oil, kerosene, etc.
- 4.8%Bottled, tank, or LP gas
- 0.8%Other fuel
- 0.8%No fuel used
- 0.2%Wood
- 0.2%Coal or coke
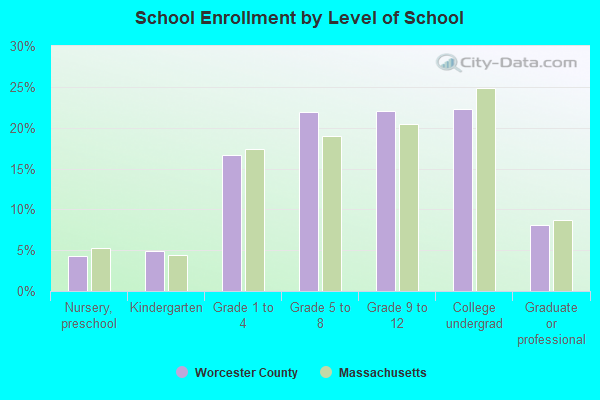
Private vs. public school enrollment:
| Here: | 11.2% |
| Massachusetts: | 10.3% |
| Here: | 8.6% |
| Massachusetts: | 12.3% |
| Here: | 46.4% |
| Massachusetts: | 51.2% |
Supplemental Security Income (SSI) in 2006:
- Total number of recipients: 19,646
- Number of aged recipients: 3,867
- Number of blind and disabled recipients: 15,779
- Number of recipients under 18: 2,469
- Number of recipients between 18 and 64: 13,006
- Number of recipients older than 64: 4,171
- Number of recipients also receiving OASDI: 7,391
- Amount of payments (thousands of dollars): 9,783
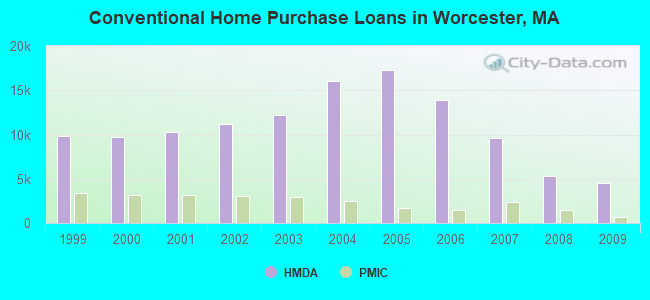
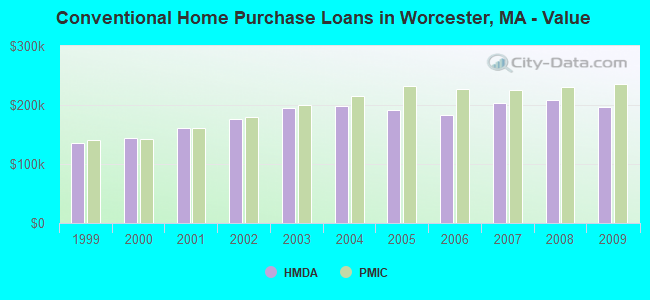
| Home Mortgage Disclosure Act Aggregated Statistics For Year 2009 (Based on 162 full tracts) | ||||||||||||||
| A) FHA, FSA/RHS & VA Home Purchase Loans | B) Conventional Home Purchase Loans | C) Refinancings | D) Home Improvement Loans | E) Loans on Dwellings For 5+ Families | F) Non-occupant Loans on < 5 Family Dwellings (A B C & D) | G) Loans On Manufactured Home Dwelling (A B C & D) | ||||||||
|---|---|---|---|---|---|---|---|---|---|---|---|---|---|---|
| Number | Average Value | Number | Average Value | Number | Average Value | Number | Average Value | Number | Average Value | Number | Average Value | Number | Average Value | |
| LOANS ORIGINATED | 2,578 | $201,678 | 4,526 | $196,065 | 19,502 | $218,518 | 1,580 | $92,199 | 82 | $1,354,732 | 943 | $155,277 | 54 | $73,407 |
| APPLICATIONS APPROVED, NOT ACCEPTED | 164 | $190,982 | 304 | $202,707 | 1,260 | $227,276 | 131 | $52,206 | 3 | $7,601,667 | 72 | $154,806 | 13 | $53,923 |
| APPLICATIONS DENIED | 461 | $180,751 | 897 | $167,993 | 5,213 | $225,288 | 533 | $81,514 | 25 | $1,108,600 | 358 | $146,385 | 22 | $55,727 |
| APPLICATIONS WITHDRAWN | 351 | $190,350 | 613 | $189,005 | 3,643 | $228,290 | 174 | $134,236 | 9 | $965,444 | 141 | $156,270 | 5 | $112,000 |
| FILES CLOSED FOR INCOMPLETENESS | 80 | $183,075 | 189 | $199,820 | 1,312 | $224,887 | 81 | $120,074 | 0 | $0 | 55 | $133,800 | 2 | $79,000 |
| Private Mortgage Insurance Companies Aggregated Statistics For Year 2009 (Based on 154 full tracts) | ||||||
| A) Conventional Home Purchase Loans | B) Refinancings | C) Non-occupant Loans on < 5 Family Dwellings (A & B) | ||||
|---|---|---|---|---|---|---|
| Number | Average Value | Number | Average Value | Number | Average Value | |
| LOANS ORIGINATED | 625 | $235,195 | 459 | $261,606 | 3 | $176,000 |
| APPLICATIONS APPROVED, NOT ACCEPTED | 202 | $220,525 | 208 | $265,615 | 9 | $146,111 |
| APPLICATIONS DENIED | 142 | $216,493 | 167 | $260,503 | 0 | $0 |
| APPLICATIONS WITHDRAWN | 56 | $220,089 | 59 | $258,441 | 1 | $154,000 |
| FILES CLOSED FOR INCOMPLETENESS | 13 | $231,538 | 11 | $268,273 | 1 | $252,000 |
| Most common first names in Worcester County, MA among deceased individuals | ||
| Name | Count | Lived (average) |
|---|---|---|
| Mary | 7,193 | 81.7 years |
| John | 6,320 | 74.7 years |
| Joseph | 4,699 | 76.0 years |
| William | 4,228 | 75.0 years |
| George | 3,304 | 76.2 years |
| Robert | 3,225 | 69.6 years |
| Helen | 3,084 | 81.1 years |
| James | 2,752 | 73.0 years |
| Edward | 2,472 | 74.4 years |
| Charles | 2,458 | 76.3 years |
| Most common last names in Worcester County, MA among deceased individuals | ||
| Last name | Count | Lived (average) |
|---|---|---|
| Johnson | 1,523 | 77.9 years |
| Smith | 1,279 | 77.9 years |
| Anderson | 913 | 79.1 years |
| Leblanc | 722 | 76.3 years |
| Brown | 711 | 77.3 years |
| Sullivan | 632 | 78.2 years |
| Murphy | 617 | 77.9 years |
| White | 555 | 78.0 years |
| Carlson | 520 | 78.6 years |
| Cormier | 472 | 76.2 years |
| Businesses in Worcester County, MA | ||||
| Name | Count | Name | Count | |
|---|---|---|---|---|
| 7-Eleven | 10 | Kmart | 3 | |
| ALDI | 1 | Kohl's | 3 | |
| ALDO | 1 | La Quinta | 2 | |
| AMF Bowling | 2 | La-Z-Boy | 6 | |
| AT&T | 14 | Lane Bryant | 2 | |
| Ace Hardware | 7 | Lane Furniture | 7 | |
| Advance Auto Parts | 13 | LensCrafters | 3 | |
| Aeropostale | 3 | Little Caesars Pizza | 3 | |
| American Eagle Outfitters | 4 | Lowe's | 4 | |
| Ann Taylor | 1 | Macy's | 2 | |
| Applebee's | 6 | Marriott | 7 | |
| Arby's | 2 | Marshalls | 4 | |
| Ashley Furniture | 2 | MasterBrand Cabinets | 70 | |
| Audi | 1 | Maurices | 1 | |
| AutoZone | 9 | Mazda | 3 | |
| Avenue | 1 | McDonald's | 32 | |
| BMW | 1 | Men's Wearhouse | 3 | |
| Barnes & Noble | 3 | Motel 6 | 3 | |
| Baskin-Robbins | 1 | Motherhood Maternity | 4 | |
| Bath & Body Works | 3 | New Balance | 11 | |
| Bed Bath & Beyond | 4 | New York & Co | 1 | |
| Ben & Jerry's | 1 | Nike | 1 | |
| Blockbuster | 7 | Nissan | 4 | |
| Budget Car Rental | 1 | OfficeMax | 1 | |
| Buffalo Wild Wings | 1 | Old Navy | 4 | |
| Burger King | 16 | Olive Garden | 2 | |
| CVS | 36 | Outback | 3 | |
| Casual Male XL | 1 | Outback Steakhouse | 3 | |
| Charlotte Russe | 1 | Pac Sun | 2 | |
| Chevrolet | 4 | Panera Bread | 5 | |
| Chico's | 1 | Papa John's Pizza | 4 | |
| Chipotle | 2 | Payless | 12 | |
| Circle K | 3 | Penske | 10 | |
| Cold Stone Creamery | 3 | PetSmart | 2 | |
| Coldwater Creek | 1 | Pier 1 Imports | 4 | |
| Comfort Inn | 3 | Pizza Hut | 3 | |
| Cracker Barrel | 1 | Qdoba Mexican Grill | 1 | |
| Curves | 13 | Quality | 2 | |
| DHL | 4 | Quiznos | 6 | |
| Dairy Queen | 8 | RadioShack | 15 | |
| Days Inn | 1 | Red Robin | 1 | |
| Deb | 1 | Red Roof Inn | 1 | |
| Decora Cabinetry | 10 | Rite Aid | 18 | |
| Dennys | 2 | Rodeway Inn | 1 | |
| Domino's Pizza | 5 | Ruby Tuesday | 2 | |
| DressBarn | 4 | Rue21 | 1 | |
| Dressbarn | 4 | Ryder Rental & Truck Leasing | 2 | |
| Dunkin Donuts | 113 | Sam's Club | 1 | |
| Econo Lodge | 2 | Sears | 7 | |
| Express | 1 | Shaw's | 10 | |
| Extended Stay America | 1 | Spencer Gifts | 2 | |
| Extended Stay Deluxe | 2 | Sprint Nextel | 7 | |
| Famous Footwear | 5 | Staples | 9 | |
| Fashion Bug | 4 | Starbucks | 8 | |
| FedEx | 105 | Stop & Shop | 8 | |
| Finish Line | 2 | Subaru | 3 | |
| Firestone Complete Auto Care | 3 | Subway | 56 | |
| Foot Locker | 3 | Super 8 | 3 | |
| Ford | 7 | T-Mobile | 25 | |
| Forever 21 | 1 | T.G.I. Driday's | 3 | |
| Fredericks Of Hollywood | 1 | T.J.Maxx | 5 | |
| GNC | 13 | Taco Bell | 9 | |
| GameStop | 11 | Talbots | 1 | |
| Gap | 2 | Target | 5 | |
| Goodwill | 4 | The Room Place | 2 | |
| Gymboree | 1 | Toyota | 6 | |
| H&R Block | 18 | Toys"R"Us | 4 | |
| Hilton | 6 | Trader Joe's | 1 | |
| Holiday Inn | 2 | Travelodge | 1 | |
| Hollister Co. | 1 | True Value | 12 | |
| Home Depot | 5 | U-Haul | 36 | |
| Honda | 2 | UPS | 127 | |
| Hot Topic | 3 | Verizon Wireless | 9 | |
| Hyundai | 3 | Victoria's Secret | 2 | |
| IHOP | 1 | Volkswagen | 2 | |
| JCPenney | 2 | Walgreens | 14 | |
| JoS. A. Bank | 2 | Walmart | 9 | |
| Jones New York | 18 | Wendy's | 13 | |
| Journeys | 2 | Wet Seal | 1 | |
| Justice | 2 | World Gym | 3 | |
| KFC | 9 | YMCA | 10 | |
| Kincaid | 2 | |||
Worcester County on our top lists:
- #4 on the list of "Top 101 counties with the highest carbon monoxide air pollution readings in 2012 (ppm)"
- #5 on the list of "Top 101 counties with the most Catholic congregations"
- #5 on the list of "Top 101 counties with the most Catholic congregations (pop. 50,000+)"
- #11 on the list of "Top 101 counties with the highest surface withdrawal of fresh water for public supply (pop. 50,000+)"
- #12 on the list of "Top 101 counties with the highest surface withdrawal of fresh water for public supply"
- #15 on the list of "Top 101 counties with the highest total withdrawal of fresh water for public supply (pop. 50,000+)"
- #16 on the list of "Top 101 counties with the highest total withdrawal of fresh water for public supply"
- #23 on the list of "Top 101 counties with the highest Sulfur Oxides Annual air pollution readings in 2012 (µg/m3)"
- #26 on the list of "Top 101 counties with the lowest percentage of residents that keep firearms around their homes"
- #28 on the list of "Top 101 counties with the most Orthodox congregations (pop. 50,000+)"
- #30 on the list of "Top 101 counties with the most Orthodox congregations"
- #33 on the list of "Top 101 counties with the most Orthodox adherents"
- #33 on the list of "Top 101 counties with the most Orthodox adherents (pop. 50,000+)"
- #35 on the list of "Top 101 counties with the most Catholic adherents"
- #35 on the list of "Top 101 counties with the most Catholic adherents (pop. 50,000+)"
- #38 on the list of "Top 101 counties with the most Mainline Protestant congregations (pop. 50,000+)"
- #39 on the list of "Top 101 counties with the most Mainline Protestant congregations"
- #45 on the list of "Top 101 counties with the largest increase in the number of infant deaths per 1000 residents 2000-2006 to 2007-2013 (pop. 50,000+)"
- #51 on the list of "Top 101 counties with the lowest percentage of residents relocating from other counties between 2010 and 2011 (pop. 50,000+)"
- #56 on the list of "Top 101 counties with the lowest percentage of residents relocating to other counties in 2011 (pop. 50,000+)"