Crime rate in Oakwood Hills, Illinois (IL): murders, rapes, robberies, assaults, burglaries, thefts, auto thefts, arson, law enforcement employees, police officers, crime map
Crime rate in Oakwood Hills, IL
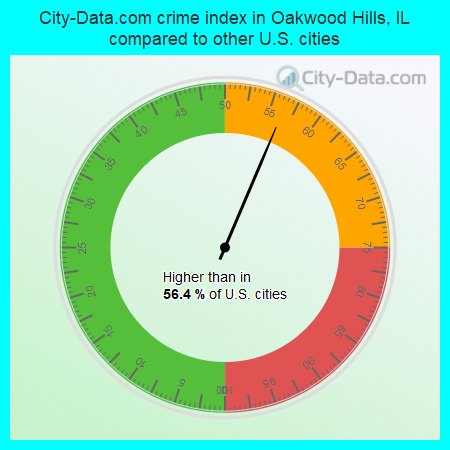
The 2016 crime rate in Oakwood Hills, IL is 119 (City-Data.com crime index), which is 2.1 times lower than the U.S. average. It was higher than in 56.4% U.S. cities. The 2016 Oakwood Hills crime rate rose by 339% compared to 2015. In the last 5 years Oakwood Hills has seen decline of violent crime and rise of property crime.See how dangerous Oakwood Hills, IL is compared to the nearest cities:
(Note: Higher means more crime)
(Note: Higher means more crime)
| Oakwood Hills: | 119.0 |
| Prairie Grove: | 7.6 |
| Cary: | 38.0 |
| Island Lake: | 47.0 |
| Holiday Hills: | 27.8 |
| Fox River Grove: | 26.3 |
| Crystal Lake: | 61.9 |
| Tower Lakes: | 18.9 |
| Wauconda: | 29.4 |
Type |
2010 |
2011 |
2012 |
2013 |
2014 |
2015 |
2016 |
|---|---|---|---|---|---|---|---|
| Murders (per 100,000) | 0 (0.0) | 0 (0.0) | 0 (0.0) | 0 (0.0) | 0 (0.0) | 0 (0.0) | 0 (0.0) |
| Rapes (per 100,000) | 0 (0.0) | 0 (0.0) | 1 (48.0) | 0 (0.0) | 0 (0.0) | 0 (0.0) | 2 (97.1) |
| Robberies (per 100,000) | 0 (0.0) | 0 (0.0) | 0 (0.0) | 0 (0.0) | 0 (0.0) | 0 (0.0) | 0 (0.0) |
| Assaults (per 100,000) | 1 (48.0) | 3 (143.6) | 6 (287.8) | 3 (144.0) | 0 (0.0) | 0 (0.0) | 0 (0.0) |
| Burglaries (per 100,000) | 8 (384.1) | 3 (143.6) | 1 (48.0) | 2 (96.0) | 0 (0.0) | 0 (0.0) | 3 (145.7) |
| Thefts (per 100,000) | 11 (528.1) | 15 (718.0) | 13 (623.5) | 15 (719.8) | 7 (336.7) | 12 (580.6) | 16 (777.1) |
| Auto thefts (per 100,000) | 0 (0.0) | 0 (0.0) | 0 (0.0) | 0 (0.0) | 0 (0.0) | 1 (48.4) | 0 (0.0) |
| Arson (per 100,000) | 0 (0.0) | 0 (0.0) | 0 (0.0) | 0 (0.0) | 0 (0.0) | 0 (0.0) | 0 (0.0) |
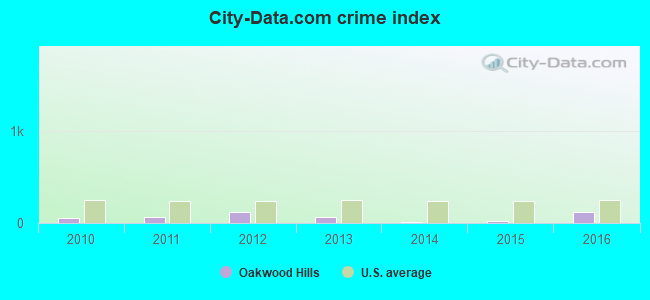
| City-Data.com crime index | 57.6 | 67.5 | 124.2 | 64.3 | 13.5 | 27.1 | 119.0 |
The City-Data.com crime index weighs serious crimes and violent crimes more heavily. Higher means more crime, U.S. average is 246.1. It adjusts for the number of visitors and daily workers commuting into cities.
Violent crime rate in 2016
| Oakwood Hills: | 97.1 |
| U.S. Average: | 227.3 |
Violent crime rate in 2015
| Oakwood Hills: | 0.0 |
| U.S. Average: | 219.3 |
Violent crime rate in 2014
| Oakwood Hills: | 0.0 |
| U.S. Average: | 211.1 |
Violent crime rate in 2013
| Oakwood Hills: | 72.0 |
| U.S. Average: | 214.2 |
Violent crime rate in 2012
| Oakwood Hills: | 191.8 |
| U.S. Average: | 187.4 |
Violent crime rate in 2011
| Oakwood Hills: | 71.8 |
| U.S. Average: | 187.1 |
Violent crime rate in 2010
| Oakwood Hills: | 24.0 |
| U.S. Average: | 195.7 |
Property crime rate in 2016
| Oakwood Hills: | 68.0 |
| U.S. Average: | 216.6 |
Property crime rate in 2015
| Oakwood Hills: | 36.3 |
| U.S. Average: | 221.5 |
Property crime rate in 2014
| Oakwood Hills: | 16.8 |
| U.S. Average: | 230.8 |
Property crime rate in 2013
| Oakwood Hills: | 55.2 |
| U.S. Average: | 250.4 |
Property crime rate in 2012
| Oakwood Hills: | 40.8 |
| U.S. Average: | 267.3 |
Property crime rate in 2011
| Oakwood Hills: | 64.6 |
| U.S. Average: | 273.5 |
Property crime rate in 2010
| Oakwood Hills: | 103.2 |
| U.S. Average: | 276.4 |


Full-time law enforcement employees in 2020, including police officers: 4 (3 officers - 3 male; 0 female).
| Officers per 1,000 residents here: | 1.48 |
| Illinois average: | 3.04 |


Zip codes: 60013.