Addison: Fire Incidents, Illinois (IL)
Where are fire incidents reported in Addison, IL
Something went wrong! Please refresh the page.
| Fire incidents reported | |
|---|---|
| Sreet name | Count |
| LAKE ST | 342 |
| FULLERTON AVE | 138 |
| ADDISON RD | 120 |
| ROHLWING RD | 108 |
| SWIFT RD | 108 |
| LINCOLN AVE | 102 |
| LOMBARD RD | 96 |
| COLLEGE BLVD | 80 |
| LAKE | 64 |
| ARMY TRAIL RD | 62 |
| WISCONSIN AVE | 62 |
| ROUTE 53 | 60 |
| STEVENS DR | 52 |
| CHURCH ST | 46 |
| FACTORY RD | 42 |
| FULLERTON | 40 |
| WESTGATE ST | 38 |
| MEADOWS BLVD | 36 |
| MILL RD | 36 |
| VILLA AVE | 36 |
| WESTGATE DR | 36 |
| GREEN OAKS CT | 34 |
| IOWA | 34 |
| MAY ST | 34 |
| NORTH AVE | 34 |
| OAK ST | 34 |
| BYRON AVE | 32 |
| GRACE ST | 32 |
| FAIRBANKS ST | 30 |
| FAY AVE | 30 |
| Other | 541 |
2002 - 2018 National Fire Incident Reporting System (NFIRS) incidents
- Incident types reported to NFIRS in Addison, IL
- 13,09155.5%Rescue & EMS
- 2,95612.5%Hazardous Condition
- 2,83212.0%False Alarm
- 2,53910.8%Fire
- 1,2895.5%Good Intent Call
- 7713.3%Service Call
- 430.2%Overpressure Rupture
- 280.1%Special Incident
- Fire incident types reported to NFIRS in Addison, IL
- 1,04541.2%Structure Fires
- 91235.9%Outside Fires
- 47518.7%Mobile Property/Vehicle Fires
- 1074.2%Other
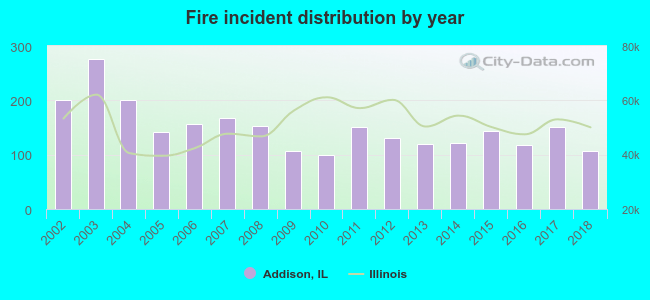 According to the data from the years 2002 - 2018 the average number of fires per year is 149. The highest number of reported fires - 276 took place in 2003, and the least - 99 in 2010. The data has a decreasing trend.
The average number of yearly fire incidents per 10k residents in Addison, IL compared to nearest cities:
(Note: Based on data for the last 3 years, including only cities with population 5,000 and above)
| Addison: | 33.4 |
| Wood Dale: | 30.6 |
| Itasca: | 53.8 |
| Villa Park: | 40.8 |
| Bensenville: | 55.9 |
| Lombard: | 27.0 |
| Glendale Heights: | 27.1 |
| Elmhurst: | 18.9 |
| Bloomingdale: | 34.5 |
 The median response time based on all reported fire incidents is 5 minutes. This is about the same as the Illinois median value.
The median response time in Addison, IL compared to nearest cities:
(Note: Based on data for all years, including only cities with at least 500 fire incidents)
| Addison: | 5 minutes |
| Wood Dale: | 5 minutes |
| Itasca: | 6 minutes |
| Villa Park: | 4 minutes |
| Bensenville: | 6 minutes |
| Lombard: | 5 minutes |
| Glendale Heights: | 5 minutes |
| Elmhurst: | 5 minutes |
| Bloomingdale: | 5 minutes |
 According to the data from the years 2002 - 2018 the average number of fire-related yearly deaths is 0. The highest number of reported deaths - 2 took place in 2018, and the lowest - 0 in 2003. The data has a rising trend.
The average number of deaths per 1,000 fire incidents is 2. This indicator was the highest - 19 in 2018, and the lowest 0 in 2003. The trend for fatalities per 1,000 fires is rising. Compared to the state value the number of fatalities per 1,000 incidents is lower.
According to the data from the years 2002 - 2018 the average number of fire-related yearly deaths is 0. The highest number of reported deaths - 2 took place in 2018, and the lowest - 0 in 2003. The data has a rising trend.
The average number of deaths per 1,000 fire incidents is 2. This indicator was the highest - 19 in 2018, and the lowest 0 in 2003. The trend for fatalities per 1,000 fires is rising. Compared to the state value the number of fatalities per 1,000 incidents is lower.
 According to the data from the years 2002 - 2018 the average number of fire-related casualties per year is 2. The highest number of injuries - 10 took place in 2007, and the lowest - 0 in 2016. The data has a dropping trend.
The average number of casualties per 1,000 fires is 15. This indicator was the highest - 60 in 2007, and the lowest 0 in 2016. The trend for casualties per 1,000 fires is declining. Compared to the state value the number of casualties per 1,000 fire incidents is higher.
According to the data from the years 2002 - 2018 the average number of fire-related casualties per year is 2. The highest number of injuries - 10 took place in 2007, and the lowest - 0 in 2016. The data has a dropping trend.
The average number of casualties per 1,000 fires is 15. This indicator was the highest - 60 in 2007, and the lowest 0 in 2016. The trend for casualties per 1,000 fires is declining. Compared to the state value the number of casualties per 1,000 fire incidents is higher.Casualties per 1,000 incidents in Addison, IL compared to nearest cities:
(Note: Based on data for all years, including only cities with at least 500 fire incidents)
| Addison: | 15.0 |
| Wood Dale: | 13.0 |
| Itasca: | 13.4 |
| Villa Park: | 25.6 |
| Bensenville: | 8.9 |
| Lombard: | 13.3 |
| Glendale Heights: | 20.1 |
| Elmhurst: | 9.7 |
| Bloomingdale: | 12.1 |
 27.6% incidents where reported in the morning and 72.4% in the evening. The most fires (14.9%) took place on Sunday, and the least (13.0%) on Tuesday.
 According to the 2,539 reports from years 2002 - 2018 most fires (11.1%) took place during July, and the least (6.0%) in January.
 Out of all 23,568 cases reported during the years 2002 - 2018, the most belonged to the categories: Rescue & EMS (55.5%), Hazardous Condition (12.5%), and False Alarm (12.0%).
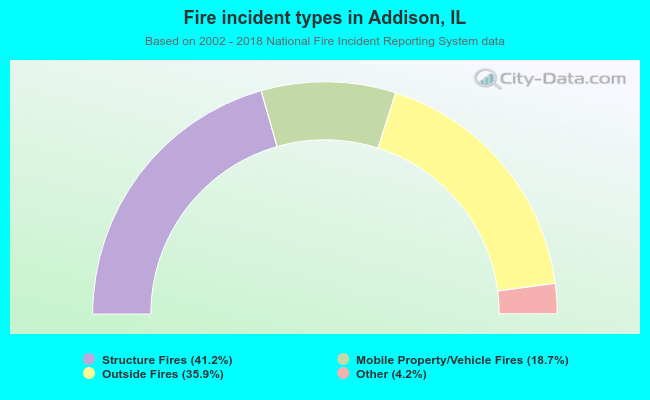 When looking into fire subcategories, the most reports belonged to: Structure Fires (41.2%), and Outside Fires (35.9%).