| Fire incidents reported |
|---|
| Sreet name | Count |
|---|
| 6675 SE PRESCHER RD. | 4 | | FF HWY | 4 | | MALDEN CREEK RD | 4 | | STATE ROAD E | 4 | | STATE ROUTE FF HWY | 4 | | 10000 SE 72 ND. RD. | 2 | | 10015 SE HWY FF | 2 | | 101 MILLER ST | 2 | | 10165 SE FF HWY | 2 | | 10280 SE ST. RT. FF | 2 | | 103 MAIN ST. | 2 | | 103 MILLER | 2 | | 103 MILLER ST. | 2 | | 103 SE 3RD ST | 2 | | 103 WEST 3 RD | 2 | | 10300 SE 105TH | 2 | | 104 WEST 3 RD. RD. | 2 | | 10400 SE 95 TH RD. | 2 | | 10424 SE ST. RT. E HWY. | 2 | | 10440 SE FF HWY. | 2 | | 10440 SE ST. RT. FF HWY. | 2 | | 10440 SE STATE RTE FF | 2 | | 10440 STATE RTE FF | 2 | | 10465 SE FF HWY. | 2 | | 105TH RD | 2 |
| | | Fire incidents reported |
|---|
| Sreet name | Count |
|---|
| 106 MAIN | 2 | | 106 MAIN ST | 2 | | 106 MAIN STREET | 2 | | 106 SE 3RD ST | 2 | | 10665 SE 72ND RD. | 2 | | 107 3RD ST | 2 | | 108 MILLER ST. | 2 | | 108 MILLERQ | 2 | | 10825 SE 72 ND RD | 2 | | 10825 SE 72 ND. RD. | 2 | | 10920 SE 72 ND RD. | 2 | | 11060 SE 72 ND RD. | 2 | | 11080 SE 72ND RD. | 2 | | 11150 E HWY | 2 | | 11301 SE FF HWY. | 2 | | 11305 A HIGHWAY | 2 | | 11410 SE 45 TH RD | 2 | | 11475 SE 95TH RD | 2 | | 11550 SE STATE RTE E | 2 | | 11613 SE 95TH RD | 2 | | 11880 SE STATE RTE E | 2 | | 12010 SE 45 TH RD. | 2 | | 12050 SE 45 TH RD. | 2 | | 12150 SE 45TH RD | 2 | | |
|
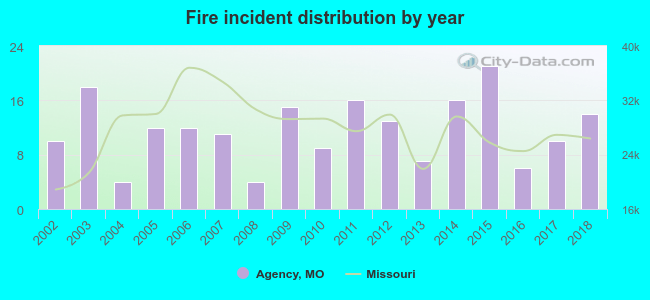 Based on the data from the years 2002 - 2018 the average number of fire incidents per year is 12. The highest number of fire incidents - 21 took place in 2015, and the least - 4 in 2004. The data has a growing trend.
 19.2% incidents where reported in the morning and 80.8% in the evening. The most fires (25.3%) took place on Saturday, and the least (9.6%) on Thursday.
 According to the 198 reports from years 2002 - 2018 most fires (20.2%) took place during March, and the least (1.0%) in May.
 Out of all 431 cases reported during the years 2002 - 2018, the most belonged to the categories: Fire (45.9%), Overpressure Rupture (42.0%), and Service Call (4.2%).
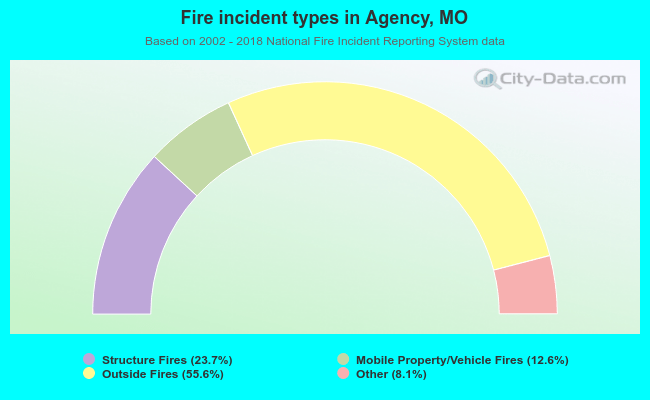 When looking into fire subcategories, the most incidents belonged to: Outside Fires (55.6%), and Structure Fires (23.7%).