Amherst: Fire Incidents, Ohio (OH)
Where are fire incidents reported in Amherst, OH
Something went wrong! Please refresh the page.
| Fire incidents reported | |
|---|---|
| Sreet name | Count |
| LEAVITT RD | 168 |
| MIDDLE RIDGE RD | 146 |
| COOPERFOSTER PARK RD | 80 |
| TELEGRAPH RD | 72 |
| OBERLIN RD | 68 |
| NORTH RIDGE RD | 54 |
| PARK AVE | 54 |
| BAUMHART RD | 46 |
| MILAN AVE | 44 |
| OHIO TURNPIKE | 44 |
| QUARRY RD | 42 |
| GIFFORD RD | 40 |
| CLEVELAND AVE | 38 |
| LAKE ST | 32 |
| JACKSON ST | 30 |
| LINCOLN ST | 30 |
| MAIN | 30 |
| TAYLOR ST | 28 |
| DEWEY RD | 26 |
| KRESGE DR | 26 |
| ST. RT. 113 HWY | 24 |
| CHURCH ST | 18 |
| OHIO TURNPIKE TPKE | 18 |
| PORTMAN RD | 18 |
| QUARRY | 18 |
| STATE ROUTE 2 | 18 |
| TENNEY AVE | 18 |
| DEEPWOOD LANE | 16 |
| MAIN ST | 16 |
| HIDDEN TREE LANE | 14 |
2003 - 2018 National Fire Incident Reporting System (NFIRS) incidents
- Incident types reported to NFIRS in Amherst, OH
- 1,68433.6%Rescue & EMS
- 1,21224.2%Fire
- 1,21124.1%Hazardous Condition
- 51010.2%False Alarm
- 1863.7%Service Call
- 1653.3%Good Intent Call
- 240.5%Severe Weather
- 140.3%Overpressure Rupture
- 90.2%Special Incident
- Fire incident types reported to NFIRS in Amherst, OH
- 50541.7%Structure Fires
- 45837.8%Outside Fires
- 21918.1%Mobile Property/Vehicle Fires
- 302.5%Other
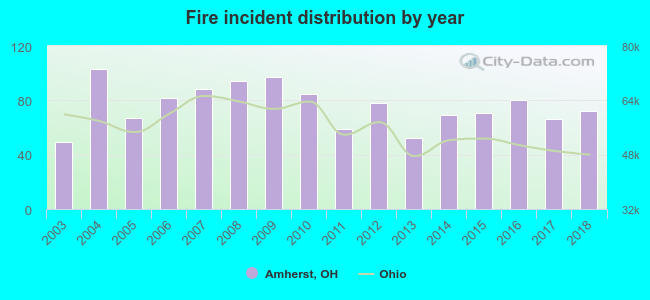 According to the data from the years 2003 - 2018 the average number of fire incidents per year is 76. The highest number of reported fire incidents - 103 took place in 2004, and the least - 49 in 2003. The data has a rising trend.
The average number of yearly fire incidents per 10k residents in Amherst, OH compared to nearest cities:
(Note: Based on data for the last 3 years, including only cities with population 5,000 and above)
| Amherst: | 59.8 |
| Lorain: | 54.4 |
| Vermilion: | 48.4 |
| Elyria: | 32.0 |
| Oberlin: | 58.6 |
| Sheffield Lake: | 48.2 |
| Avon: | 32.6 |
| North Ridgeville: | 19.5 |
| Grafton: | 85.6 |
 The median response time based on all reported fire incidents is 9 minutes. This is higher compared to the Ohio median value.
The median response time in Amherst, OH compared to nearest cities:
(Note: Based on data for all years, including only cities with at least 500 fire incidents)
| Amherst: | 9 minutes |
| Lorain: | 5 minutes |
| Vermilion: | 8 minutes |
| Elyria: | 5 minutes |
| Oberlin: | 6 minutes |
| Sheffield Lake: | 6 minutes |
| Avon: | 7 minutes |
| North Ridgeville: | 6 minutes |
| Grafton: | 10 minutes |
 According to the reports from the years 2003 - 2018 the average number of fire-related yearly deaths is 0. The highest number of reported deaths - 1 took place in 2004, and the lowest - 0 in 2003. The data has a constant trend.
 Based on the reports from the years 2003 - 2018 the average number of fire-related casualties per year is 1. The highest number of injuries - 2 took place in 2005, and the lowest - 0 in 2004. The data has an increasing trend.
The average number of injuries per 1,000 fire incidents is 9. This indicator was the highest - 30 in 2005, and the lowest 0 in 2004. The trend for injuries per 1,000 incidents is growing. Compared to the state value the number of casualties per 1,000 fire incidents is lower.
Based on the reports from the years 2003 - 2018 the average number of fire-related casualties per year is 1. The highest number of injuries - 2 took place in 2005, and the lowest - 0 in 2004. The data has an increasing trend.
The average number of injuries per 1,000 fire incidents is 9. This indicator was the highest - 30 in 2005, and the lowest 0 in 2004. The trend for injuries per 1,000 incidents is growing. Compared to the state value the number of casualties per 1,000 fire incidents is lower.Casualties per 1,000 incidents in Amherst, OH compared to nearest cities:
(Note: Based on data for all years, including only cities with at least 500 fire incidents)
| Amherst: | 8.3 |
| Lorain: | 20.8 |
| Vermilion: | 14.8 |
| Elyria: | 34.0 |
| Oberlin: | 18.5 |
| Sheffield Lake: | 22.5 |
| Avon: | 16.3 |
| North Ridgeville: | 11.0 |
| Grafton: | 1.2 |
 29.5% incidents where reported in the morning and 70.5% in the evening. The most fires (16.6%) took place on Sunday, and the least (12.8%) on Wednesday.
 Based on the 1,212 fire incident reports from years 2003 - 2018 most fires (10.9%) took place during July, and the least (4.8%) in February.
 Out of all 5,015 cases reported during the years 2003 - 2018, the most belonged to the categories: Rescue & EMS (33.6%), Fire (24.2%), and Hazardous Condition (24.1%).
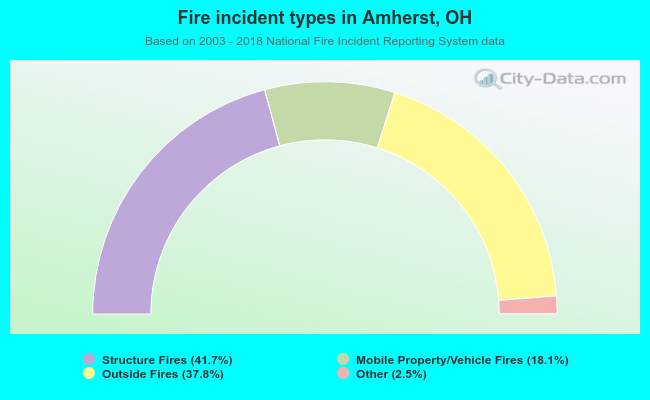 When looking into fire subcategories, the most reports belonged to: Structure Fires (41.7%), and Outside Fires (37.8%).