Anthony: Fire Incidents, Texas (TX)
Where are fire incidents reported in Anthony, TX
Something went wrong! Please refresh the page.
|
| |||||||||||||||||||||||||||||||||||||||||||||||||||||||||||||||||||||||||||||||||||||||||||||||||||||||||||||
2002 - 2018 National Fire Incident Reporting System (NFIRS) incidents
- Incident types reported to NFIRS in Anthony, TX
- 1,56061.9%Rescue & EMS
- 41216.3%Fire
- 2258.9%Hazardous Condition
- 1787.1%Good Intent Call
- 923.7%Service Call
- 502.0%False Alarm
- Fire incident types reported to NFIRS in Anthony, TX
- 19948.3%Outside Fires
- 9523.1%Structure Fires
- 7518.2%Mobile Property/Vehicle Fires
- 4310.4%Other
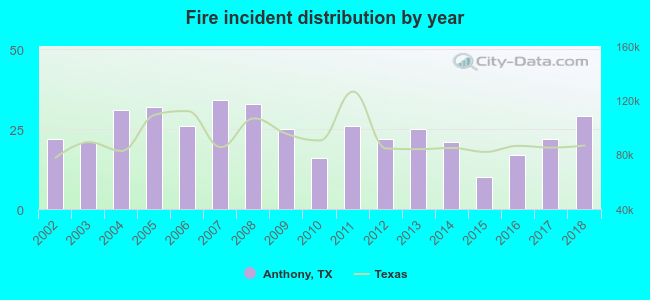 According to the data from the years 2002 - 2018 the average number of fire incidents per year is 24. The highest number of fires - 34 took place in 2007, and the least - 10 in 2015. The data has a rising trend.
The average number of yearly fire incidents per 10k residents in Anthony, TX compared to nearest cities:
(Note: Based on data for the last 3 years, including only cities with population 5,000 and above)
| Anthony: | 41.8 |
| Canutillo: | 61.2 |
| Fort Bliss: | 4.1 |
| El Paso: | 9.8 |
| Socorro: | 5.4 |
| Horizon City: | 35.9 |
| San Elizario: | 6.6 |
| Fabens: | 58.5 |

 26.2% incidents where reported in the morning and 73.8% in the evening. The most fires (17.7%) took place on Friday, and the least (11.7%) on Thursday.
 Based on the 412 reports from years 2002 - 2018 most fires (12.1%) took place during May, and the least (5.1%) in August.
 Out of all 2,520 cases reported during the years 2002 - 2018, the most belonged to the categories: Rescue & EMS (61.9%), Fire (16.3%), and Hazardous Condition (8.9%).
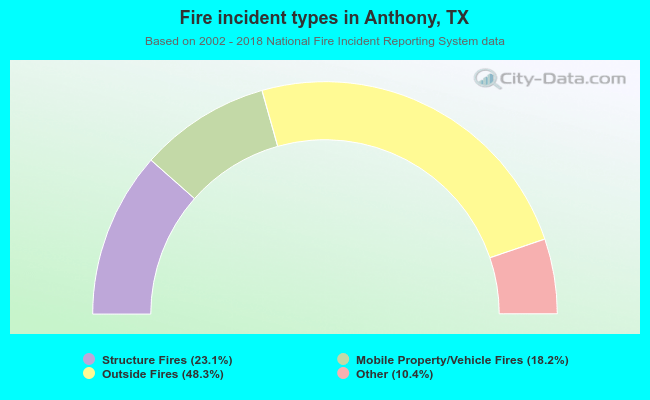 When looking into fire subcategories, the most reports belonged to: Outside Fires (48.3%), and Structure Fires (23.1%).