Ballico: Fire Incidents, California (CA)
Where are fire incidents reported in Ballico, CA
Something went wrong! Please refresh the page.
|
| |||||||||||||||||||||||||||||||||||||||||||||||||||||||||||||||||||||||||||||||||||||||||||||||||||||||||||||
2005 - 2018 National Fire Incident Reporting System (NFIRS) incidents
- Incident types reported to NFIRS in Ballico, CA
- 29143.4%Rescue & EMS
- 22934.2%Fire
- 578.5%Good Intent Call
- 416.1%Hazardous Condition
- 345.1%False Alarm
- 172.5%Service Call
- 10.1%Special Incident
- Fire incident types reported to NFIRS in Ballico, CA
- 10847.2%Outside Fires
- 8537.1%Mobile Property/Vehicle Fires
- 198.3%Structure Fires
- 177.4%Other
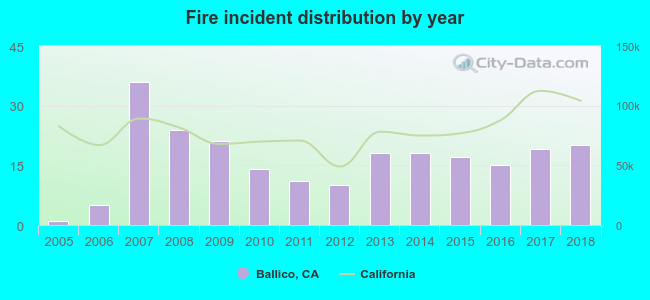 According to the data from the years 2005 - 2018 the average number of fire incidents per year is 16. The highest number of fire incidents - 36 took place in 2007, and the least - 1 in 2005. The data has a rising trend.
 42.4% incidents where reported in the morning and 57.6% in the evening. The most fires (17.9%) took place on Tuesday, and the least (10.0%) on Thursday.
 Based on the 229 reports from years 2005 - 2018 most fires (14.0%) took place during July, and the least (4.4%) in January.
 Out of all 670 cases reported during the years 2005 - 2018, the most belonged to the categories: Overpressure Rupture (43.4%), Fire (34.2%), and Service Call (8.5%).
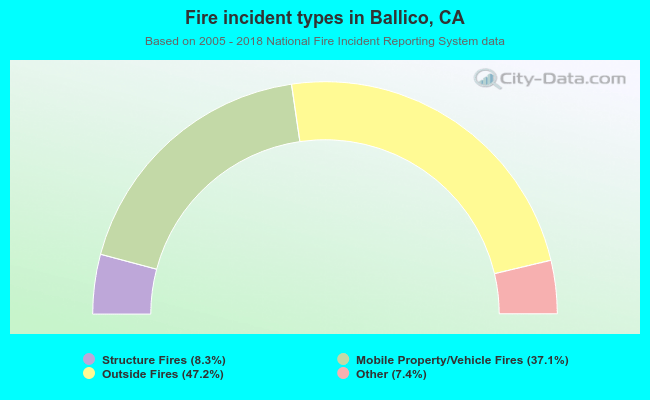 When looking into fire subcategories, the most reports belonged to: Outside Fires (47.2%), and Mobile Property/Vehicle Fires (37.1%).