Bothell: Fire Incidents, Washington (WA)
Where are fire incidents reported in Bothell, WA
Something went wrong! Please refresh the page.
| Fire incidents reported | |
|---|---|
| Sreet name | Count |
| BOTHELL-EVERETT HWY | 204 |
| 228TH ST | 142 |
| SR 527 | 104 |
| WOODINVILLE DR | 102 |
| BOTHELL WAY | 98 |
| BOTHELLEVERETT HWY | 90 |
| NB 405 | 90 |
| RIVERSIDE DR | 76 |
| SB 405 | 74 |
| 185TH ST | 68 |
| BOTHELL EVERETT HWY | 66 |
| BEARDSLEE BLVD | 60 |
| 100TH AVE | 56 |
| 180TH ST | 56 |
| LOCUST WAY | 54 |
| 9TH AVE | 52 |
| MERIDIAN AVE | 50 |
| 4TH AVE | 48 |
| 112TH AVE | 46 |
| 190TH ST | 46 |
| 120TH AVE | 36 |
| 188TH ST | 34 |
| MALTBY RD | 34 |
| 220TH ST | 32 |
| 3RD AVE | 32 |
| 15TH AVE | 30 |
| 2ND AVE | 30 |
| FILBERT RD | 30 |
| 195TH ST | 28 |
| 20TH AVE | 28 |
| Other | 597 |
2002 - 2018 National Fire Incident Reporting System (NFIRS) incidents
- Incident types reported to NFIRS in Bothell, WA
- 27,67371.7%Rescue & EMS
- 2,9557.7%Good Intent Call
- 2,5256.5%False Alarm
- 2,4936.5%Fire
- 1,3963.6%Service Call
- 1,2033.1%Hazardous Condition
- 3000.8%Special Incident
- 610.2%Overpressure Rupture
- Fire incident types reported to NFIRS in Bothell, WA
- 1,07243.0%Structure Fires
- 71528.7%Outside Fires
- 36014.4%Mobile Property/Vehicle Fires
- 34613.9%Other
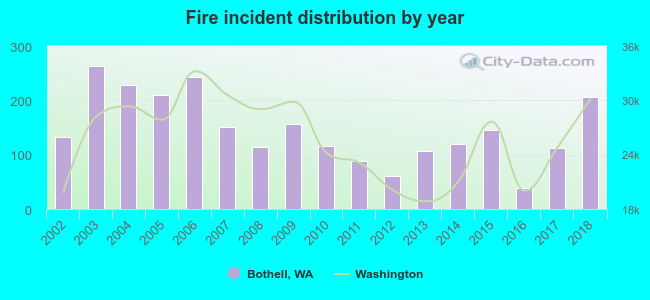 Based on the data from the years 2002 - 2018 the average number of fires per year is 147. The highest number of reported fires - 264 took place in 2003, and the least - 38 in 2016. The data has a growing trend.
The average number of yearly fire incidents per 10k residents in Bothell, WA compared to nearest cities:
(Note: Based on data for the last 3 years, including only cities with population 5,000 and above)
| Bothell: | 32.5 |
| Kenmore: | 14.5 |
| Woodinville: | 16.1 |
| Brier: | 10.4 |
| Lake Forest Park: | 12.6 |
| Mountlake Terrace: | 14.9 |
| Kirkland: | 6.4 |
| Lynnwood: | 56.1 |
| Mill Creek: | 10.8 |
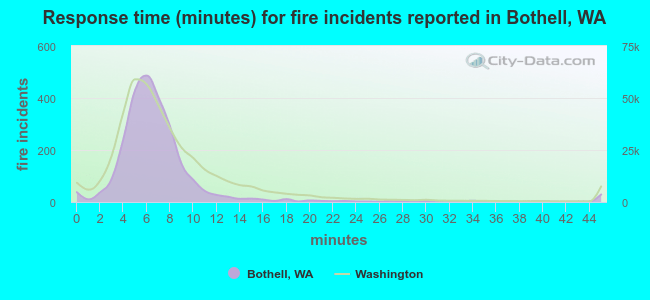 The median response time based on all reported fire incidents is 6 minutes. This is comparable to the Washington median value.
The median response time in Bothell, WA compared to nearest cities:
(Note: Based on data for all years, including only cities with at least 500 fire incidents)
| Bothell: | 6 minutes |
| Kenmore: | 6 minutes |
| Woodinville: | 7 minutes |
| Mountlake Terrace: | 7 minutes |
| Kirkland: | 6 minutes |
| Lynnwood: | 7 minutes |
| Shoreline: | 7 minutes |
| Edmonds: | 7 minutes |
| Redmond: | 6 minutes |
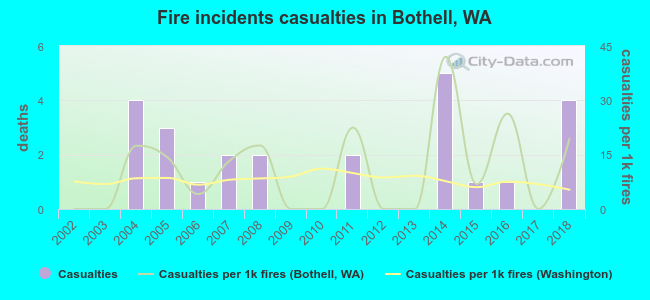 Based on the data from the years 2002 - 2018 the average number of fire-related casualties per year is 1. The highest number of reported injuries - 5 took place in 2014, and the lowest - 0 in 2002. The data has an increasing trend.
The average number of injuries per 1,000 fire incidents is 11. This indicator was the highest - 42 in 2014, and the lowest 0 in 2002. The trend for injuries per 1,000 fire incidents is increasing. Compared to the state value the number of casualties per 1,000 incidents is higher.
Based on the data from the years 2002 - 2018 the average number of fire-related casualties per year is 1. The highest number of reported injuries - 5 took place in 2014, and the lowest - 0 in 2002. The data has an increasing trend.
The average number of injuries per 1,000 fire incidents is 11. This indicator was the highest - 42 in 2014, and the lowest 0 in 2002. The trend for injuries per 1,000 fire incidents is increasing. Compared to the state value the number of casualties per 1,000 incidents is higher.Casualties per 1,000 incidents in Bothell, WA compared to nearest cities:
(Note: Based on data for all years, including only cities with at least 500 fire incidents)
| Bothell: | 10.0 |
| Kenmore: | 7.4 |
| Woodinville: | 3.3 |
| Mountlake Terrace: | 13.9 |
| Kirkland: | 2.5 |
| Lynnwood: | 7.8 |
| Shoreline: | 19.2 |
| Edmonds: | 13.1 |
| Redmond: | 7.6 |
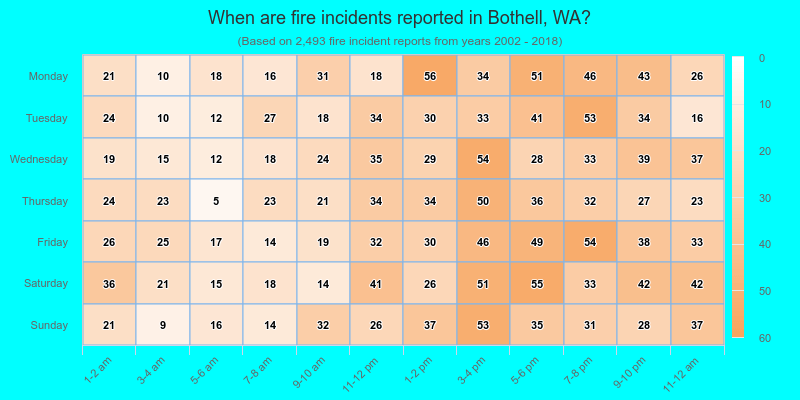
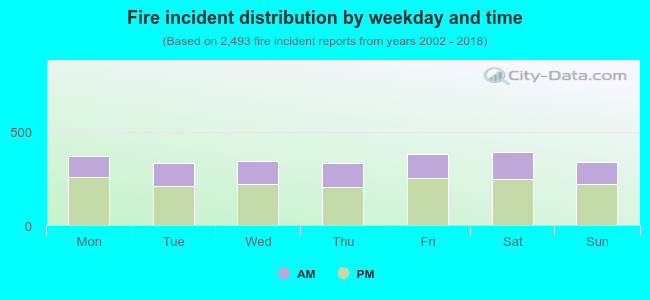 35.6% incidents where reported in the morning and 64.4% in the evening. The most fires (15.8%) took place on Saturday, and the least (13.3%) on Tuesday.
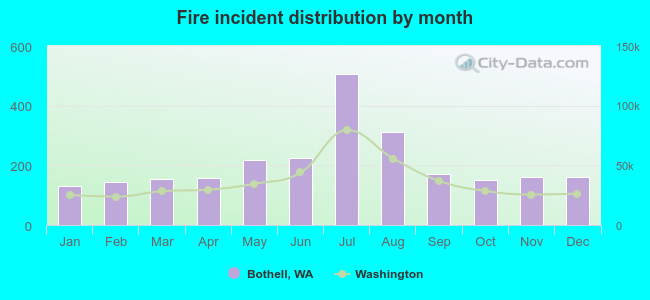 According to the 2,493 fire incidents from years 2002 - 2018 most fires (20.3%) took place during July, and the least (5.3%) in January.
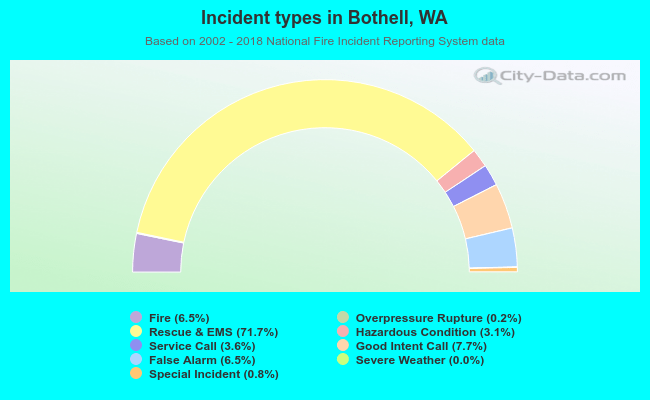 Out of all 38,621 cases reported during the years 2002 - 2018, the most belonged to the categories: Rescue & EMS (71.7%), Good Intent Call (7.7%), and False Alarm (6.5%).
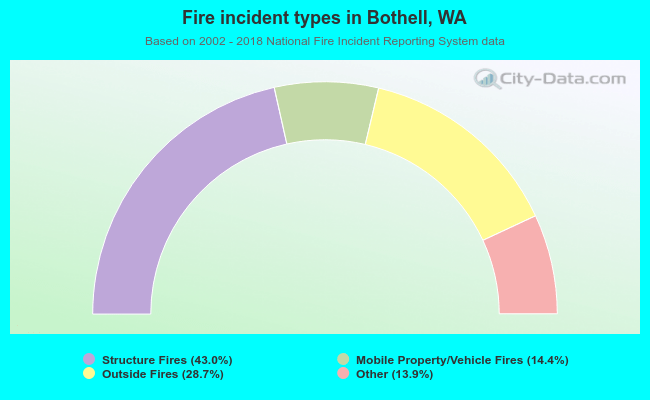 When looking into fire subcategories, the most incidents belonged to: Structure Fires (43.0%), and Outside Fires (28.7%).