Brinkley: Fire Incidents, Arkansas (AR)
Where are fire incidents reported in Brinkley, AR
Something went wrong! Please refresh the page.
|
| |||||||||||||||||||||||||||||||||||||||||||||||||||||||||||||||||||||||||||||||||||||||||||||||||||||||||||||
2003 - 2018 National Fire Incident Reporting System (NFIRS) incidents
- Incident types reported to NFIRS in Brinkley, AR
- 1,08879.3%Fire
- 15111.0%Good Intent Call
- 584.2%False Alarm
- 433.1%Hazardous Condition
- 221.6%Rescue & EMS
- 100.7%Service Call
- Fire incident types reported to NFIRS in Brinkley, AR
- 59354.5%Outside Fires
- 29727.3%Structure Fires
- 18917.4%Mobile Property/Vehicle Fires
- 90.8%Other
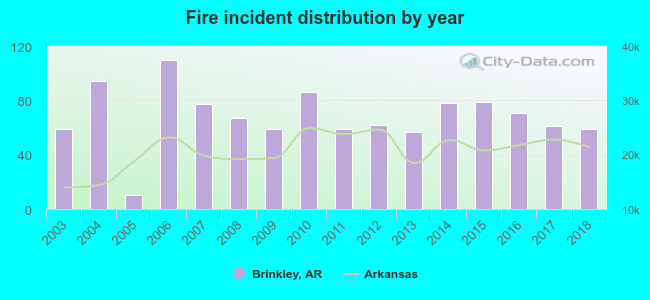 Based on the data from the years 2003 - 2018 the average number of fire incidents per year is 68. The highest number of fires - 110 took place in 2006, and the least - 10 in 2005. The data has a constant trend.
 The median response time based on all reported fire incidents is 6 minutes. This is similar to the state median value.
The median response time in Brinkley, AR compared to nearest cities:
(Note: Based on data for all years, including only cities with at least 500 fire incidents)
| Brinkley: | 6 minutes |
| Forrest City: | 4 minutes |
| Marianna: | 5 minutes |
| Augusta: | 5 minutes |
| Wynne: | 4 minutes |
| Stuttgart: | 4 minutes |
| Bald Knob: | 8 minutes |
| McRae: | 8 minutes |
| West Helena: | 3 minutes |
 26.1% incidents where reported in the morning and 73.9% in the evening. The most fires (16.2%) took place on Sunday, and the least (13.2%) on Thursday.
 According to the 1,088 reports from years 2003 - 2018 most fires (9.7%) took place during January, and the least (5.1%) in May.
 Out of all 1,372 cases reported during the years 2003 - 2018, the most belonged to the categories: Fire (79.3%), Service Call (11.0%), and Good Intent Call (4.2%).
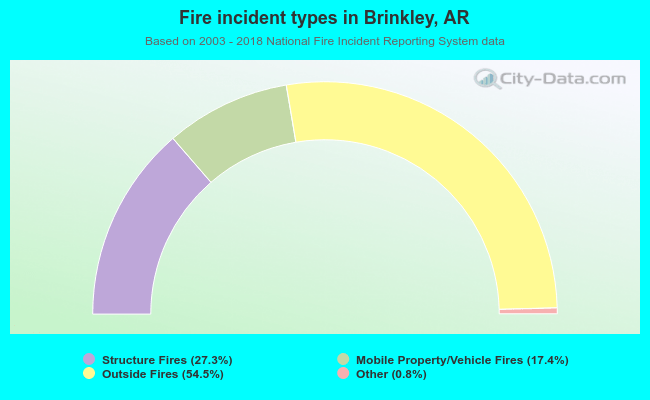 When looking into fire subcategories, the most reports belonged to: Outside Fires (54.5%), and Structure Fires (27.3%).