Buffalo: Fire Incidents, Texas (TX)
Where are fire incidents reported in Buffalo, TX
Something went wrong! Please refresh the page.
|
| |||||||||||||||||||||||||||||||||||||||||||||||||||||||||||||||||||||||||||||||||||||||||||||||||||||||||||||
| Other | 241 | |||||||||||||||||||||||||||||||||||||||||||||||||||||||||||||||||||||||||||||||||||||||||||||||||||||||||||||
2002 - 2018 National Fire Incident Reporting System (NFIRS) incidents
- Incident types reported to NFIRS in Buffalo, TX
- 46348.3%Fire
- 21021.9%Rescue & EMS
- 13213.8%Hazardous Condition
- 959.9%Good Intent Call
- 384.0%Service Call
- 90.9%False Alarm
- 70.7%Special Incident
- 40.4%Overpressure Rupture
- 10.1%Severe Weather
- Fire incident types reported to NFIRS in Buffalo, TX
- 21847.1%Outside Fires
- 10021.6%Structure Fires
- 7516.2%Other
- 7015.1%Mobile Property/Vehicle Fires
 According to the data from the years 2002 - 2018 the average number of fires per year is 27. The highest number of reported fires - 57 took place in 2003, and the least - 9 in 2008. The data has a declining trend.
 According to the reports from the years 2002 - 2018 the average number of fire-related fatalities per year is 0. The highest number of deaths - 1 took place in 2008, and the lowest - 0 in 2002. The data has a constant trend.
 32.6% incidents where reported in the morning and 67.4% in the evening. The most fires (17.5%) took place on Monday, and the least (11.4%) on Tuesday.
 According to the 463 incident reports from years 2002 - 2018 most fires (11.7%) took place during January, and the least (3.9%) in April.
 Out of all 959 cases reported during the years 2002 - 2018, the most belonged to the categories: Fire (48.3%), Rescue & EMS (21.9%), and Hazardous Condition (13.8%).
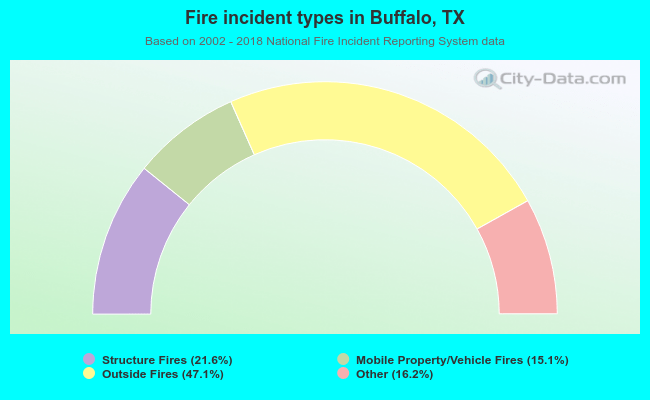 When looking into fire subcategories, the most incidents belonged to: Outside Fires (47.1%), and Structure Fires (21.6%).