Burlington: Fire Incidents, Washington (WA)
Where are fire incidents reported in Burlington, WA
Something went wrong! Please refresh the page.
| Fire incidents reported | |
|---|---|
| Sreet name | Count |
| BURLINGTON BLVD | 230 |
| FAIRHAVEN AVE | 66 |
| NORRIS ST | 52 |
| INST 5 NB | 50 |
| PETERSON RD | 48 |
| GARDNER RD | 46 |
| SKAGIT ST | 46 |
| WHITMARSH RD | 38 |
| COOK RD | 36 |
| MARKETPLACE DR | 36 |
| CASCADE MALL DR | 34 |
| KELLEHER RD | 34 |
| PETERSON PL | 34 |
| ANACORTES ST | 30 |
| GILKEY RD | 30 |
| HERITAGE PL | 30 |
| PULVER RD | 30 |
| STATE ROUTE 20 | 30 |
| LAFAYETTE RD | 28 |
| RIO VISTA AVE | 28 |
| INST 5 SB | 24 |
| GREEN RD | 22 |
| HAGGEN DR | 22 |
| PETER ANDERSON RD | 22 |
| WASHINGTON AVE | 22 |
| BOW HILL RD | 20 |
| CASCADE PL | 20 |
| DARRK LN | 20 |
| SANCHEZ LN | 20 |
| HULBUSH LN | 18 |
| Other | 27 |
2003 - 2018 National Fire Incident Reporting System (NFIRS) incidents
- Incident types reported to NFIRS in Burlington, WA
- 5,01261.4%Rescue & EMS
- 1,19314.6%Fire
- 7959.7%Hazardous Condition
- 4545.6%Good Intent Call
- 3324.1%False Alarm
- 2883.5%Service Call
- 861.1%Special Incident
- Fire incident types reported to NFIRS in Burlington, WA
- 45538.1%Structure Fires
- 37431.3%Outside Fires
- 28123.6%Mobile Property/Vehicle Fires
- 837.0%Other
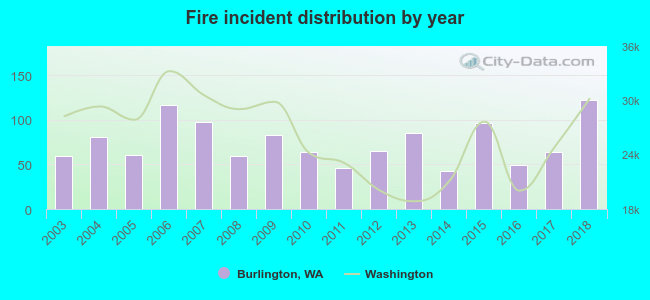 According to the data from the years 2003 - 2018 the average number of fires per year is 75. The highest number of fires - 122 took place in 2018, and the least - 43 in 2014. The data has an increasing trend.
The average number of yearly fire incidents per 10k residents in Burlington, WA compared to nearest cities:
(Note: Based on data for the last 3 years, including only cities with population 5,000 and above)
| Burlington: | 91.4 |
| Mount Vernon: | 19.3 |
| Bow: | 14.2 |
| Anacortes: | 66.5 |
| Stanwood: | 41.5 |
| Sudden Valley: | 1.6 |
| Oak Harbor: | 43.0 |
| Bellingham: | 23.1 |
| Arlington: | 79.4 |
 The median response time based on all reported fire incidents is 6 minutes. This is comparable to the state median value.
The median response time in Burlington, WA compared to nearest cities:
(Note: Based on data for all years, including only cities with at least 500 fire incidents)
| Burlington: | 6 minutes |
| Mount Vernon: | 7 minutes |
| Anacortes: | 7 minutes |
| Stanwood: | 8 minutes |
| Oak Harbor: | 5 minutes |
| Bellingham: | 7 minutes |
| Arlington: | 8 minutes |
| Ferndale: | 9 minutes |
| Marysville: | 7 minutes |
 28.8% incidents where reported in the morning and 71.2% in the evening. The most fires (15.8%) took place on Monday, and the least (12.7%) on Friday.
 Based on the 1,193 fires from years 2003 - 2018 most fires (18.6%) took place during July, and the least (3.9%) in November.
 Out of all 8,169 cases reported during the years 2003 - 2018, the most belonged to the categories: Rescue & EMS (61.4%), Fire (14.6%), and Hazardous Condition (9.7%).
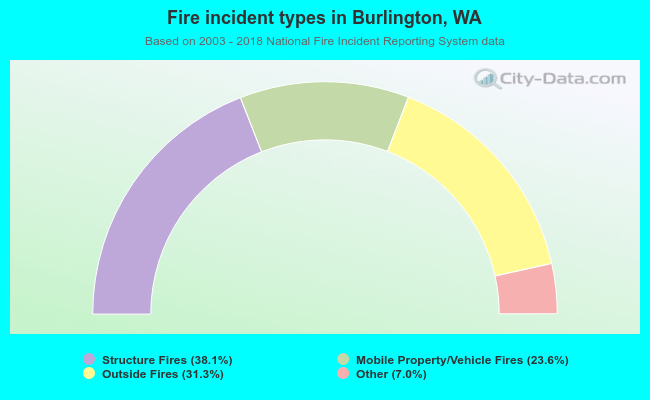 When looking into fire subcategories, the most reports belonged to: Structure Fires (38.1%), and Outside Fires (31.3%).