Calumet City: Fire Incidents, Illinois (IL)
Where are fire incidents reported in Calumet City, IL
Something went wrong! Please refresh the page.
| Fire incidents reported | |
|---|---|
| Sreet name | Count |
| RING RD | 296 |
| SIBLEY BLVD | 226 |
| STATE ST | 206 |
| RIVER OAKS DR | 200 |
| GINGER LN | 164 |
| WILSON AVE | 164 |
| WENTWORTH AVE | 150 |
| MEMORIAL DR | 134 |
| BURNHAM AVE | 130 |
| JEFFERY AVE | 126 |
| PAXTON AVE | 104 |
| TORRENCE AVE | 104 |
| PULASKI RD | 88 |
| BUFFALO AVE | 86 |
| GREENBAY AVE | 86 |
| YATES AVE | 86 |
| 155TH PL | 82 |
| OGLESBY AVE | 80 |
| MICHIGAN CITY RD | 76 |
| HIRSCH AVE | 74 |
| MADISON AVE | 74 |
| LUELLA AVE | 72 |
| 155TH ST | 70 |
| 156TH PL | 70 |
| 156TH ST | 70 |
| 157TH ST | 68 |
| CLYDE AVE | 66 |
| MACKINAW AVE | 66 |
| MERRILL AVE | 64 |
| 154TH PL | 62 |
2002 - 2018 National Fire Incident Reporting System (NFIRS) incidents
- Incident types reported to NFIRS in Calumet City, IL
- 20,81358.5%Rescue & EMS
- 5,17814.6%False Alarm
- 3,3699.5%Hazardous Condition
- 3,1488.9%Fire
- 1,9315.4%Service Call
- 1,0613.0%Good Intent Call
- Fire incident types reported to NFIRS in Calumet City, IL
- 1,64352.2%Structure Fires
- 86227.4%Outside Fires
- 54817.4%Mobile Property/Vehicle Fires
- 953.0%Other
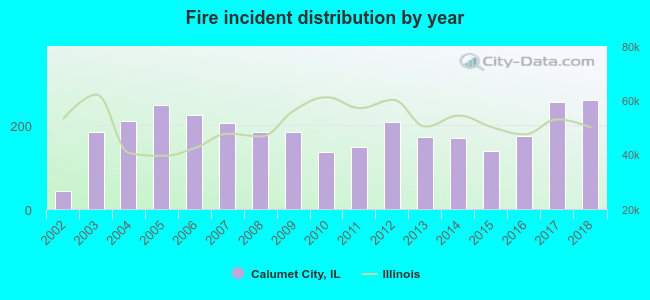 Based on the data from the years 2002 - 2018 the average number of fires per year is 185. The highest number of fires - 260 took place in 2018, and the least - 44 in 2002. The data has a growing trend.
The average number of yearly fire incidents per 10k residents in Calumet City, IL compared to nearest cities:
(Note: Based on data for the last 3 years, including only cities with population 5,000 and above)
| Calumet City: | 61.8 |
| Dolton: | 97.7 |
| South Holland: | 57.7 |
| Lansing: | 37.2 |
| Riverdale: | 97.3 |
| Harvey: | 134.0 |
| Glenwood: | 46.1 |
| Lynwood: | 23.3 |
| Calumet Park: | 124.0 |
 The median response time based on all reported fire incidents is 5 minutes. This is comparable to the state median value.
The median response time in Calumet City, IL compared to nearest cities:
(Note: Based on data for all years, including only cities with at least 500 fire incidents)
| Calumet City: | 5 minutes |
| Burnham: | 7 minutes |
| Dolton: | 5 minutes |
| South Holland: | 5 minutes |
| Lansing: | 3 minutes |
| Riverdale: | 5 minutes |
| Harvey: | 3 minutes |
| Glenwood: | 5 minutes |
| Calumet Park: | 5 minutes |
 According to the reports from the years 2002 - 2018 the average number of fire-related fatalities per year is 0. The highest number of deaths - 2 took place in 2006, and the lowest - 0 in 2002. The data has a constant trend.
The average number of fatalities per 1,000 fire incidents is 2. This indicator was the highest - 9 in 2006, and the lowest 0 in 2002. The trend for fatalities per 1,000 fire incidents is constant. Compared to the state value the number of deaths per 1,000 fires is higher.
According to the reports from the years 2002 - 2018 the average number of fire-related fatalities per year is 0. The highest number of deaths - 2 took place in 2006, and the lowest - 0 in 2002. The data has a constant trend.
The average number of fatalities per 1,000 fire incidents is 2. This indicator was the highest - 9 in 2006, and the lowest 0 in 2002. The trend for fatalities per 1,000 fire incidents is constant. Compared to the state value the number of deaths per 1,000 fires is higher.
 Based on the data from the years 2002 - 2018 the average number of fire-related yearly casualties is 1. The highest number of reported casualties - 6 took place in 2014, and the lowest - 0 in 2002. The data has a growing trend.
The average number of injuries per 1,000 fires is 7. This indicator was the highest - 36 in 2014, and the lowest 0 in 2002. The trend for casualties per 1,000 incidents is increasing. Compared to the Illinois value the number of casualties per 1,000 incidents is lower.
Based on the data from the years 2002 - 2018 the average number of fire-related yearly casualties is 1. The highest number of reported casualties - 6 took place in 2014, and the lowest - 0 in 2002. The data has a growing trend.
The average number of injuries per 1,000 fires is 7. This indicator was the highest - 36 in 2014, and the lowest 0 in 2002. The trend for casualties per 1,000 incidents is increasing. Compared to the Illinois value the number of casualties per 1,000 incidents is lower.Casualties per 1,000 incidents in Calumet City, IL compared to nearest cities:
(Note: Based on data for all years, including only cities with at least 500 fire incidents)
| Calumet City: | 6.7 |
| Burnham: | 5.9 |
| Dolton: | 8.3 |
| South Holland: | 22.0 |
| Lansing: | 9.6 |
| Riverdale: | 8.6 |
| Harvey: | 10.1 |
| Glenwood: | 3.1 |
| Calumet Park: | 1.0 |
 36.3% incidents where reported in the morning and 63.7% in the evening. The most fires (17.4%) took place on Saturday, and the least (12.4%) on Wednesday.
 Based on the 3,148 reports from years 2002 - 2018 most fires (12.0%) took place during July, and the least (5.3%) in January.
 Out of all 35,559 cases reported during the years 2002 - 2018, the most belonged to the categories: Rescue & EMS (58.5%), False Alarm (14.6%), and Hazardous Condition (9.5%).
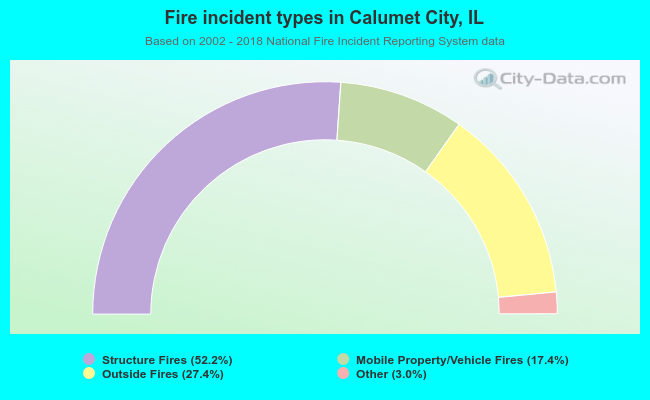 When looking into fire subcategories, the most reports belonged to: Structure Fires (52.2%), and Outside Fires (27.4%).